Article

Research on the Influence of Loading Frequency on the Dynamic Response of Concrete Sleepers

1
School of Civil Engineering, Central South University, Changsha 410075, China
2
Key Laboratory of Heavy-Duty Railway Engineering Structure of Ministry of Education, Changsha 410075, China
3
Infrastructure Inspection Research Institute, China Academy of Railway Sciences, Beijing 100081, China
4
Chawu Engineering Section, Daqin Railway Co., Ltd., Beijing 101400, China
*
Author to whom correspondence should be addressed.
Appl. Sci. 2022, 12(14), 7245; https://doi.org/10.3390/app12147245
Submission received: 11 April 2022 / Revised: 29 May 2022 / Accepted: 30 May 2022 / Published: 19 July 2022

Abstract

:
The load generated during train operation is transmitted to sleepers through rails, and then from sleepers to trackbeds. As one of the important components of the track structure, sleepers are very important to the service-life and safety of railways. The running speed of the train will produce different load frequencies on the rails. To explore the response of sleepers under cyclical train loads, this research used the discrete element method to simulate rails and sleepers, and realizes the loading of sleepers by applying cyclic loads to the rails. The discrete element method was used to simulate the compression-failure test of the concrete sample to verify the reliability of parameters of the discrete element model. On this basis, the sleeper was simulated by the discrete element, and the change law of the mechanical parameters such as particle displacement, contact force, and stress of the sleeper under different loading frequencies were analyzed. The research results show that the sleeper particles under the rail had a large vertical displacement, and the maximum displacement and the maximum contact force of the particles in the sleeper increased with increasing loading frequency. The stress change trend of the sleeper under the left and right rails was the same, and both showed periodic changes with cyclic loading. The loading frequency had little effect on the stress of the sleeper. The vertical displacement, velocity, and acceleration amplitude of the rail all increased with increasing cyclic loading frequency, thereby increasing the force between the rail and the sleeper, and increasing the dynamic response of the sleeper.

1. Introduction

During the operation of a train, the force between the wheels and rails is transmitted downward along the track structure, and from the steel rail to the sleeper. When the dynamic response between the wheel and rail increases or when the rail is damaged, the load transferred to the sleeper increases. Heavy-duty railways are mainly ballasted track structures. Under the action of periodic train loads, the ballasted trackbed will settle. Since the ballast bed belongs to the granular body, the ballast bed has uneven settlement, which will cause the sleeper to exhibit an empty hanging phenomenon, thereby increasing the interaction between the wheel and rail, and increasing the force applied on the sleeper [1,2,3]. When the loading force load exceeds its bearing capacity, high stress appears inside the sleeper, and then cracks appear. Under long-term dynamic action, the cracks gradually expand until they penetrates the entire sleeper, eventually leading to loss of its bearing capacity, as shown in Figure 1.
As a component of the track structure, sleepers have been studied extensively. Yan [4] conducted on-site tests and simulations of the slab trackbed of a heavy-duty railway wide sleeper and analyzed the influence of the trackbed slab on the mechanical properties of the wide sleeper at the macro and micro levels, Du [5] analyzed the stress and crack propagation of prestressed concrete sleepers and composite sleepers by using digital image technology, Cui et al. [6] established a sleeper model with the finite difference method and compared and discussed the mechanical properties of elastic sleepers and ordinary sleepers, Guo et al. [7] took the Sichuan–Tibet Railway as the research object to explore the influence of friction sleepers on the lateral resistance of the trackbed, Farnam et al. [8] used the finite element method to simulate concrete sleepers to explore the crack propagation of sleepers under three-point bending loads, Jokubaitis et al. [9] studied the strain state and damage of prestressed concrete sleepers under dynamic and static loads, Tran et al. [10] used the finite element method to simulate the sleeper and study its response on a heterogeneous basis, and Van [11] used the finite element method to establish the sleeper model and analyzed the influence of the bending and shear stiffness of the sleeper on the track stiffness. To study the influence of different wear depths on prestressed concrete sleepers, You et al. [12] established a finite element model of the sleeper to facilitate subsequent research and analysis. Silva et al. [13] used ABAQUS finite element software to carry out numerical simulation and analysis on the bearing capacity of prestressed concrete sleepers. Chen et al. [14] simulated the ballast bed with the finite element method and explored the effects of traditional concrete sleepers and new X-shaped sleepers on the settlement, lateral displacement, and dynamic characteristics of the ballast bed. Fang et al. [15] used a finite element to simulate the rail, under-rail cushion, sleeper, and ballast bed, established a three-dimensional solid finite element model, and studied the influence of rail structure parameters such as sleeper mass and loss factor, ballast bed stiffness, and damping on the vibration performance of the sleeper.
In the literature, the simulation of concrete sleepers commonly relies on the finite element method or the finite difference method, both of which treat the sleeper as a continuum; however, concrete sleepers are made of a mixture of coarse and fine aggregates, cement, minerals, etc. From a microscopic point of view, concrete is composed of fine particles. In essence, the load transfer and crack damage in concrete depend on the interaction between the internal particles. Therefore, the discrete element method can analyze the micromechanical properties of sleepers. It has reference value to fundamentally solve the practical problems of concrete.
To explore the interaction between the internal particles of the sleeper under different loading frequencies, the fine circular particles were regularly arranged according to the geometric shape of the sleeper, and the contact bonding properties were applied to the internal particles to form a whole. The model parameters were determined by the compression test simulation of concrete samples, and on this basis, the two-dimensional rail-sleeper interaction under loading frequencies of 5 Hz, 10 Hz, 20 Hz, and 50 Hz was simulated to explore the dynamic response of the sleeper caused by different loading frequencies.

2. Selection of Model Parameters and Establishment of the Model

2.1. Selection of Physical and Mechanical Parameters

This study took concrete type III sleepers as the research object. According to the specification [16,17,18,19], the strength grade of concrete type III sleepers should not be lower than C60, and the elastic modulus of the concrete is 3.60 × 10⁴ MPa. To verify the accuracy of the parameters of the discrete element model, a discrete element sample with a size of 150 mm × 150 mm was established. The sample was composed of small-sized circular particles through contact bonding to form a whole. After the compression test simulation of the sample, the stress–strain curve of the compression sample was obtained to verify the reliability of the two-dimensional model parameters. The final selected discrete element parameters are shown in Table 1.

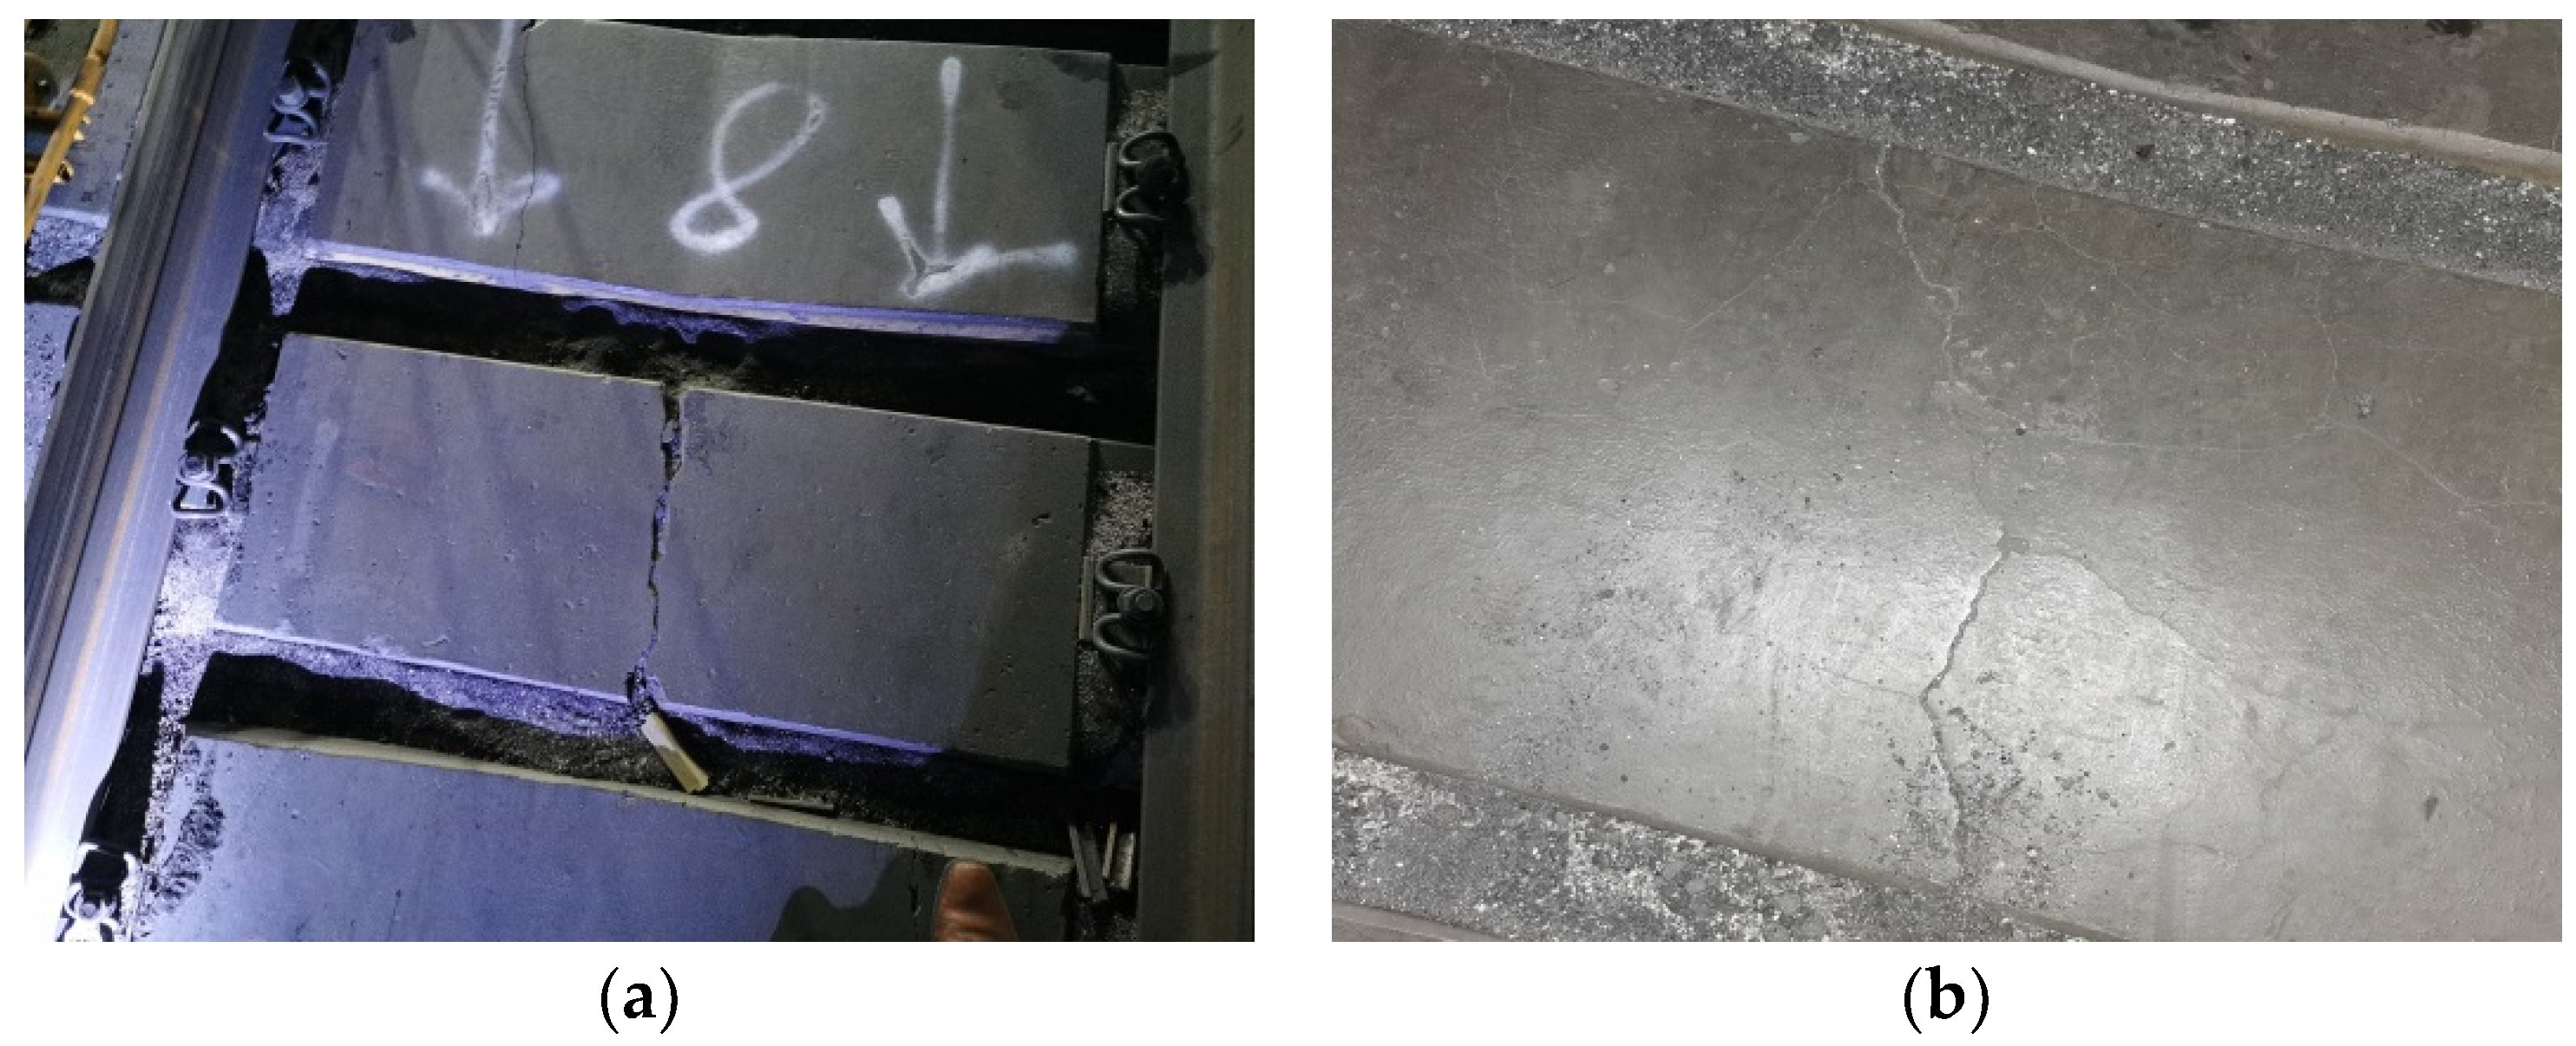
2.2. Validation of Model Parameters

In this study, the small-sized particles were arranged neatly in a hexagonal manner to construct concrete samples, and the model parameters were verified by compressing the samples and analyzing their mechanical properties after compression. Generally, the smaller the particle size in the model, the more accurate is the model, but the number of particles added in the system will also increase, which increases the calculation time of the computer. The larger the particle size, the fewer particles are added to the sample of the same size, which can reduce the calculation time of the computer and reduce the accuracy of the model. To achieve a balance between accuracy and efficiency, the particle sizes of the test blocks were constructed with particles of 1 mm and 5 mm in size. The initial models of concrete samples established with the two particle sizes are shown in Figure 2. In order to make the figure clearer, Figure 2 uses the position cloud map of the particles to represent the initial model of the sample.
In the discrete element model of concrete specimens, walls were added to the top and bottom of the specimen block. The bottom wall was used to constrain the specimen and prevent the specimen from moving downward; the top wall was used for loading purposes. The stress–strain curve of the concrete specimen after vertical compression is shown in Figure 3.
Figure 3 shows the stress–strain curves of concrete specimens composed of two different particle sizes after compression. From Figure 3, it can be concluded that the compressive strength of the sample composed of 1 mm particle size was 69.588 MPa, and the compressive strength of the sample composed of 5 mm particle size was 69.168 MPa, which meets the requirements of the specification [16], and is consistent with the compressive strength (70 MPa) of concrete in the literature [20]. In the initial stage of strain, the stress in the concrete block increased with increasing strain; when the compressive strength was reached, the stress of the sample decreased sharply with increasing strain until the concrete block was crushed. Therefore, the results demonstrate the feasibility of the parameters of the two-dimensional discrete element model selected in this paper.
To further analyze the samples constructed with the two particle sizes, the nephograms of the contact force chain distribution after the compression of the two samples were recorded, and the recorded results are shown in Figure 4.
Figure 4 shows that the contact force distribution after compression of concrete samples was similar between the two particle sizes; a large contact force was generated near the vertical neutral axis of the sample and vertical cracks appeared in this area. A large contact force chain also appeared along the diagonal of the sample, and its distribution law was in the shape of ‘X’, corresponding to the displacement cloud diagram of the particles inside the sample (see Figure 5).
Figure 5 shows that during the vertical compression process, the concrete specimen had obvious lateral deformation; that is, the particles on both sides of the sample had a large displacement, and the contact force chain between the internal part of the particles was also broken, and cracks appeared. The concrete sample in this state had been damaged and completely lost its bearing capacity. The vertical displacement of the particles inside the model was not uniformly distributed along the cross-section but in a zigzag pattern. The direction of the cracks formed after the compression failure of the concrete sample was also along the direction of the black line marked in Figure 5, which further shows that it is feasible to simulate the concrete sample by the discrete element method, and that the model parameters are also reasonable.
The comparison between the two particle sizes shows that although the model constructed with the particle size of 1 mm was more accurate than a concrete block constructed with the particle size of 5 mm, if a concrete sleeper is composed of particles with a particle size of 1 mm, hundreds of particles or even hundreds of thousands of particles need to be generated. Millions of particles increase the running time of the program, while the results of samples simulated with the 5 mm particle size were not much different from those of a sample constructed with the 1 mm particle size. Therefore, the particle size of 5 mm was finally selected to construct the discrete element model of the sleeper.

2.3. The Initial Model of the Sleeper

A two-dimensional model diagram was drawn according to the geometric size of the concrete sleeper and imported into the software of discrete element. Circular particles with a particle size of 5 mm were selected to fill the geometric diagram of the sleeper, and mechanical properties were applied to the sleeper according to the mechanical parameters determined after verification. The sleeper was composed of ball elements and combined according to certain arrangement rules. At the same time, to increase the calculation rate of the program, the rail was simulated by the clump element. The generated 2D rail-sleeper initial model is shown in Figure 6. In this paper, the sleeper was the main research object, and the discrete element method was used to simulate and analyze it. In order to make the research object more intuitive, the independent sleeper was directly simulated without considering the interaction between the sleeper and the track bed. Therefore, the main function of the wall at the bottom of the sleeper in the model was to limit the displacement of the sleeper particles and prevent the sleeper from passing through the wall.
To analyze the response of sleepers under dynamic loading, cyclic sinusoidal loads of equal magnitude were simultaneously applied to the left and right rails. The calculation formula [21] of the load is shown in Formula (1).
F t = F 1 c o s 2 π f t
where F represents the half-peak value of the load applied to the left and right rails, which is 63 kN [22]; t represents the loading time, and the total loading time applied to the rail is 1 s; and f is the frequency of the applied load, with 5 Hz, 10 Hz, 20 Hz, and 50 Hz selected in this study. The cycle loading times corresponding to different loading frequencies in the total calculation time were 5 times, 10 times, 20 times, and 50 times. The loading curves corresponding to different loading frequencies are shown in Figure 7.
Different loading frequencies correspond to different train speeds. The relationship between train speed and action frequency is shown in Formula (2) [23,24].
f = V / L  
where f is the action frequency applied to the rail; V corresponds to the running speed of the train, in m/s; and L represents the disturbance wavelength, i.e., the wheelbase of the train, in m. In this paper, the C80 freight train is taken as an example, L is the wheelbase of the C80 freight train (1830 mm) [25], and the four loading frequencies of 5 Hz, 10 Hz, 20 Hz, and 50 Hz correspond to train running speeds of 32.94 km/h, 65.88 km/h, 131.76 km/h, and 329.4 km/h, respectively.
By studying the influence of different loading frequencies on the mechanical properties of sleepers, the influence of train running speed on the service performance of sleepers can be reflected.

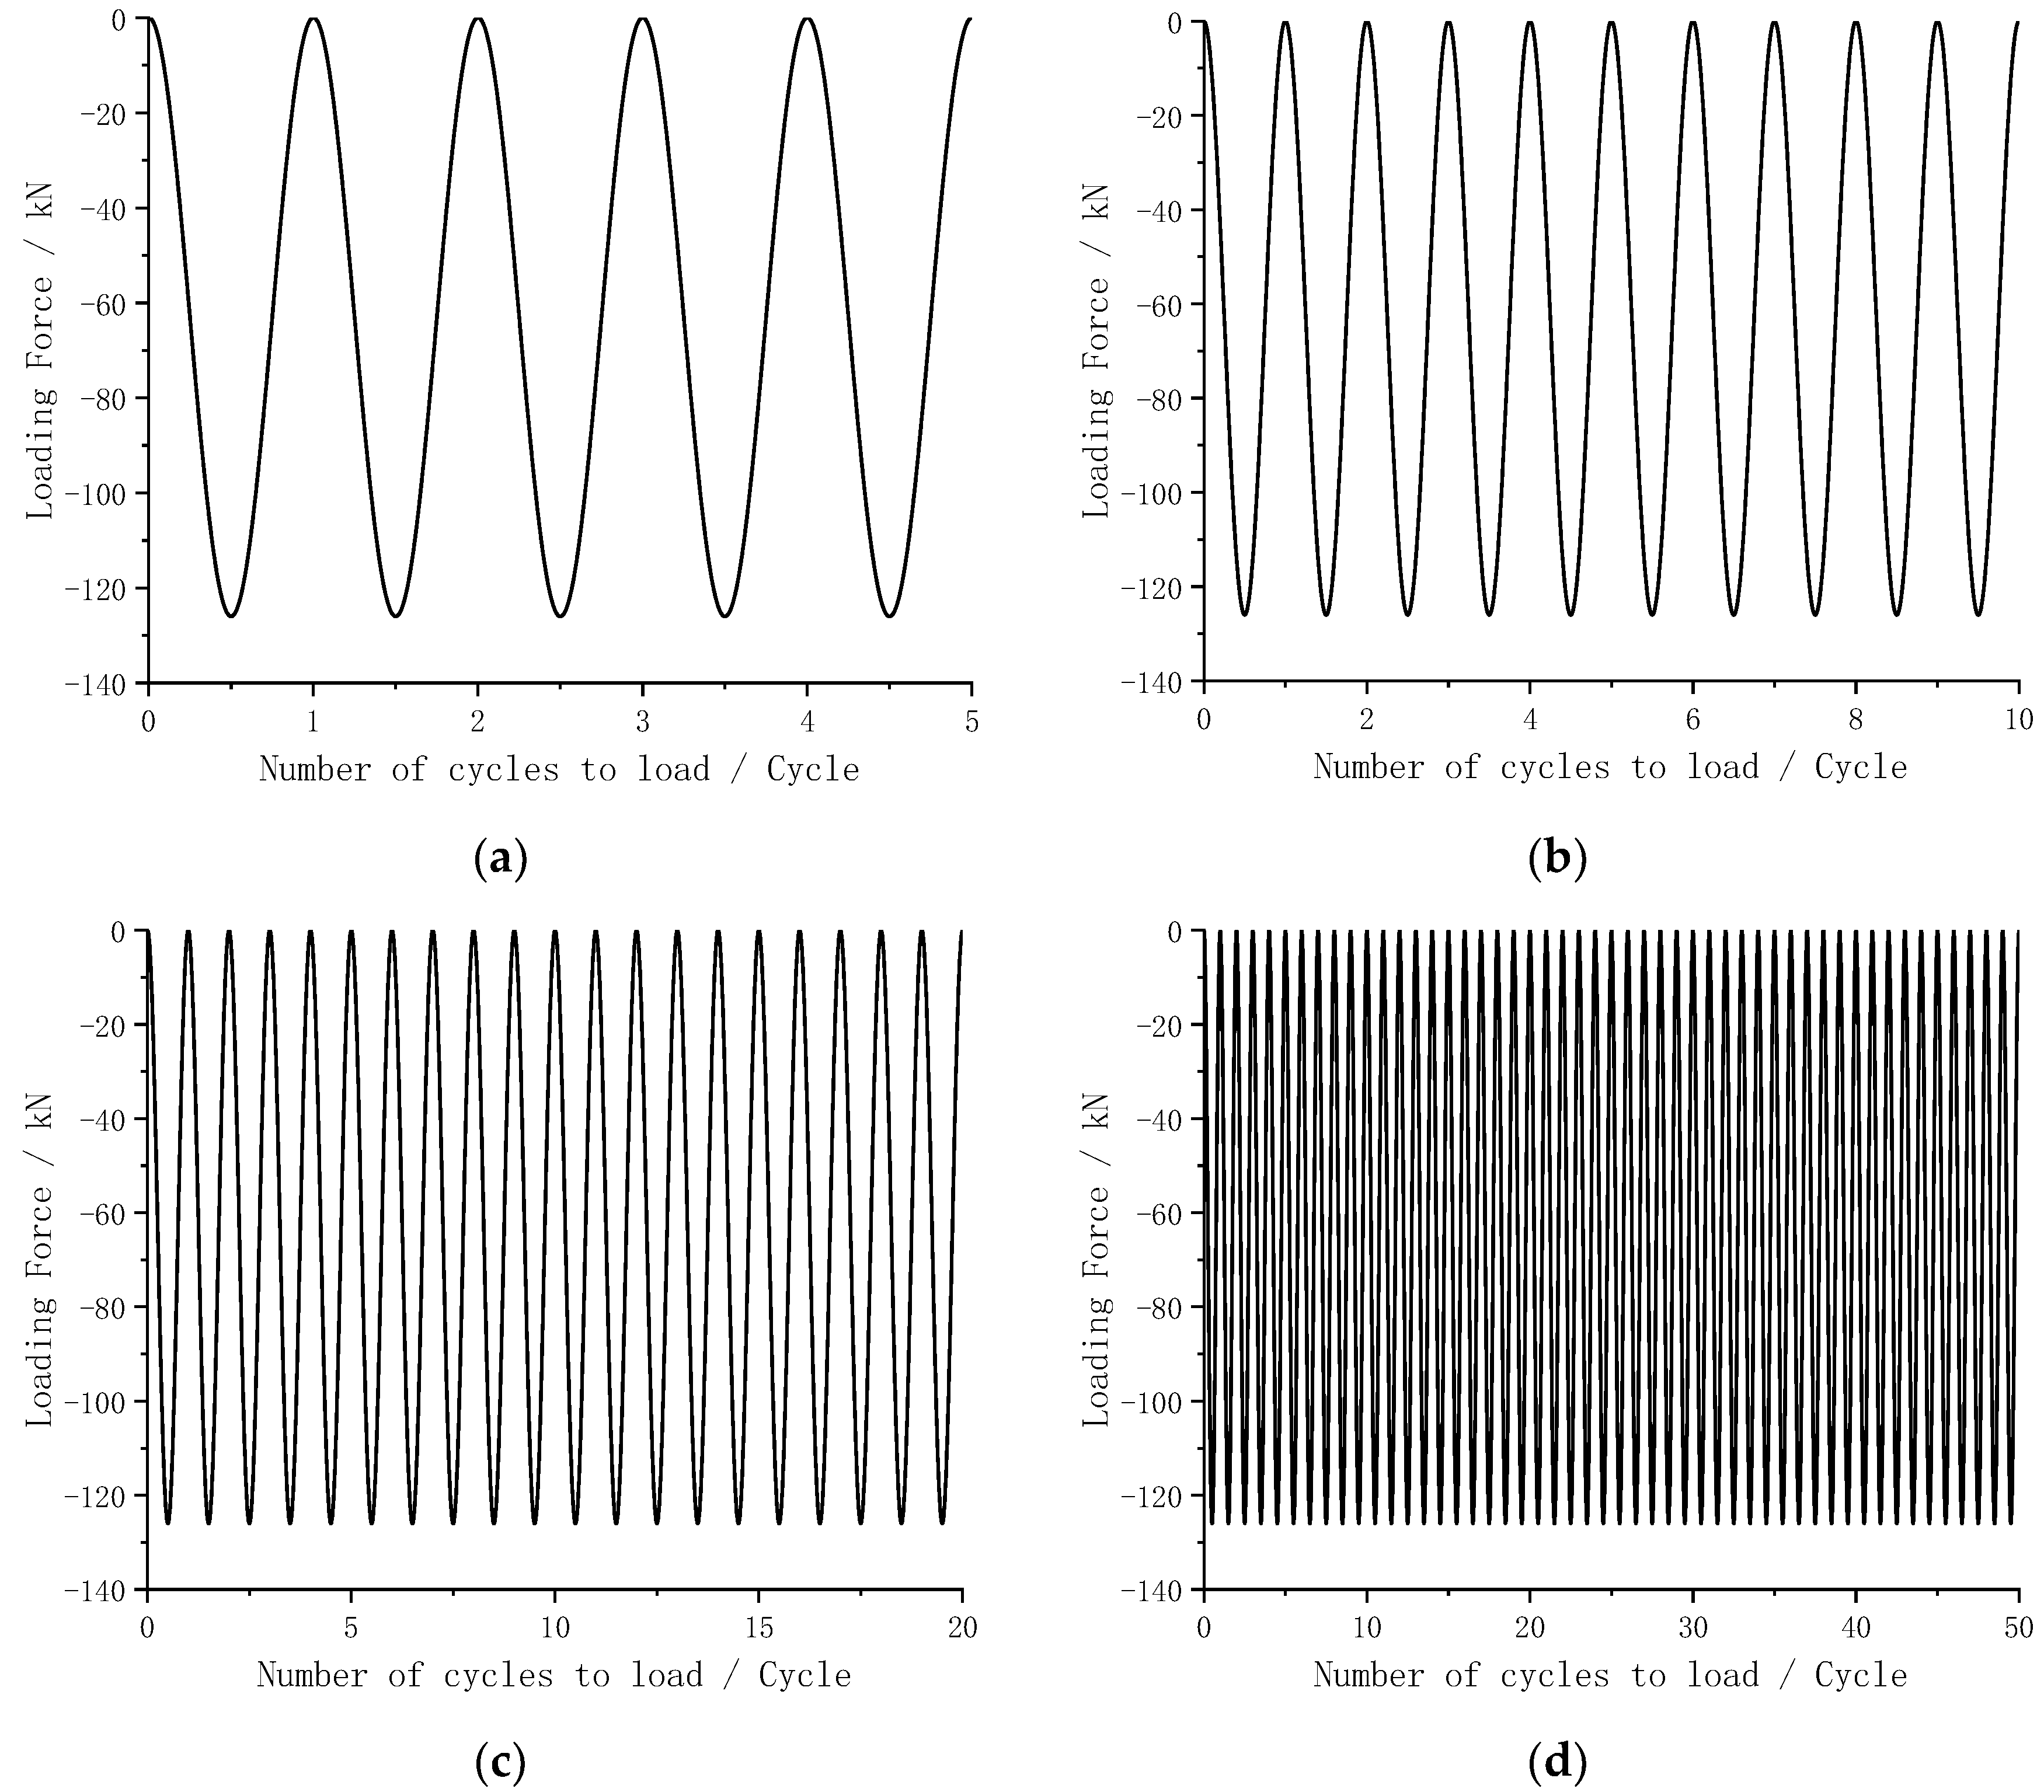
3. Dynamic Responses of Sleepers at Different Loading Frequencies

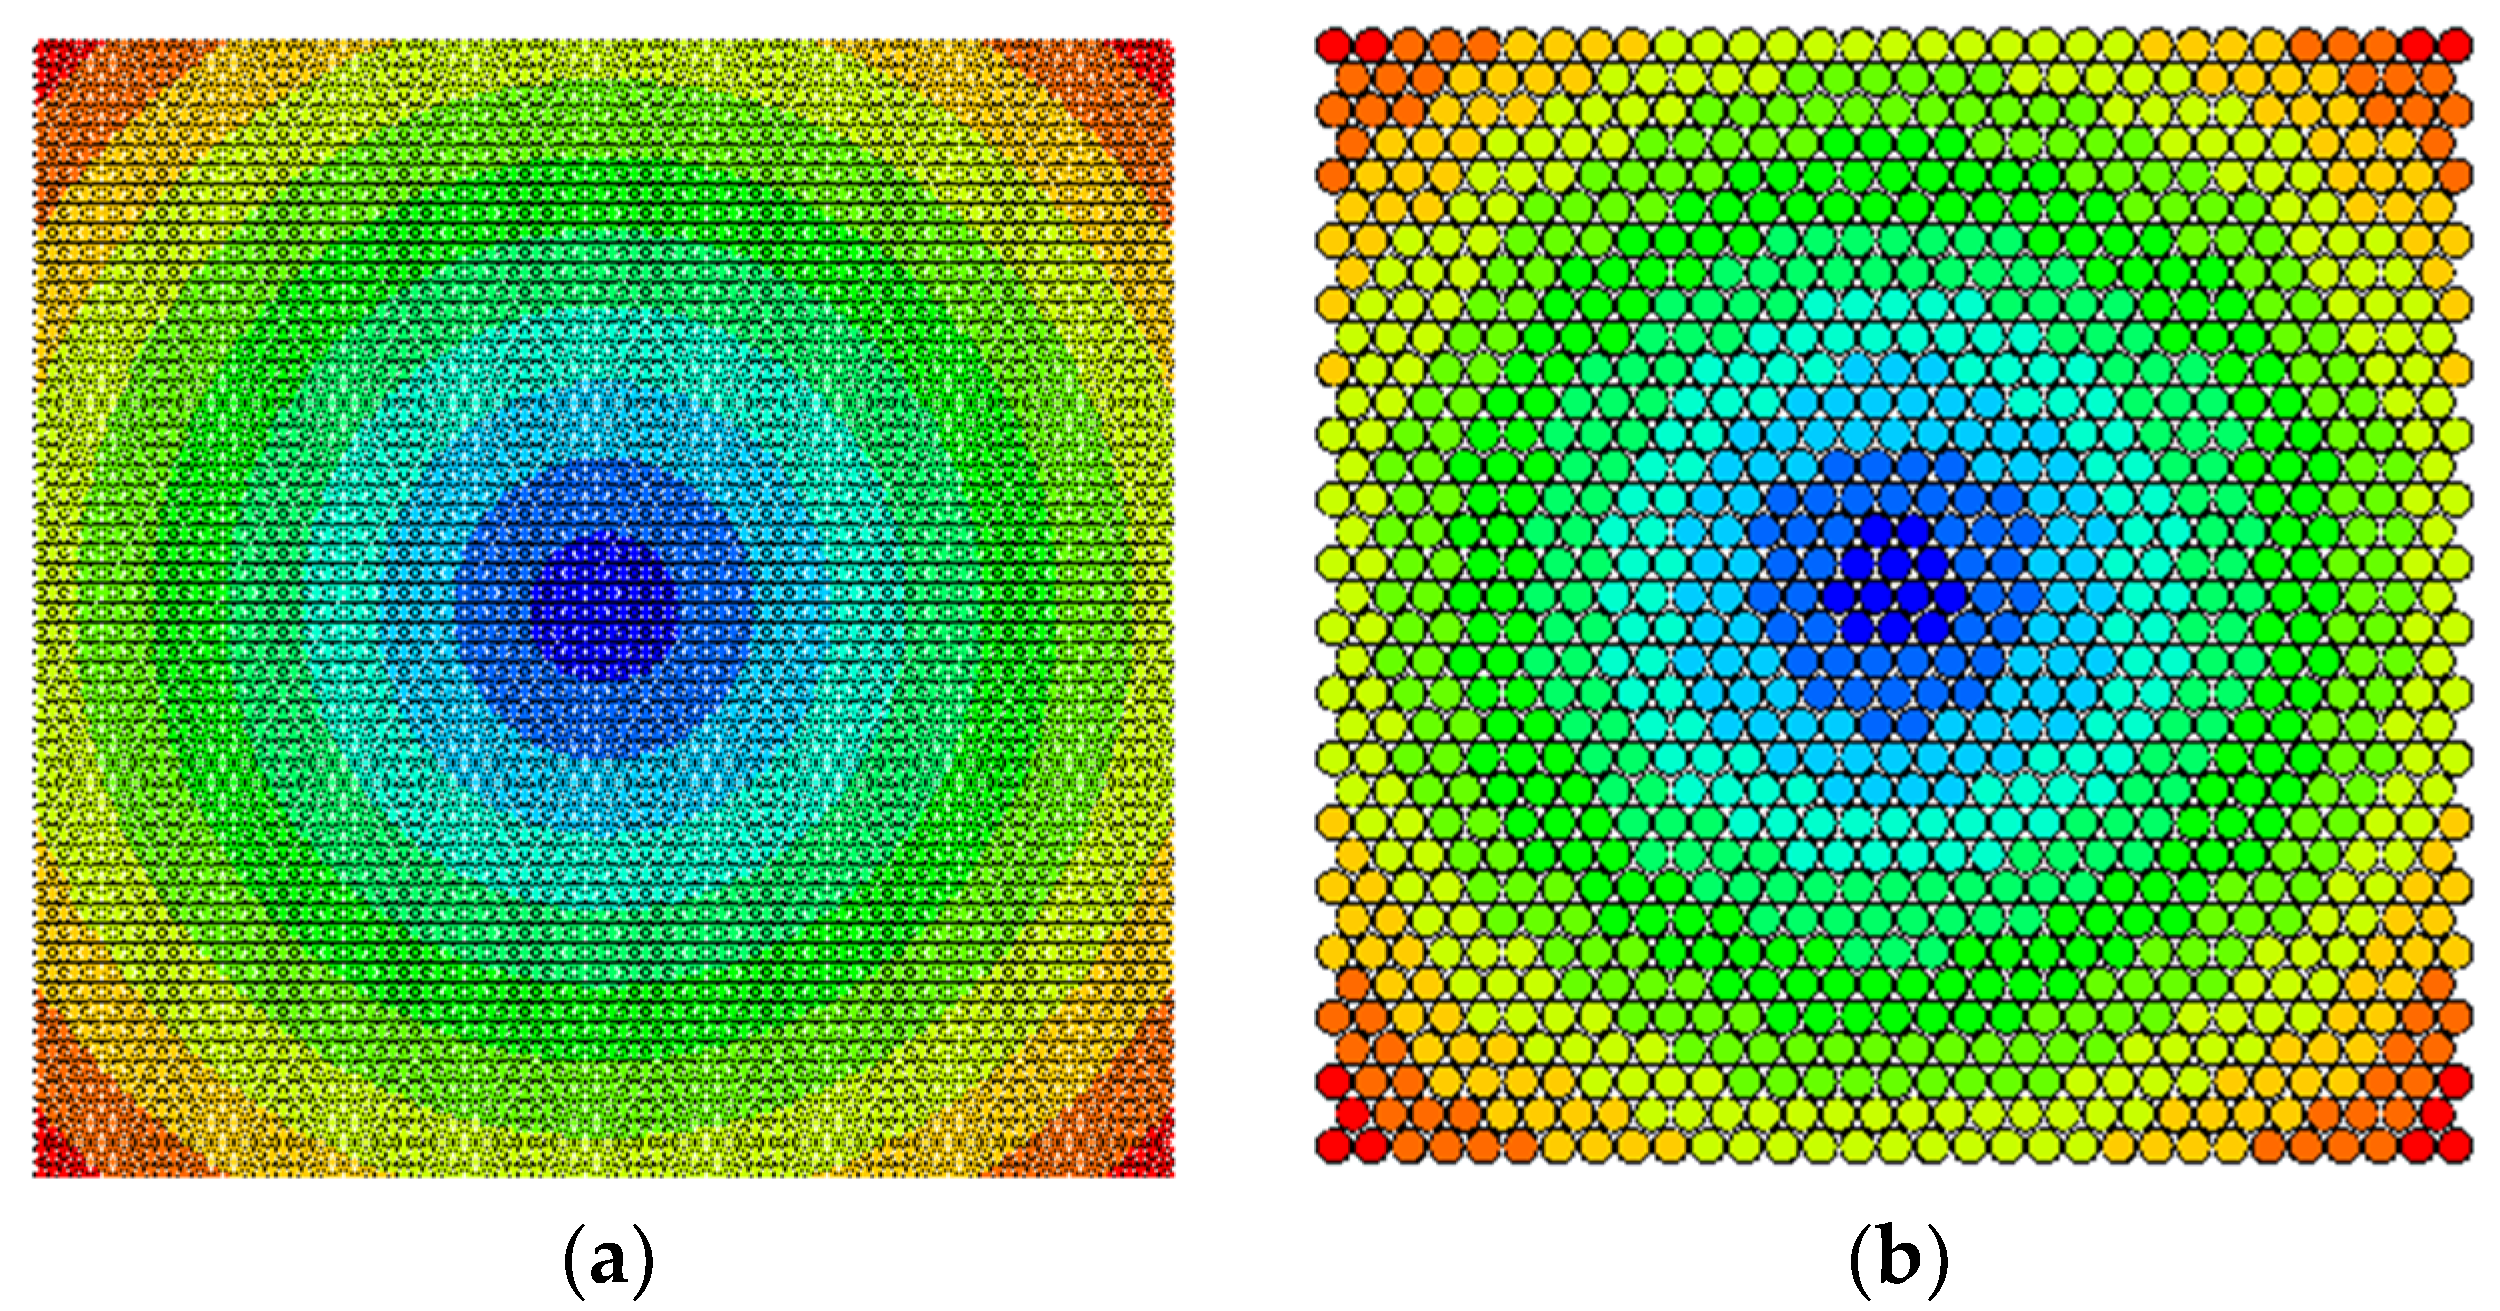
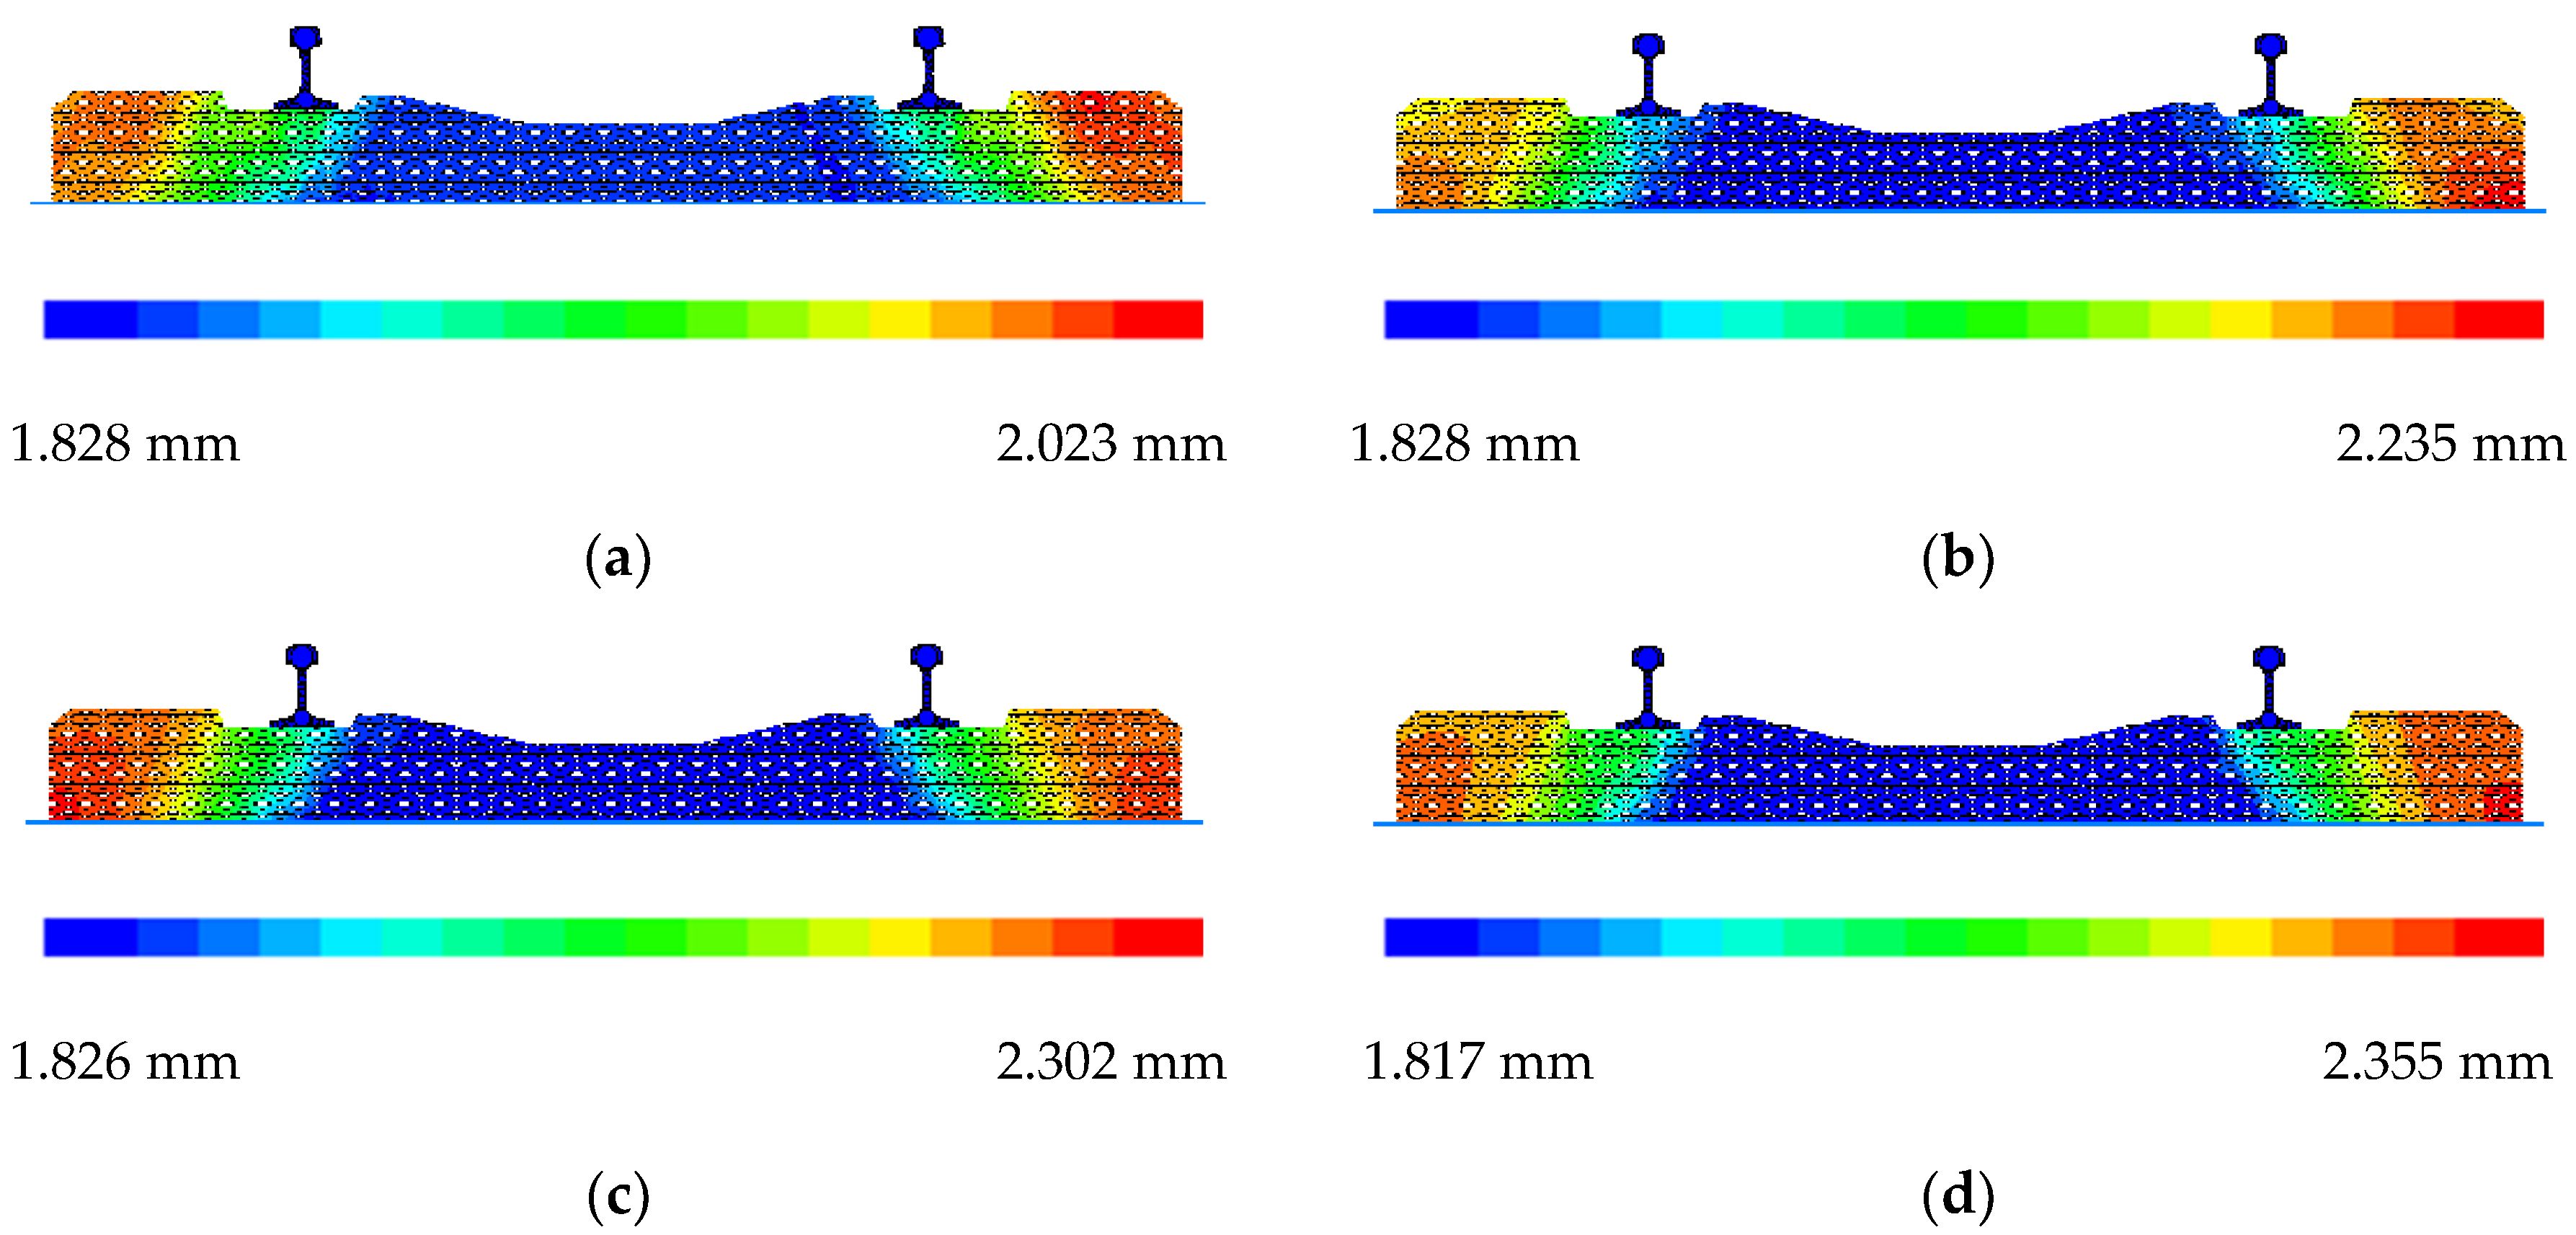
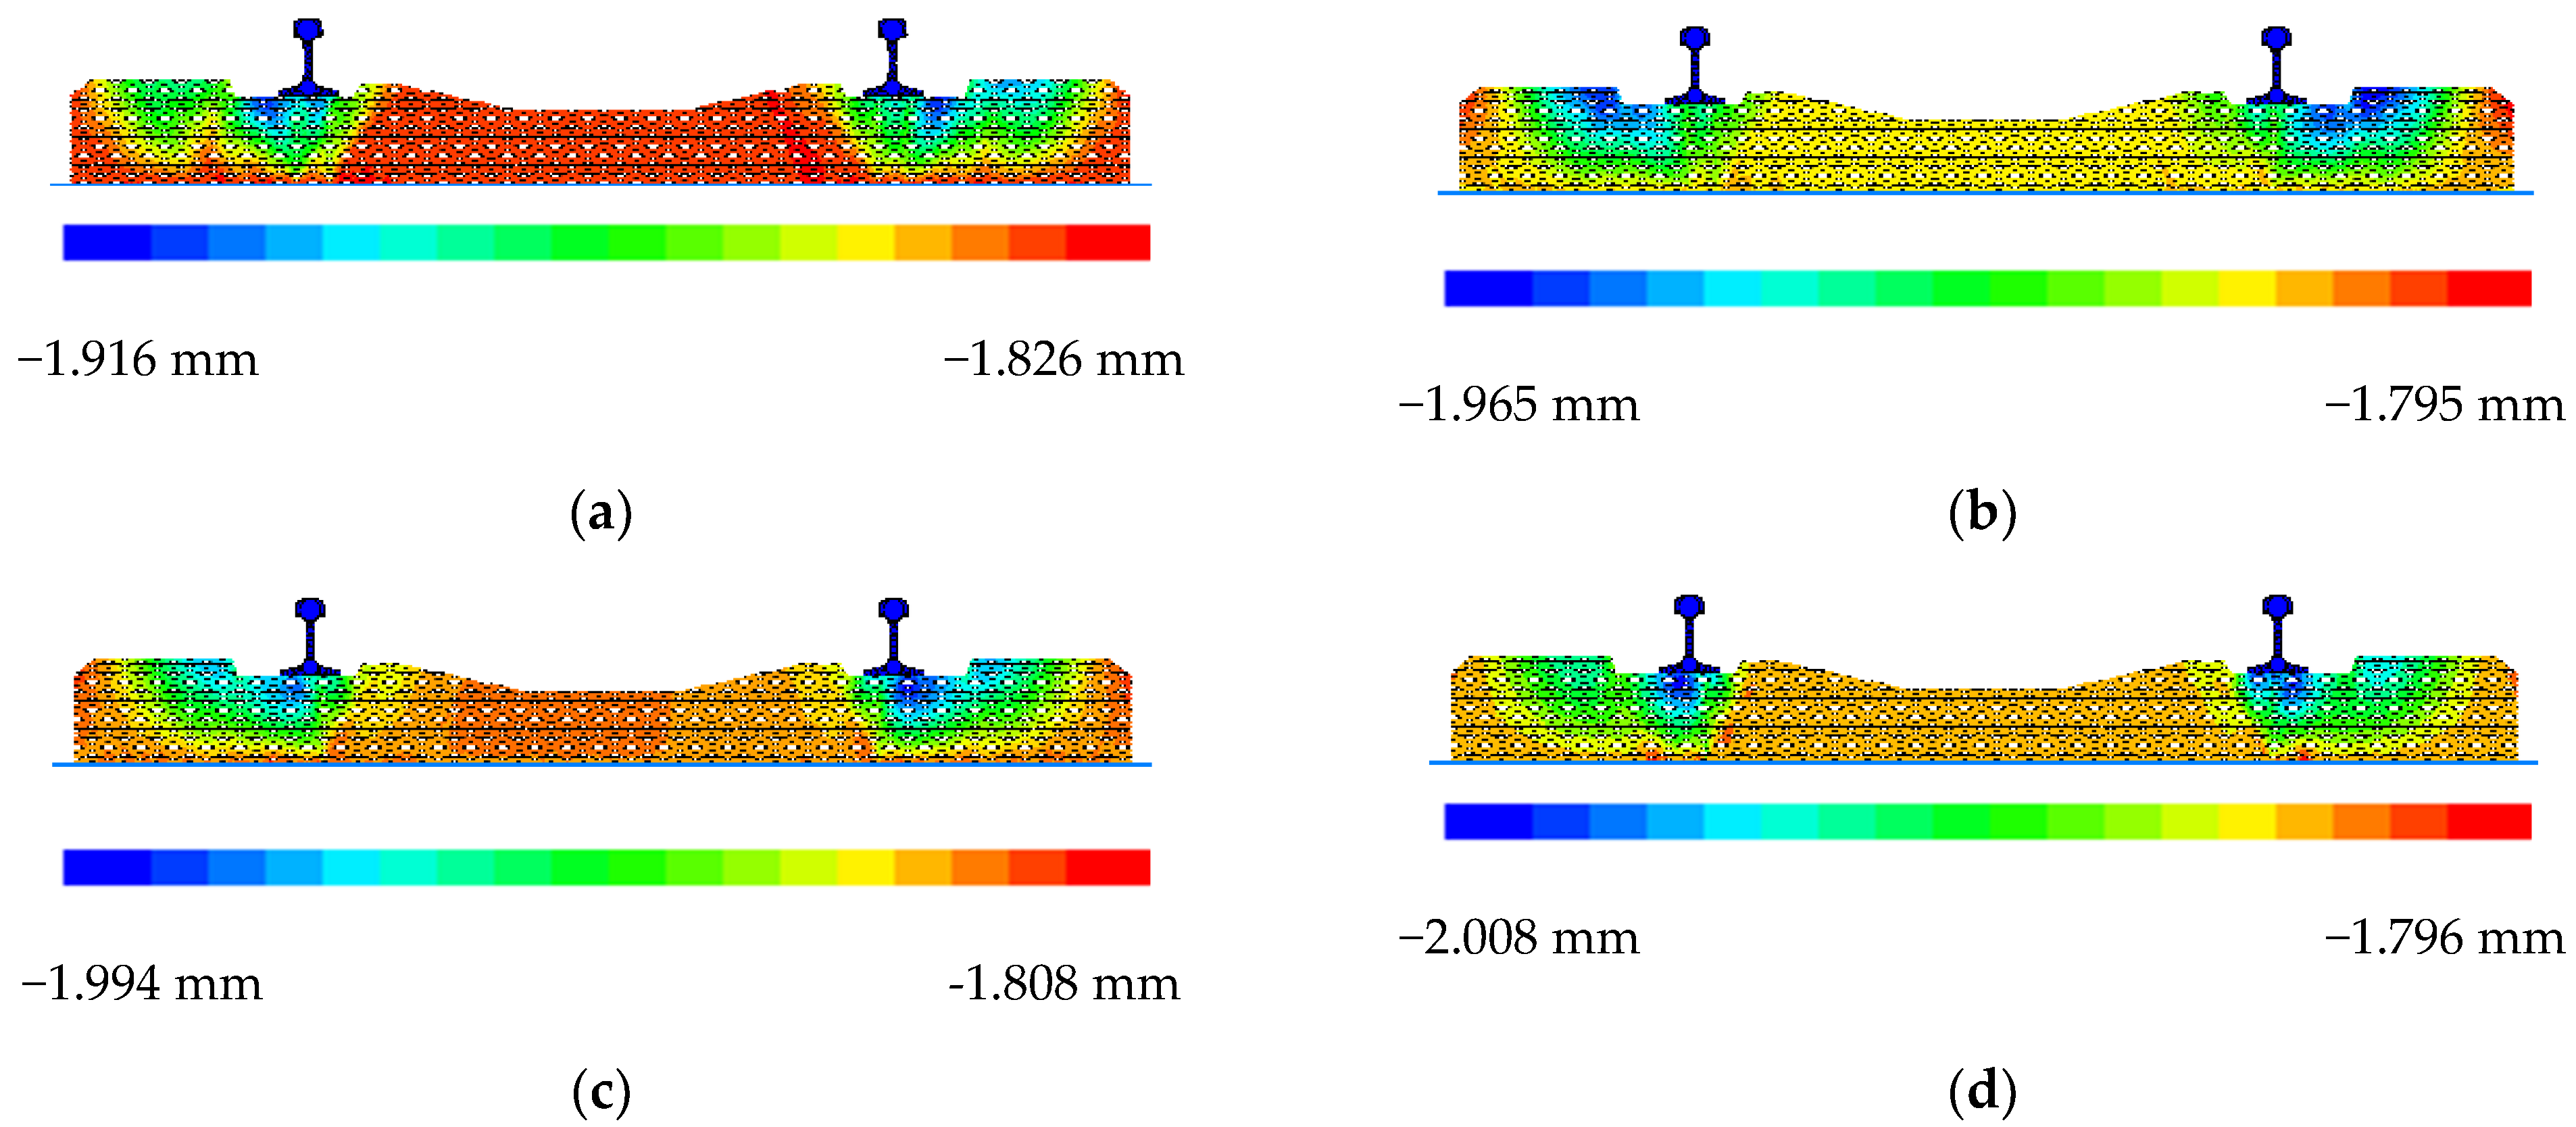
3.1. Influence of Loading Frequency on Particle Displacement in Sleepers

Under the same number of cycles (five) and different loading frequencies, the particle displacement cloud diagram and vertical displacement cloud diagram in the sleeper are shown in Figure 8 and Figure 9.
Comparing the sleeper-displacement cloud map in Figure 8, it is seen that, under the same loading times, the distribution of sleeper particle displacement with different loading frequencies was similar: the particle displacement in the center of the sleeper was the smallest, and the particle displacement on both sides of the edge of the sleeper was the largest. The maximum particle displacement value of the sleeper increased with increasing loading frequency, but all of the change ranges were within 1 mm.
The sleeper was loaded by applying a vertical load to the rail. Under the vertical load, the internal particles of the sleeper mainly produced vertical displacement, and the lateral displacement was almost negligible. Therefore, Figure 9 only shows the vertical-displacement cloud diagram of the particles in the sleeper corresponding to different loading frequencies. Figure 9 shows that under the action of cyclic loading, the sleeper area under the rail had a large vertical displacement, while the sleeper particle displacement in other areas was small. Under the cyclic loading times, the maximum displacement value of the sleeper increased with increasing loading frequency.

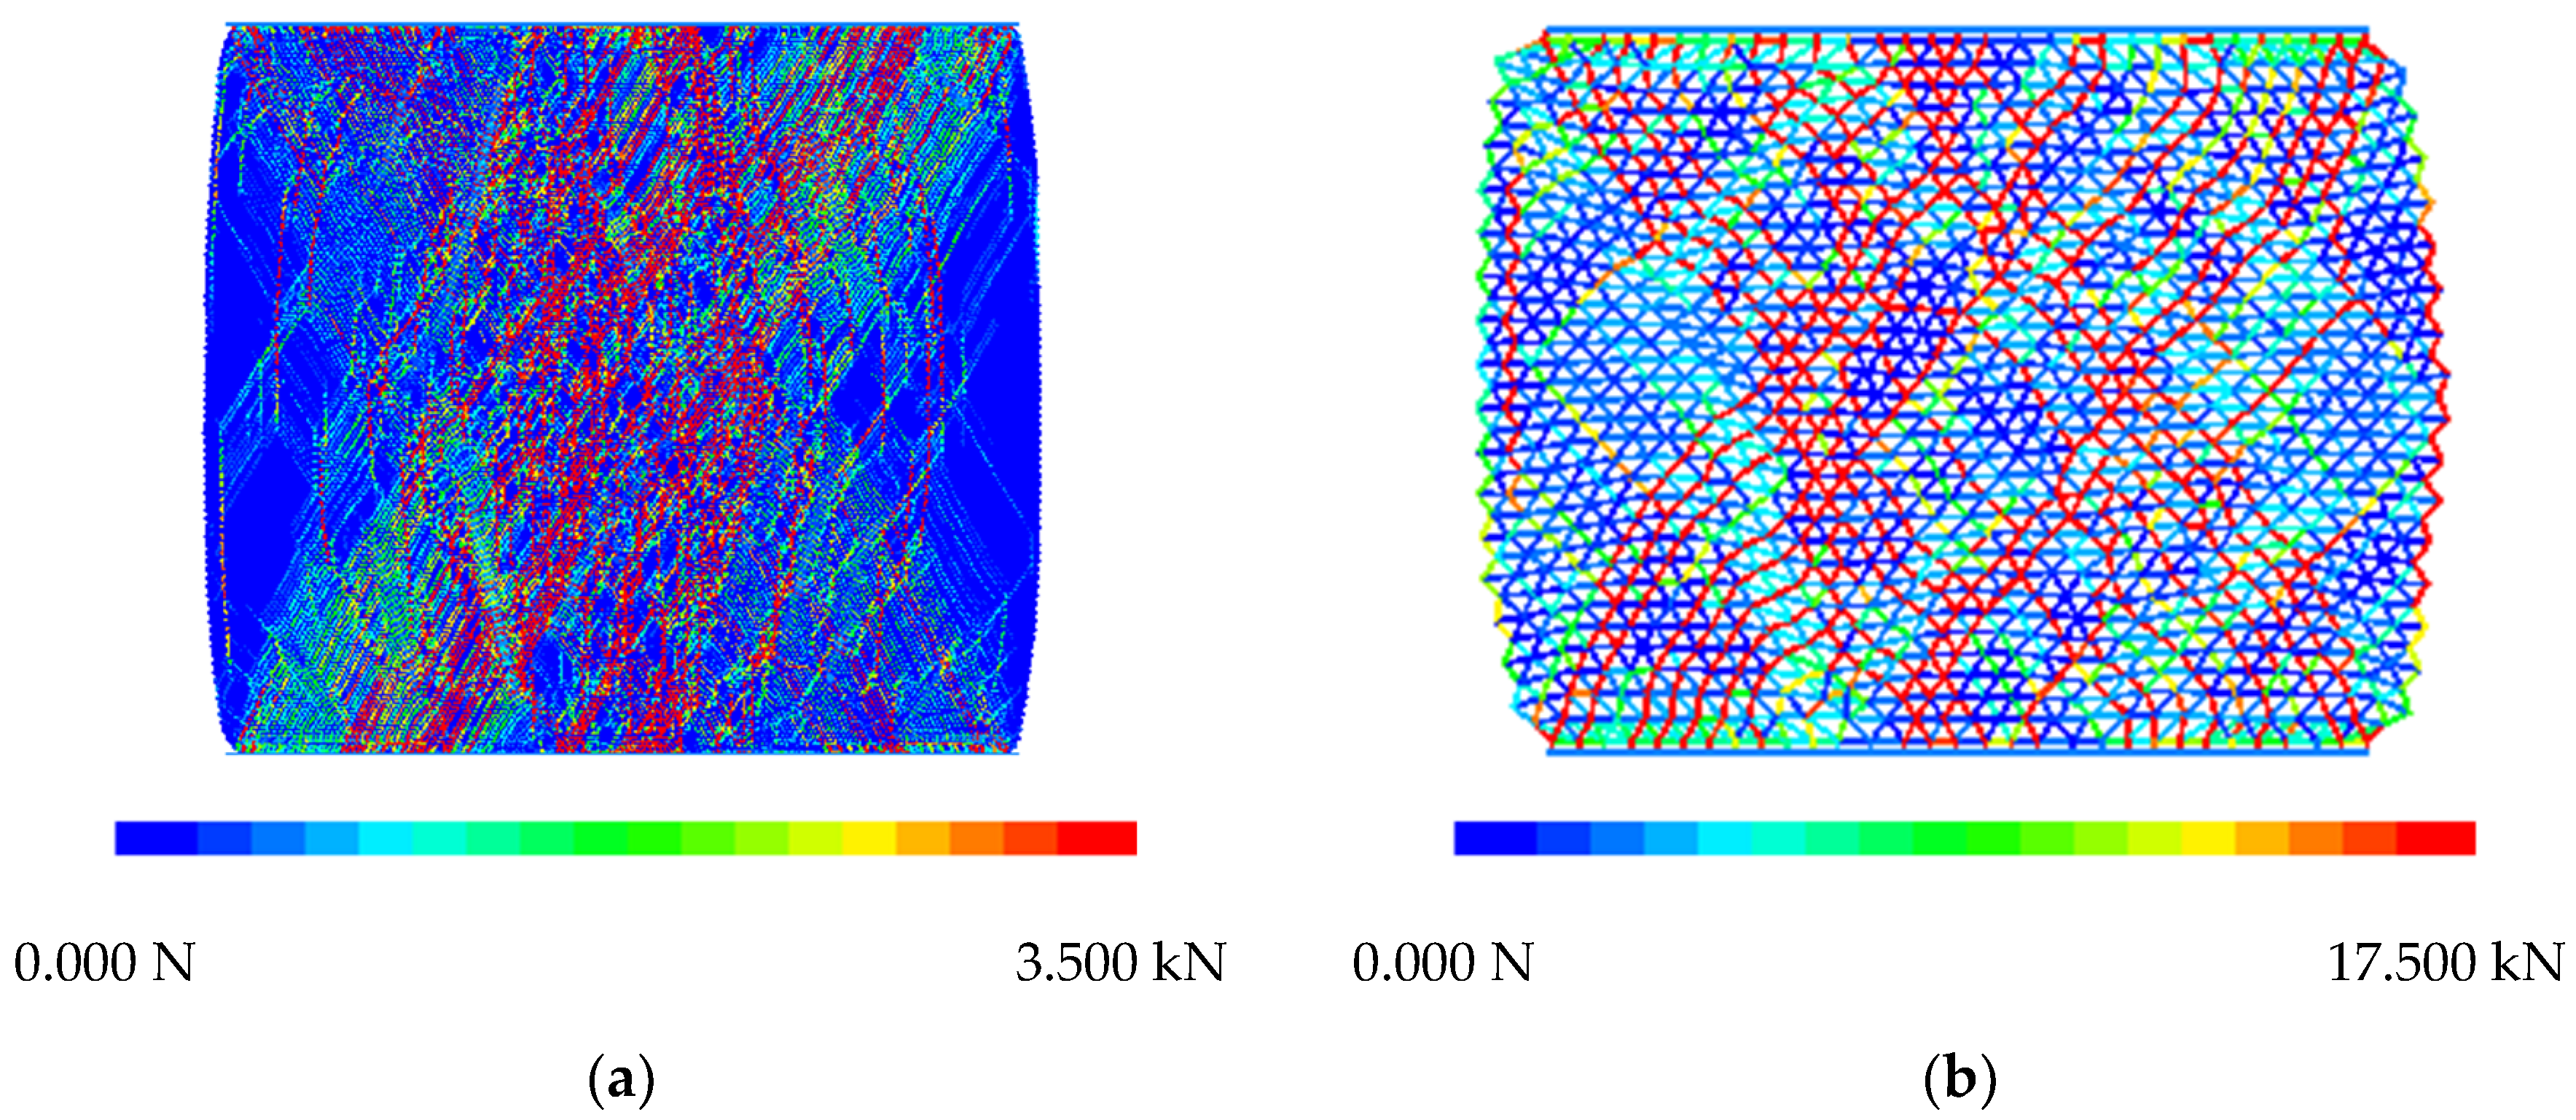
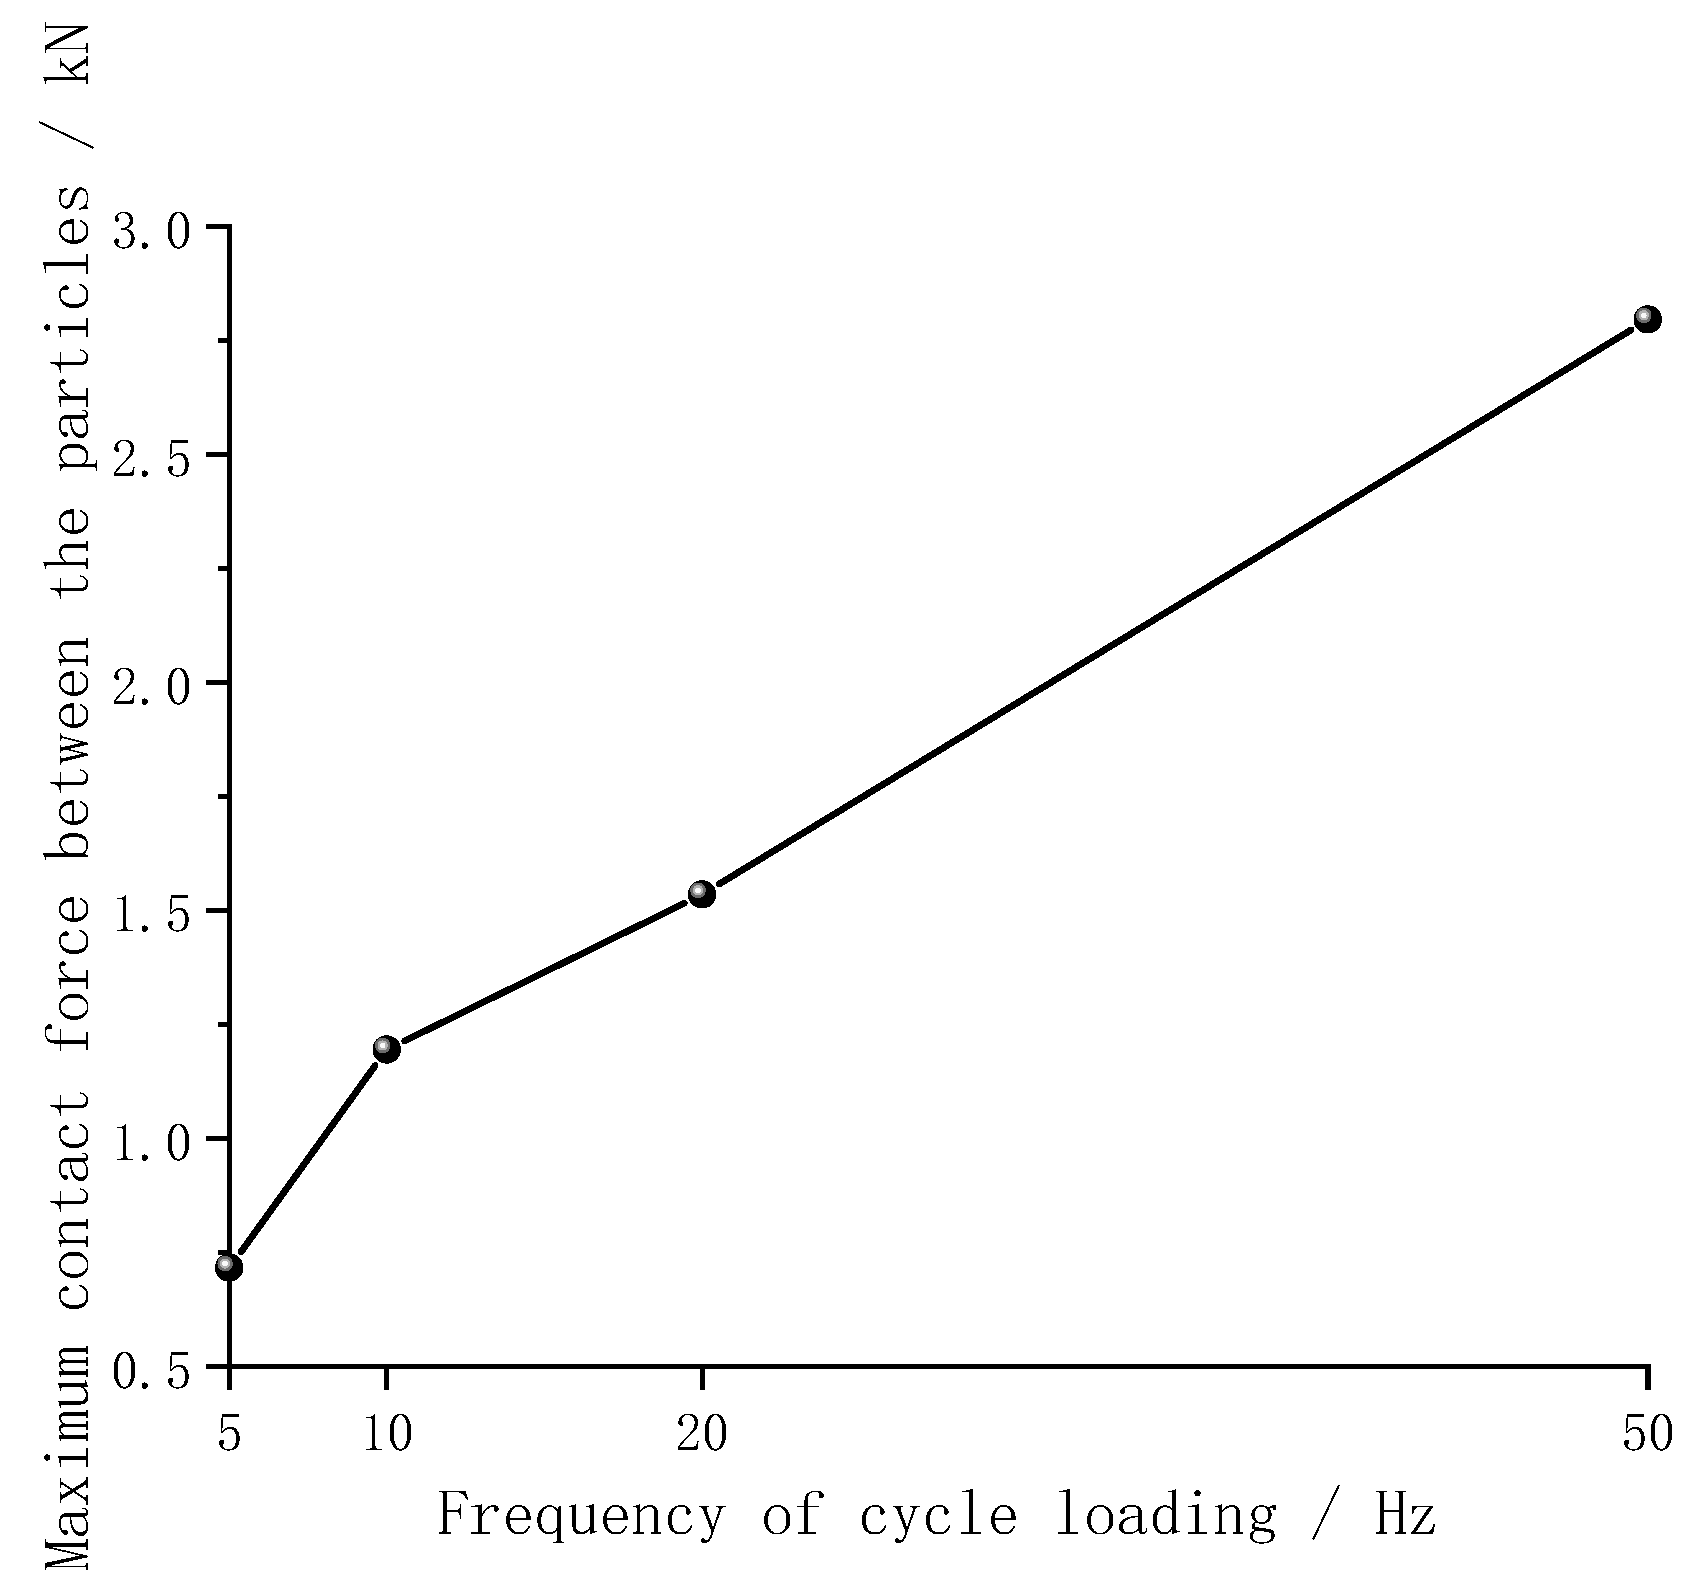
3.2. Influence of Loading Frequency on the Contact Force between Particles in the Sleeper

The discrete element model of the sleeper is composed of fine particles according to a certain arrangement law and combined by contact bonding. Under the action of force, the load transmitted from the rail to the sleeper is borne by the particles in the sleeper, and the transmission of the load is also transmitted through the contact force between the particles in the sleeper. To explore the effect of loading frequency on the contact force of sleeper particles, the variation of the maximum contact force between particles in the sleeper with the loading frequency under 5 cycles of loading was simulated and recorded, as shown in Figure 9.
Figure 10 shows that after cyclic loading at four loading frequencies of 5 Hz, 10 Hz, 20 Hz, and 50 Hz, the maximum value of the contact force between particles in the sleeper increased with increasing loading frequency. This shows that under the same loading times, the greater the load frequency applied to the rail, the greater the contact force between the particles in the sleeper.

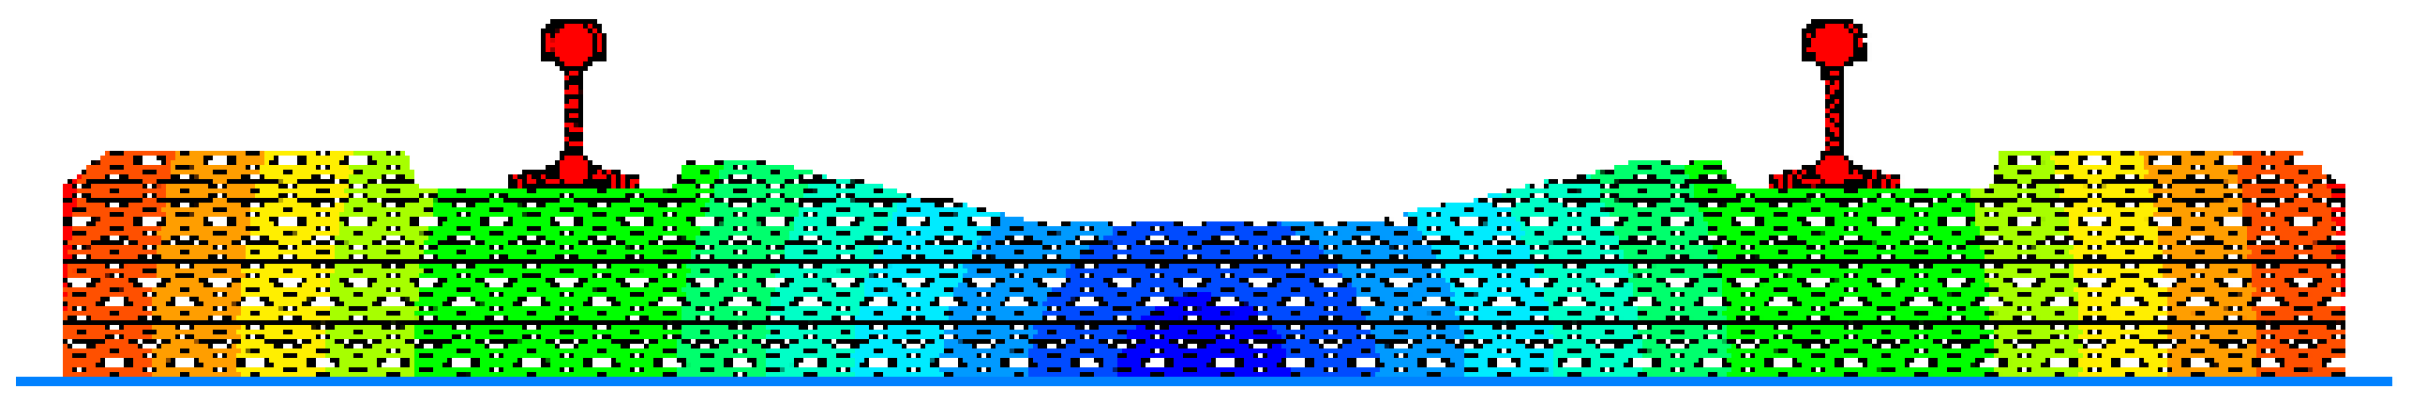
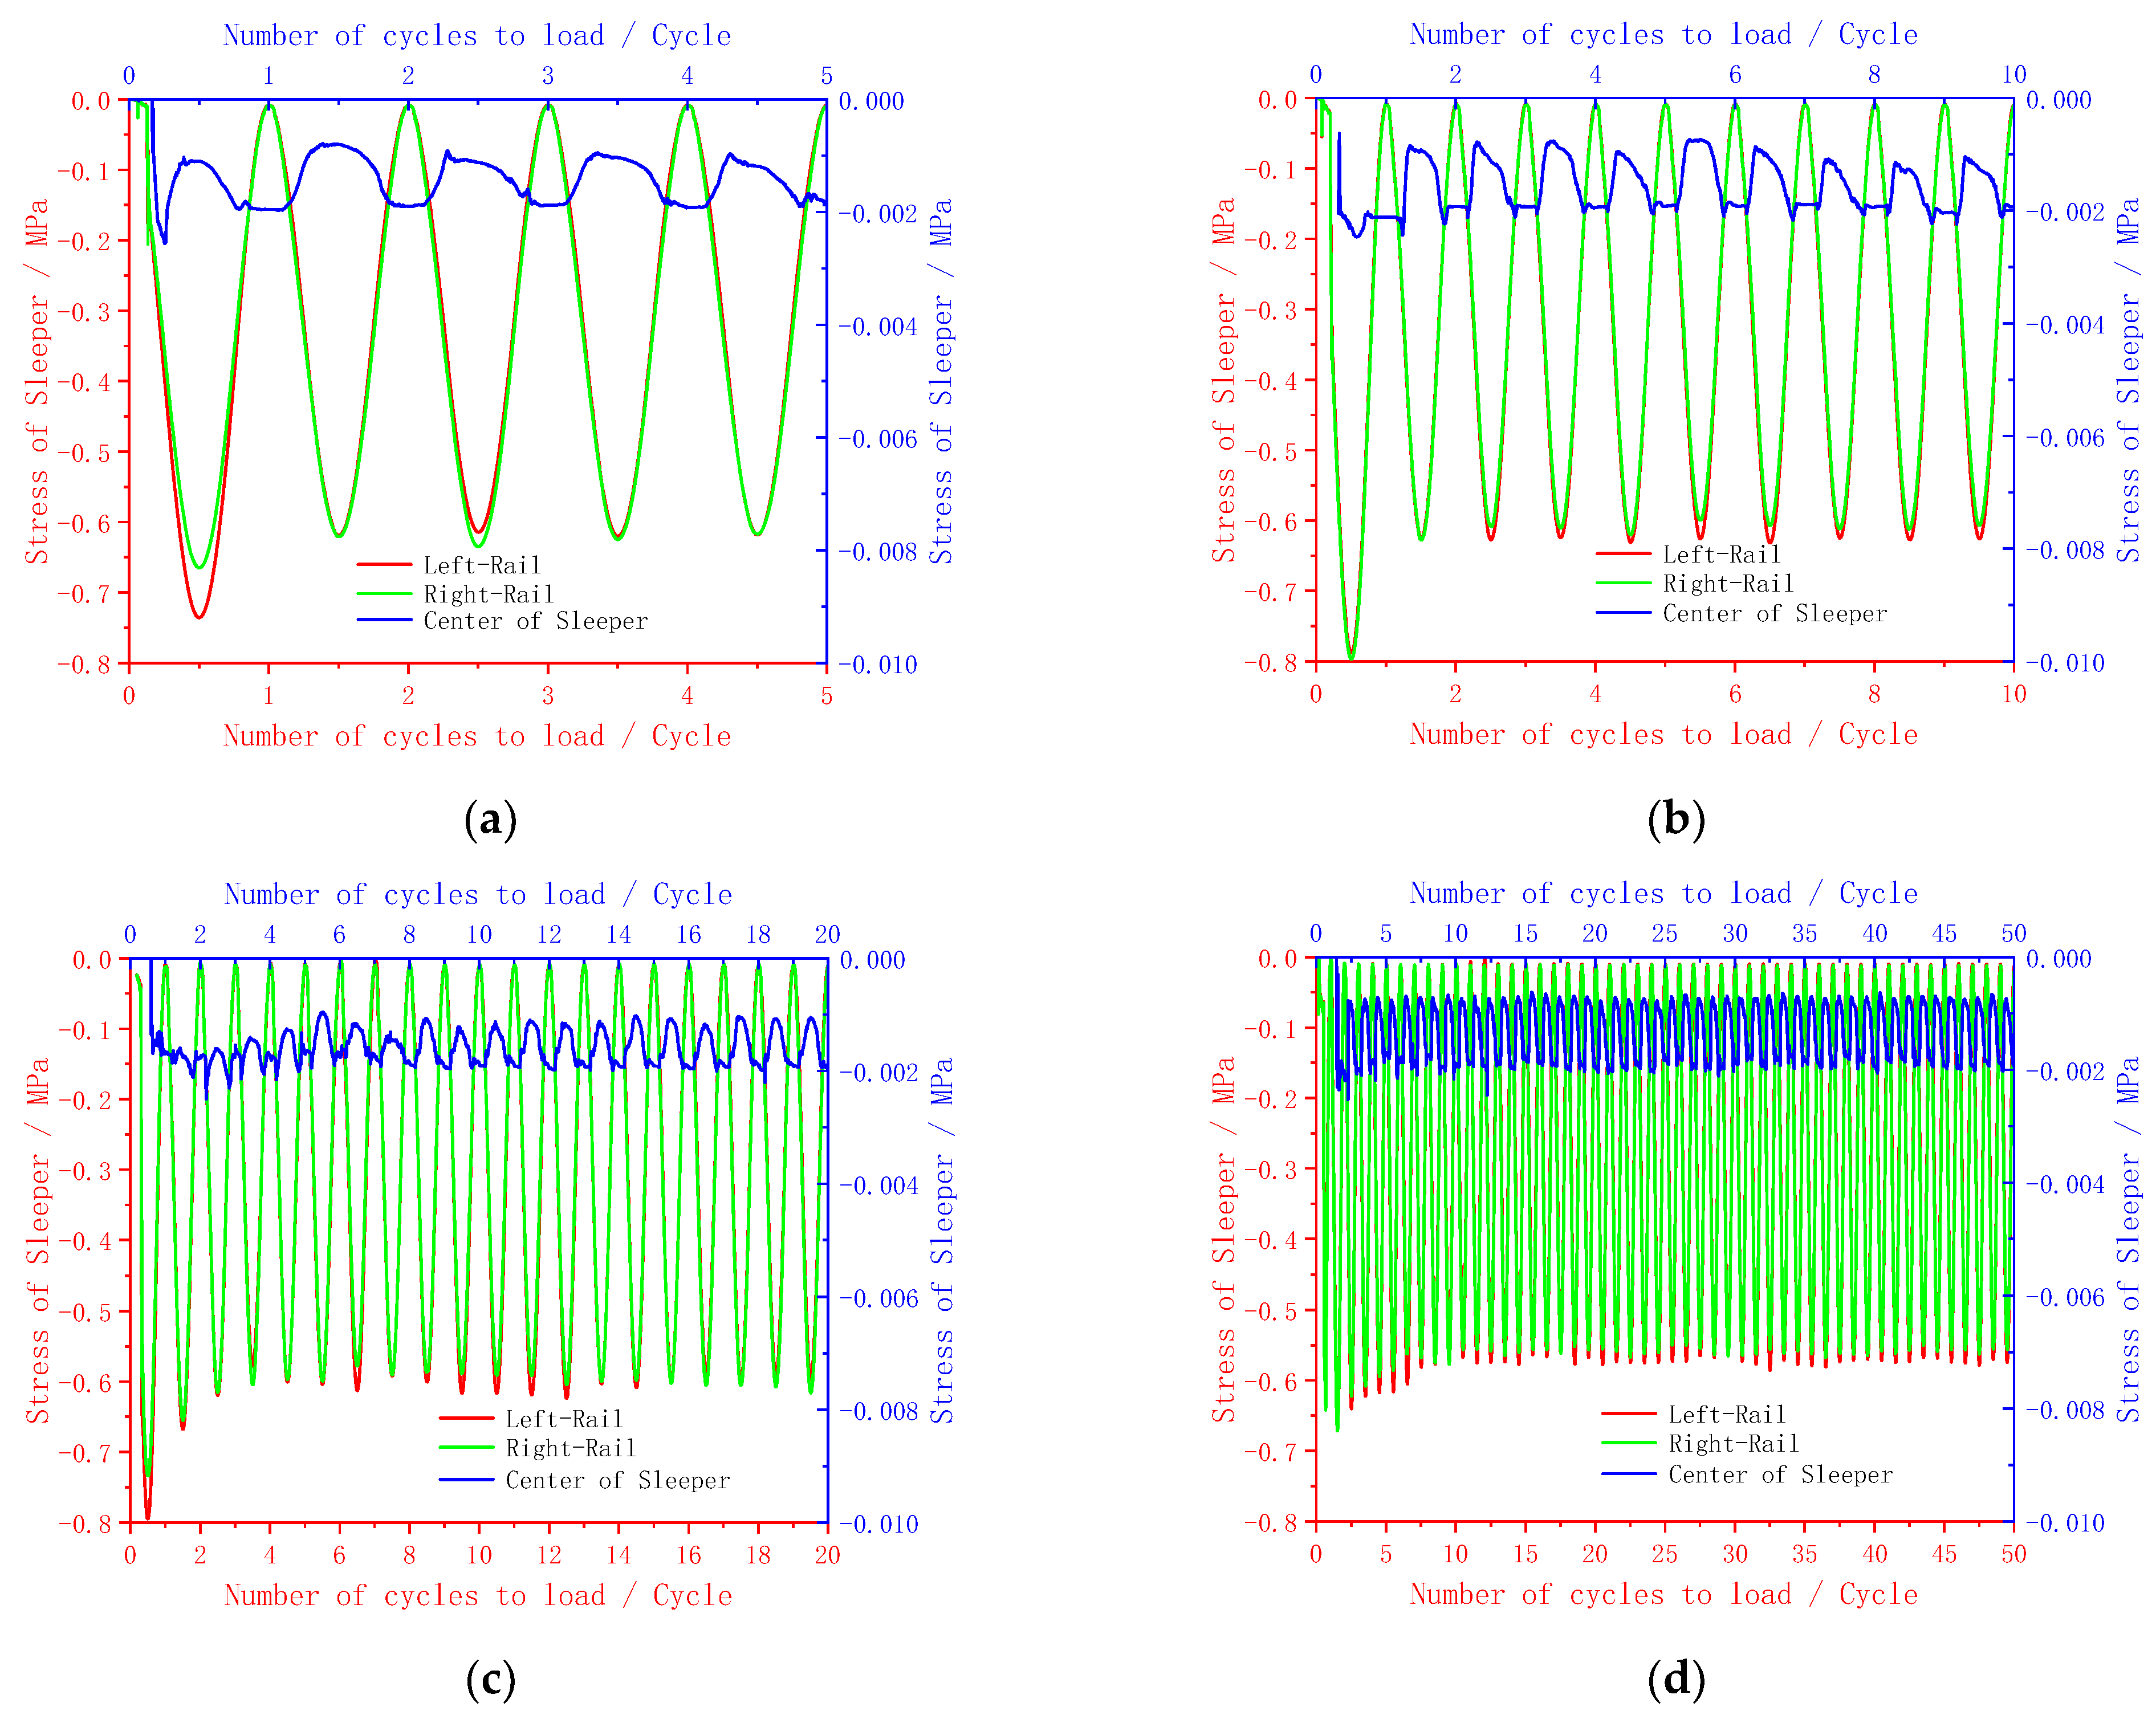
3.3. Effect of Loading Frequency on Sleeper Stress

The train is in direct contact with the rail during operation, with the train load getting transmitted to the sleeper through the rail, and the sleeper bears a part of the load and continues to transmit the load to the trackbed. To analyze the distribution of the load transmitted to the sleeper inside it, measuring circles were added to the sleeper center and the sleeper at the position under the left and right strand rails. The stress changes of the sleeper under the left rail, at the center of the sleeper, and under the right rail corresponding to different loading frequencies within the total loading time (1 s) were recorded. The results are shown in Figure 11.
Figure 11 shows that during the initial loading, the sleeper had a large stress due to the load, and the sleeper model was not very stable. After continuing to cyclically load the sleeper, the stress change trend in the sleeper tended to be stable. The stress of the sleeper area under the rail enlarged significantly, while the stress peak at the center of the sleeper was smaller. Under different loading frequencies, the peak values of the sleeper stress under the left and right strand rails were close to each other, approximately 0.6 MPa, and the maximum compressive stress at the center of the sleeper was not much different, with both being approximately 0.002 MPa. The variation law of the stress in the sleeper is similar to the variation of the applied load, and both show a sinusoidal distribution. Due to the symmetry of the geometric distribution of sleepers and rails and the symmetry of the load action, the stress change and stress peak value of the sleeper under the left and right strand rails are the same, and the stress change curves of the two almost coincide.

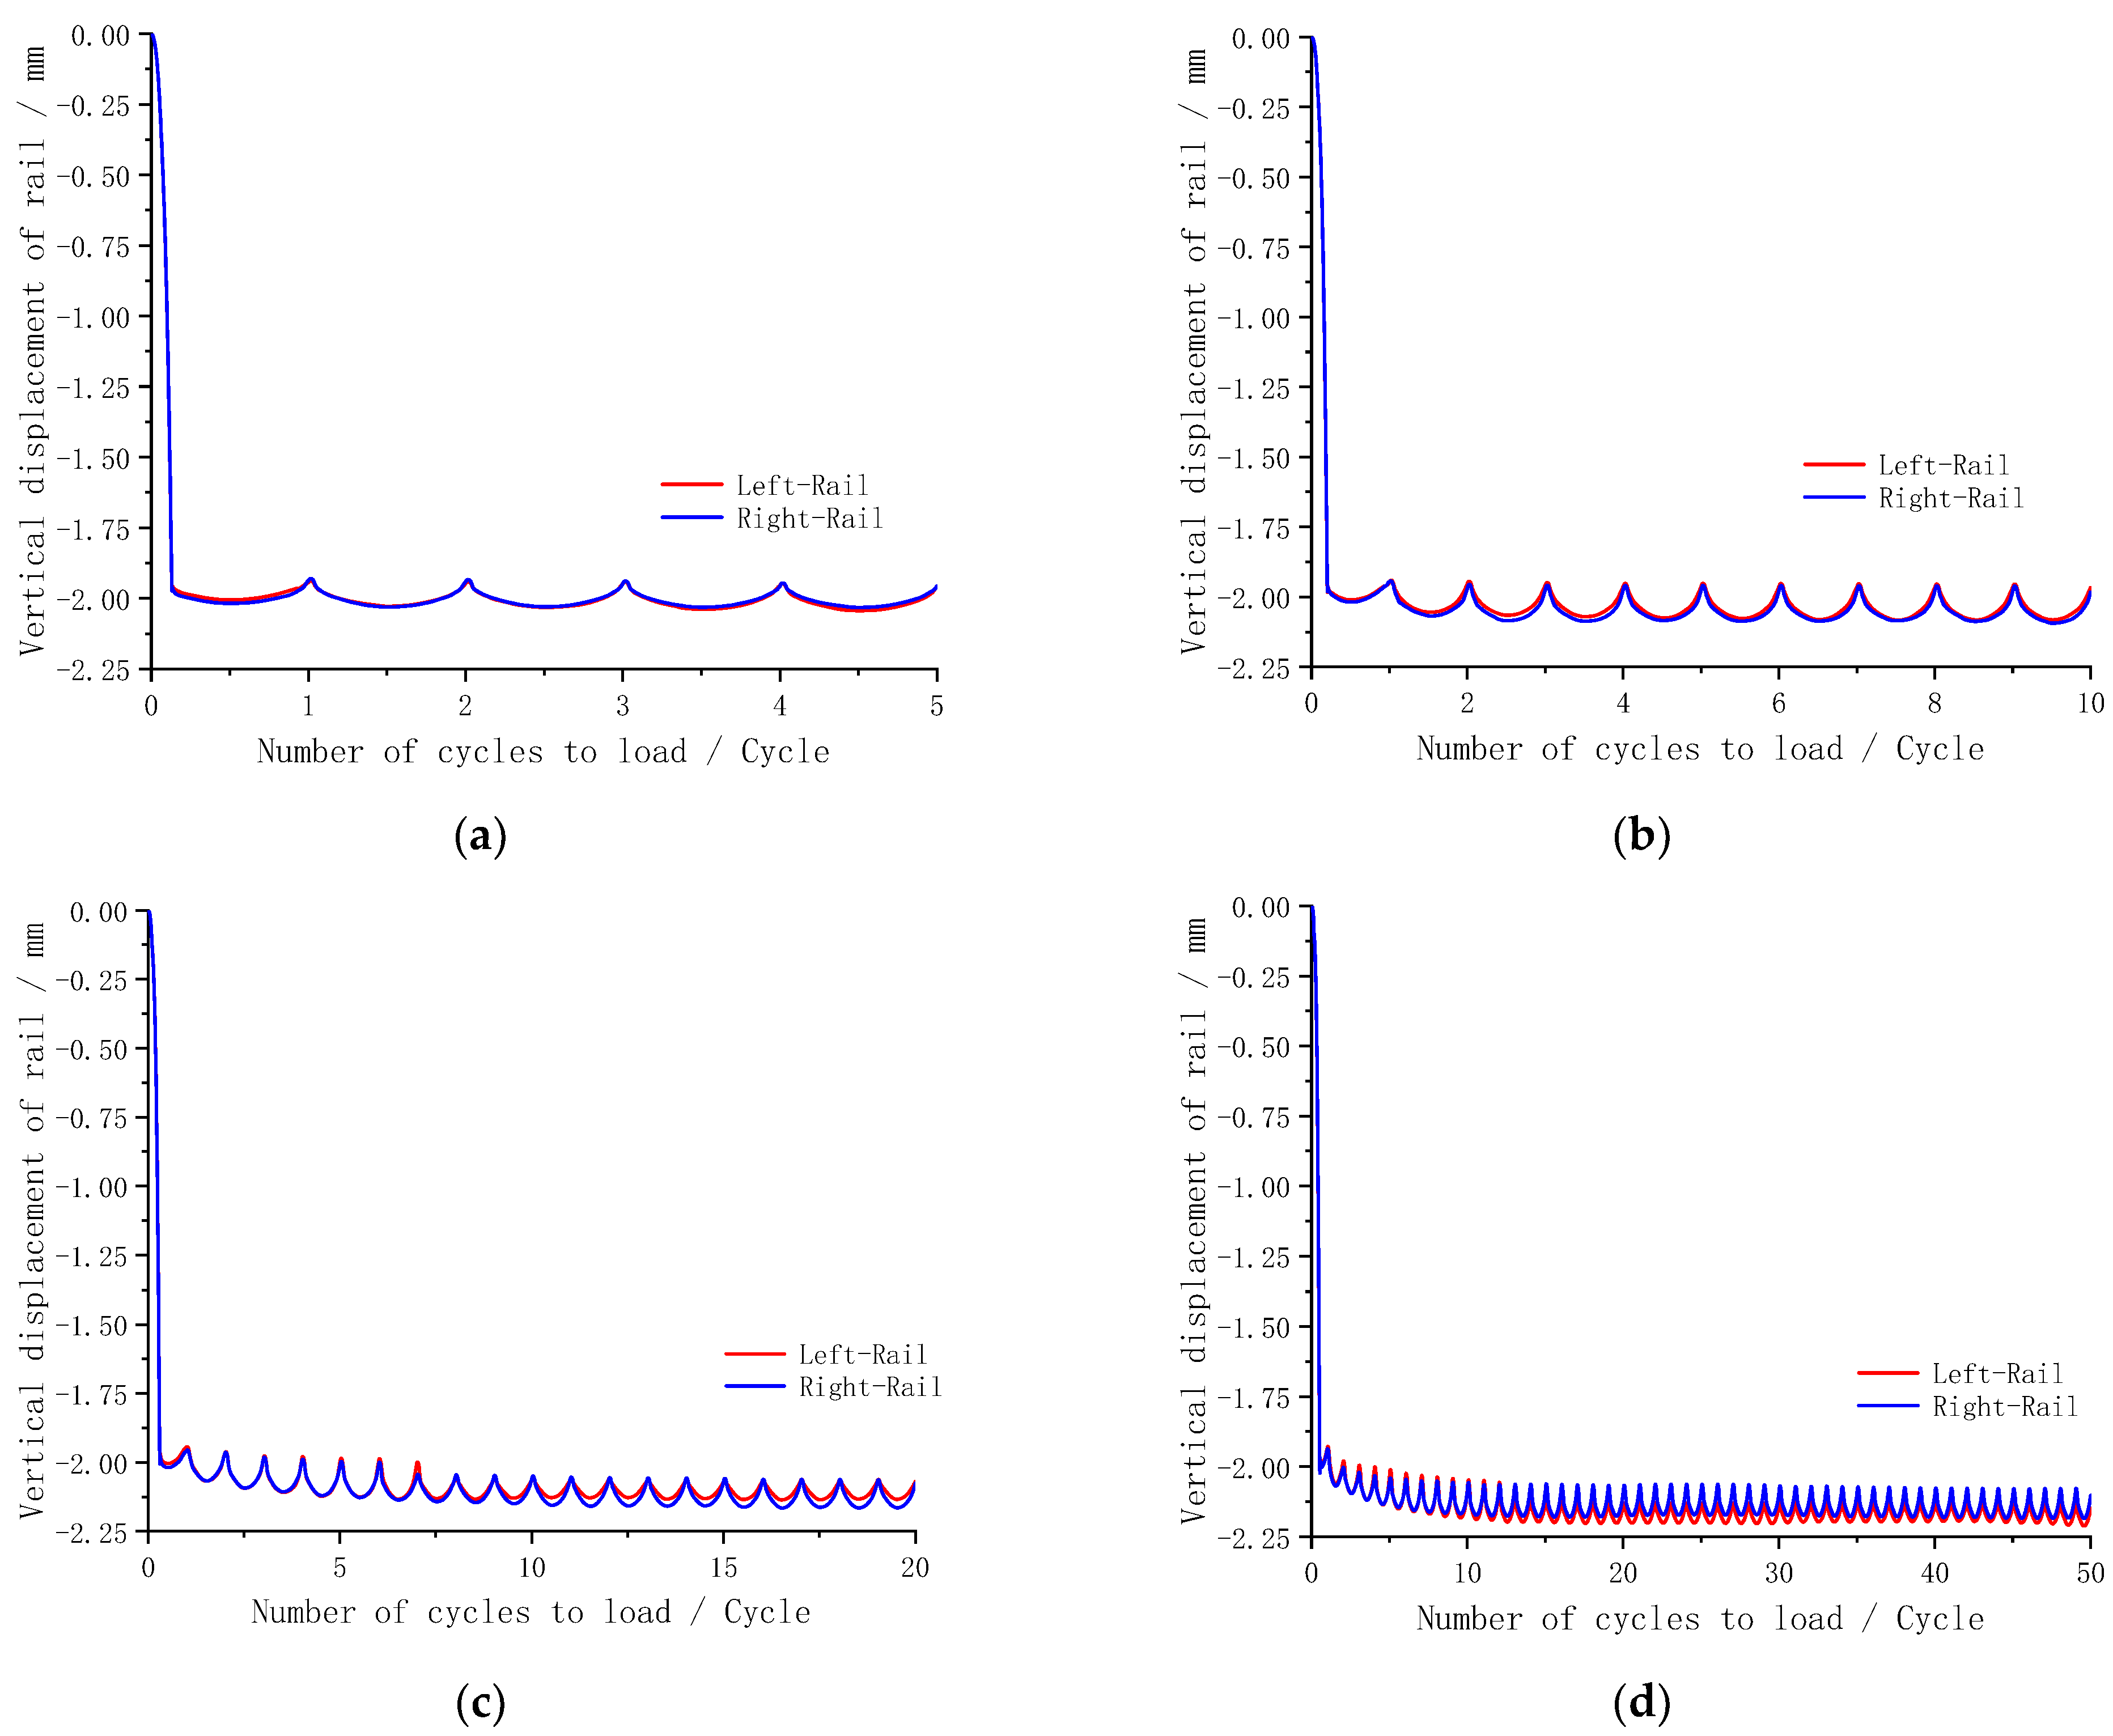
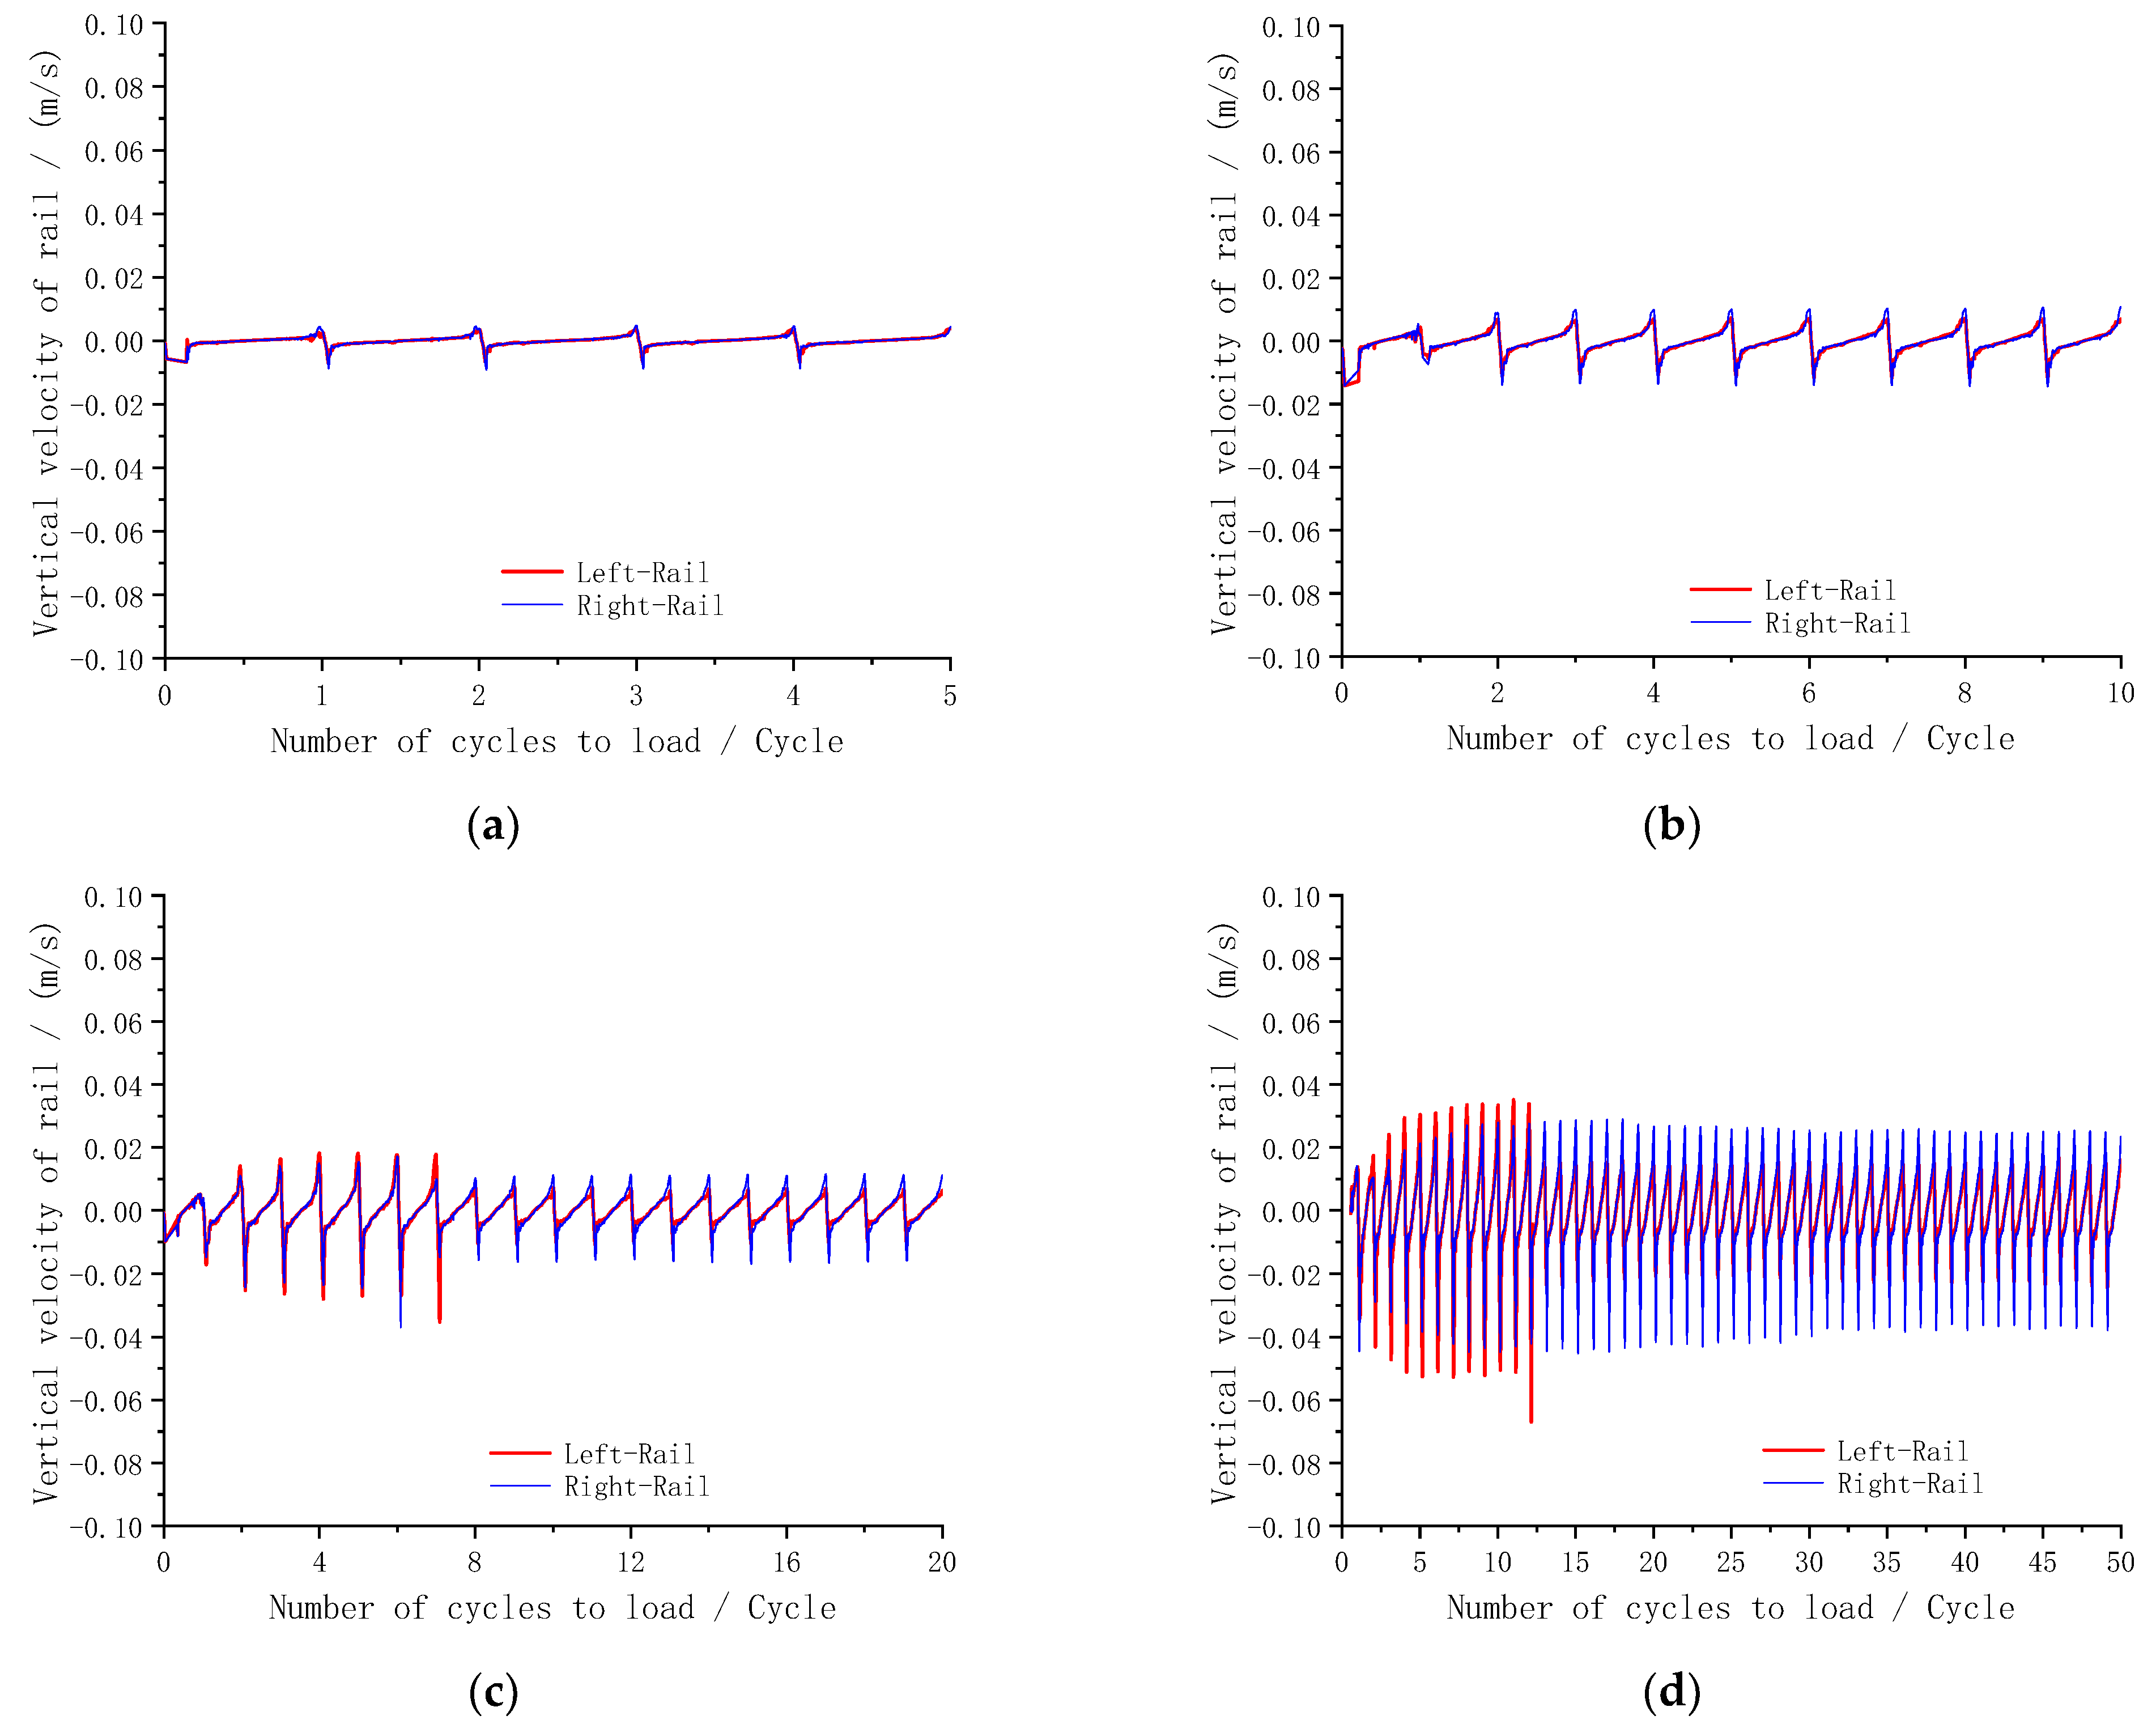
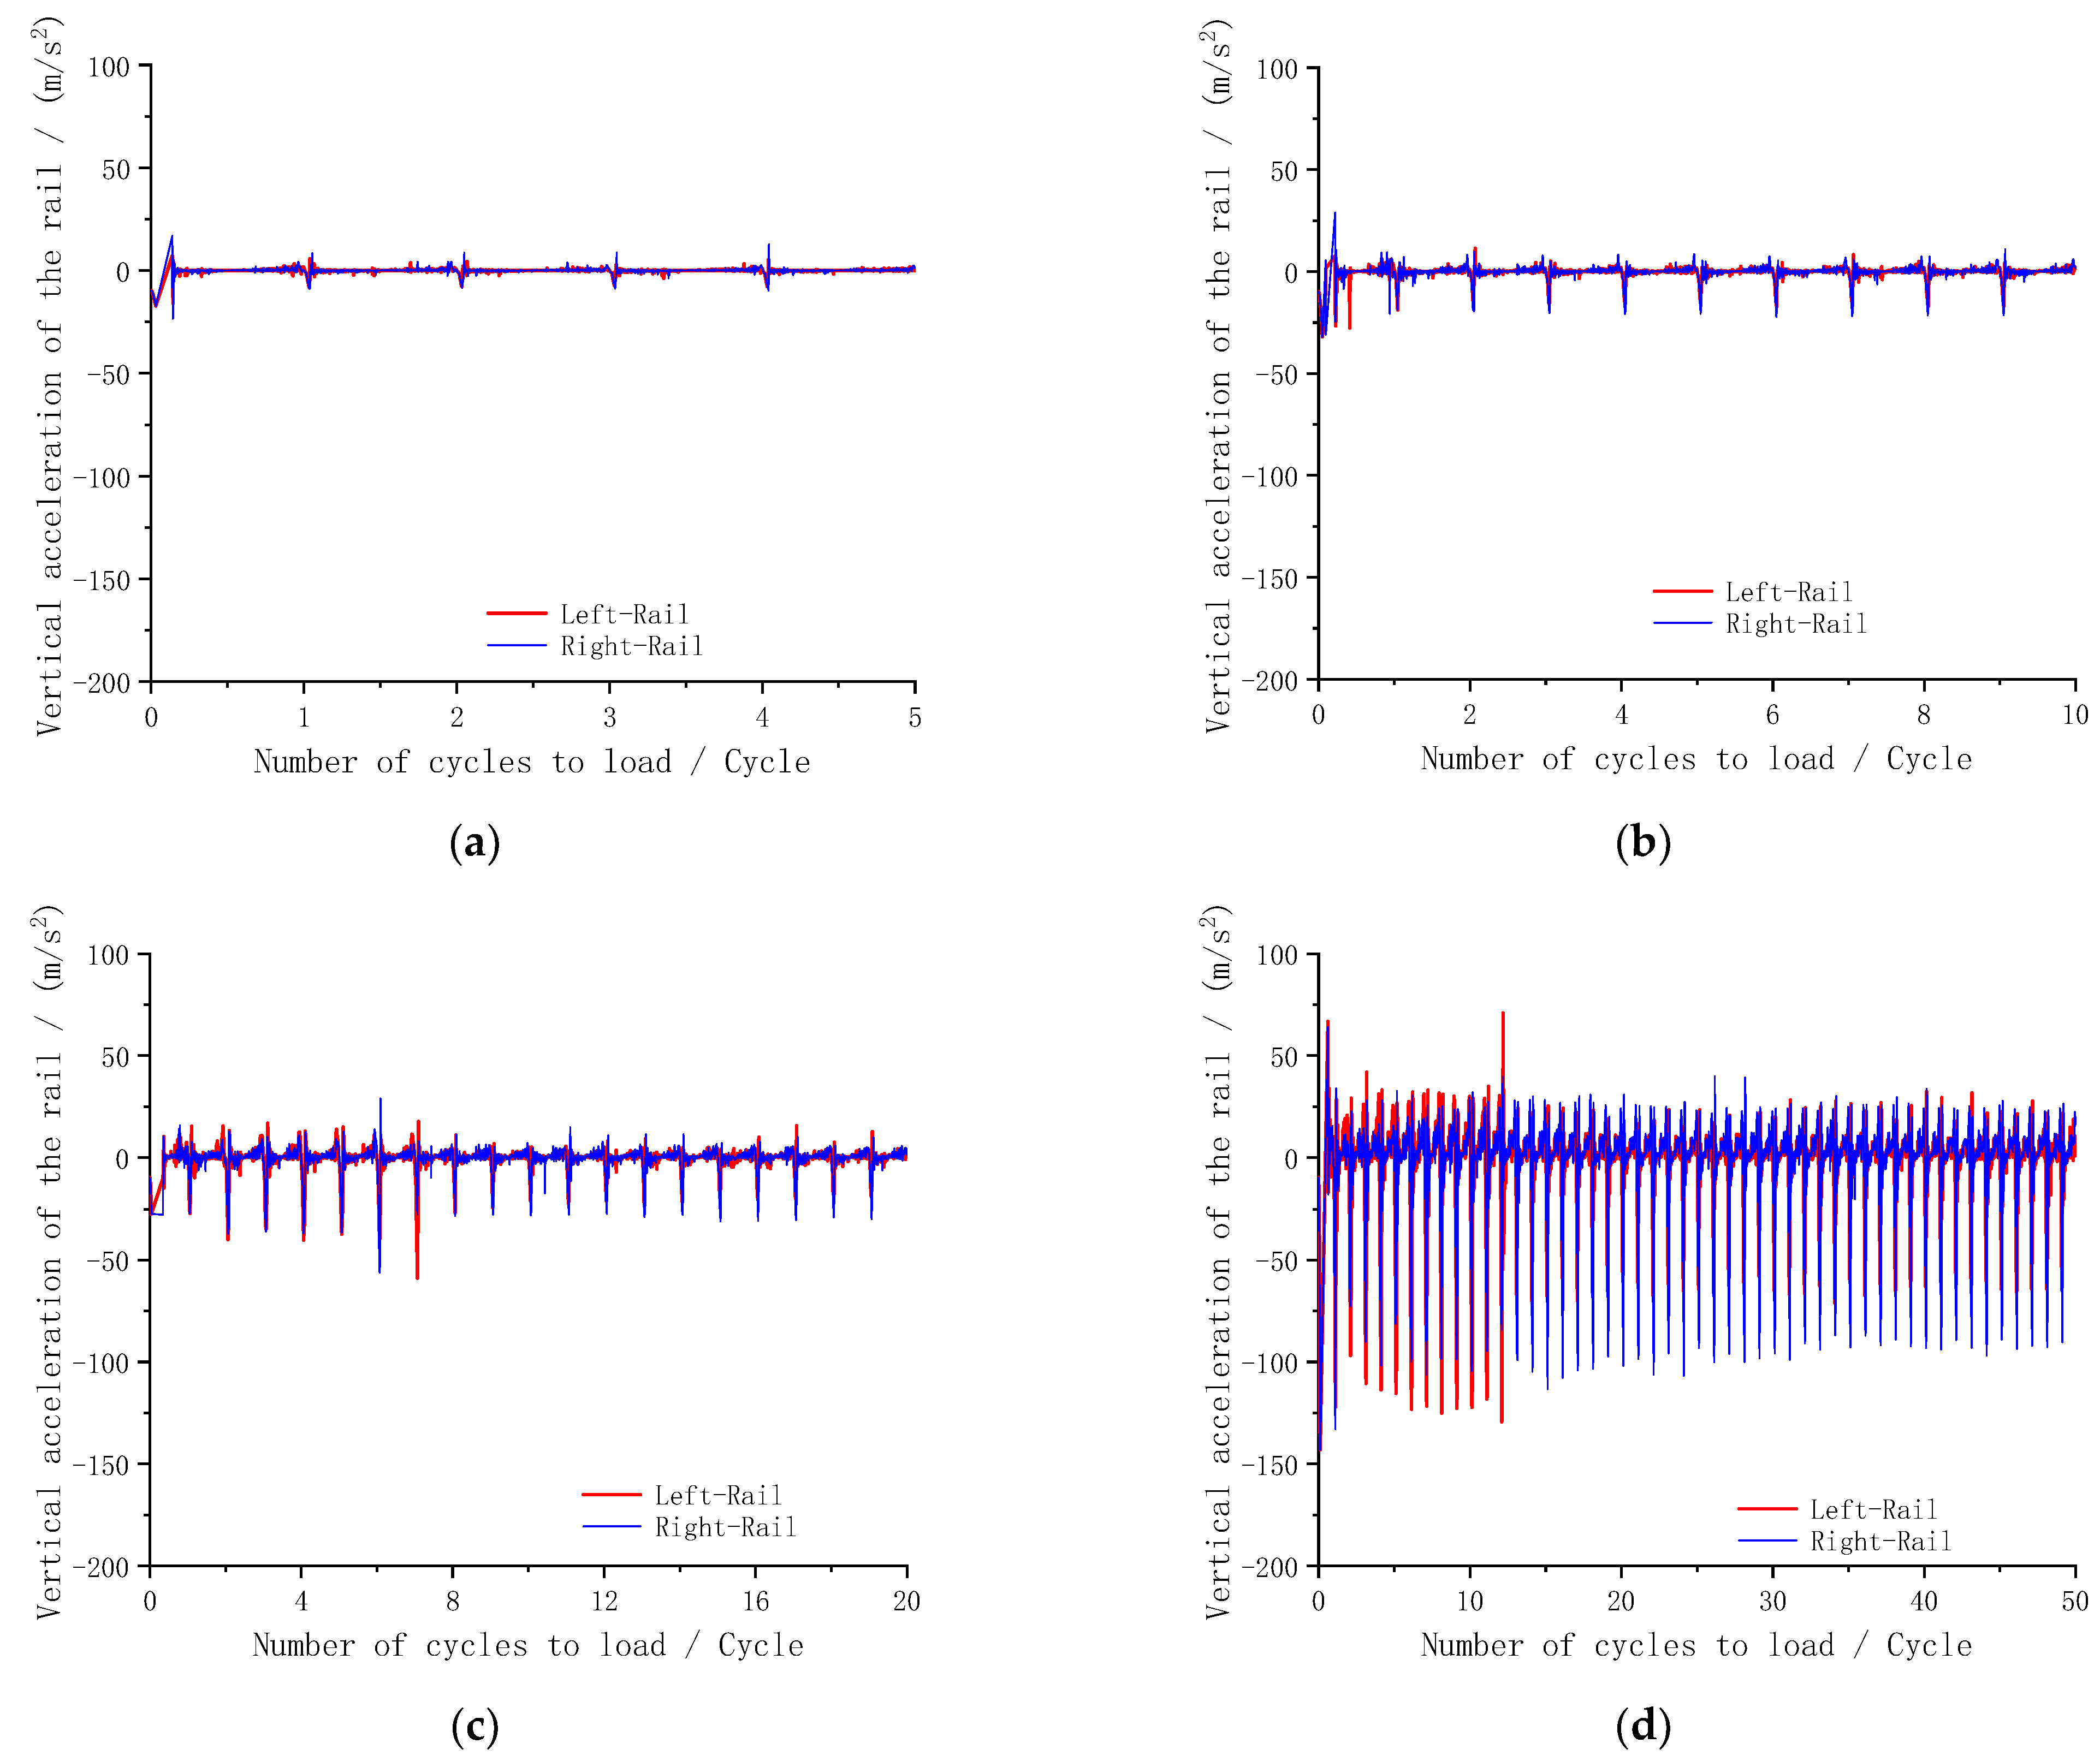
3.4. Influence of Loading Frequency on Rail Dynamic Response

The trainload is transmitted to the sleeper through the rail, so the displacement, velocity, and acceleration of the rail under the action of the cyclic load can reflect the dynamic response of the sleeper to a certain extent. Under the four loading frequencies, the recorded rail displacement, velocity, and acceleration changes with the periodic load are all shown in Figure 12, Figure 13 and Figure 14.
The contact between the rail and the sleeper in the initial state will affect the results of subsequent loading. Therefore, in the discrete element model of the rail-sleeper, the rail and sleeper in the initial state were not in direct contact, and there was a small distance between them to ensure that the contact force of the rail-sleeper in the initial stage was zero. Figure 12 shows that when the rail moved down by approximately 2 mm, the rail and the sleeper were in contact, and the load was transmitted between the two, which led to a large dynamic response due to the sudden contact between the rail and the sleeper in the initial stage. Subsequently, as the cyclic loading progressed, the system gradually reached a steady state. After the interaction between the rail and the sleeper, the vertical displacements of the rail under different working conditions were all within 0.25 mm.
Comparing the vertical displacement curves of the rails under different loading frequencies in Figure 12, it can be seen that the change trends of the left and right rails were the same, the change curves were nearly overlapped, and the vertical displacement change curves of the left and right rails changed periodically with the cyclic load. The vertical displacement of the rail corresponding to 5 Hz was the smallest, approximately 2 mm. The vertical displacement value of the left and right strand rails corresponding to 50 Hz was the largest, close to 2.25 mm. The vertical displacement of the rail increased with the increase in the loading frequency, and the vertical displacement of the rail increased slowly with the increase in the number of cycles until it tended to a stable value.
As shown in Figure 13, it can be seen that when the loading frequency was 5 Hz, the maximum speed of the left and right rails was approximately 0.01 m/s; the maximum rail speed corresponding to a 10 Hz loading frequency was approximately 0.015 m/s; the maximum speed of the left and right rails corresponding to a 20 Hz loading frequency was approximately 0.03 m/s; and the maximum rail speed was 0.04 m/s at a loading frequency of 50 Hz. The velocity changes of the left and right strand rails were similar, with periodic variation with the cyclic load, and the velocity amplitude increased with increasing loading frequency.
Observing the variation of the rail acceleration, it can be seen that when the loading frequencies were 5 Hz, 10 Hz, 20 Hz, and 50 Hz, the corresponding maximum rail accelerations were 20 m/s2, 30 m/s2, 60 m/s2, and 150 m/s2, respectively. The vertical acceleration of the rail changed periodically with cyclic loading.
In summary, under loading frequencies of 5 Hz to 50 Hz, the vertical displacement, maximum velocity, and acceleration amplitude of the rail all increased with increasing loading frequency. This shows that the greater the loading frequency, the greater the increase in the dynamic response of the rail, thereby increasing the interaction force between the rail and the sleeper, which indirectly causes the dynamic response of the sleeper to increase, which in turn increases the possibility of sleeper damage and reduces the service life of the sleeper.

4. Conclusions

In this paper, the discrete element method was used to simulate concrete sleepers. The changes in sleeper displacement, inter-particle contact force, sleeper stress, rail vertical displacement, velocity, and acceleration under four loading frequencies of 5 Hz, 10 Hz, 20 Hz, and 50 Hz were analyzed and studied. The following conclusions are drawn:
(1)
Under the action of cyclic loading, the particle displacement in the center of the sleeper is the smallest, the particles on both sides of the sleeper have a larger displacement, the sleeper particles under the rail have a larger vertical displacement, and the maximum value of vertical displacement increases with increasing loading frequency.
(2)
Under different loading frequencies, the stress peak of the sleeper under the left and right rails is the largest, and the stress peak value of the sleeper center is the smallest. The loading frequency has little effect on the peak stress of the sleeper, and the peak stress of the sleeper under the rail is approximately 0.6 MPa, and the peak stress of the sleeper center is approximately 0.002 MPa.
(3)
The vertical displacement peak, vertical velocity peak, and vertical acceleration peak value of the rail increase with increasing loading frequency, indicating that the greater the loading frequency, the greater the dynamic response of the rail, thereby increasing the dynamic response of the sleeper.

Author Contributions

Conceptualization, X.C., N.C. and W.W.; methodology, X.C.; software, N.C.; validation, X.C., N.C. and Z.W.; formal analysis, X.Z.; investigation, X.C., N.C. and F.Y.; resources, F.Y., H.Z., M.Y. and W.W.; writing—original draft preparation, N.C.; writing—review and editing, X.C. and Z.W.; project administration, H.Z.; data curation, M.Y. All authors have read and agreed to the published version of the manuscript.

Funding

This research was funded by Projects (51478482) supported by the National Natural Science Foundation of China; Projects (N2019G012) supported by the China National Railway Group Co., Ltd. Science and Technology Research and Development Plan; Projects (K2019G043) supported by the China National Railway Group Co., Ltd.; and Science and Technology Research and Development Plan (K2021G026) supported by the National Railway Group Technology Research and Development Plan.

Institutional Review Board Statement

Not applicable.

Informed Consent Statement

Not applicable.

Data Availability Statement

Not applicable.

Conflicts of Interest

The authors declare no conflict of interest. The authors declare no potential conflicts of interest with respect to the research, authorship, and/or publication of this article.

References

  1. Zhang, J.; Wu, C.H.; Xiao, X.B.; Wen, Z.F.; Jin, X.S. The influence of sleeper empty hanging on the dynamic performance of sleepers. J. Southwest Jiaotong Univ. 2010, 45, 203–208. [Google Scholar]
  2. Zhu, J.Y.; Zhang, Y. The influence of sleeper suspension on the dynamic performance of track structure. China Railw. Sci. 2011, 32, 8–15. [Google Scholar]
  3. Cui, X.H.; Xiao, H.; Xiao, H.J.; Ma, C.Z. Discrete element analysis of the influence of empty sleepers on the dynamic characteristics of ballast bed. J. Vib. Shock. 2020, 39, 171–179. [Google Scholar]
  4. Yan, D.W. Research on the Effect of Trackbed Compaction on the Mechanical Properties of Wide Sleeper Track. Master’s Thesis, Beijing Jiaotong University, Beijing, China, 2021. [Google Scholar]
  5. Du, W.B. Analysis of Sleeper Mechanical Characteristics Based on Digital Image Correlation Technology and Finite Element. Master’s Thesis, Beijing Jiaotong University, Beijing, China, 2021. [Google Scholar]
  6. Cui, X.H.; Xiao, H. Analysis of the mechanical characteristics of elastic sleepers based on PFC-FLAC coupling. J. China Railw. Soc. 2021, 43, 144–152. [Google Scholar]
  7. Guo, Y.L.; Wang, X.Y.; Lian, D.; Wan, H.Y.; Jing, G.Q. Research on lateral resistance of friction sleeper trackbed on Sichuan-Tibet Railway. J. Southwest Jiaotong Univ. 2014, 40, 1000–1005. [Google Scholar]
  8. Farnam, S.M.; Rezaie, F. Simulation of crack propagation in prestressed concrete sleepers by fracture mechanics. Eng. Fail. Anal. 2019, 96, 109–117. [Google Scholar] [CrossRef]
  9. Jokubaitis, A.; Valivonis, J.; Marciukaitis, G. Analysis of strain state and cracking of concrete sleepers. J. Civ. Eng. Manag. 2016, 22, 564–572. [Google Scholar] [CrossRef] [Green Version]
  10. Tran, L.H.; Hoang, T.; Duhamel, D.; Foret, G.; Messad, S.; Loaëc, A. Influence of Non-Homogeneous Foundations on the Dynamic Responses of Railway Sleepers. Int. J. Struct. Stab. Dyn. 2021, 21, 1–17. [Google Scholar] [CrossRef]
  11. Van, B.A. A simplified method for calculating load distribution and rail deflections in track, incorporating the influence of sleeper stiffness. Adv. Struct. Eng. 2020, 23, 2358–2372. [Google Scholar]
  12. You, R.; Goto, K.; Ngamkhanong, C.; Kaewunruen, S. Nonlinear finite element analysis for structural capacity of railway prestressed concrete sleepers with rail seat abrasion. Eng. Fail. Anal. 2019, 95, 47–65. [Google Scholar] [CrossRef] [Green Version]
  13. Silva, R.; Silva, W.; De, F.J.Y.; Santos, M.A.A.; Neiva, L.O. Experimental and Numerical Analyses of the Failure of Prestressed Concrete Railway Sleepers. Materials 2020, 13, 1704. [Google Scholar] [CrossRef] [PubMed] [Green Version]
  14. Chen, C.; Tang, Z.A.; Rui, R.; Zhang, L.; Zhu, C.X. Research on the degradation and dynamic characteristics of traditional sleepers and new X sleepers under the track bed. J. Beijing Jiaotong Univ. 2021, 45, 117–124. [Google Scholar]
  15. Fang, R.; Xiao, X.B.; Fang, J.Y.; Jin, X.S. The influence of track structure parameters on the vibration characteristics of rails and sleepers. J. Railw. Soc. 2011, 33, 71–76. [Google Scholar]
  16. GB/T 37330-2019; Ballasted Track Sleepers, Concrete Sleepers. China Standard Press: Beijing, China, 2019.
  17. Guo, Y.; Zhao, C.; Markine, V.; Jing, G.; Zhai, W. Calibration for discrete element modelling of railway ballast: A review. Transp. Geotech. 2020, 23, 1–22. [Google Scholar] [CrossRef]
  18. TB 10002.3-2005; Design Code for Reinforced Concrete and Prestressed Concrete Structures of Railway Bridges and Culverts. China Railway Press: Beijing, China, 2005.
  19. Guo, Y.; Shi, C.; Zhao, C.; Markine, V.; Jing, G. Numerical analysis of train-track-subgrade dynamic performance with crumb rubber in ballast layer. Constr. Build. Mater. 2022, 336, 127559. [Google Scholar] [CrossRef]
  20. Wang, T.C.; Zhao, H.L.; Hao, J.J.; Zu, J.Q. Research on Compressive Stress-Strain Relationship of Fiber Reinforced Concrete. In Proceedings of the International Conference on Structures and Building Materials, Guangzhou, China, 7–9 January 2011; pp. 384–392. [Google Scholar]
  21. Jing, G.Q.; Feng, K.; Gao, L.; Wang, J. Discrete element simulation of ballast fracture and aging under cyclic loading. J. Southwest Jiaotong Univ. 2012, 47, 187–191. [Google Scholar]
  22. Zhang, Z.H.; Xiao, H.; Cui, X.H.; Yan, D.W. Establishment of multi-scale model and analysis of mechanical characteristics of wind-sand railway trackbed. J. Cent. South Univ. 2021, 52, 635–647. [Google Scholar]
  23. Liu, G.; Luo, Q.; Zhang, L.; Chen, H.; Chen, J. Analysis of dynamic stress characteristics of ballastless track subgrade under train load. J. China Railw. Soc. 2013, 35, 86–93. [Google Scholar]
  24. Wang, Q.Y.; Wei, X.X.; Zhang, B.Q.; Lin, H.M.; Xiao, N.X.; Luo, C.S. Experimental study on cumulative deformation of coarse-grained soil filler under high-speed train load. J. China Railw. Soc. 2021, 43, 149–157. [Google Scholar]
  25. Wu, B.; Liu, B.; Zeng, Z.P.; Wei, W. Experimental study on wheel-rail vertical force under different axle load trains. J. Railw. Sci. Eng. 2018, 15, 319–327. [Google Scholar]
Figure 1. Examples of sleeper cracks. (a) sleeper crack-1. (b) sleeper crack-2.
Applsci 12 07245 g001
Figure 2. The initial discrete element model of the concrete sample. (a) 1 mm particle size. (b) 5 mm particle size.
Applsci 12 07245 g002
Figure 3. Stress–strain curve of concrete specimen.
Applsci 12 07245 g003
Figure 4. Contact force cloud diagram of concrete specimen. (a) 1 mm particle size. (b) 5 mm particle size.
Applsci 12 07245 g004
Figure 5. Displacement cloud diagram of concrete specimen after compression. (a) 1 mm particle size. (a1) Full displacement. (a2) X direction—lateral displacement. (a3) Y direction—vertical displacement. (b) 5 mm particle size. (b1) Full displacement. (b2) X direction—lateral displacement. (b3) Y direction—vertical displacement.
Applsci 12 07245 g005aApplsci 12 07245 g005b
Figure 6. Steel-sleeper two-dimensional discrete element initial model diagram.
Applsci 12 07245 g006
Figure 7. Loading curve of rail-sleeper discrete element model. (a) 5 Hz. (b) 10 Hz. (c) 20 Hz. (d) 50 Hz.
Applsci 12 07245 g007
Figure 8. Sleeper-displacement cloud map corresponding to the same number of cycles at different loading frequencies. (a) 5 Hz. (b) 10 Hz. (c) 20 Hz. (d) 50 Hz.
Applsci 12 07245 g008
Figure 9. Vertical displacement cloud diagram of sleepers corresponding to different loading frequencies. (a) 5 Hz. (b) 10 Hz. (c) 20 Hz. (d) 50 Hz.
Applsci 12 07245 g009
Figure 10. Relationship between the maximum contact force of the particles and the loading frequency.
Applsci 12 07245 g010
Figure 11. Distribution of stress in sleeper. (a) 5 Hz. (b) 10 Hz. (c) 20 Hz. (d) 50 Hz.
Applsci 12 07245 g011
Figure 12. The vertical displacement curve of the rail. (a) 5 Hz. (b) 10 Hz. (c) 20 Hz. (d) 50 Hz.
Applsci 12 07245 g012
Figure 13. The vertical speed change curve of the rail. (a) 5 Hz. (b) 10 Hz. (c) 20 Hz. (d) 50 Hz.
Applsci 12 07245 g013
Figure 14. The vertical acceleration curve of the rail. (a) 5 Hz. (b) 10 Hz. (c) 20 Hz. (d) 50 Hz.
Applsci 12 07245 g014
Table 1. Micromechanical parameters of the discrete element model.
Parameter NameValue
Sleeper density/(kg·m−3)2500
Normal bond stiffness between the particles inside the sleeper/(N·m−1)3.0 × 108
Tangential bond stiffness between particles in sleepers/(N·m−1)3.0 × 108
Tensile strength of particles inside sleepers/Pa3.5 × 106
Bond strength between particles inside sleeper/(N·m−2)1.0 × 1010
Normal contact stiffness between rail and sleeper/(N·m−1)3.0 × 108
Tangential contact stiffness between rail and sleeper/(N·m−1)3.0 × 108
Poisson’s ratio of sleepers0.2
Poisson’s ratio of rail0.3
Friction coefficient of the sleeper0.7
Friction coefficient of the rail0.5
Publisher’s Note: MDPI stays neutral with regard to jurisdictional claims in published maps and institutional affiliations.

