
Mosar: Efficiently Characterizing Both Frequent and Rare Motifs in Large Graphs

Abstract
:1. Introduction
2. Related Work
3. Problem Formulation
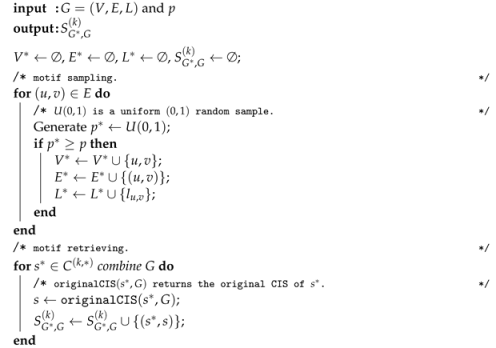
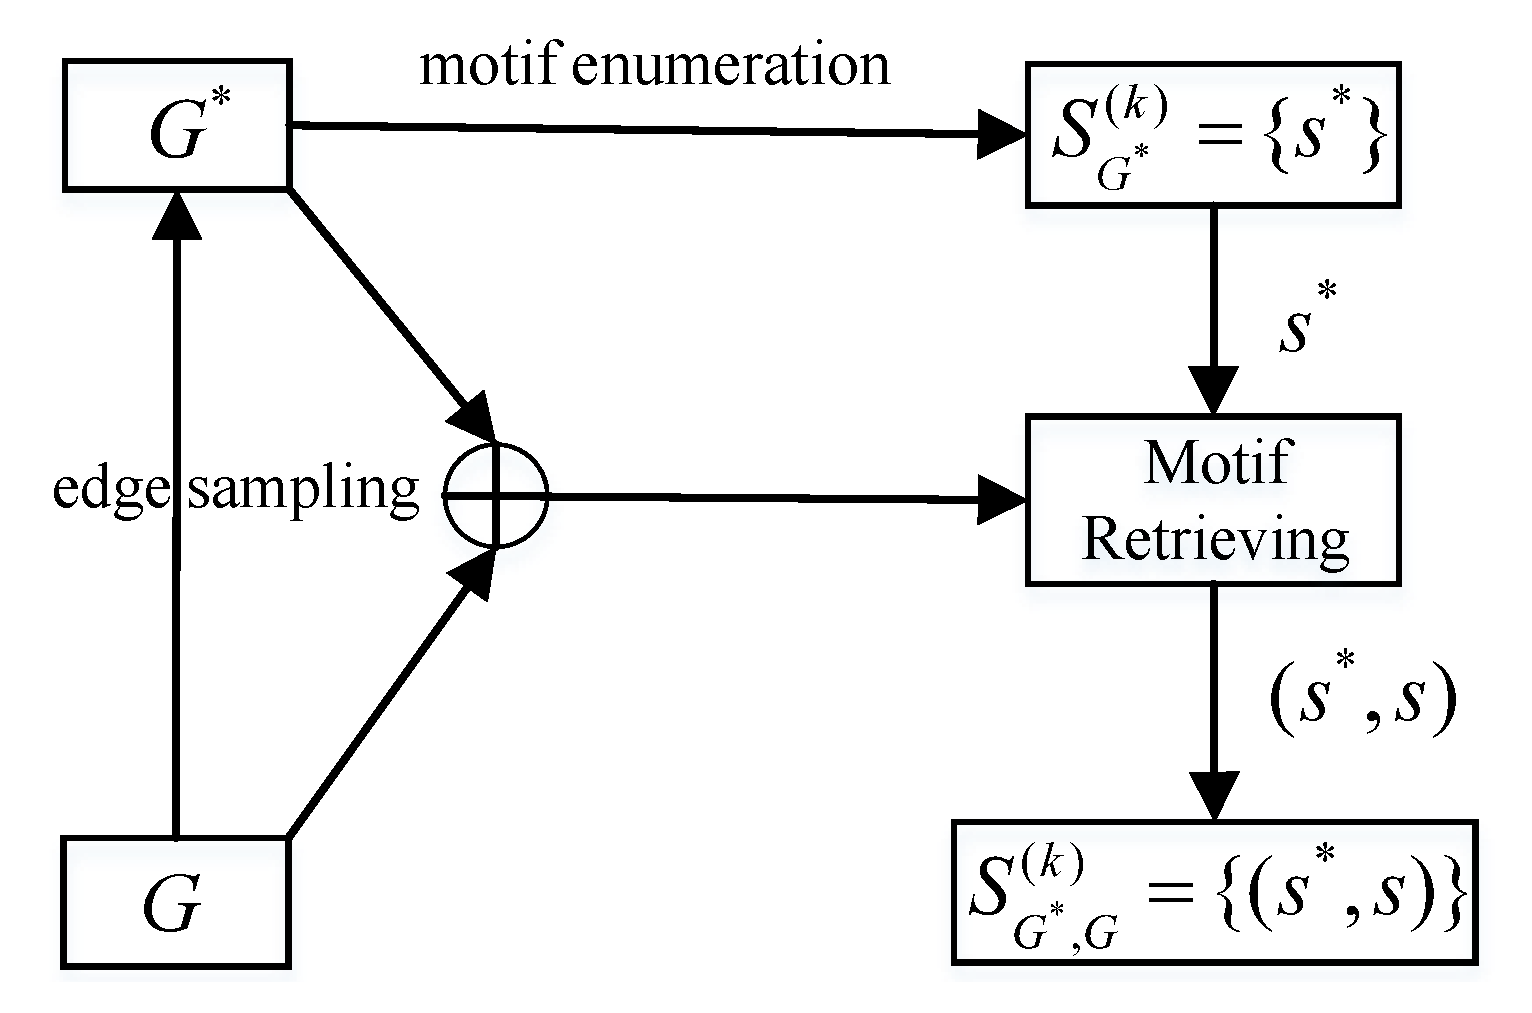
4. Motif Sampling and Retrieving
4.1. Sampling Motifs over G
| Algorithm 1: The pseudocode of Mosar. |
 |
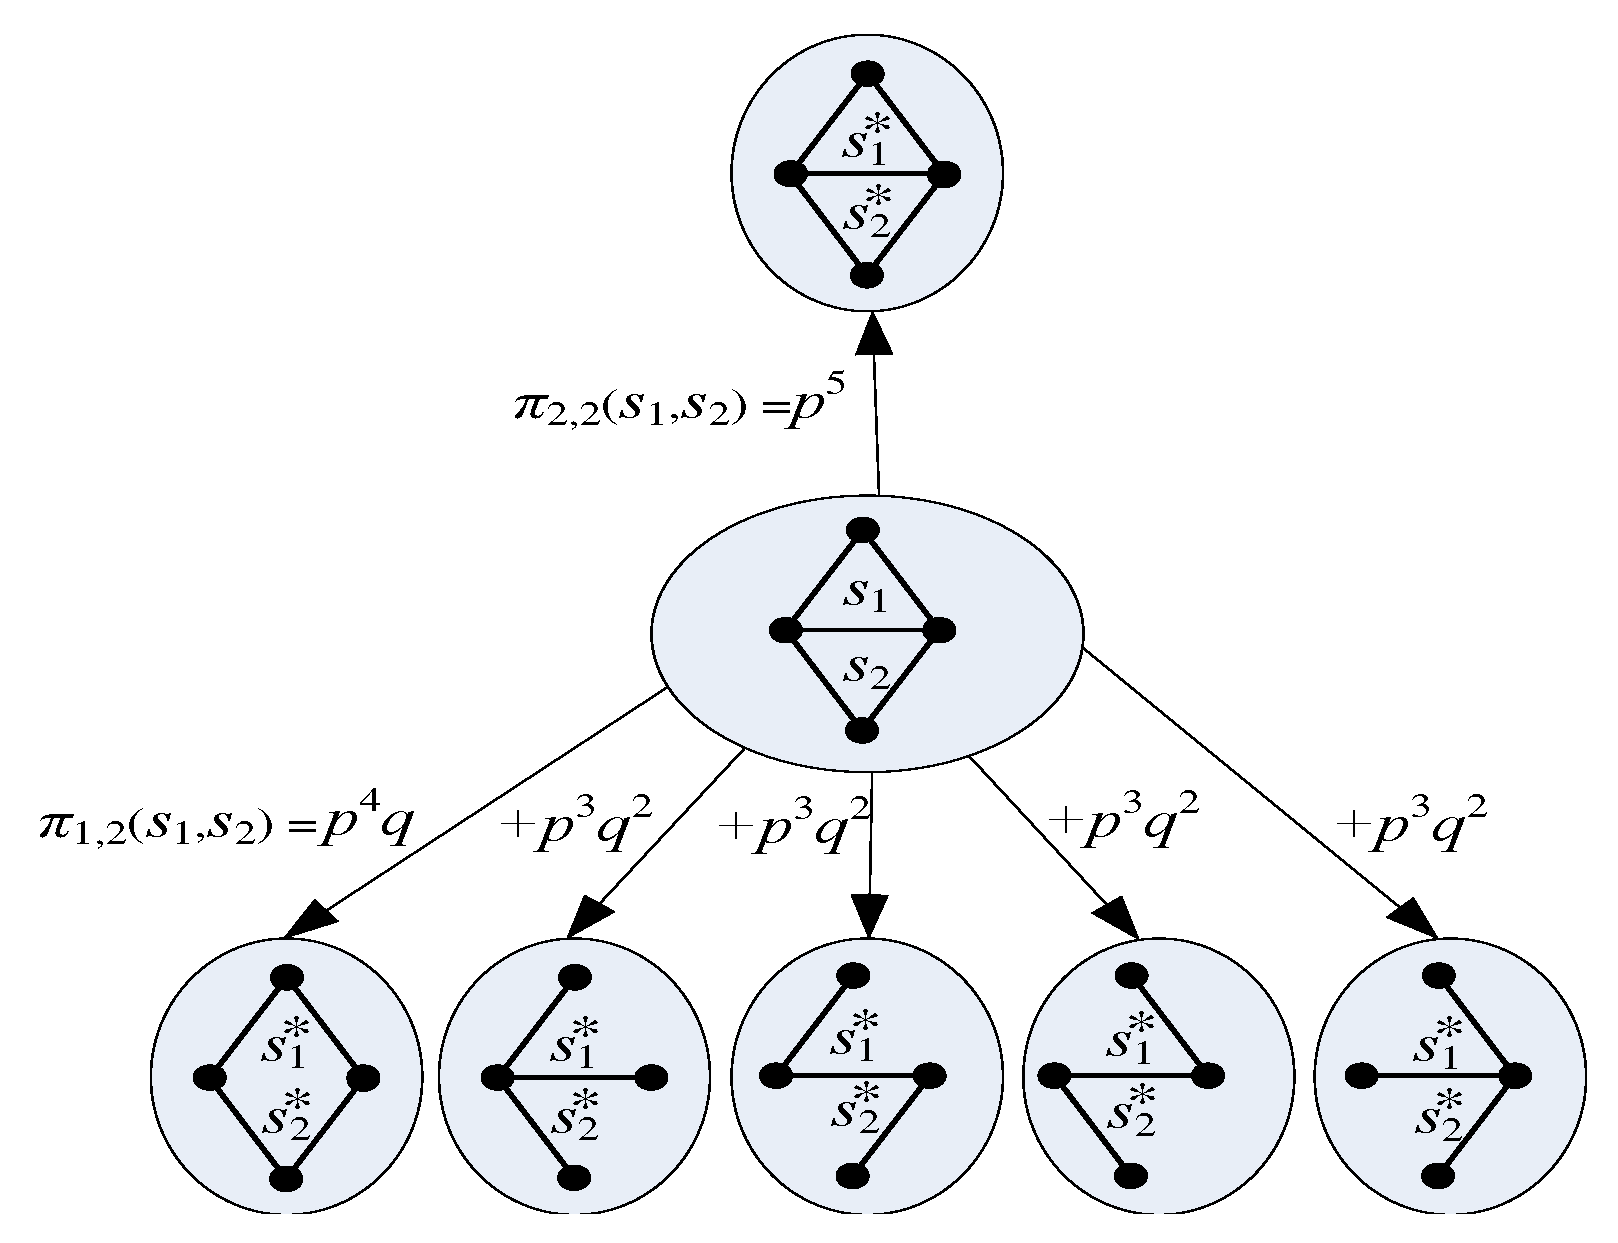
4.2. Probabilistic Model of Mosar
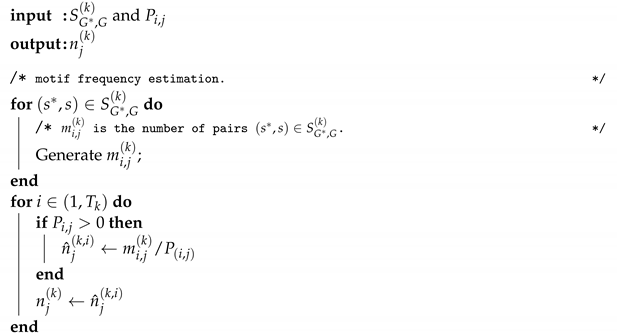
4.3. Motif Frequency Estimation
| Algorithm 2: The pseudocode for Motif Frequency Estimation. |
 |
4.4. Discussion
5. Data Evaluation
5.1. Datasets
- Online social networks: Flickr [22], Pokec [44], LiveJournal [44], YouTube [22], soc-Epinions1 [11], and soc-Slash-dot08 [10]. Flickr, LiveJournal, and YouTube are popular photo, blog, and video sharing websites, respectively, where a user can subscribe to other user updates such as photos, blogs, and videos. Pokec is the most popular online social network in Slovakia, and has been in existence for more than ten years. These networks can be represented by directed graphs, where nodes represent users and a directed edge from node u to node v indicates that user u subscribes to user v or user u tags user v as a friend. Soc-Epinions1 [11] is a directed graph of the Epinions website in 2003, where a directed edge from node u to node v indicates that user u trusts user v. Soc-Slashdot08 and Soc-Slashdot09 [10] are graphs of the technology-related news website Slashdot released in 2008 and 2009, respectively, where the edge between node u and node v means that user u has marked user v as a friend.
- Web graph: Web-Google [46]. The Web-Google dataset was released in 2002 by Google as a part of a Google Programming Contest; nodes represent web pages and directed edges represent hyperlinks between them.
- Signed networks: sign-Epinions, sign-Slashdot08, and sign-Slashdot09 [47]. Epinions and Slashdot networks can be represented by a signed graph, where a positive edge from user u to user v means that u trusts v in the Epinions website or u marks v as a friend on the Slashdot website. A negative edge from u to v means a distrust relationship on the Slashdot website or that u tags user v as a foe on the Epinions website.
- Collaboration networks: ca-HepTh [50], ca-GrQc [50], and ca-CondMat [50]. arXiv is an online repository of electronic preprints of scientific papers in many fields, such as mathematics, physics, and computer science. The datasets ca-GR-QC, ca-HEP-TH, and ca-CondMat consist of arXiv e-prints and cover scientific collaborations between authors of papers submitted to the General Relativity and Quantum Cosmology category, the High-Energy Physics—Theory category, and the Condensed Matter category, respectively [50]. These networks can all be represented by undirected graphs. If author u co-authored a paper with author v, the graph contains an undirected edge from u to v.
- Peer-to-peer network: p2p-Gnutella08 [49]. Gnutella is a peer-to-peer file sharing network. Nodes in the p2p-Gnutella08 dataset represent users in the Gnutella network and edges represent connections between Gnutella users.
- Communication network: Wiki-Talk [45]. Wikipedia is a free encyclopedia written collaboratively by volunteers around the world. Each registered user has a talk page that she/he and other users can edit in order to communicate and discuss updates to various articles on Wikipedia. Nodes in the Wiki-Talk dataset represent registered users on Wikipedia and a directed edge from node u to node v indicates that user u at least once edited a talk page of user v.
- Product network: com-Amazon [48]. The dataset was collected by crawling the Amazon website based on the Amazon website’s “Customers Who Bought This Item Also Bought” feature. If a product u is frequently co-purchased with product v, the graph contains an undirected edge from u to v.
5.2. Error Metric
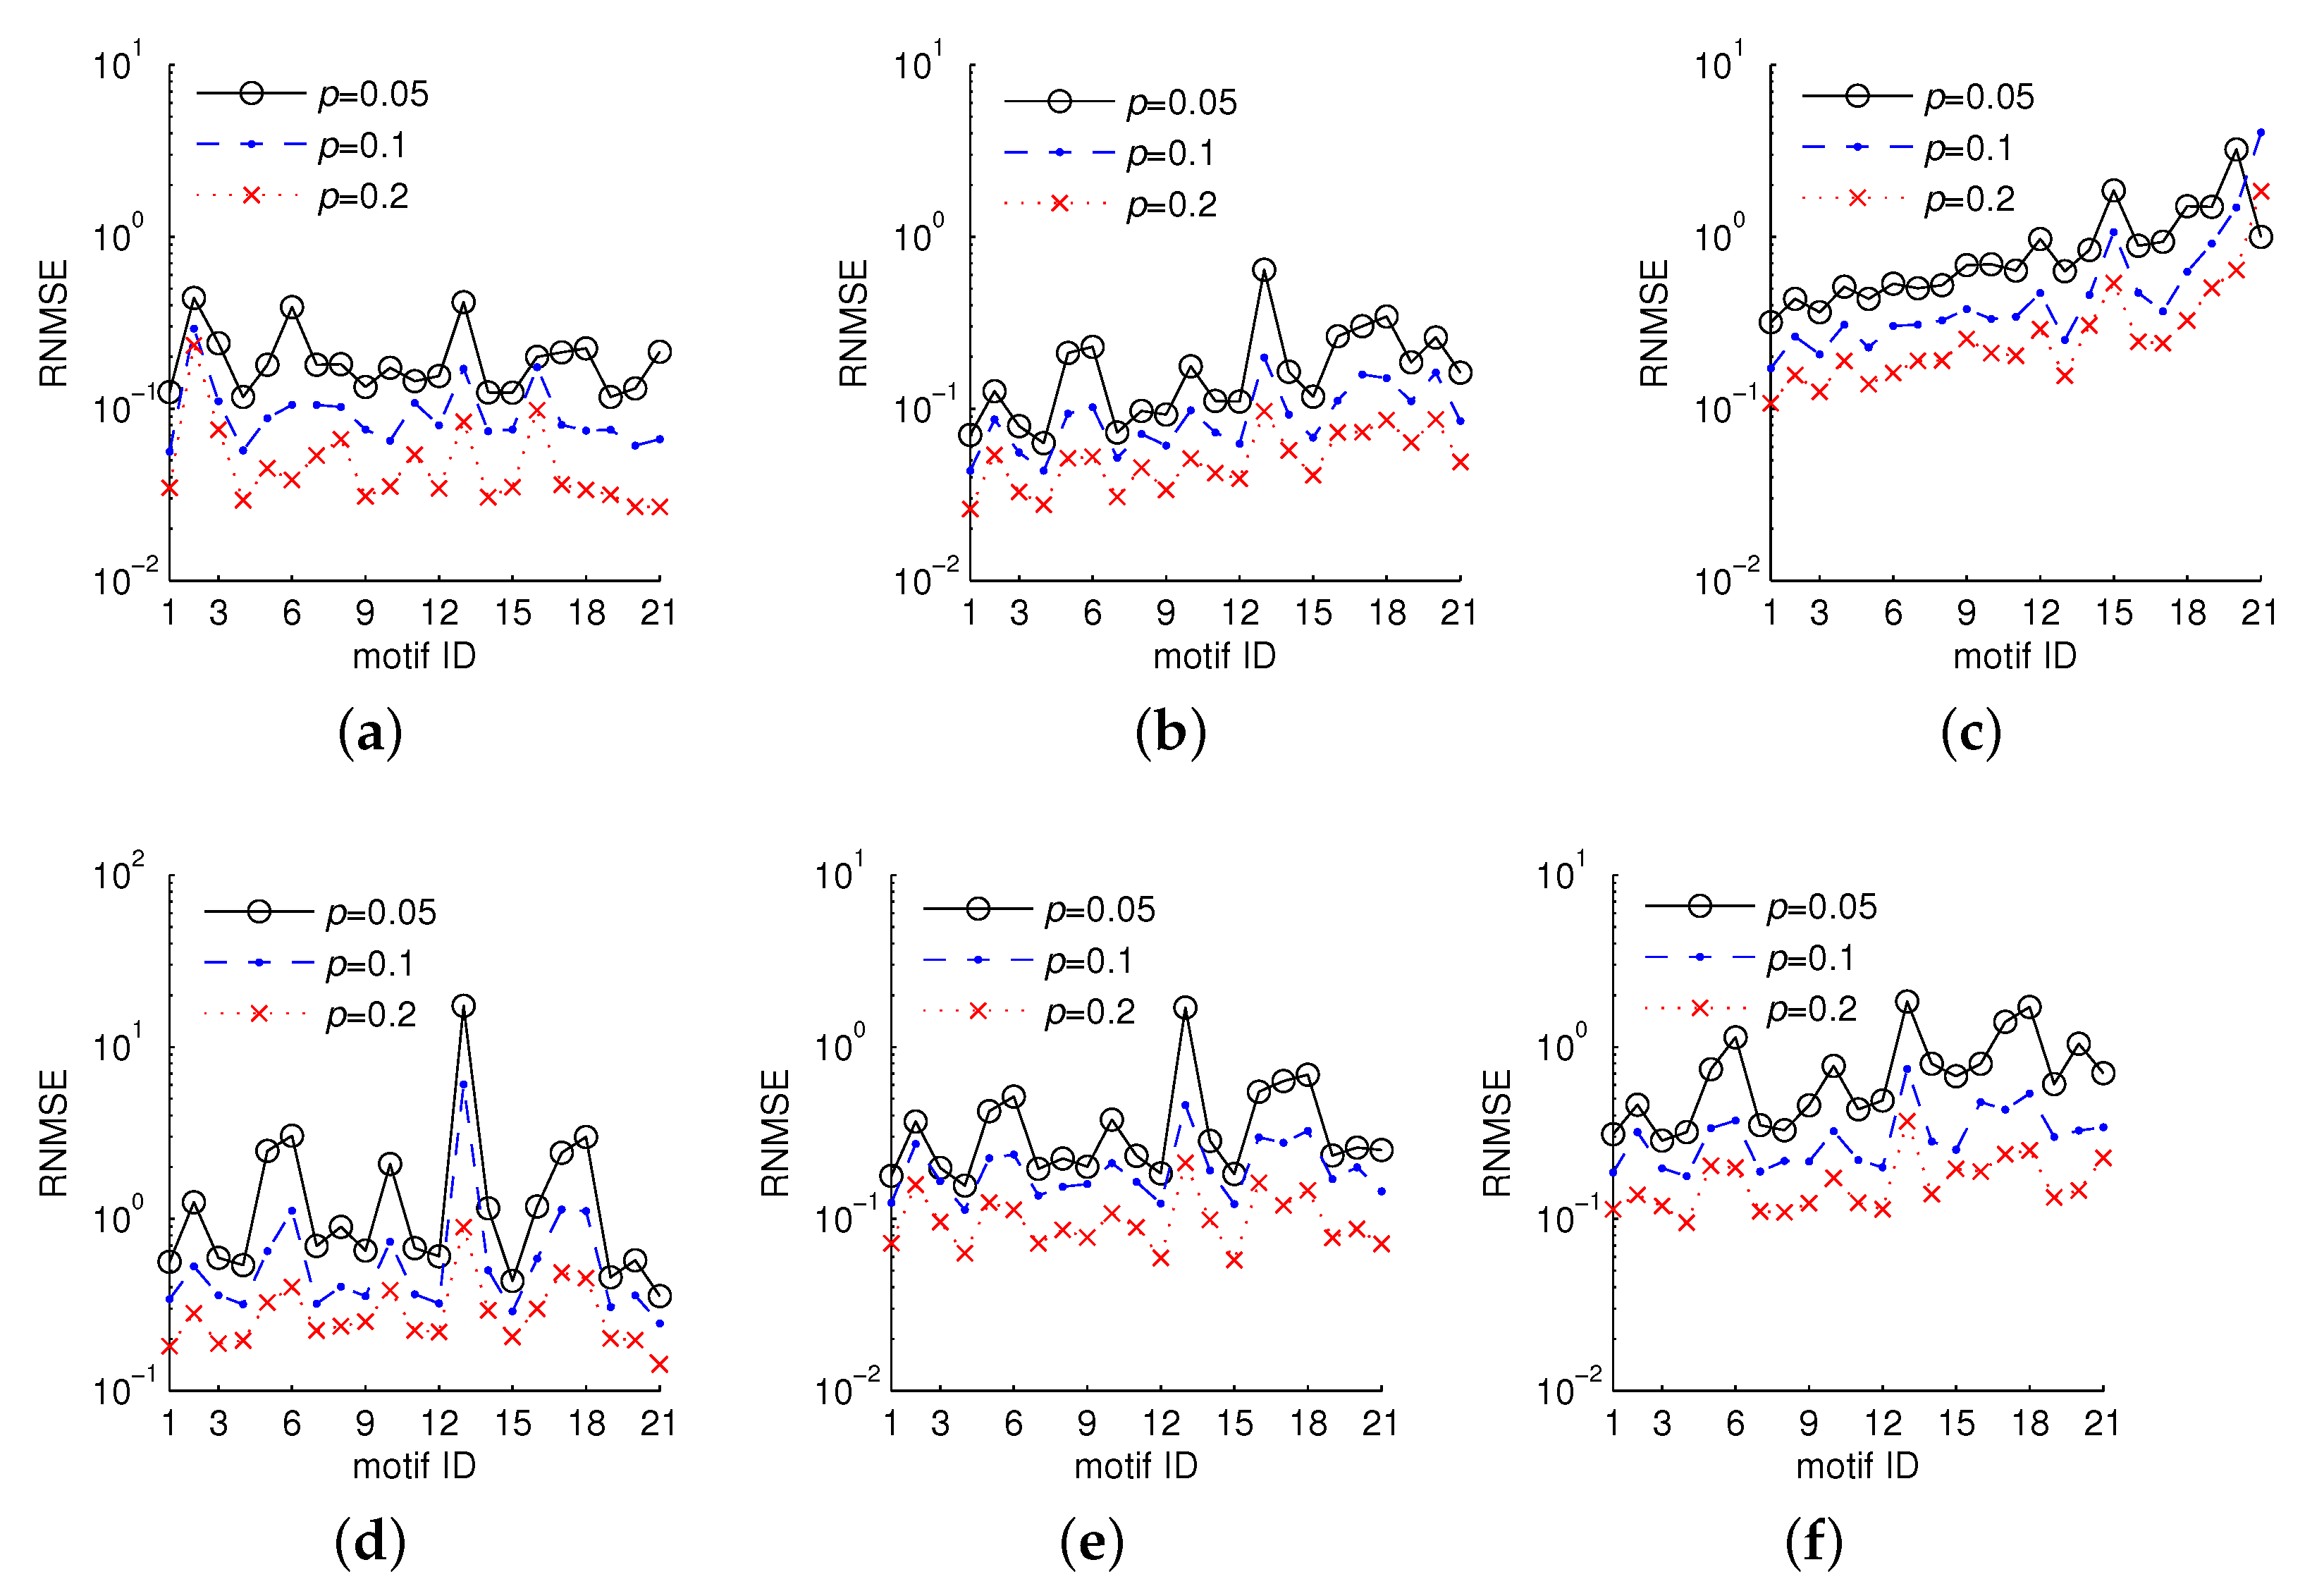
5.3. Accuracy Results
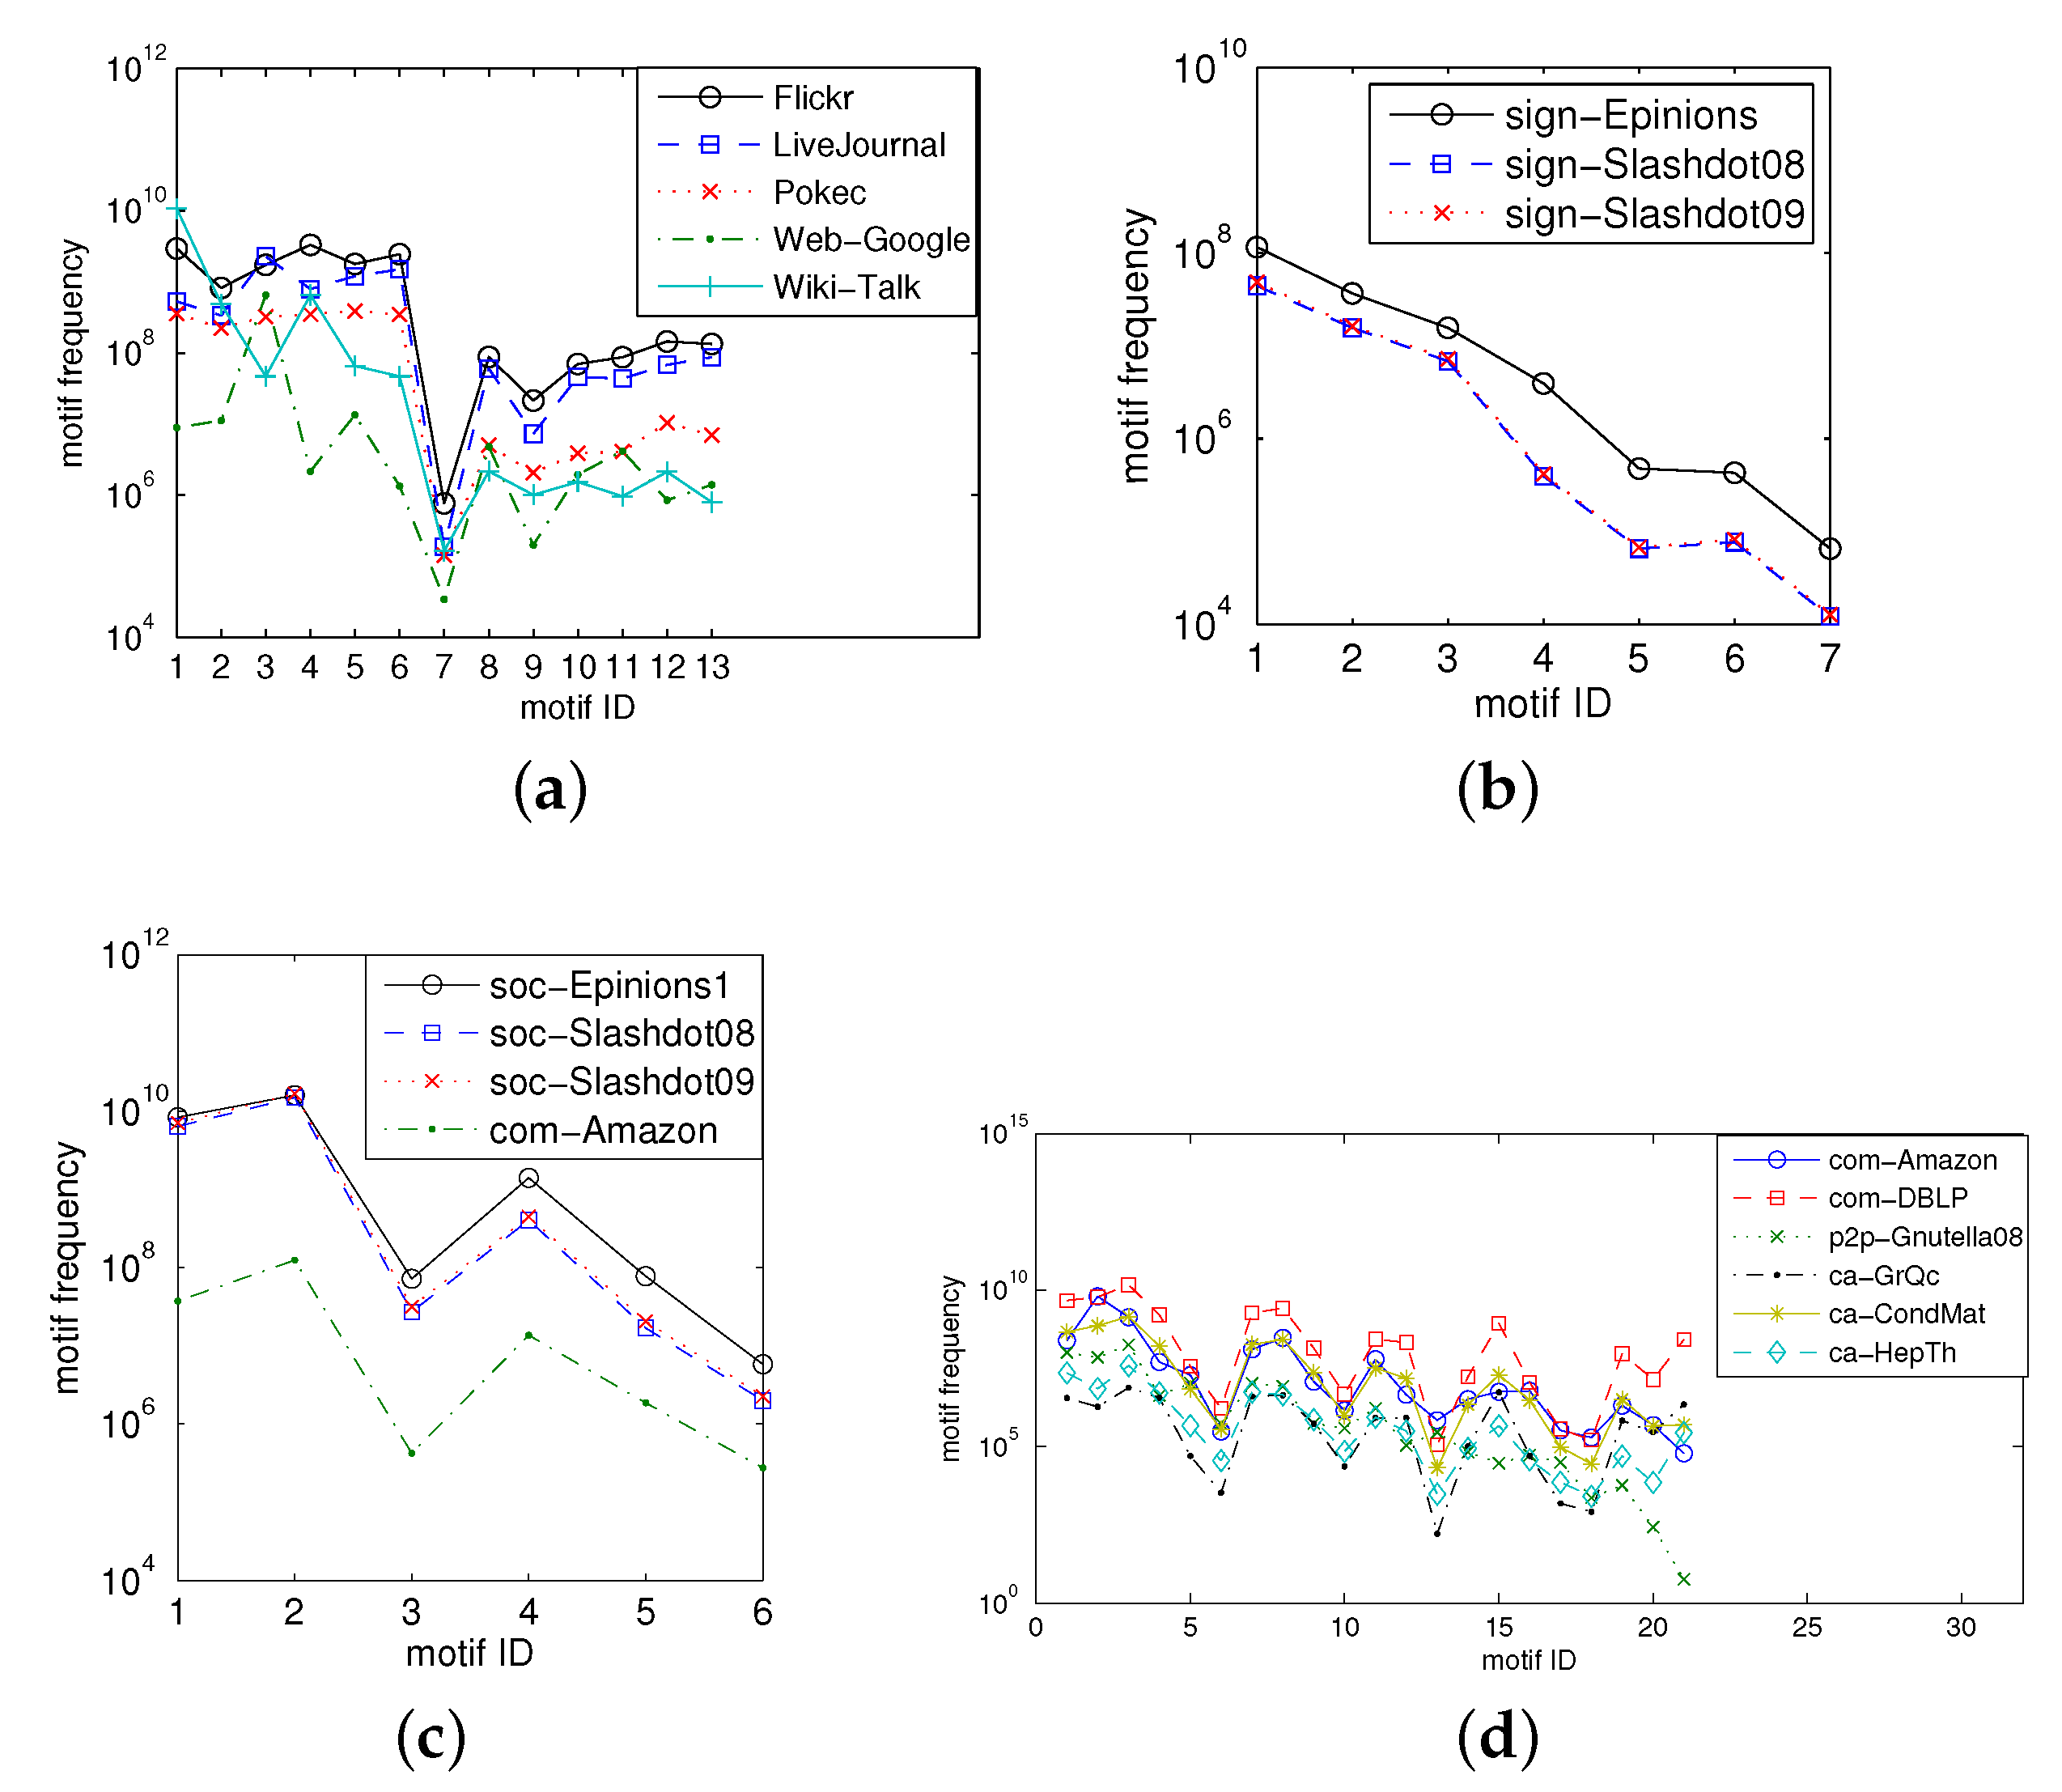
5.3.1. Values of Three-, Four-, and Five-Node Motif Frequencies
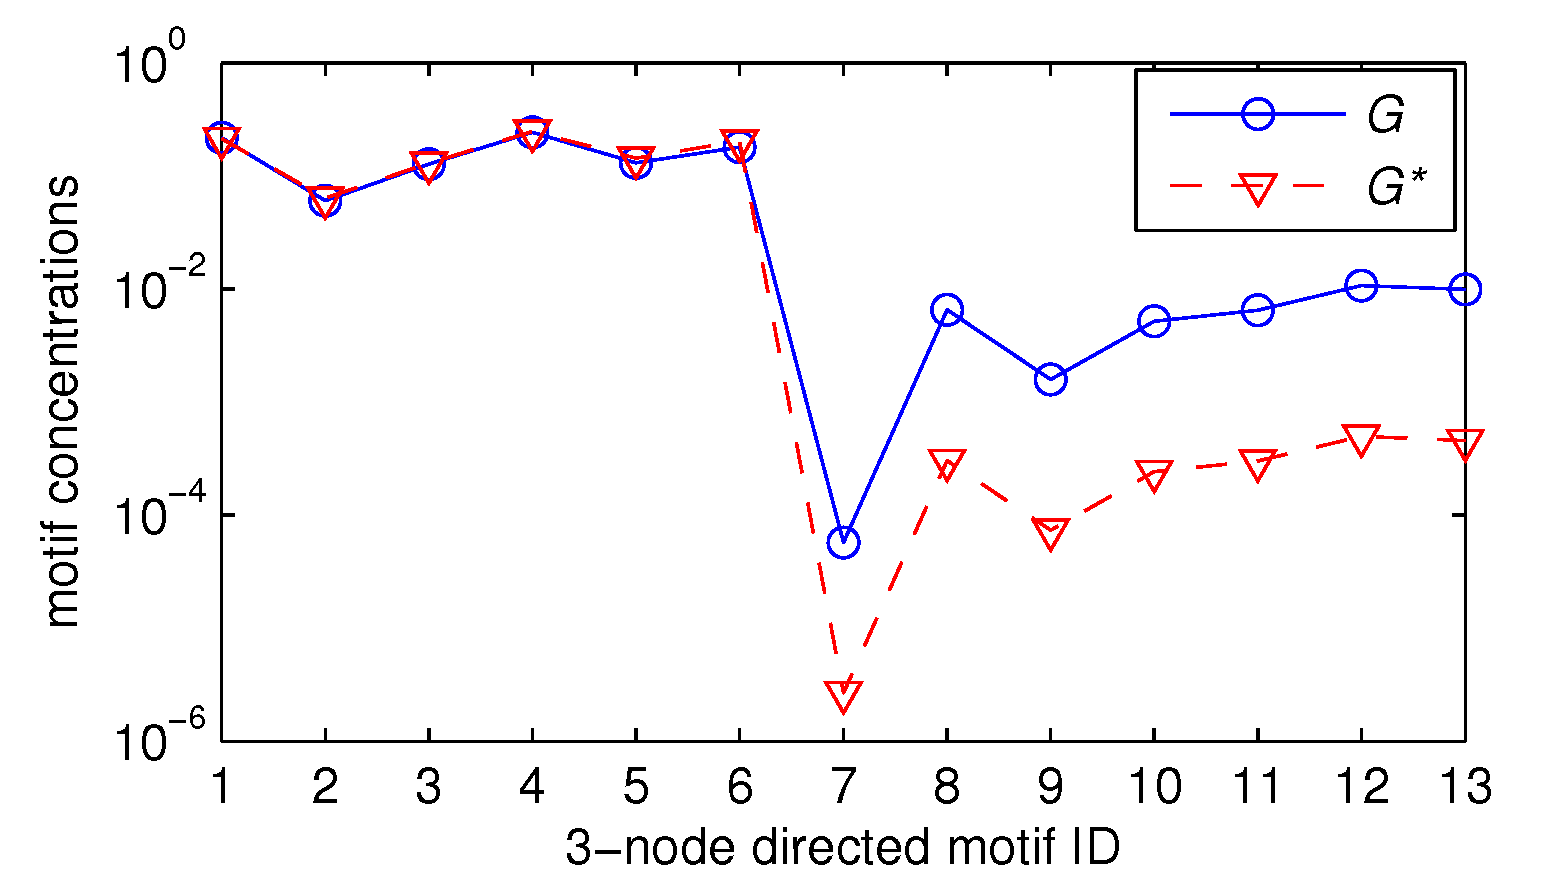
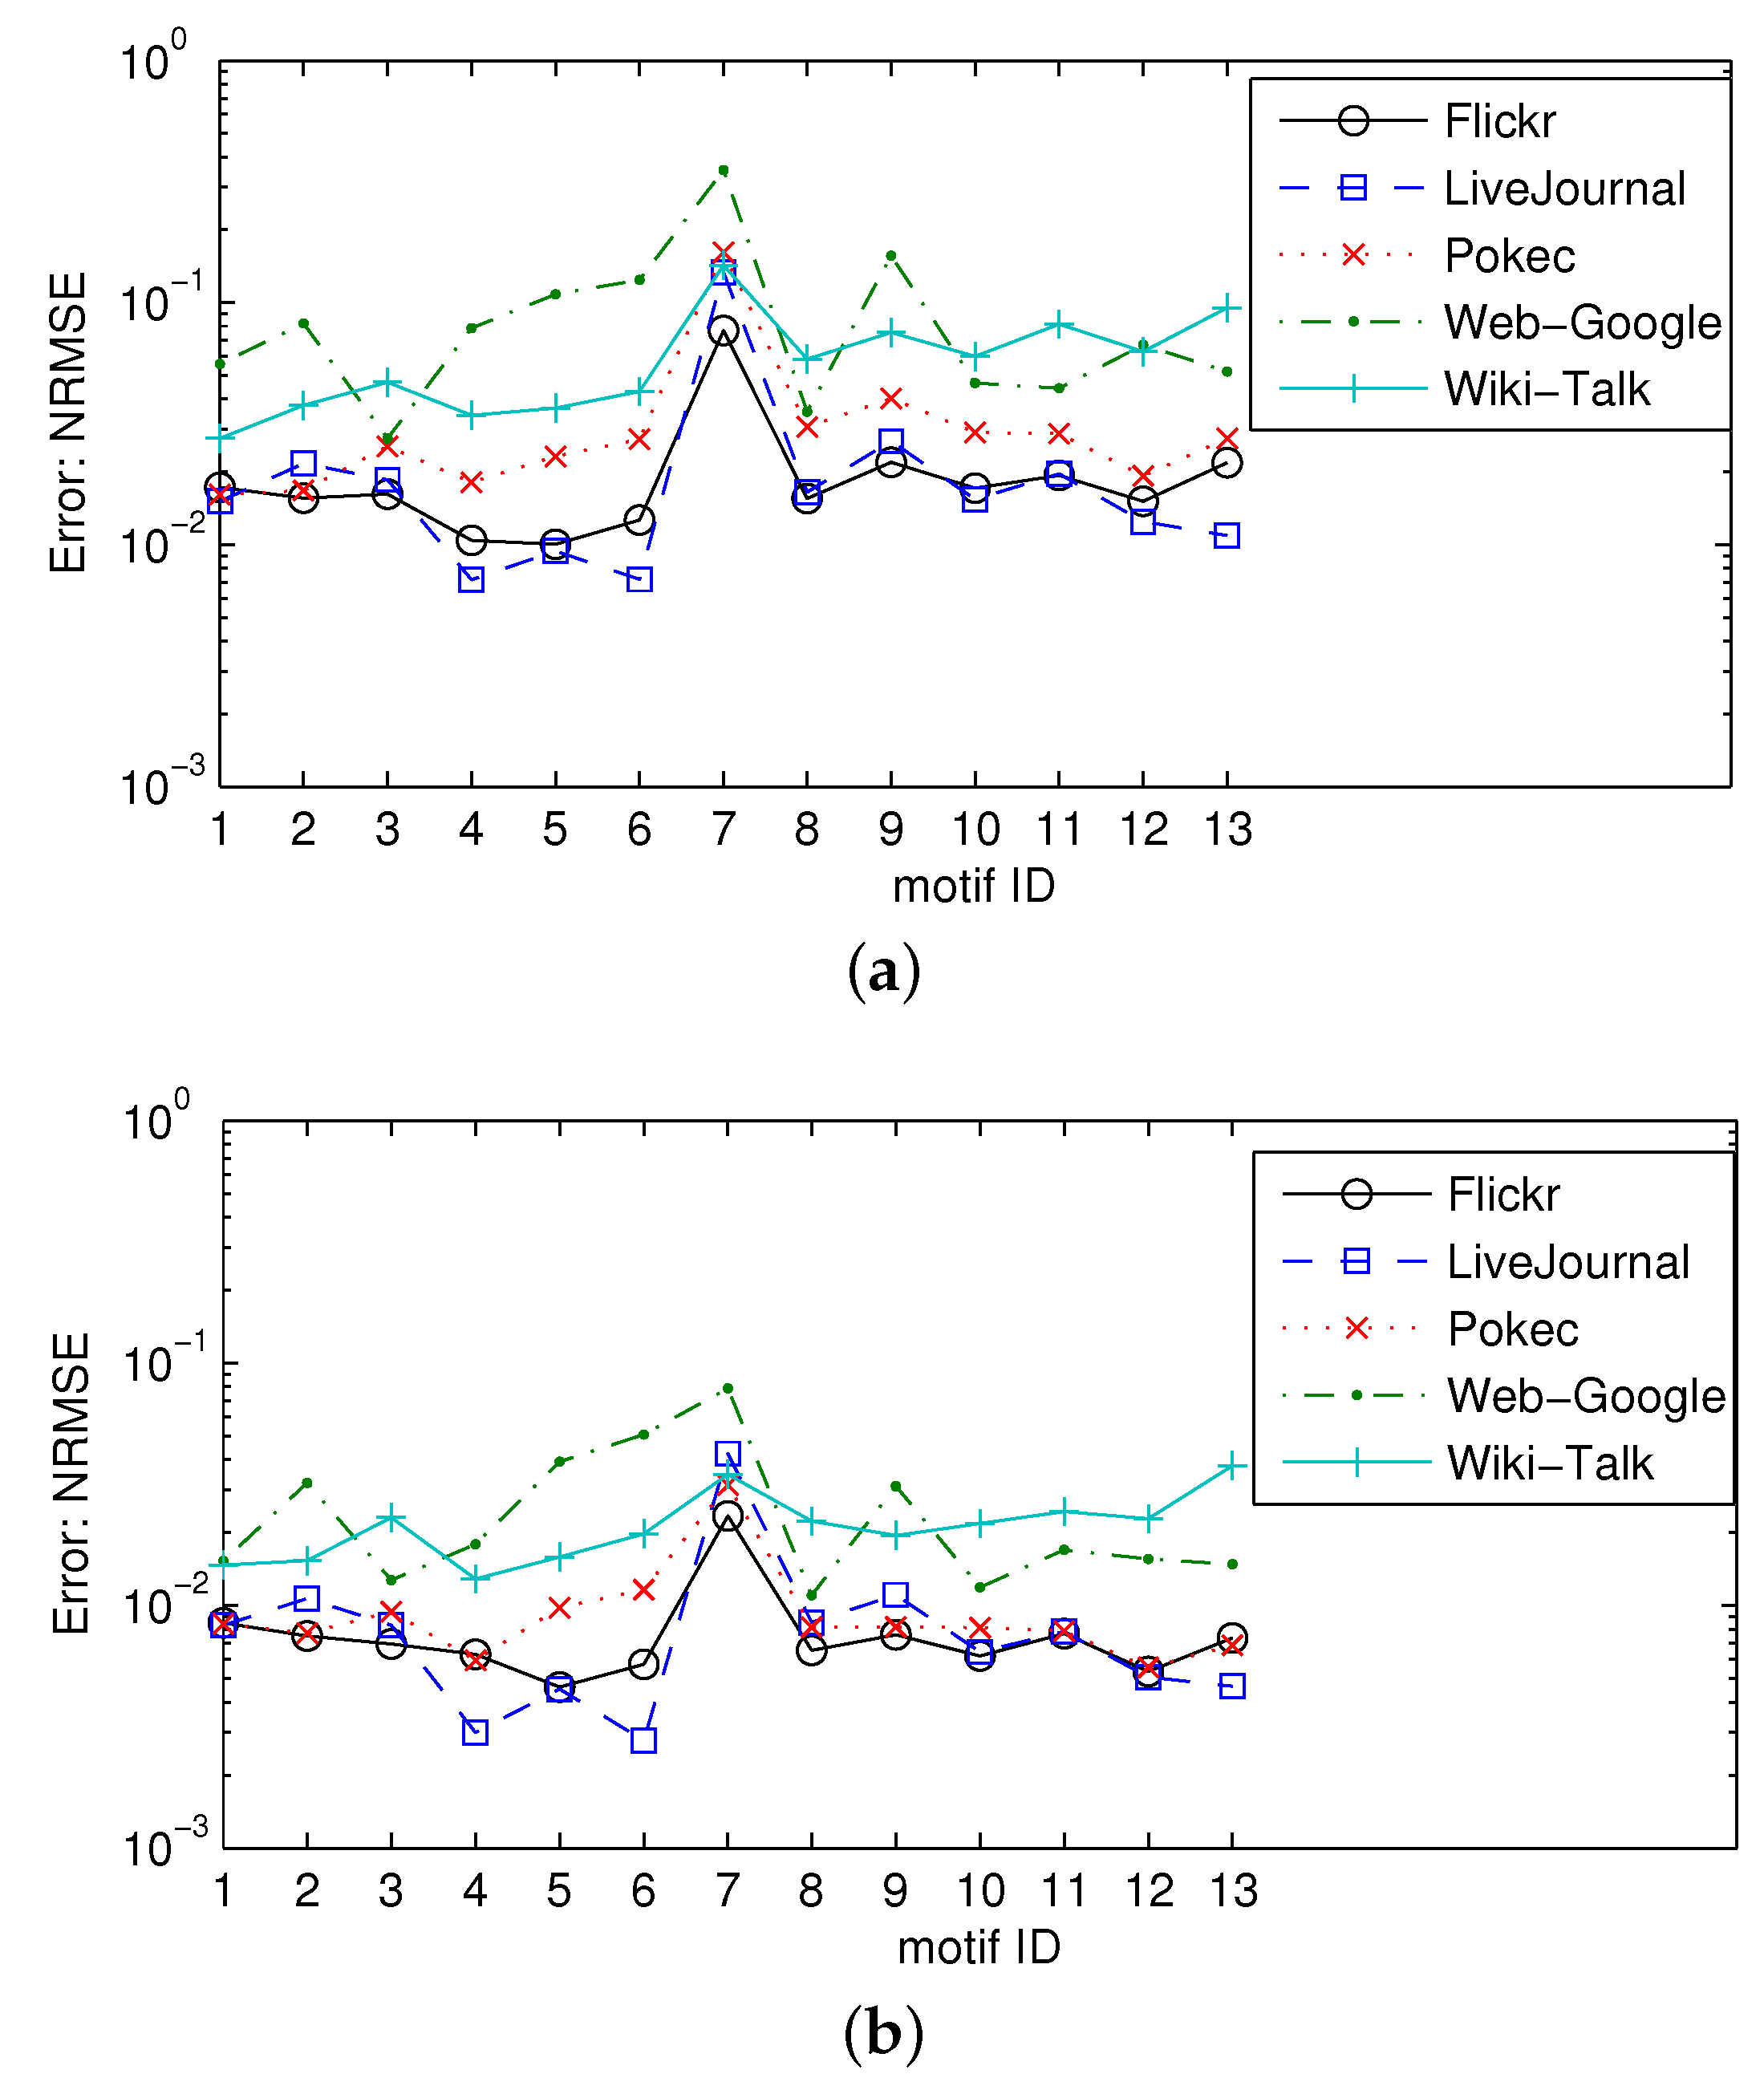
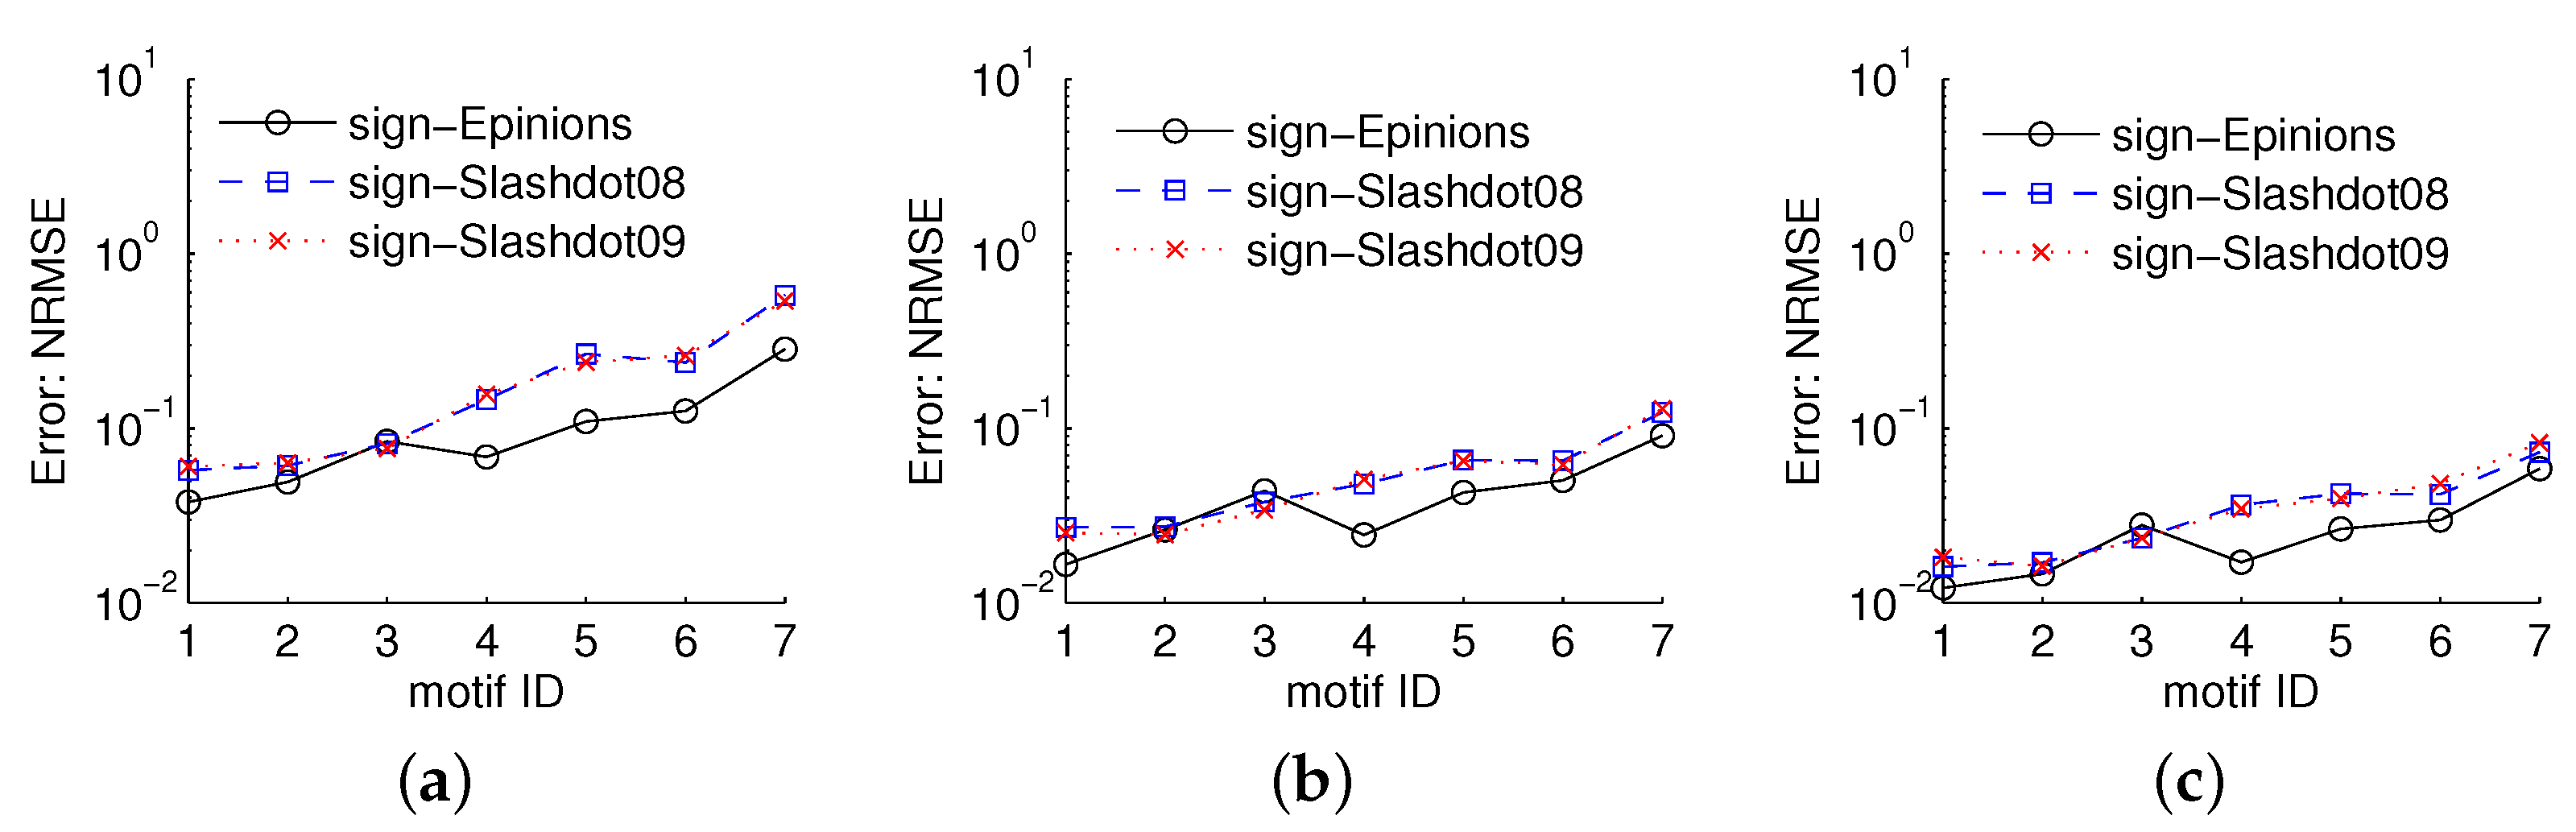
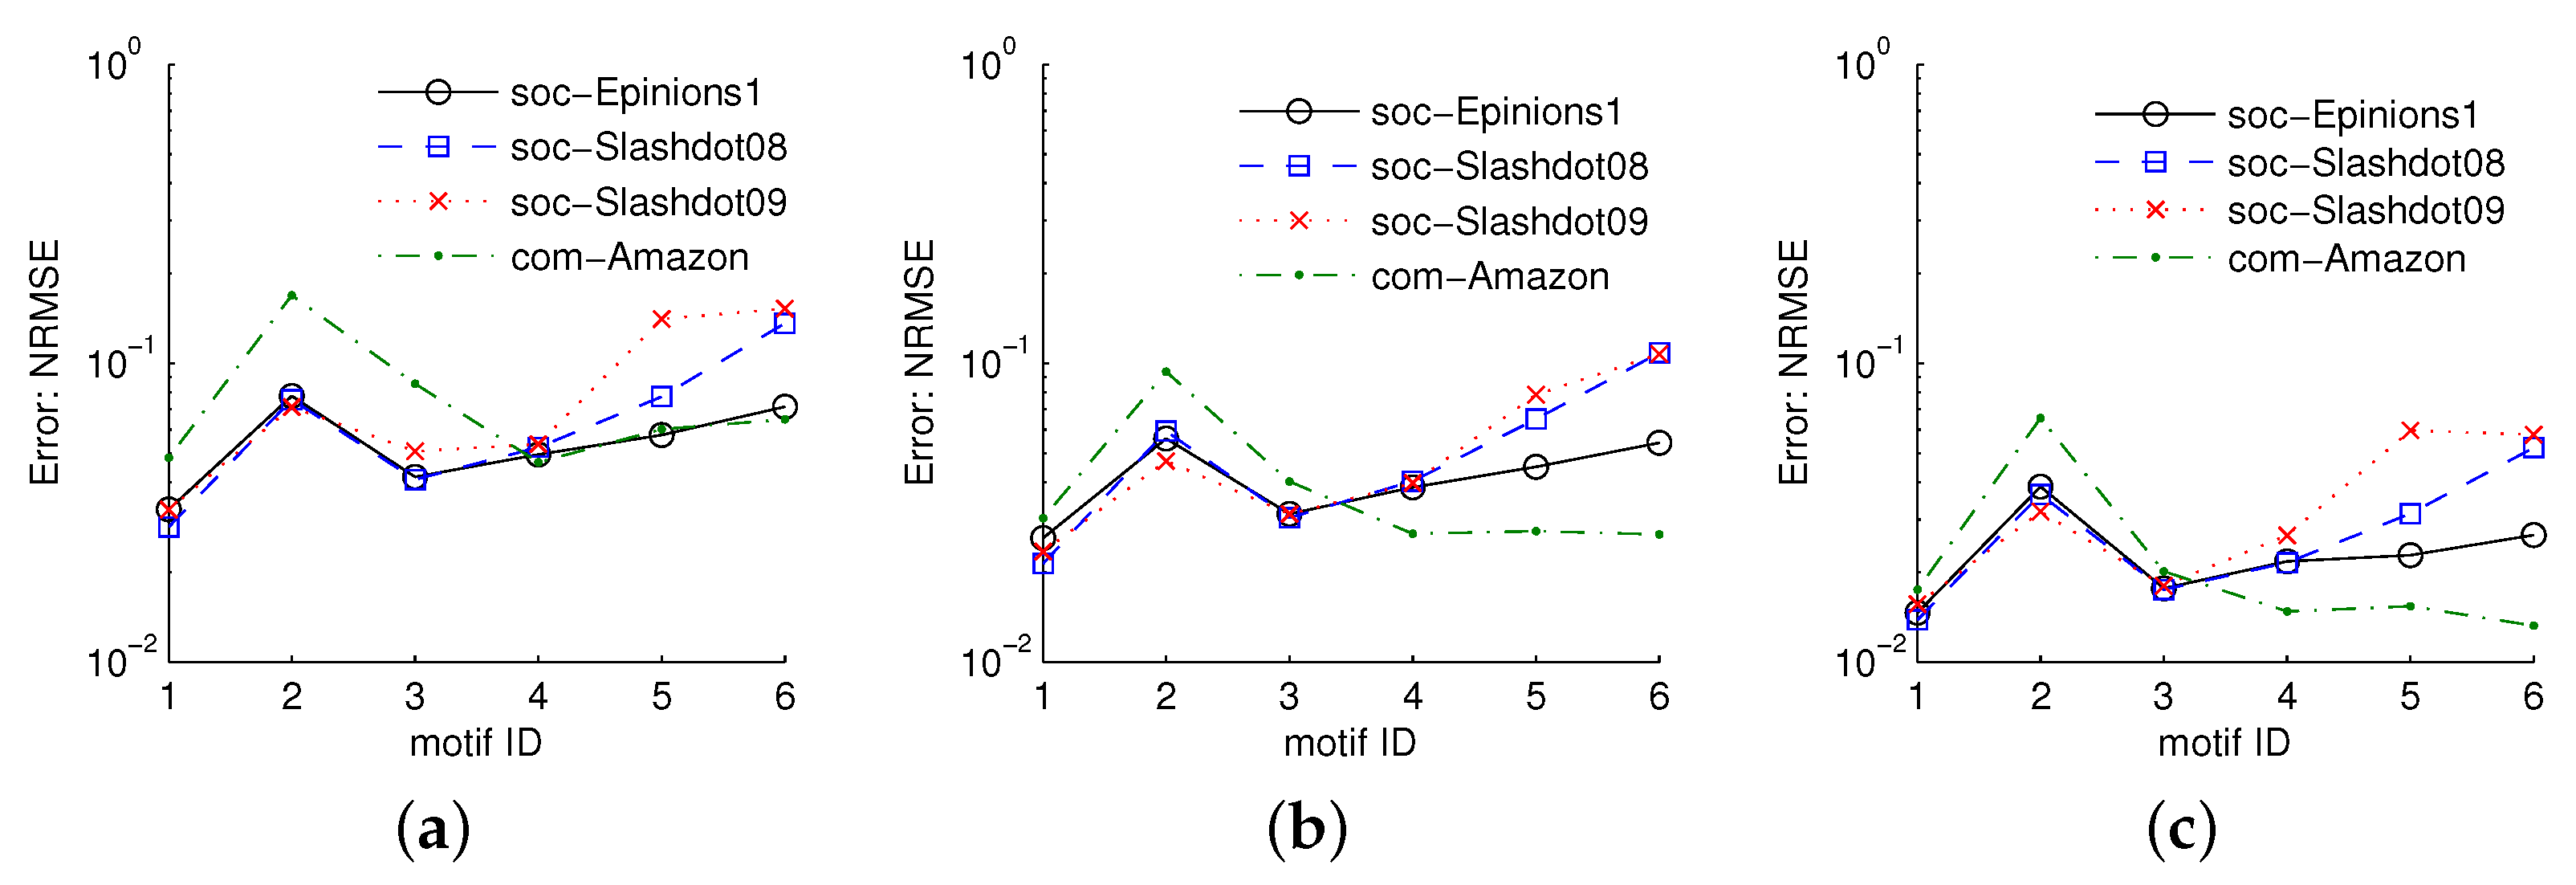
5.3.2. Estimating Three-Node Motif Frequencies
5.3.3. Estimating Four-Node Motif Frequencies
5.3.4. Estimating Five-Node Motif Frequencies
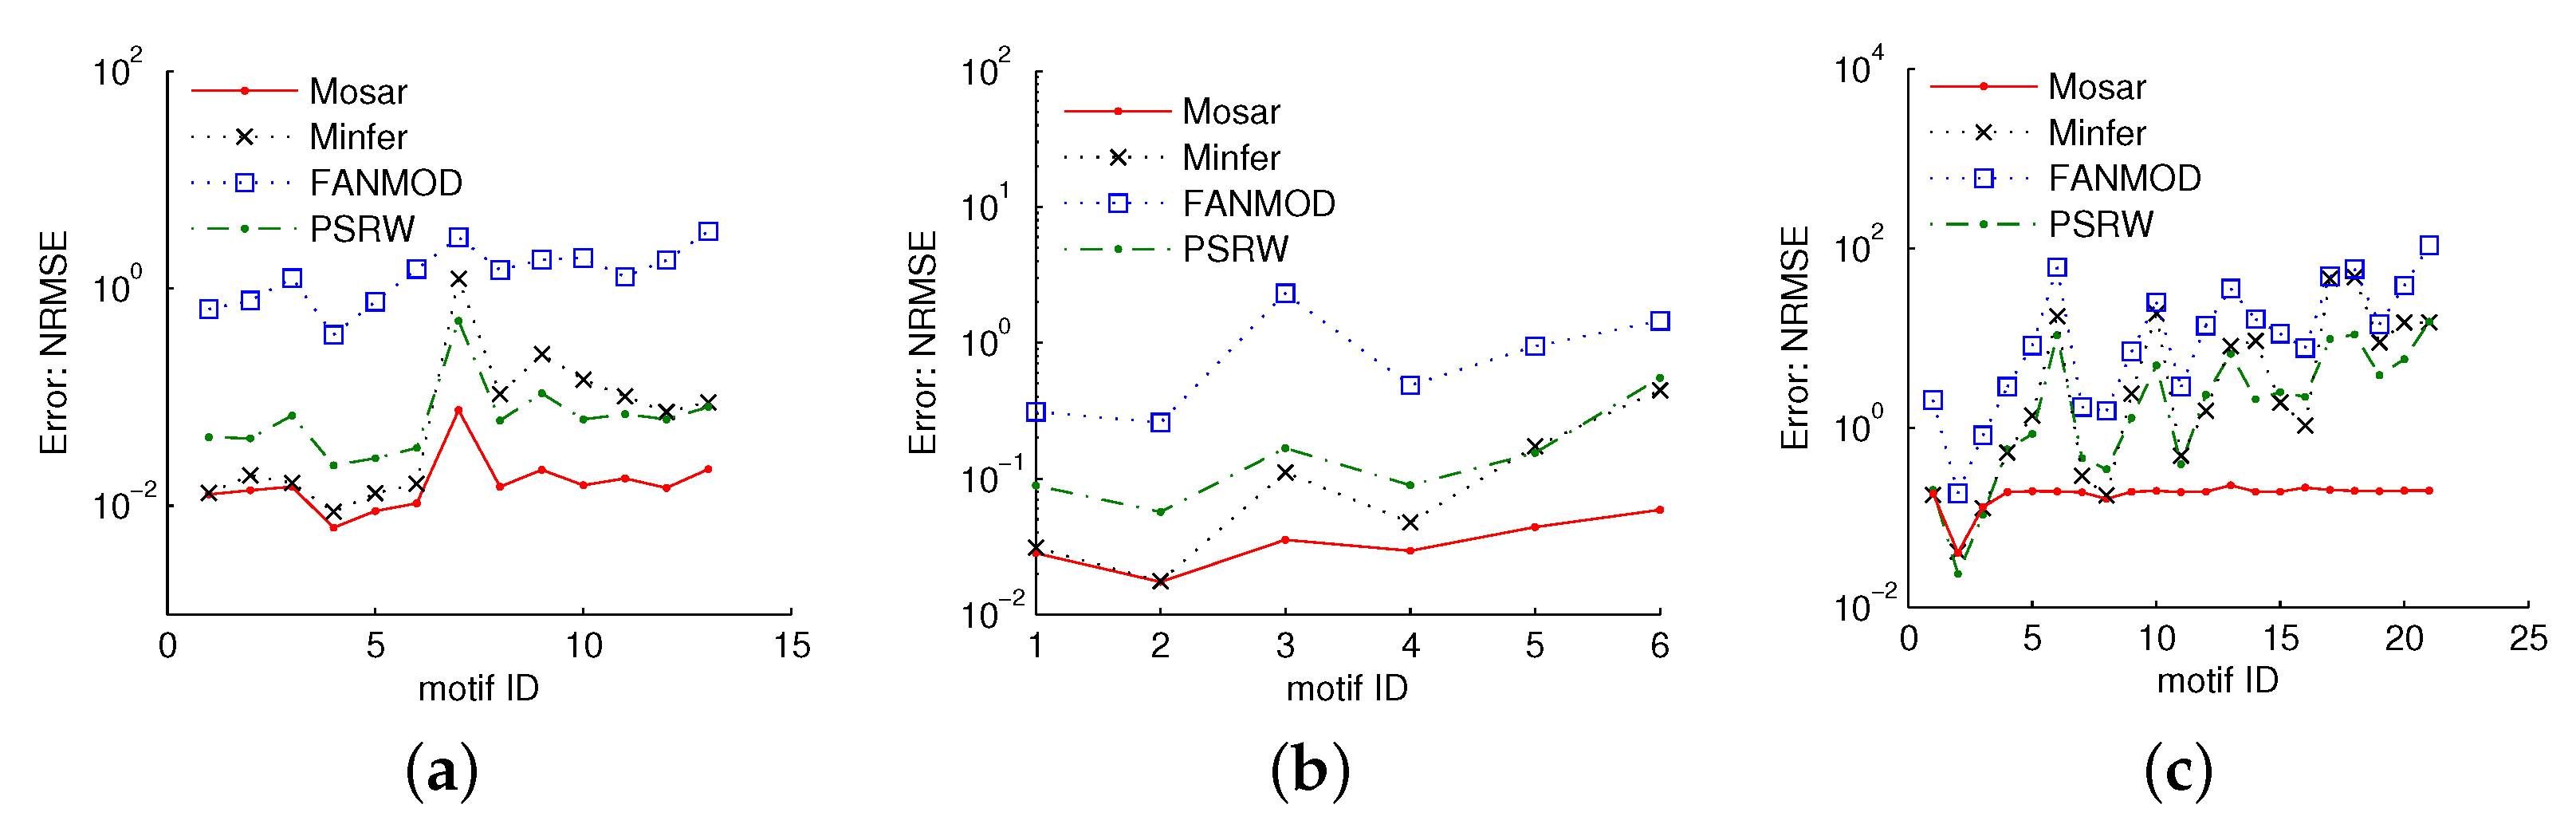
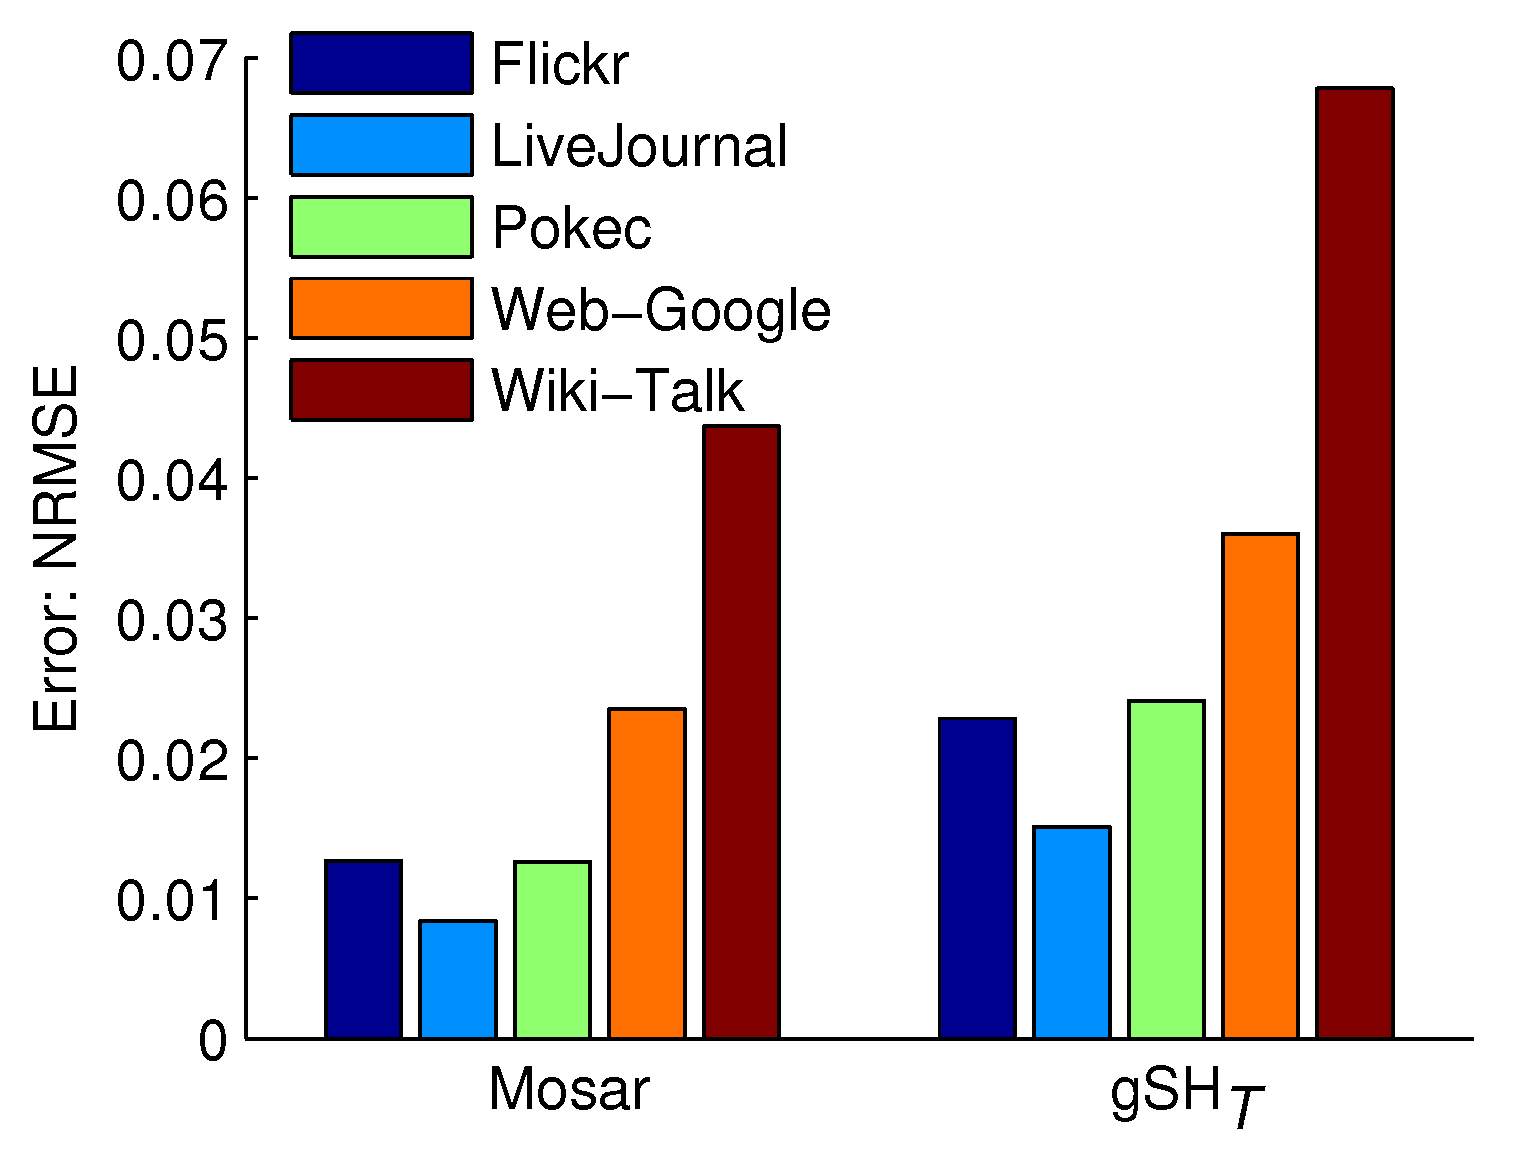
5.4. Comparison to Previous Work
5.4.1. Motif Concentration Estimation
5.4.2. Triangle Counting
6. Conclusions
Author Contributions
Funding
Data Availability Statement
Conflicts of Interest
References
- Chun, H.; Yeol Ahn, Y.; Kwak, H.; Moon, S.; Ho Eom, Y.; Jeong, H. Comparison of Online Social Relations in Terms of Volume vs. Interaction: A Case Study of Cyworld. In Proceedings of the SIGCOMM: Conference on Applications, Technologies, Architectures, and Protocols for Computer Communication, Seattle, WA, USA, 17–22 August 2008; pp. 57–59. [Google Scholar]
- Kunegis, J.; Lommatzsch, A.; Bauckhage, C. The slashdot zoo: Mining a social network with negative edges. In Proceedings of the 18th International Conference on World Wide Web, Madrid, Spain, 20–24 April 2009; pp. 741–750. [Google Scholar]
- Zhao, J.; Lui, J.C.S.; Towsley, D.; Guan, X.; Zhou, Y. Empirical Analysis of the Evolution of Follower Network: A Case Study on Douban. In Proceedings of the 30th IEEE International Conference on Computer Communications (IEEE INFOCOM 2011), Shanghai, China, 10–15 April 2011; pp. 941–946. [Google Scholar]
- Ugander, J.; Backstrom, L.; Kleinberg, J. Subgraph frequencies: Mapping the empirical and extremal geography of large graph collections. In Proceedings of the 22nd International Conference on World Wide Web, New York, NY, USA, 13–17 May 2013; pp. 1307–1318. [Google Scholar]
- Shen-Orr, S.S.; Milo, R.; Mangan, S.; Alon, U. Network motifs in the transcriptional regulation network of Escherichia coli. Nat. Genet. 2002, 31, 64–68. [Google Scholar] [CrossRef] [PubMed]
- Albert, I.; Albert, R. Conserved network motifs allow protein–protein interaction prediction. Bioinformatics 2004, 4863, 3346–3352. [Google Scholar] [CrossRef] [PubMed] [Green Version]
- Itzkovitz, S.; Levitt, R.; Kashtan, N.; Milo, R.; Itzkovitz, M.; Alon, U. Coarse-Graining and Self-Dissimilarity of Complex Networks. Phys. Rev. E 2005, 71, 016127. [Google Scholar] [CrossRef] [PubMed] [Green Version]
- Jin, Y.; Sharafuddin, E.; Zhang, Z.L. Unveiling Core Network-wide Communication Patterns through Application Traffic Activity Graph Decomposition. In Proceedings of the Eleventh International Joint Conference on Measurement and Modeling of Computer Systems, Seattle, WA, USA, 15 June 2009; pp. 49–60. [Google Scholar]
- Iliofotou, M.; Faloutsos, M.; Mitzenmacher, M. Exploiting Dynamicity in Graph-based Traffic Analysis: Techniques and Applications. In Proceedings of the 5th International Conference on Emerging Networking Experiments and Technologies, Rome, Italy, 1–4 December 2009; pp. 241–252. [Google Scholar]
- Leskovec, J.; Lang, K.J.; Dasgupta, A.; Mahoney, M.W. Community Structure in Large Networks: Natural Cluster Sizes and the Absence of Large Well-Defined Clusters. Internet Math. 2009, 6, 29–123. [Google Scholar] [CrossRef] [Green Version]
- Richardson, M.; Agrawal, R.; Domingos, P. Trust Management for the Semantic Web. In Proceedings of the 7th International Symposium on Wearable Computers (ISWC 2003), White Plains, NY, USA, 21–23 October 2003; pp. 351–368. [Google Scholar]
- Wang, P.; Lui, J.C.; Zhao, J.; Ribeiro, B.; Towsley, D.; Guan, X. Efficiently Estimating Motif Statistics of Large Networks. ACM Trans. Knowl. Discov. Data 2014, 9, 1–27. [Google Scholar] [CrossRef] [Green Version]
- Kashtan, N.; Itzkovitz, S.; Milo, R.; Alon, U. Efficient sampling algorithm for estimating subgraph concentrations and detecting network motifs. Bioinformatics 2004, 20, 1746–1758. [Google Scholar] [CrossRef] [Green Version]
- Wernicke, S. Efficient Detection of Network Motifs. Trans. Comput. Biol. Bioinform. 2006, 3, 347–359. [Google Scholar] [CrossRef] [Green Version]
- Bhuiyan, M.A.; Rahman, M.; Rahman, M.; Hasan, M.A. GUISE: Uniform Sampling of Graphlets for Large Graph Analysis. In Proceedings of the IEEE International Conference on Data Mining, Brussels, Belgium, 10–13 December 2012; pp. 91–100. [Google Scholar]
- Wang, P.; Qi, Y.; Lui, J.C.; Towsley, D.; Zhao, J.; Tao, J. Inferring higher-order structure statistics of large networks from sampled edges. Trans. Knowl. Data Eng. 2017, 31, 61–74. [Google Scholar] [CrossRef]
- Shin, K.; Eliassi-Rad, T.; Faloutsos, C. Patterns and anomalies in k-cores of real-world graphs with applications. Knowl. Inf. Syst. 2018, 54, 677–710. [Google Scholar] [CrossRef]
- Eswaran, D. Mining Anomalies Using Static and Dynamic Graphs. Ph.D. Thesis, Carnegie Mellon University, Pittsburgh, PA, USA, 2020. [Google Scholar]
- Yuan, L.; Qin, L.; Zhang, W.; Chang, L.; Yang, J. Index-based densest clique percolation community search in networks. Trans. Knowl. Data Eng. 2017, 30, 922–935. [Google Scholar] [CrossRef]
- Fang, Y.; Huang, X.; Qin, L.; Zhang, Y.; Zhang, W.; Cheng, R.; Lin, X. A survey of community search over big graphs. VLDB J. 2020, 29, 353–392. [Google Scholar] [CrossRef] [Green Version]
- Sarndal, C.E.S.; Swensson, B.; Wretman, J. Model Assisted Survey Sampling; Springer: New York, NY, USA, 1992. [Google Scholar]
- Mislove, A.; Marcon, M.; Gummadi, K.P.; Druschel, P.; Bhattacharjee, B. Measurement and Analysis of Online Social Networks. In Proceedings of the 2007 Conference on Applications, Technologies, Architectures, and Protocols for Computer Communications, Kyoto, Japan, 27–31 August 2007; pp. 29–42. [Google Scholar]
- Tsourakakis, C.E.; Kang, U.; Miller, G.L.; Faloutsos, C. Doulion: Counting Triangles in Massive Graphs with a Coin. In Proceedings of the 15th ACM SIGKDD International Conference on Knowledge Discovery and Data Mining, Paris, France, 28 June–1 July 2009. [Google Scholar]
- Pavany, A.; Tirthapuraz, K.T.S.; Wu, K.L. Counting and Sampling Triangles from a Graph Stream. In Proceedings of the 39th International Conference on Very Large Data Bases 2013, (VLDB 2013), Riva del Garda, Italy, 30 August 2013; pp. 1870–1881. [Google Scholar]
- Jha, M.; Seshadhri, C.; Pinar, A. A Space Efficient Streaming Algorithm for Triangle Counting Using the Birthday Paradox. In Proceedings of the 19th ACM SIGKDD International Conference on Knowledge Discovery and Data Mining, Chicago, IL, USA, 11–14 August 2013; pp. 589–597. [Google Scholar]
- Lim, Y.; Kang, U. Mascot: Memory-efficient and accurate sampling for counting local triangles in graph streams. In Proceedings of the 21st ACM SIGKDD Conference on Knowledge Discovery and Data Mining, Sydney, Australia, 10–13 August 2015; pp. 685–694. [Google Scholar]
- Stefani, L.D.; Epasto, A.; Riondato, M.; Upfal, E. Triest: Counting local and global triangles in fully dynamic streams with fixed memory size. Trans. Knowl. Discov. Data 2017, 11, 1–50. [Google Scholar] [CrossRef] [Green Version]
- Jung, M.; Lim, Y.; Lee, S.; Kang, U. FURL: Fixed-memory and uncertainty reducing local triangle counting for multigraph streams. Data Min. Knowl. Discov. 2019, 33, 1225–1253. [Google Scholar] [CrossRef]
- Shin, K.; Oh, S.; Kim, J.; Hooi, B.; Faloutsos, C. Fast, accurate and provable triangle counting in fully dynamic graph streams. Trans. Knowl. Discov. Data 2020, 14, 1–39. [Google Scholar] [CrossRef] [Green Version]
- Alon, N.; Yuster, R.; Zwick, U. Color-coding. J. ACM 1995, 42, 844–856. [Google Scholar] [CrossRef]
- Jha, M.; Seshadhri, C.; Pinar, A. Path Sampling: A Fast and Provable Method for Estimating 4-Vertex Subgraph Counts. In Proceedings of the 24th International Conference on World Wide Web, Florence, Italy, 18–22 May 2015; pp. 495–505. [Google Scholar]
- Omidi, S.; Schreiber, F.; Masoudi-nejad, A. MODA: An efficient algorithm for network motif discovery in biological networks. Genes Genet Syst. 2009, 84, 385–395. [Google Scholar] [CrossRef] [Green Version]
- Paredes, P.; Ribeiro, P. Rand-fase: Fast approximate subgraph census. Soc. Netw. Anal. Min. 2015, 5, 17. [Google Scholar] [CrossRef]
- Bressan, M.; Chierichetti, F.; Kumar, R.; Leucci, S.; Panconesi, A. Motif counting beyond five nodes. Trans. Knowl. Discov. Data 2018, 12, 1–25. [Google Scholar] [CrossRef] [Green Version]
- Rossi, R.A.; Zhou, R.; Ahmed, N.K. Estimation of graphlet counts in massive networks. Trans. Neural Netw. Learn. Syst. 2018, 30, 44–57. [Google Scholar] [CrossRef]
- Bressan, M.; Leucci, S.; Panconesi, A. Motivo: Fast Motif Counting via Succinct Color Coding and Adaptive Sampling. Proc. VLDB Endow. 2019, 12, 1651–1663. [Google Scholar] [CrossRef] [Green Version]
- Rossi, R.A.; Ahmed, N.K.; Koh, E.; Kim, S.; Rao, A.; Abbasi-Yadkori, Y. A Structural Graph Representation Learning Framework. In Proceedings of the 13th International Conference on Web Search and Data Mining, Houston, TX, USA, 3–7 February 2020; pp. 483–491. [Google Scholar]
- Rossi, R.A.; Jin, D.; Kim, S.; Ahmed, N.K.; Koutra, D.; Lee, J.B. On Proximity and Structural Role-Based Embeddings in Networks: Misconceptions, Techniques, and Applications. ACM Trans. Knowl. Discov. Data 2020, 14, 1–37. [Google Scholar] [CrossRef]
- Chen, X.; Li, Y.; Wang, P.; Lui, J.C. A General Framework for Estimating Graphlet Statistics via Random Walk. arXiv 2016, arXiv:1603.07504. [Google Scholar] [CrossRef] [Green Version]
- Wang, P.; Zhao, J.; Zhang, X.; Li, Z.; Cheng, J.; Lui, J.C.; Towsley, D.; Tao, J.; Guan, X. MOSS-5: A fast method of approximating counts of 5-node graphlets in large graphs. Trans. Knowl. Data Eng. 2017, 30, 73–86. [Google Scholar] [CrossRef] [Green Version]
- Yang, C.; Lyu, M.; Li, Y.; Zhao, Q.; Xu, Y. Ssrw: A scalable algorithm for estimating graphlet statistics based on random walk. In Proceedings of the 23rd International Conference, DASFAA, Gold Coast, QLD, Australia, 21–24 May 2018; pp. 272–288. [Google Scholar]
- Paramonov, K.; Shemetov, D.; Sharpnack, J. Estimating graphlet statistics via lifting. In Proceedings of the 25th ACM SIGKDD Conference on Knowledge Discovery and Data Mining, Anchorage, AK, USA, 4–8 August 2019; pp. 587–595. [Google Scholar]
- Ahmed, N.; Duffield, N.; Neville, J.; Kompella, R. Graph Sample and Hold: A Framework for Big-Graph Analytics. In Proceedings of the 20th ACM SIGKDD International Conference on Knowledge Discovery and Data Mining, New York, NY, USA, 24–27 August 2014. [Google Scholar]
- Takac, L.; Zabovsky, M. Data Analysis in Public Social Networks. In Proceedings of the DTI, Omza, Poland, 28–29 May 2012; pp. 1–6. [Google Scholar]
- Leskovec, J.; Huttenlocher, D.; Kleinberg, J. Predicting Positive and Negative Links in Online Social Networks. In Proceedings of the 19th International Conference on World Wide Web, Raleigh, NC, USA, 26–30 April 2010; pp. 641–650. [Google Scholar]
- Google Programming Contest. 2002. Available online: http://www.google.com/programming-contest/ (accessed on 10 June 2021).
- Leskovec, J.; Huttenlocher, D.; Kleinberg, J. Signed Networks in Social Media. In Proceedings of the SIGCHI Conference on Human Factors in Computing Systems, Atlanta, GA, USA, 10–15 April 2010; pp. 1361–1370. [Google Scholar]
- Yang, J.; Leskovec, J. Defining and Evaluating Network Communities Based on Ground-Truth. In Proceedings of the PTDM 2012: Practical Theories of Exploratory Data Mining, Brussels, Belgium, 10–13 December 2012; pp. 745–754. [Google Scholar]
- Ripeanu, M.; Foster, I.T.; Iamnitchi, A. Mapping the Gnutella Network: Properties of Large-Scale Peer-to-Peer Systems and Implications for System Design. IEEE Internet Comput. J. 2002, 6, 50–57. [Google Scholar]
- Leskovec, J.; Kleinberg, J.; Faloutsos, C. Graph Evolution: Densification and Shrinking Diameters. Trans. Knowl. Discov. Data 2007, 1, 2-es. [Google Scholar] [CrossRef]


| G | is the graph of interest |
| is a sampled graph | |
| set of nodes in k-node CIS s | |
| set of edges in k-node CIS s | |
| motif class ID of CIS s | |
| number of k-node subgraph classes | |
| i-th k-node motif | |
| set of k-node CIS in G | |
| set of k-node CIS in | |
| set of CIS in G isomorphic to | |
| number of k-node CIS in G | |
| number of CIS in G isomorphic to | |
| concentration of motif in G | |
| P | matrix |
| probability that isomorphic to given s isomorphic to | |
| number of subgraphs of isomorphic to | |
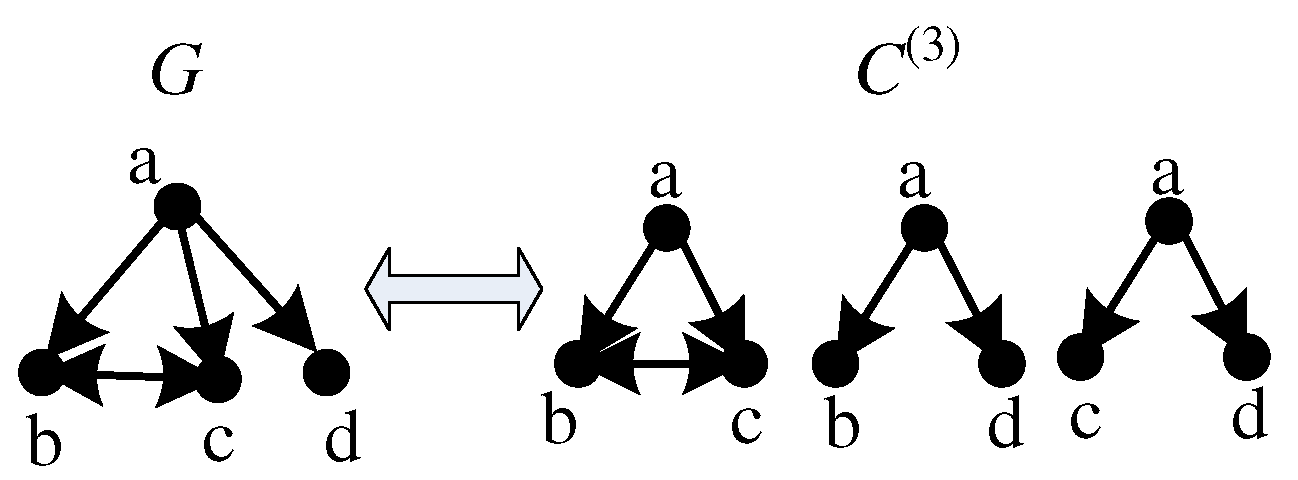
| and are two k-node CIS in G isomorphic to motif . Let and be the induced subgraphs of node sets and in , respectively. is defined as the probability that and are both isomorphic to motif . | |
| number of elements , where is isomorphic to motif and s is isomorphic to motif | |
| p | probability of sampling an edge |
| q |
| Graph | Nodes | Edges | Max-Degree |
|---|---|---|---|
| Flickr [22] | 1,715,255 | 15,555,041 | 27,236 |
| Pokec [44] | 1,632,803 | 22,301,964 | 14,854 |
| LiveJournal [22] | 5,189,809 | 48,688,097 | 15,017 |
| YouTube [22] | 1,138,499 | 2,990,443 | 28,754 |
| Wiki-Talk [45] | 2,394,385 | 4,659,565 | 100,029 |
| Web-Google [46] | 875,713 | 4,322,051 | 6332 |
| soc-Epinions1 [11] | 75,897 | 405,740 | 3044 |
| soc-Slashdot08 [10] | 77,360 | 469,180 | 2539 |
| soc-Slashdot09 [10] | 82,168 | 504,230 | 2552 |
| sign-Epinions [47] | 119,130 | 704,267 | 3558 |
| sign-Slashdot08 [47] | 77,350 | 416,695 | 2537 |
| sign-Slashdot09 [47] | 82,144 | 504,230 | 2552 |
| com-DBLP [48] | 317,080 | 1,049,866 | 343 |
| com-Amazon [48] | 334,863 | 925,872 | 549 |
| p2p-Gnutella08 [49] | 6301 | 20,777 | 97 |
| ca-GrQc [50] | 5241 | 14,484 | 81 |
| ca-CondMat [50] | 23,133 | 93,439 | 279 |
| ca-HepTh [50] | 9875 | 25,937 | 65 |
| i | Flickr | Pokec | Live- Journal | Wiki- Talk | Web- |
|---|---|---|---|---|---|
| undirected three-node motifs | |||||
| 1 | 1.30 × 10 | 1.99 × 10 | 6.59 × 10 | 1.26 × 10 | 6.87 × 10 |
| 2 | 5.49 × 10 | 3.26 × 10 | 3.11 × 10 | 9.20 × 10 | 1.34 × 10 |
| i | Flickr | Pokec | Live- Journal | Wiki- Talk | Web- |
|---|---|---|---|---|---|
| 1 | 8.3 × 10 | 1.3 × 10 | 2.8 × 10 | 2.5 × 10 | 2.6 × 10 |
| 2 | 1.3 × 10 | 1.3 × 10 | 1.7 × 10 | 4.4 × 10 | 2.4 × 10 |
| 1 | 4.2 × 10 | 5.0 × 10 | 3.4 × 10 | 1.3 × 10 | 1.2 × 10 |
| 2 | 4.7 × 10 | 4.1 × 10 | 4.3 × 10 | 1.6 × 10 | 8.1 × 10 |
Publisher’s Note: MDPI stays neutral with regard to jurisdictional claims in published maps and institutional affiliations. |
© 2022 by the authors. Licensee MDPI, Basel, Switzerland. This article is an open access article distributed under the terms and conditions of the Creative Commons Attribution (CC BY) license (https://creativecommons.org/licenses/by/4.0/).
Share and Cite
Guo, W.; Feng, W.; Qi, Y.; Wang, P.; Tao, J. Mosar: Efficiently Characterizing Both Frequent and Rare Motifs in Large Graphs. Appl. Sci. 2022, 12, 7210. https://doi.org/10.3390/app12147210
Guo W, Feng W, Qi Y, Wang P, Tao J. Mosar: Efficiently Characterizing Both Frequent and Rare Motifs in Large Graphs. Applied Sciences. 2022; 12(14):7210. https://doi.org/10.3390/app12147210
Chicago/Turabian StyleGuo, Wenhua, Wenqian Feng, Yiyan Qi, Pinghui Wang, and Jing Tao. 2022. "Mosar: Efficiently Characterizing Both Frequent and Rare Motifs in Large Graphs" Applied Sciences 12, no. 14: 7210. https://doi.org/10.3390/app12147210
APA StyleGuo, W., Feng, W., Qi, Y., Wang, P., & Tao, J. (2022). Mosar: Efficiently Characterizing Both Frequent and Rare Motifs in Large Graphs. Applied Sciences, 12(14), 7210. https://doi.org/10.3390/app12147210