Article

Research on Droplets Deposition Characteristics of Anti-Drift Spray Device with Multi-Airflow Synergy Based on CFD Simulation

1
College of Mechanical and Electrical Engineering, Shandong Agricultural University, Taian 271018, China
2
Shandong Provincial Key Laboratory of Horticultural Machinery and Equipment, Taian 271018, China
3
Mining Training Center, Shandong University of Science and Technology, Taian 271018, China
4
College of Mechanical and Electrical Engineering, Qingdao Agricultural University, Qingdao 266109, China
5
College of Engineering, Huazhong Agricultural University, Wuhan 430070, China
*
Author to whom correspondence should be addressed.
Appl. Sci. 2022, 12(14), 7082; https://doi.org/10.3390/app12147082
Submission received: 15 June 2022 / Revised: 11 July 2022 / Accepted: 11 July 2022 / Published: 13 July 2022

Abstract

:
With the increase in orchard areas and the transfer of rural labor, various air-assisted sprayers have been widely used in China. However, the problem of off-target drift still exists, which has caused pesticide waste and environmental pollution. In order to improve the droplet deposition in the canopy of fruit trees, a V-shaped anti-drift spray device with multi-airflow synergy was designed in this paper. A droplet spatial motion model was constructed, and the anti-drift mechanism of multi-airflow synergy was clarified based on particle dynamics analysis. The influences of spray pressure and V-shaped wind speed on droplet movement were investigated by Matlab, and the experimental results showed that the machine’s anti-drift effect was better when the V-shaped wind speed ranged from 15 m/s to 25 m/s. According to modern orchards with low root stock in a high-density planting, a simulation model of the flow field between the spray device and the fruit trees canopy was established by the method of computational fluid mechanics (CFD). By considering crosswind speed, V-shaped wind speed, and spray pressure, three-level simulation experiments of droplet deposition were designed for each factor using a partial multivariate orthogonal regression method. The influence of V-shaped wind speed on the droplets’ spatial distribution was analyzed, and the prediction model of the drift distance of the droplets’ deposition center was established. The simulation results showed that the three factors had a significant influence on the droplets’ deposition characteristics, and the degree from big to small was V-shaped wind speed, crosswind speed, and spray pressure. The fitting degree of the prediction model was high, and the correlation coefficient was 0.998. The anti-drift experiments of the machine were carried out, and the results showed that when the crosswind speed, the spray pressure, and V-shaped wind speed were 2.2 m/s, 0.52 MPa, and 20.8 m/s, respectively, the droplet drift rate was 29.2% lower than that of single-airflow. The drift distance of the droplets deposition center was 5.0 cm, which was consistent with the prediction model. The research can provide a basis for the design and parameters optimization of the similar sprayers used in modern orchards with low root stock in a high-density planting.

1. Introduction

According to the data from the National Bureau of Statistics of the People’s Republic of China, the fruit planting area had reached 126.46 million hectares in 2020, and the fruit output had reached 286.92 million tons in China [1]. In the management of orchards, plant protection is important to ensure sustainable and steady development of fruit yield, and its workload accounts are about 25% of the total workload [2]. At present, orchard plant protection mainly depends on spraying chemical pesticides to control diseases and pests. Advanced pesticide application technology and plant protection machines are important to improve the pesticide utilization rate and work efficiency.
Mechanical facilities have been widely used in developed countries to achieve professional plant protection. With the acceleration of urbanization in China and the transfer of rural labor, the costs of artificial application of drugs increase, and the work efficiency is low, which has caused the reduction in fruit planting benefits and the slow development of the fruit industry. The mechanical application of pesticides is an inexorable trend for the development of orchard plant protection in China in the future [3].
In order to reduce labor intensity and improve work efficiency, air-assisted spraying is widely used. By using the strong airflow generated by a high-speed fan, the droplets atomized by the pesticide pump and sprayer are blown to the fruit trees’ canopy to eliminate pests [4]. The technology can not only ensure the spray distance but also enhance the penetration and deposition uniformity of the droplets [5]. With the development of technology, plant protection machines have also been developed rapidly. At present, the air-assisted sprayer is the most widely used in orchard plant protection, and its core components are the fan and diversion device [6]. In developed countries, air-assisted spraying technology is more advanced [7,8], and the machines’ performance is more reliable [9]. There are many famous manufacturers such as the CAFFINI company, MUNCKHOF company, and HARDI company. These sprayers made by these companies are suitable for standardized orchards. In China, various air-assisted sprayers [10] were developed according to the characteristics of orchard planting. In addition to the circular sprinkler, some scholars have improved various diversion devices, such as vertical sprinklers, multi-flexible ducts, vertical tubes, and butterfly bellows [11], which meet the needs of various orchards [12]. However, due to the continuous spray mode and the strong airflow, the problem of off-target drift still exists, which has caused pesticide waste and environmental pollution. Therefore, it is necessary to further research on improving the anti-drift ability of sprayers.
Many researchers have conducted a lot of research on the drift phenomenon and its influencing factors, including the spray parameters [13,14], airflow parameters [15,16], and other factors [17]. By analyzing the droplets’ drift process, Felsot [18] concluded that the main factors were the spray method and droplet size and proposed that protective shields and buffer zones should be used to reduce droplet drift. Palleja [19] designed a leaf-like sensor to simulate the swing of branches and leaves and changed the spray speed and the air outlet size to explore their effect on the airflow distribution, which provided a basis for further research on the airflow distribution in the canopy. By using artificial fruit trees to simulate the target canopy, Salcedo R. [20] compared the wind velocity and air volume entering the canopy when the sprayer was moving and stationary, respectively. The result showed that the air distribution on both sides of the axial fan was not uniform, which affected the droplets’ deposition. Qiu Wei [21] designed a multi-channel air-assisted sprayer, in which the air outlet position was changed to realize air volume adjustment and improve droplet coverage and uniformity. Hu Jun [22] designed a conical anti-drift spray device and discussed the influences of spray parameters and airflow parameters on its anti-drift performance.
Because the experimental field factors are too variable to control, researchers applied computational fluid dynamics (CFD) [23,24] to simulate the external wind fields of various sprayers in recent years [25,26]. By using rectangular cross-sections to simulate the outlet and regarding its velocity profile as the initial condition, Duga [27] calculated the domain airflow by URANS equations and k-ε models. Garcia-Ramos [28] replaced the outlet wind speed with the total airflow into the fan as the entrance boundary condition and constructed the wind field based on the Spalart–Allmaras turbulence model [29]. Hong [30] used a cylinder instead of the outlet, replaced the inlet velocity with the outlet velocity, and constructed the wind field based on the RANS-based SST turbulence model. BADULES [31] constructed the inner geometry of the air outlet and studied the difference in simulation results with different turbulence models, which showed that it was very important to select a suitable turbulence model for the wind field.
In summary, the anti-drift effect of the air-assisted sprayer in orchards is mainly related to the machines’ structure and work parameters. In order to improve the droplet deposition in the canopy of fruit trees, a V-shaped anti-drift spray device in multi-airflow synergy was designed [32]. In this paper, the spatial motion model based on the particle dynamics analysis was constructed, the anti-drift mechanism of multi-airflow synergy was investigated, the influence of V-shaped wind speed on the droplet’s spatial distribution by the method of CFD was analyzed, and the prediction model of the drifting distance of the droplet deposition center was constructed, which provide a basis for the design and parameters optimization of the similar machines.

2. Materials and Methods

2.1. Device Structure and Working Principle

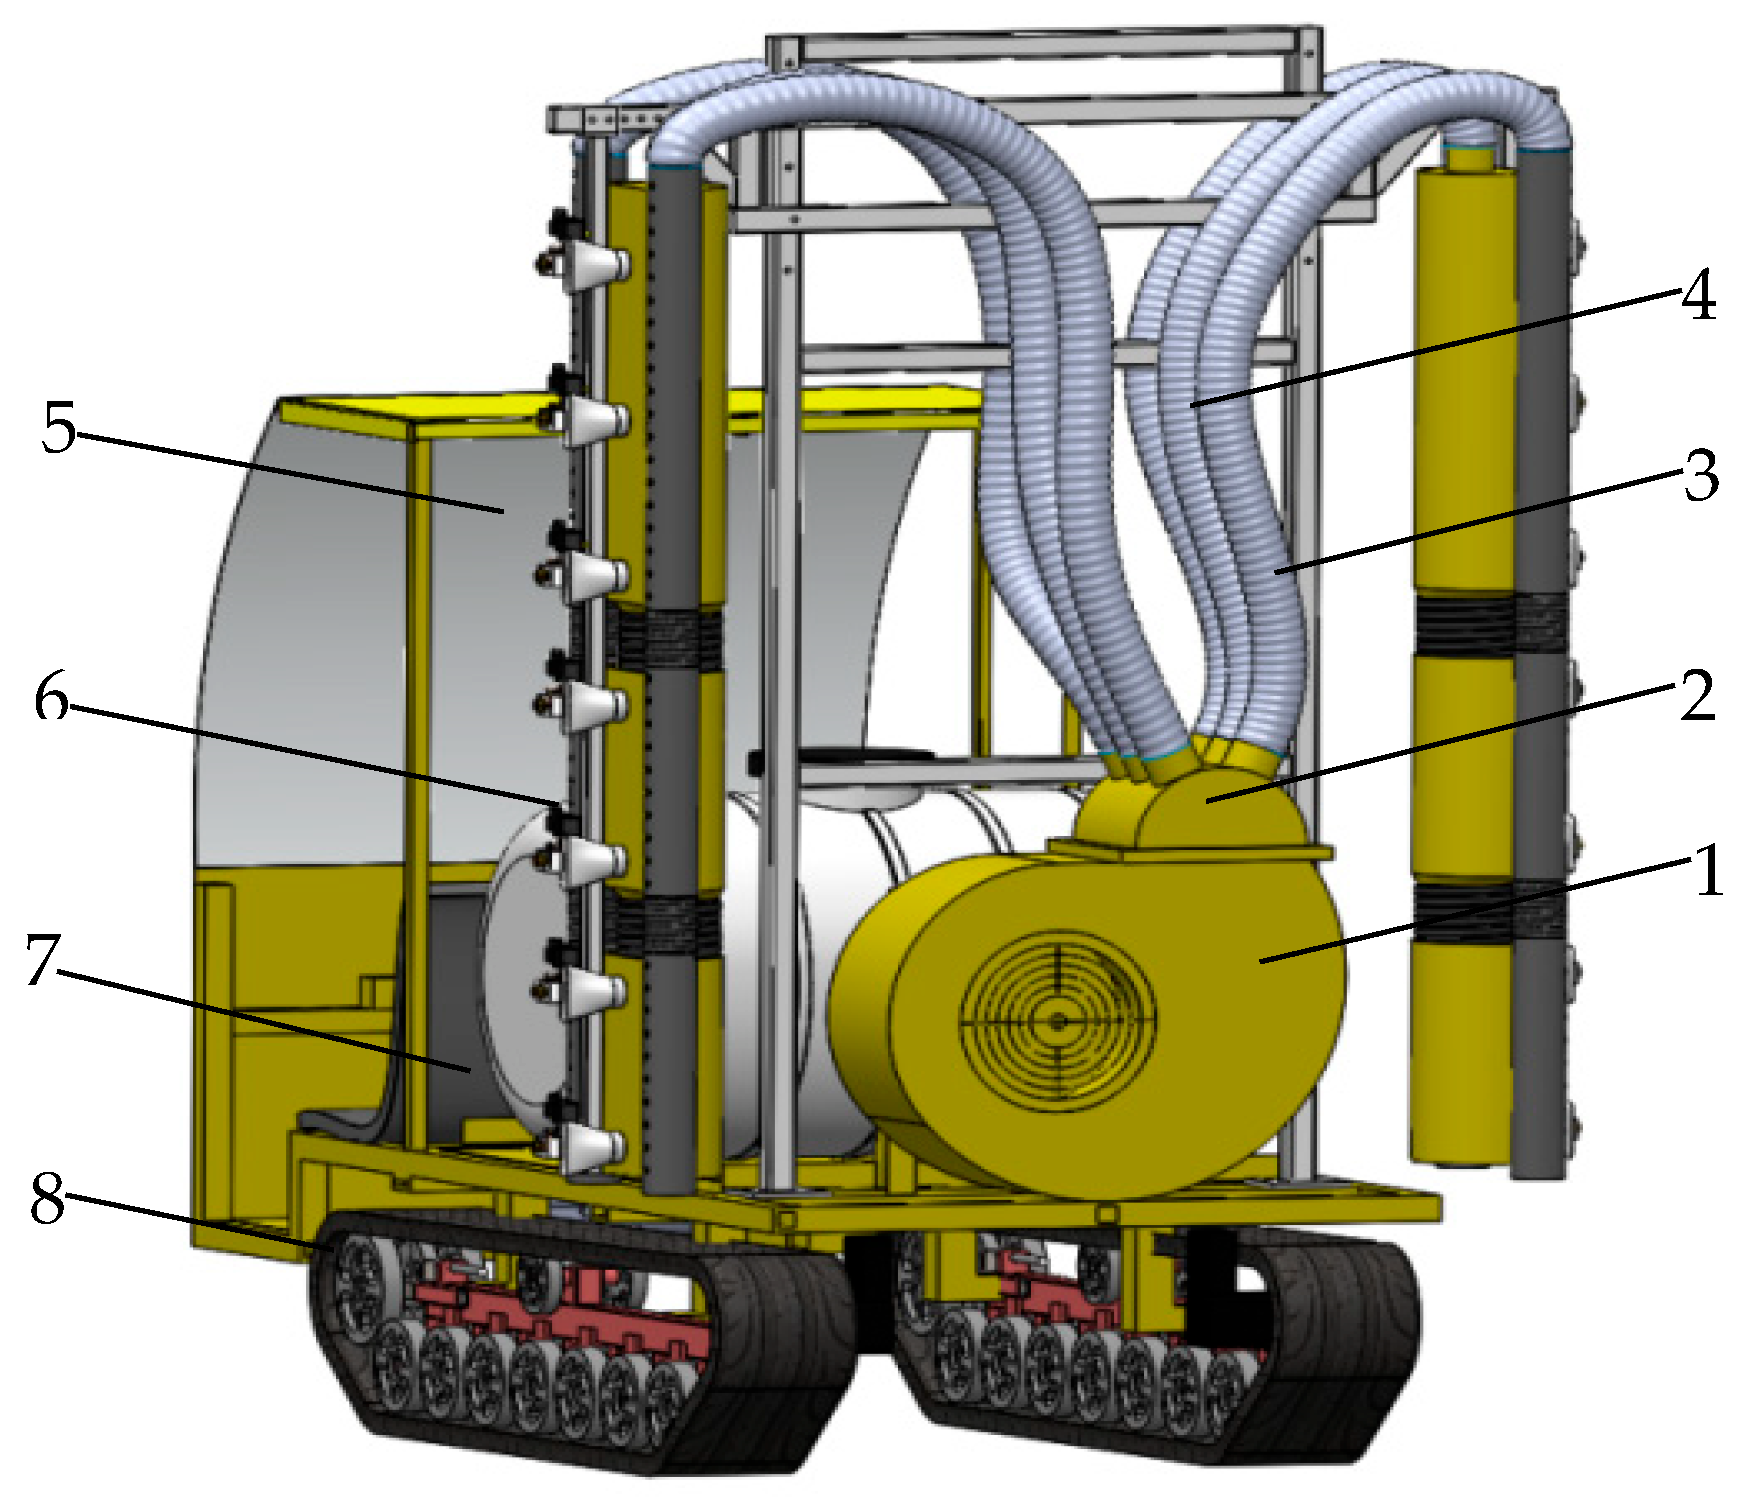
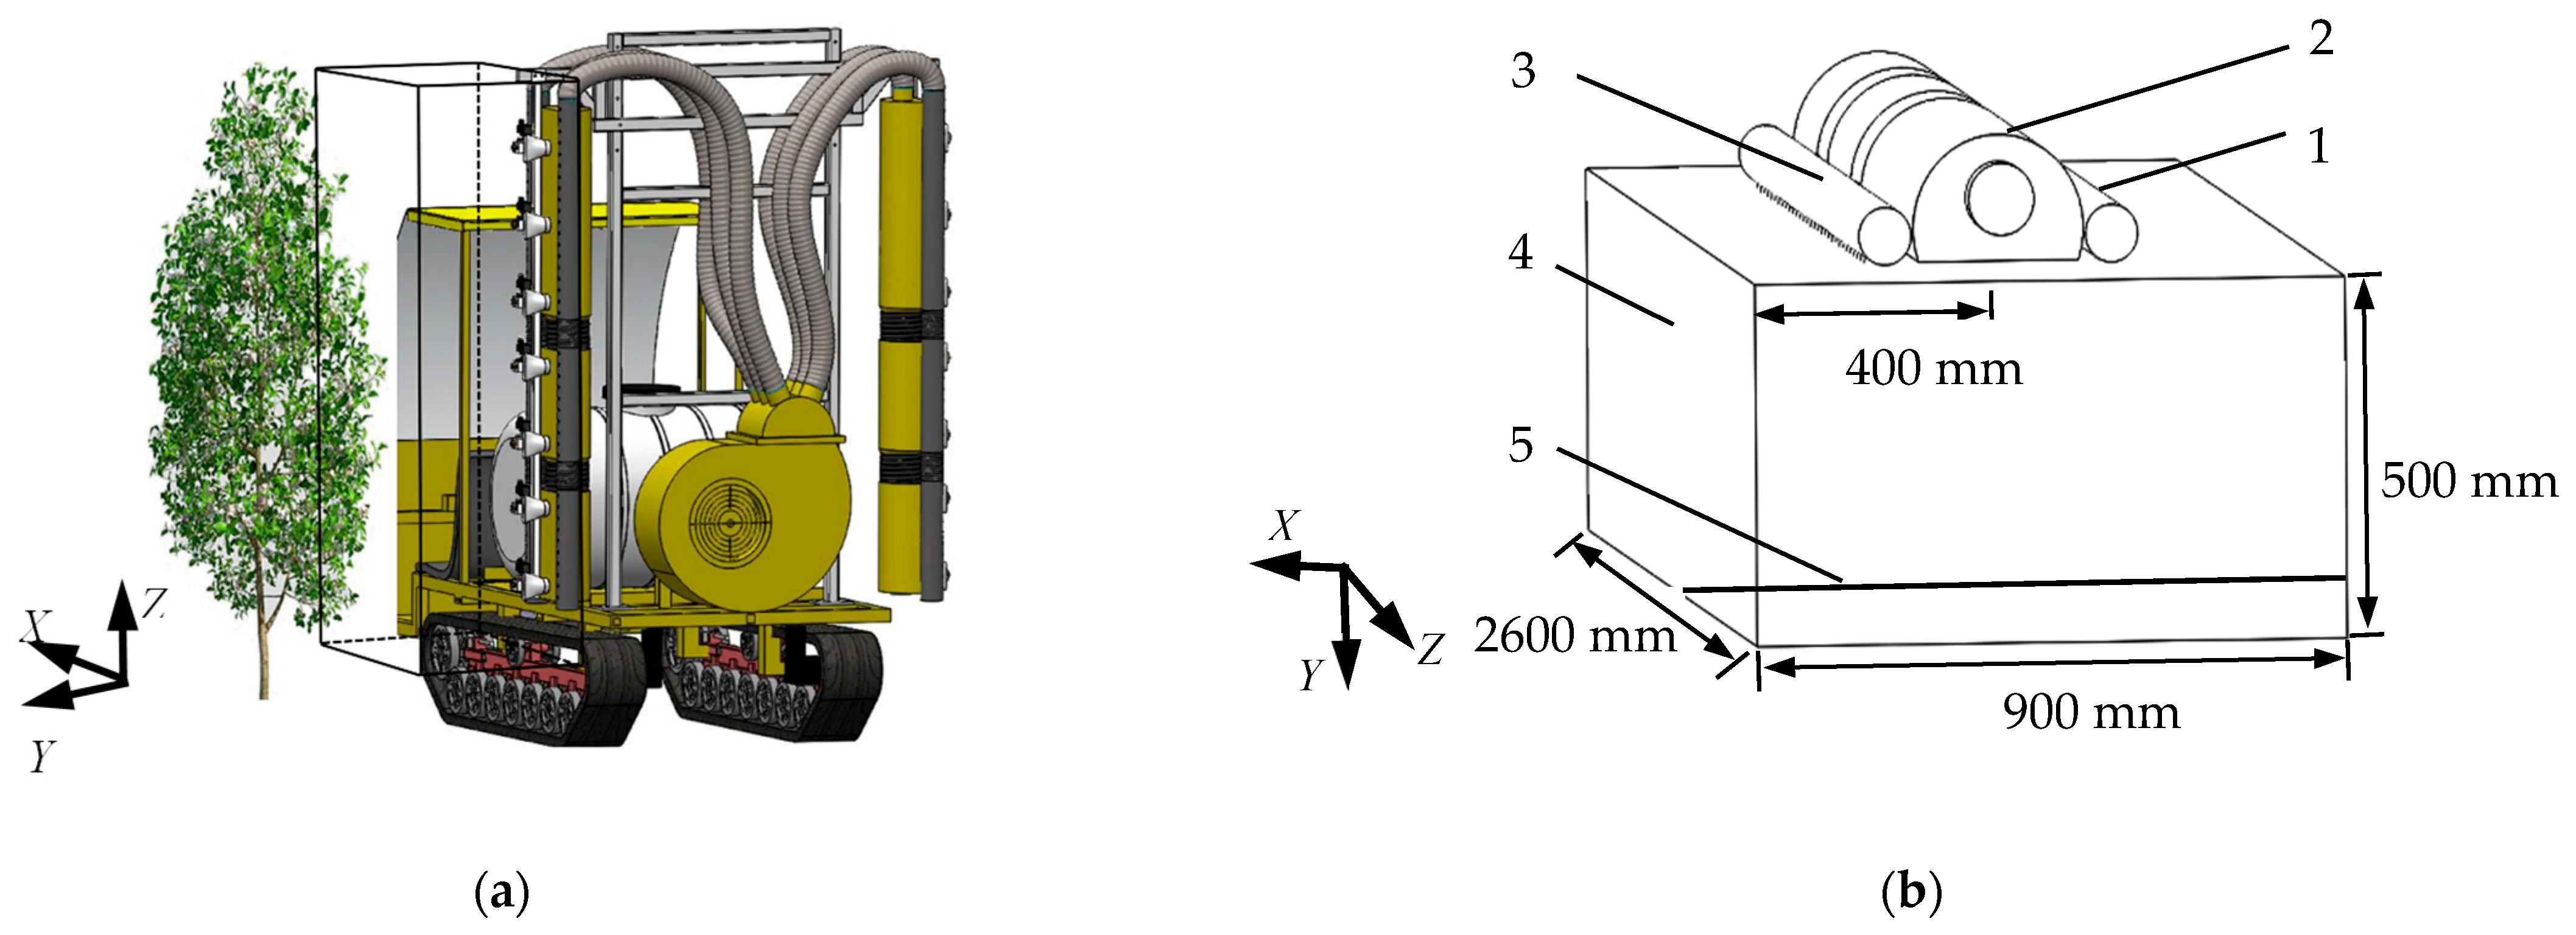
2.1.1. Structure of the Device

The V-shaped anti-drift spray device with multi-airflow synergy (Figure 1) is mainly composed of the airflow system and the spray system. The former includes centrifugal fans, distributors, main air duct, auxiliary air duct, and conveying air duct. In order to change the air volume of different airflow ducts, each outlet of the distributors was equipped with a butterfly valve to adjust the air speed. The latter includes a diaphragm pump, fan-shaped nozzle, liquid pipeline, etc. According to the plant height requirements, the main air duct was designed. There are 7 air outlets according to the number of fan nozzles. The fan-shaped nozzles were installed on the main air duct outlet. The two auxiliary air ducts are arranged in a V shape in the horizontal direction, and there are some small circular air outlets along the height direction.

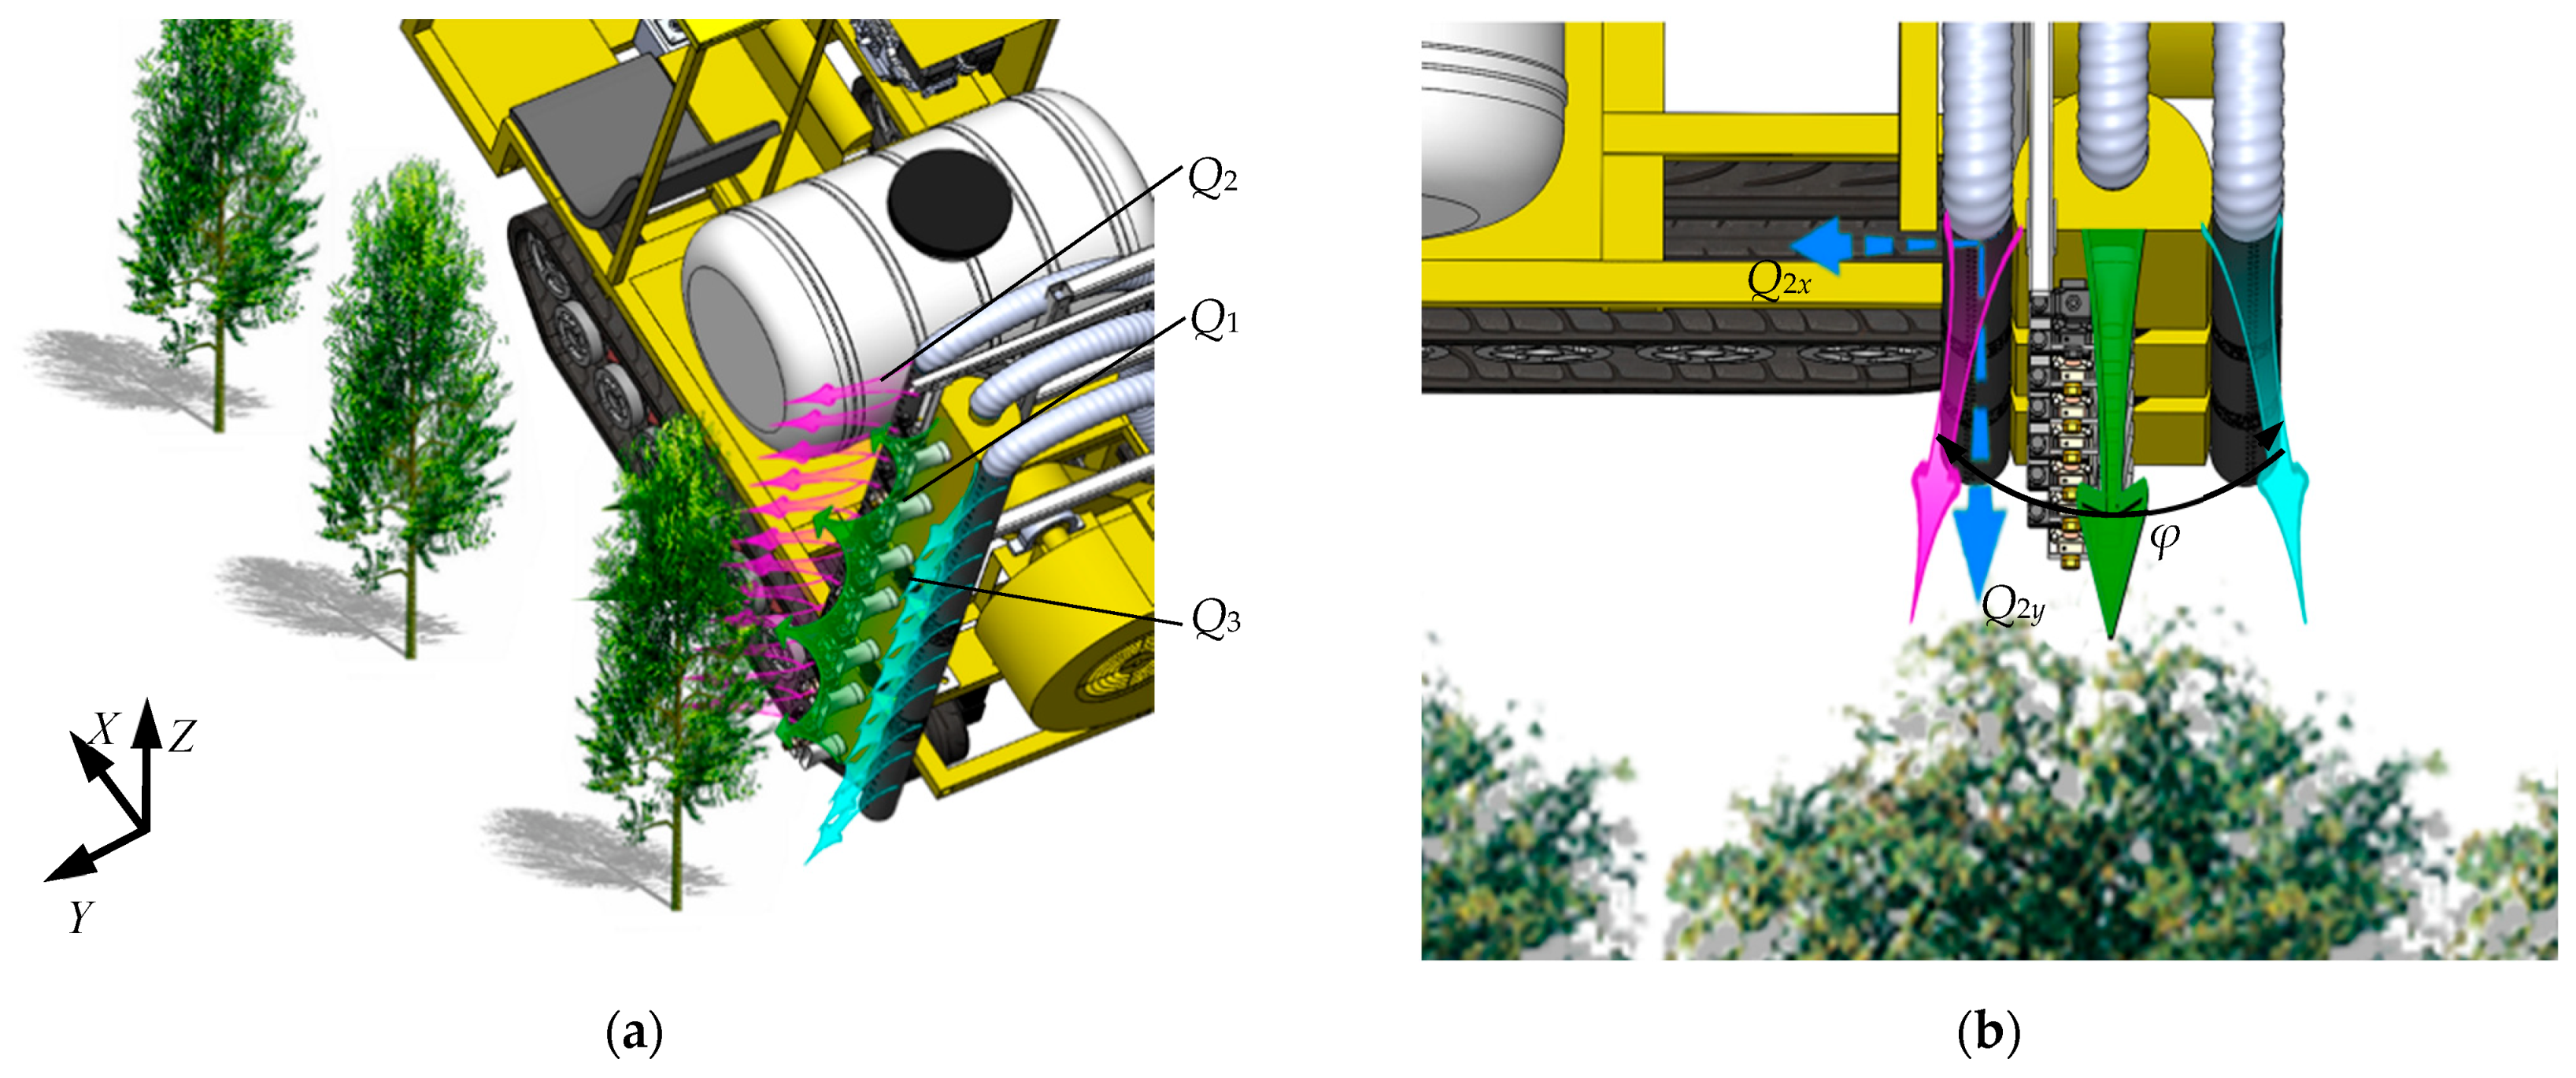
2.1.2. Working Principle

The assistant airflow of the spray device included the synergy of turbulent airflow, spray airflow, and anti-drift airflow. The V-shaped wind was composed of turbulent airflow and anti-drift airflow. The working principle of anti-drift is shown in Figure 2. X, Y, and Z are the driving direction, spraying direction, and plant height direction, respectively. φ is the angle between the air outlet directions of the auxiliary air ducts on both sides. Qh is the natural wind between the rows of fruit trees. When the machine is running against the wind, the main air duct generates the spray airflow Q1, which sends the atomized droplets of the nozzle to the fruit trees’ canopy. At the same time, the front auxiliary air duct generates the turbulent airflow Q2, which is divided into the airflow Q2x and the airflow Q2y. Therefore, they not only turn the branches and leaves over but also weaken the influence of natural wind on the droplets. The rear auxiliary air duct generates the anti-drift airflow Q3, which increases droplet deposition in the canopy of fruit trees. When the machine moves downwind, the two pairs of air ducts interact exchanges.

2.2. Droplet Dynamics Analysis in Multi-Airflow Synergy

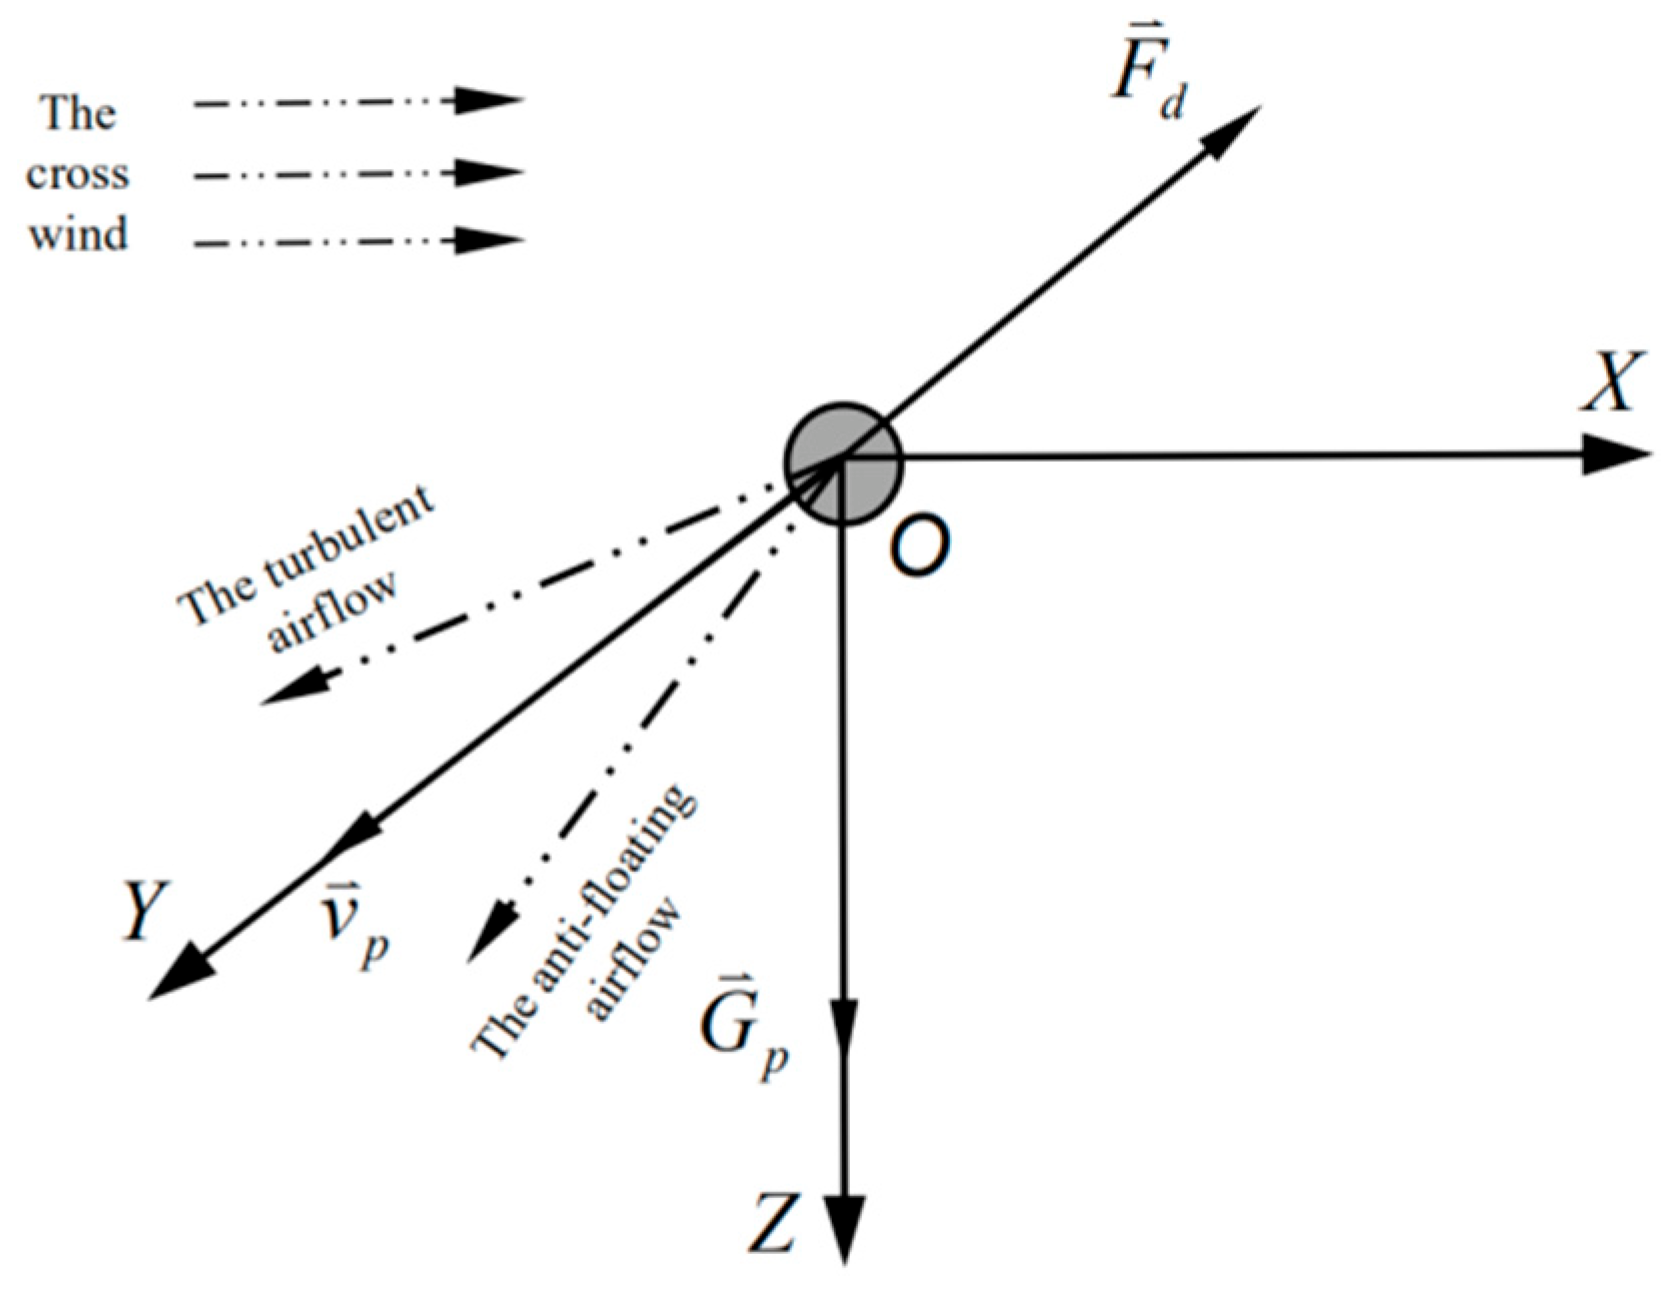
2.2.1. Droplet Force Analysis

In order to clarify the anti-drifting mechanism of multi-airflow synergy, the droplets are regarded as particles. The forces of a droplet in the airflow field are shown in Figure 3. The X-direction is the natural wind direction between the rows, which is perpendicular to the fan-shaped spray surface. The Y-direction is the droplet movement direction, which is parallel to the fan-shaped spray surface. The Z-direction is the gravity direction. The crosswind, the turbulent airflow, the spray airflow, and the anti-drifting airflow work together. Therefore, the droplets are mainly affected by gravity and air drag during the movement from the nozzle to the canopy.

2.2.2. Model of Droplet Motion in Space

(a)
Construction of motion model
According to the particle dynamics theory, the motion equation of a single droplet can be simplified as follows:
m p d v p d t = π 6 d p 3 ρ p g + π 8 C d d d ρ f | v f v p | ( v f v p )
where m p is individual droplet mass (kg), v p is individual droplet velocity (m/s), d p is the diameter of an individual droplet (m), ρ p is the density of droplets (kg/m3), C d is coefficient of air resistance, ρ f is air density (kg/m3), v f is air velocity (m/s), and g is the acceleration of gravity (m/s2).
According to the vector decomposition theorem, the motion equations in the three directions of X, Y, and Z are as follows:
{ m p d v p x d t = π 8 C d d p ρ f | v f x v p x | ( v f x v p x ) m p d v p y d t = π 8 C d d p ρ f | v f y v p y | ( v f y v p y ) m p d v p z d t = m p g π 8 C d d p ρ f v p z 2
where v p x , v p y , and v p z are the velocity components of the droplet along each direction, respectively.
Therefore, by the local approximation method, the displacement of a droplet is as follows:
{ x p = x p 0 + 0 Δ t v p x d t y p = y p 0 + 0 Δ t v p y d t z p = z p 0 + 0 Δ t v p z d t
where Δ t is the time step, x p 0 , y p 0 and z p 0 are the coordinates of the initial droplet position, respectively.
(b)
Solution of motion model
Given the initial conditions and time steps of the droplets, the droplet displacement was calculated by Matlab.
According to Ref. [33], most of the droplets have the same speed when they are ejected through the nozzle. Therefore, the initial droplet velocity is set to 20 m/s [34]. It is supposed that the angle between the initial droplet velocity and the positive direction of the Y-axis is α. The initial droplet velocities in the Y and Z directions, respectively, are as follows:
v p y 0 = v p 0 × cos α v p z 0 = v p 0 × sin α
Because the spray angle of the machine’s fan nozzle selected is 80°, α is from −40° to 40°.
Droplet diameter is another important factor affecting droplet deposition. It is mainly in the range of D10D90 [35], and the droplet size distribution can be approximately considered a normal distribution. Therefore, the initial droplet diameter is as follows:
d p = n o r m r n d ( D 50 , σ )
where D50 is the median diameter of the droplet and α is the standard deviation. By adjusting the spray pressure, the droplet diameter changes. According to Ref. [36], D50 is about 50~110 μm when the spray pressure is 0.3~0.7 MPa.

2.3. Simulation Method

2.3.1. Geometric Model

According to the actual spray operation, the spray flow field model (Figure 4a) was constructed in ANSYS ICEM CFD 18.0 [37,38]. As shown in Figure 4b, the model is mainly composed of the front turbulent airflow duct, the main spray airflow duct, the rear anti-drift airflow duct, and the external spray basin. The external spray basin from the nozzle to the edge of the canopy is simplified as a cuboid in the model, in which the length, width, and height of the cuboid are 900 mm, 500 mm, and 2600 mm, respectively. The nozzle models were set on the air outlet of the main air duct. These parts, including the ducts and the external spray basin adjacent to them, were divided into tetrahedral meshes. The rest parts were divided into hexahedral meshes. Grid-independent test showed that the grid quality was better. The total number of cells in the model was 2,864,939. RNG k − ε was taken as the turbulence model.
There are three DPM [39,40] boundary conditions, which are namely “reflect”, “escape”, and “trap”. The canopy boundary was set to trap according to the work object; thus, the droplets would have been captured when they reached the surface. One side of the model was set to escape, which meant that the droplets would escape when they reached the surface. The parameters of the fan nozzle are shown in Table 1. The material of the discrete phase model replaced pesticide with water.

2.3.2. Design of Simulation

The droplet deposition and drift are greatly affected by the airflow field and droplet size relating to spray pressure [41]. Therefore, considering crosswind speed, V-shaped wind speed, and spray pressure and using the method of partial multivariate orthogonal regression [42], three-level simulation experiments of droplet deposition were designed for each factor, which is shown in Table 2. A, B, and C are combinations of different degrees of each factor, respectively.

2.4. Design of Experiments

The experimental devices are shown in Figure 5. The FS-75 industrial fan was equipped with a honeycomb rectifier to simulate crosswind. The droplet collecting plate was composed of 70 droplet collecting troughs at intervals of 20 mm. The spray medium is water. The experimental conditions are as follows: the crosswind speed is 2 m/s, the spray airflow velocity is 15 m/s, the V-shaped wind speed is 20 m/s, the spray pressure is 0.5 MPa, and the spraying time is 10 s. The average values were taken 5 times in each group.

3. Results and Discussion

3.1. Influence of Operating Parameters on Droplet Movement

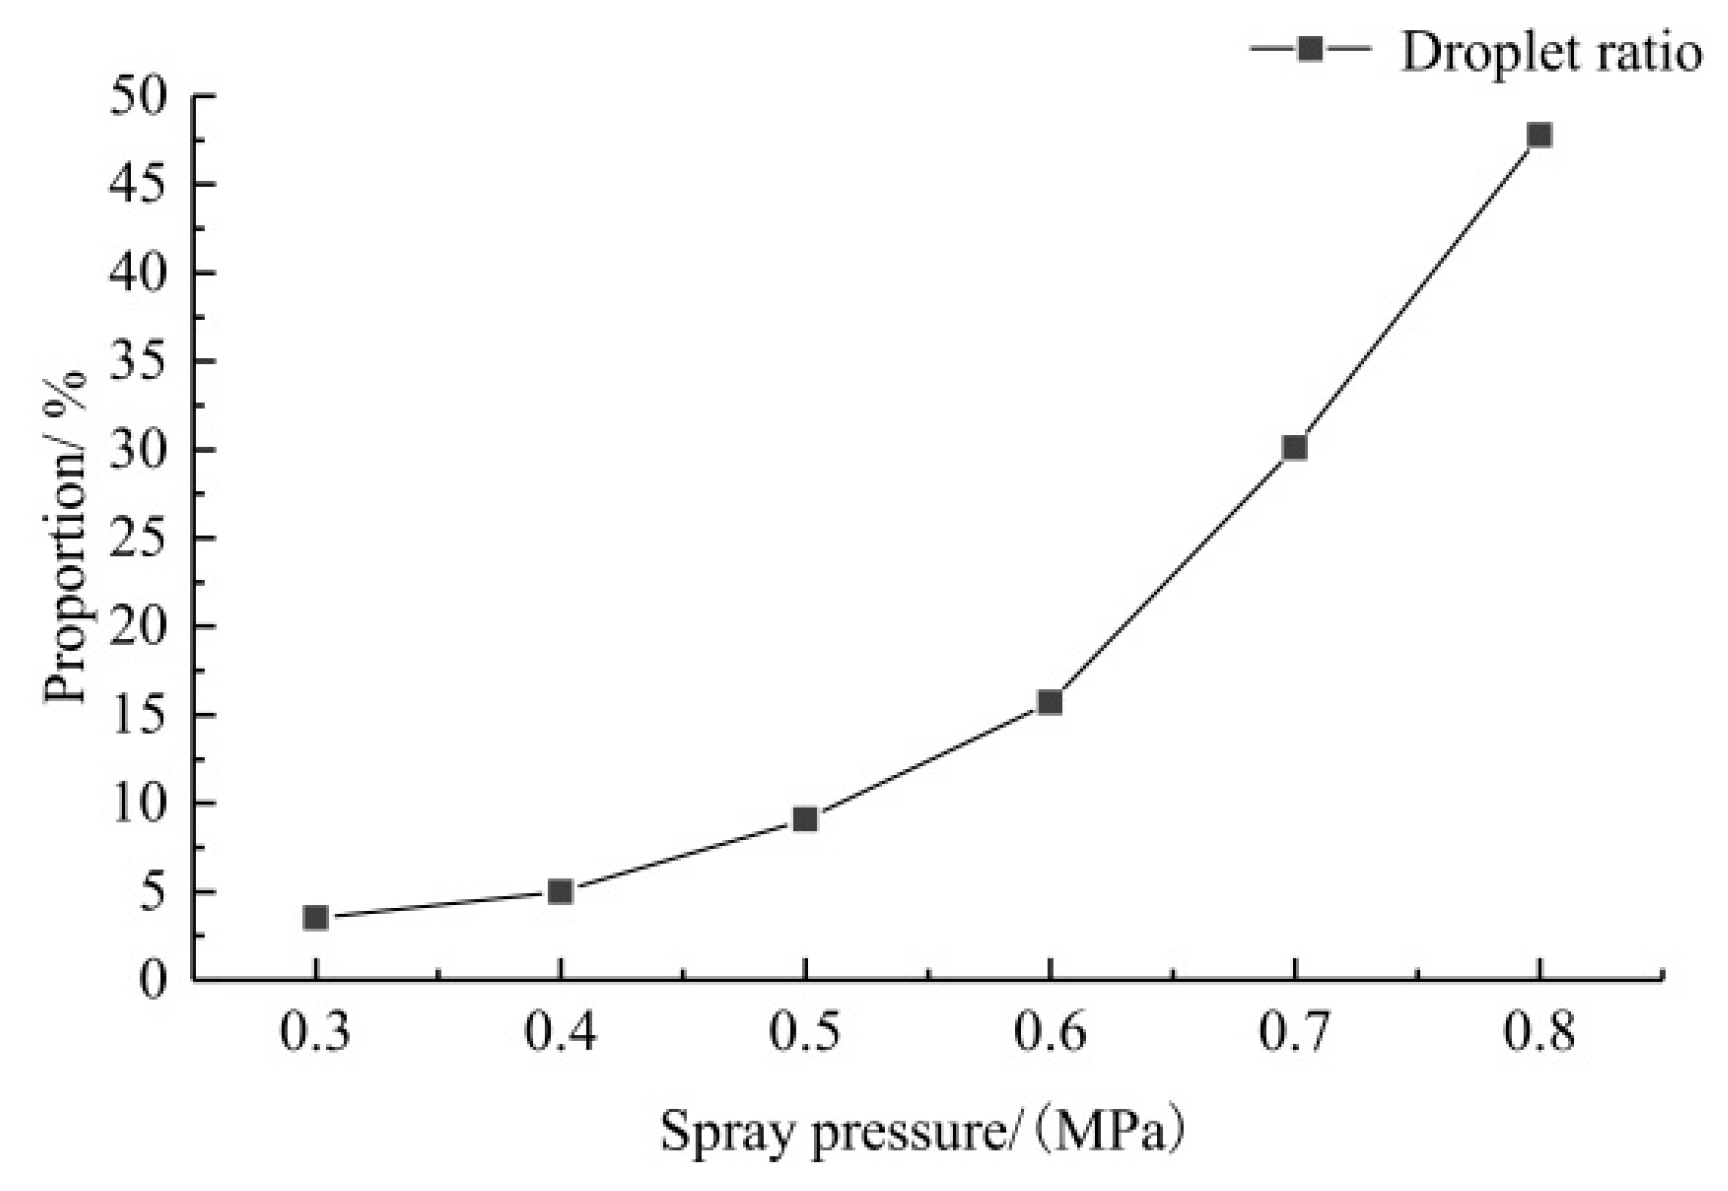
3.1.1. Spray Pressure

When the crosswind wind speed was 4 m/s and the V-shaped wind speed was 20 m/s, and the spray pressure was changed from 0.3 MPa to 0.8 MPa at an equal interval of 0.1 MPa, these parameters were substituted into the Equation (3) to obtain the droplet displacements. The cross-section parallel to the X-Z direction and 0.30 m from the origin was regarded as the reference surface. The droplet distributions on the surface are shown in Figure 6.
As shown in Figure 6, when the spray pressure is the same, the smaller the droplet diameter is, the further its positions are [43], which indicates that the droplet displacement is positively correlated with its diameter. When the spray pressure is different, the bigger the spray pressure is, the further the overall X-direction displacement of the droplet group is, which indicates that droplet drift is more serious. The percentage of droplet numbers with X-direction displacement greater than 10 cm was defined as the proportion of drift droplets. They are shown in Figure 7.
As shown in Figure 7, when the spray pressure increases from 0.3 MPa to 0.6 MPa, the proportion of drifting droplets increases slowly. However, when the spray pressure continues to increase, the proportion increases sharply, which indicates that the droplet drift is serious. When the spray pressure is 0.8 MPa, the proportion of drifting droplets is about 49.6%. Therefore, in order to reduce droplets drifting, it is necessary to reduce the spray pressure in the working machine process. However, if the spray pressure is too small, the droplets are too large to reach the canopy. Therefore, the range of the spray pressure is from 0.4 MPa to 0.6 MPa.

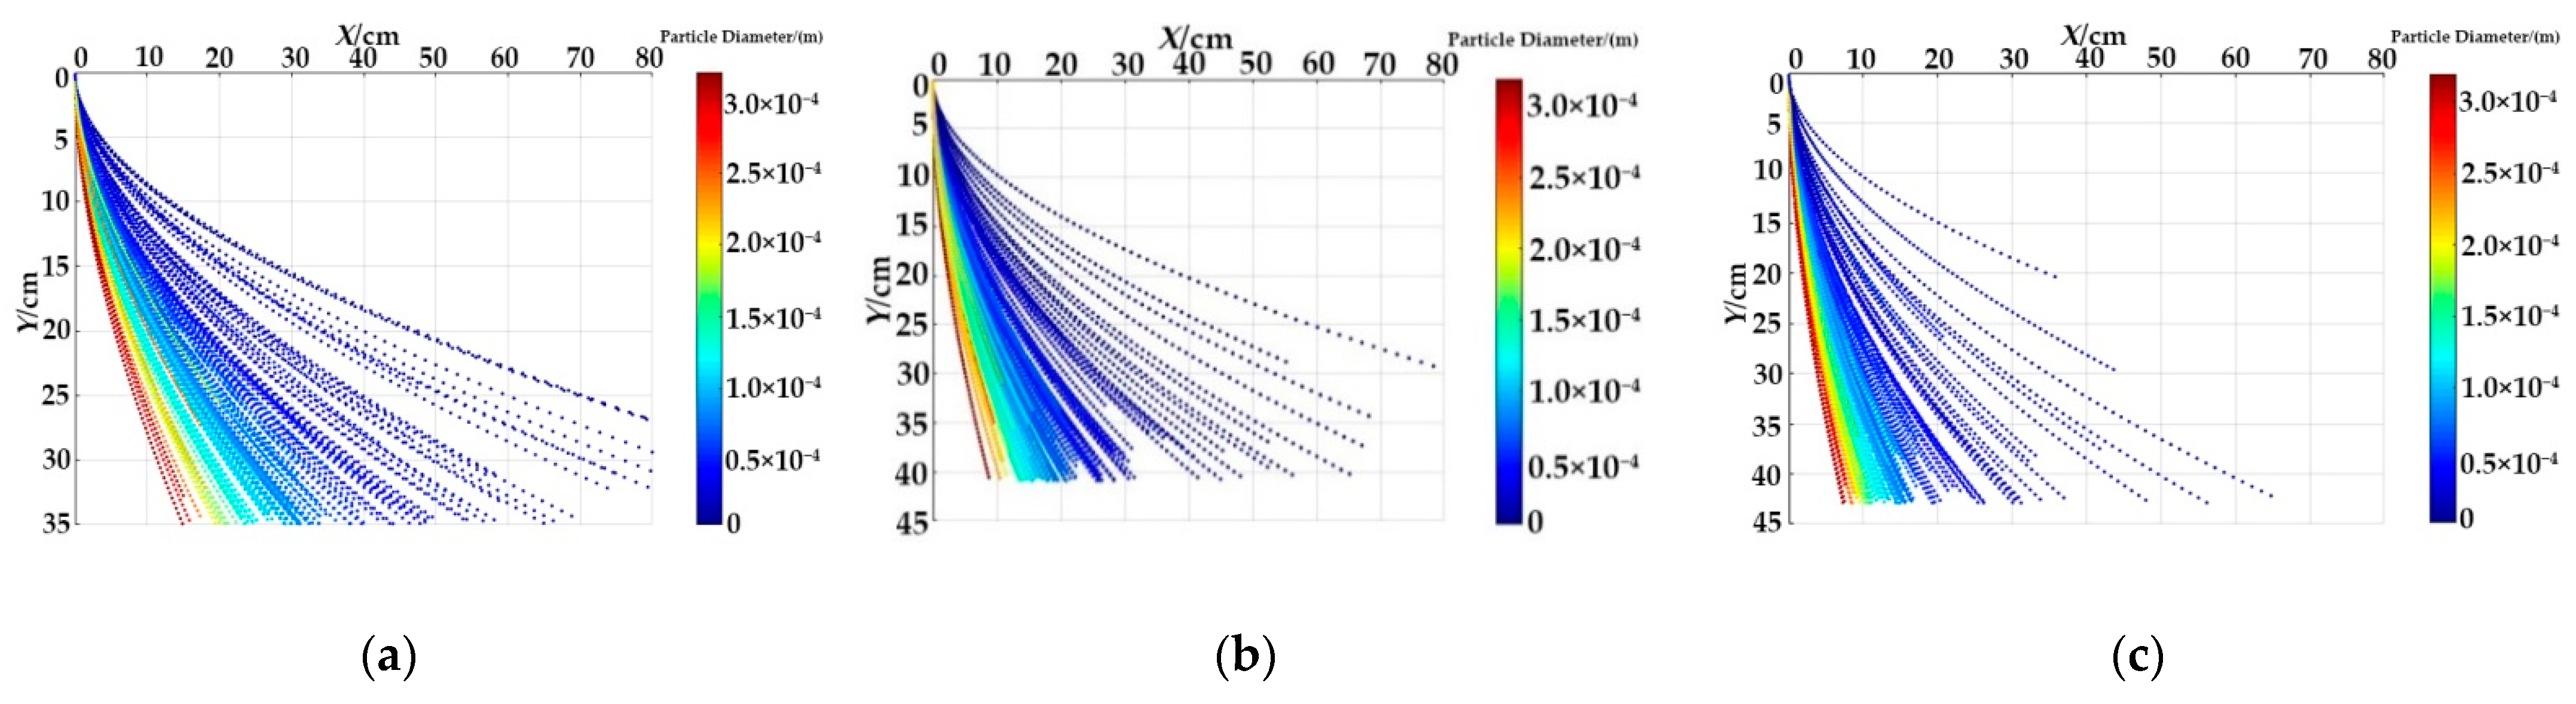
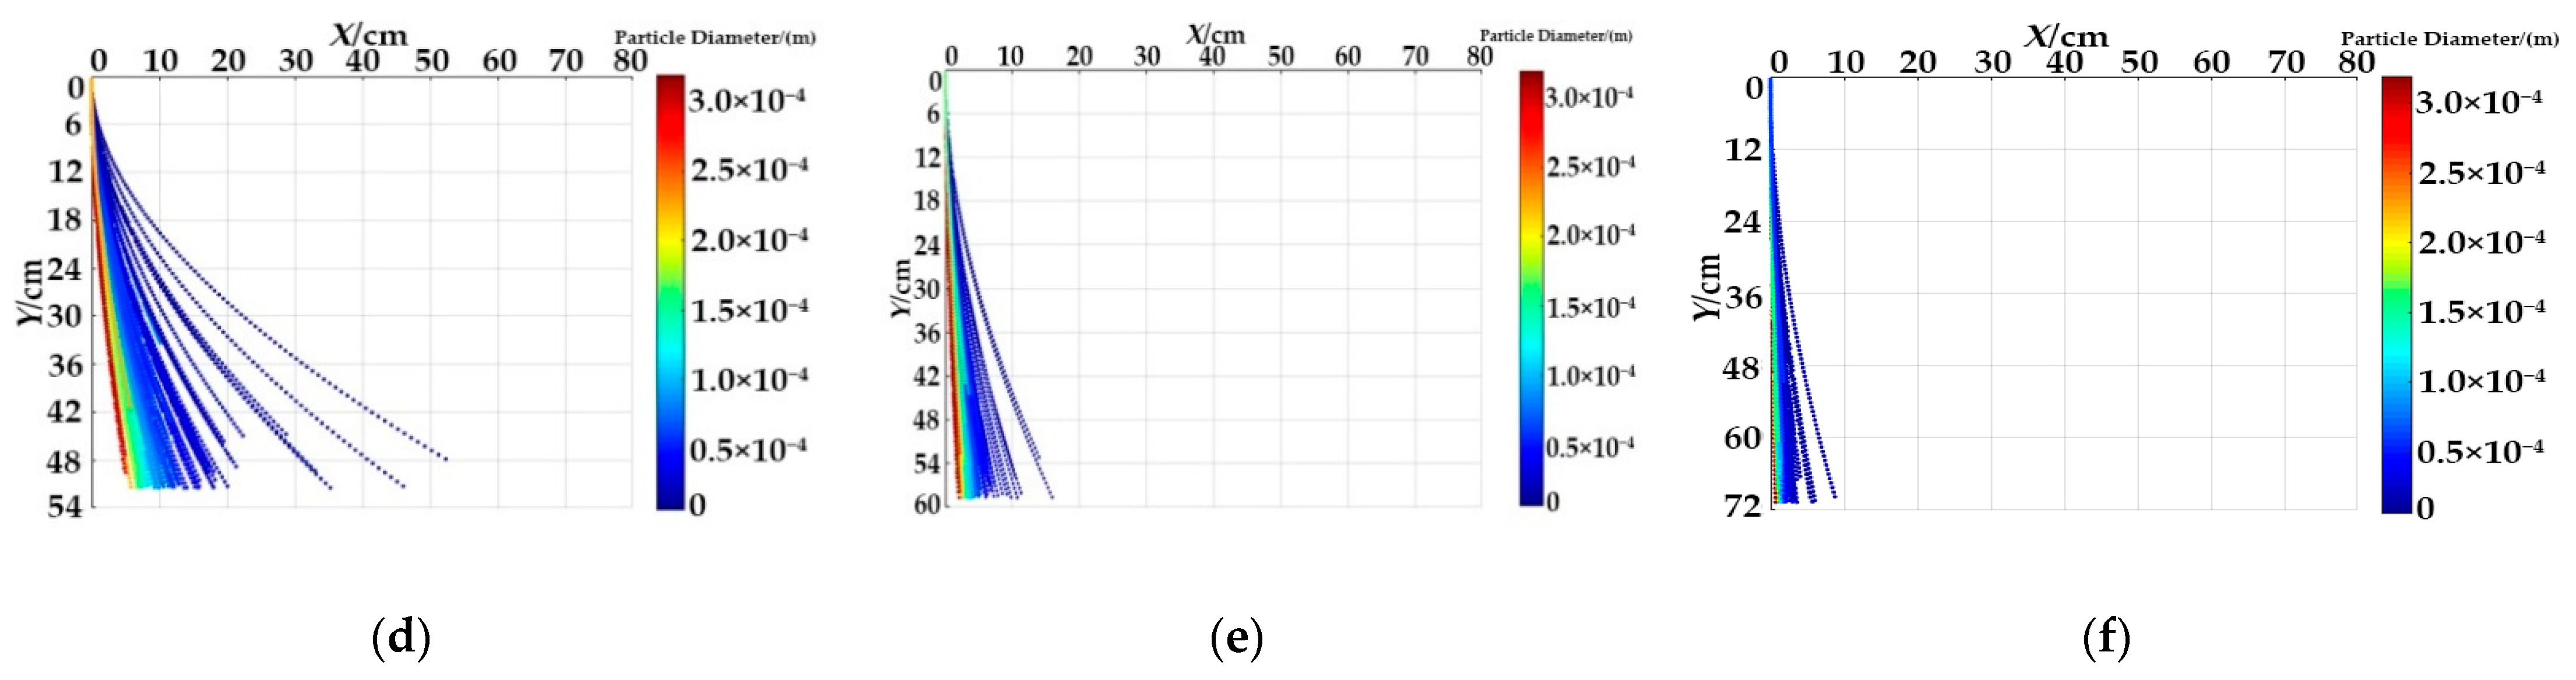
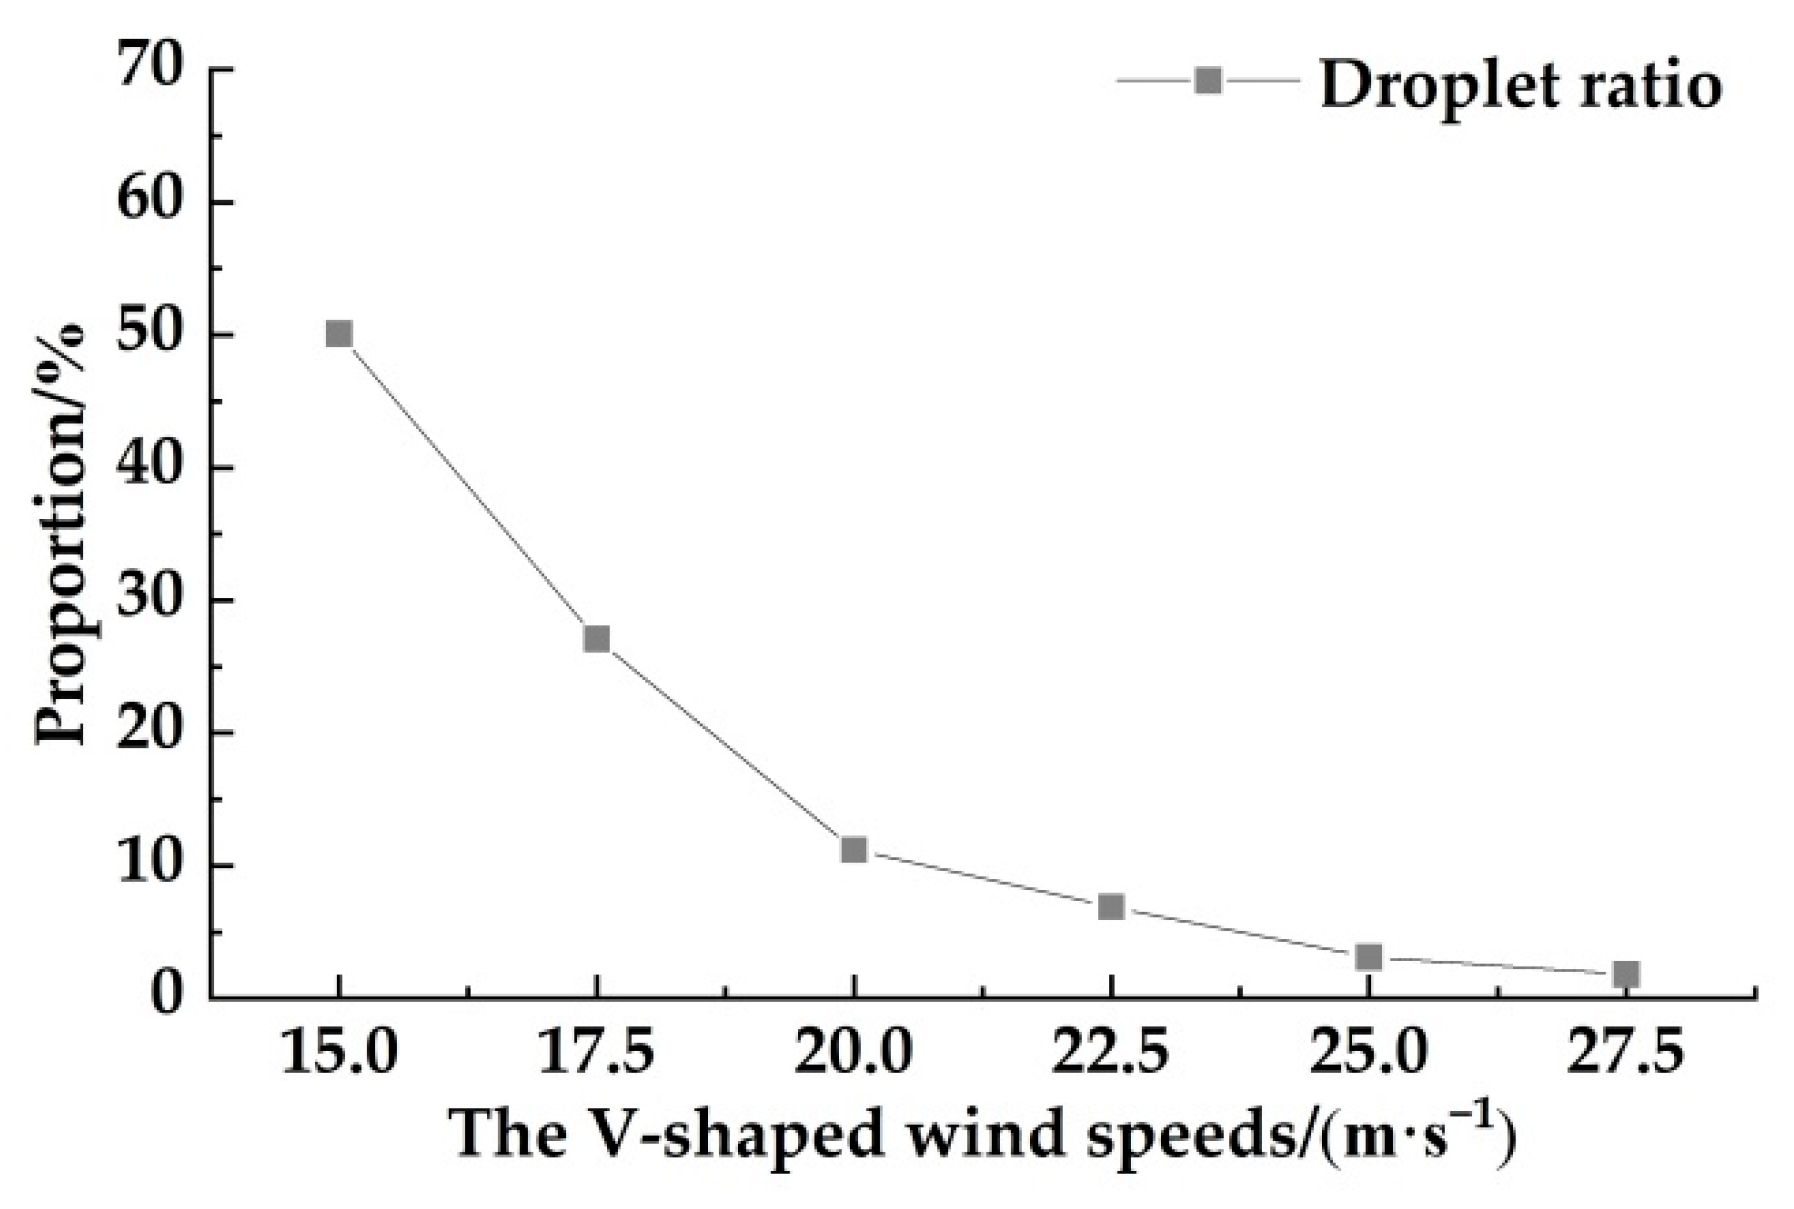
3.1.2. V-Shaped Wind Speed

When the crosswind wind speed was 4 m/s and the spray pressure was 0.5 MPa, and the V-shaped wind speed was changed from 15 m/s to 27.5 m/s at an equal interval of 2.5 m/s, the cross-section parallel to the X-Y direction was regarded as the reference surface. The droplet distributions on the surface are shown in Figure 8.
As shown in Figure 8, when the V-shaped wind speed is the same, the smaller the droplet diameter is, the further its position is. When the V-shaped wind speed is different, the faster the V-shaped wind speed is, the further the overall X-direction displacement of the droplet group is, which indicates that droplet drift is more serious. The proportions of drifting droplets with different V-shaped wind speeds are shown in Figure 9.
As shown in Figure 9, when the V-shaped wind speed increases from 15 m/s to 20 m/s, the proportion of drifting droplets decreases sharply. However, when V-shaped wind speed continues to increase, the proportion decreases slowly, which indicates that the drifting droplets are less. When the V-shaped wind speed is 27.5 MPa, the proportion is only about 1.8%. Therefore, in order to reduce droplets drifting, it is necessary to appropriately increase the V-shaped wind speed in the working machine process. Therefore, the range of the V-shaped wind speed is from 15 m/s to 20 m/s.

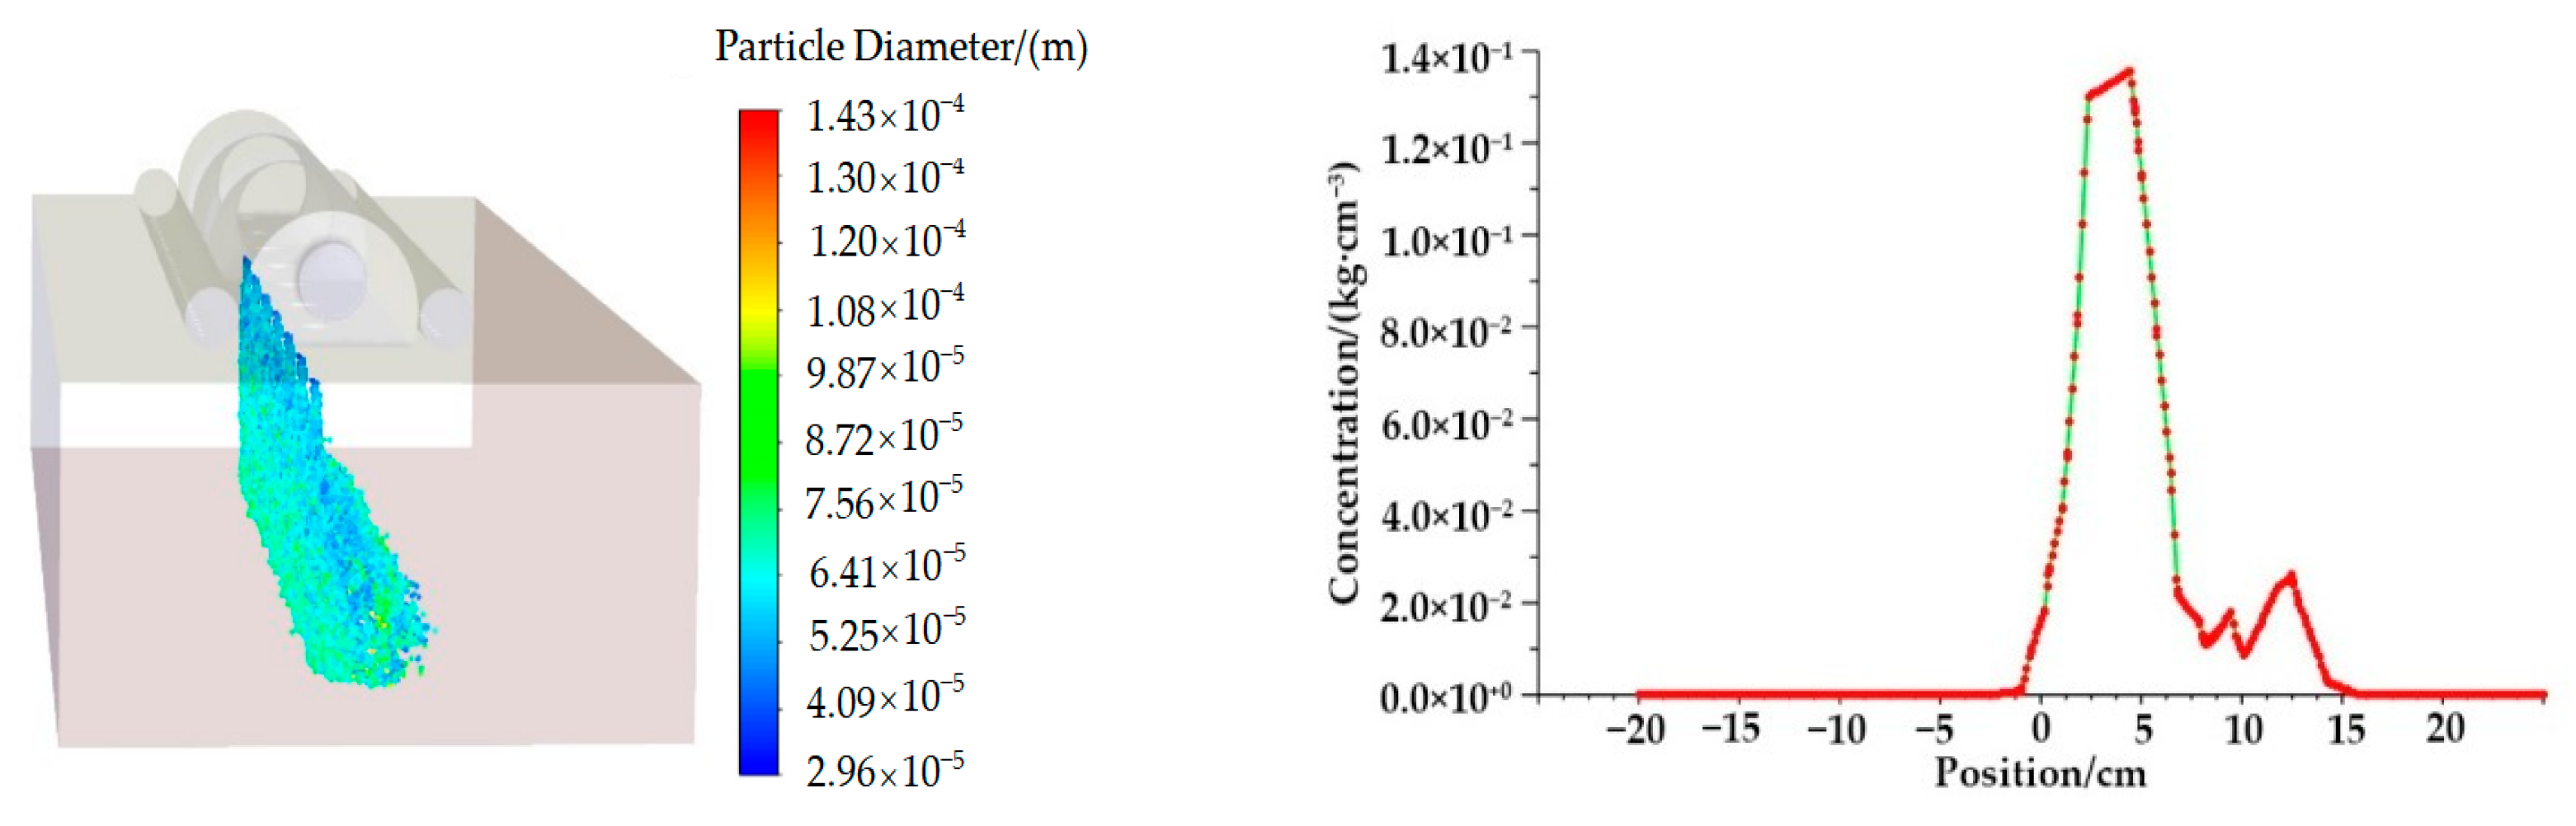
3.2. Droplets Deposition Characteristics

According to the calculated results of the droplet motion model, the droplet deposition characteristics would be simulated. In this paper, the droplet deposition characteristics mean the droplet’s spatial distribution, the droplet’s drifting angle, and the drifting distance of the droplet’s deposition center.

3.2.1. Droplet Drift Angle

When the V-shaped wind speed was 20 m/s, the spray pressure was 0.5 MPa, and the crosswind speed was 2 m/s and 4 m/s, respectively, simulation experiments were carried out. The droplet’s spatial distribution is shown in Figure 10.
As shown in Figure 10, when the crosswind wind speed is 4 m/s, the droplets had obvious lateral drift. Additionally, the smaller the droplet diameter is, the further the lateral drifting distance is. The angle between the drifting profile and the droplet concentration calibration line was defined as β. When the crosswind speed is 2 m/s, β is about 21°. However, when the crosswind wind speed is 4 m/s, β is about 31°, which indicates that the droplet drift is serious. Therefore, it is not suitable for spraying when the natural wind speed is higher.

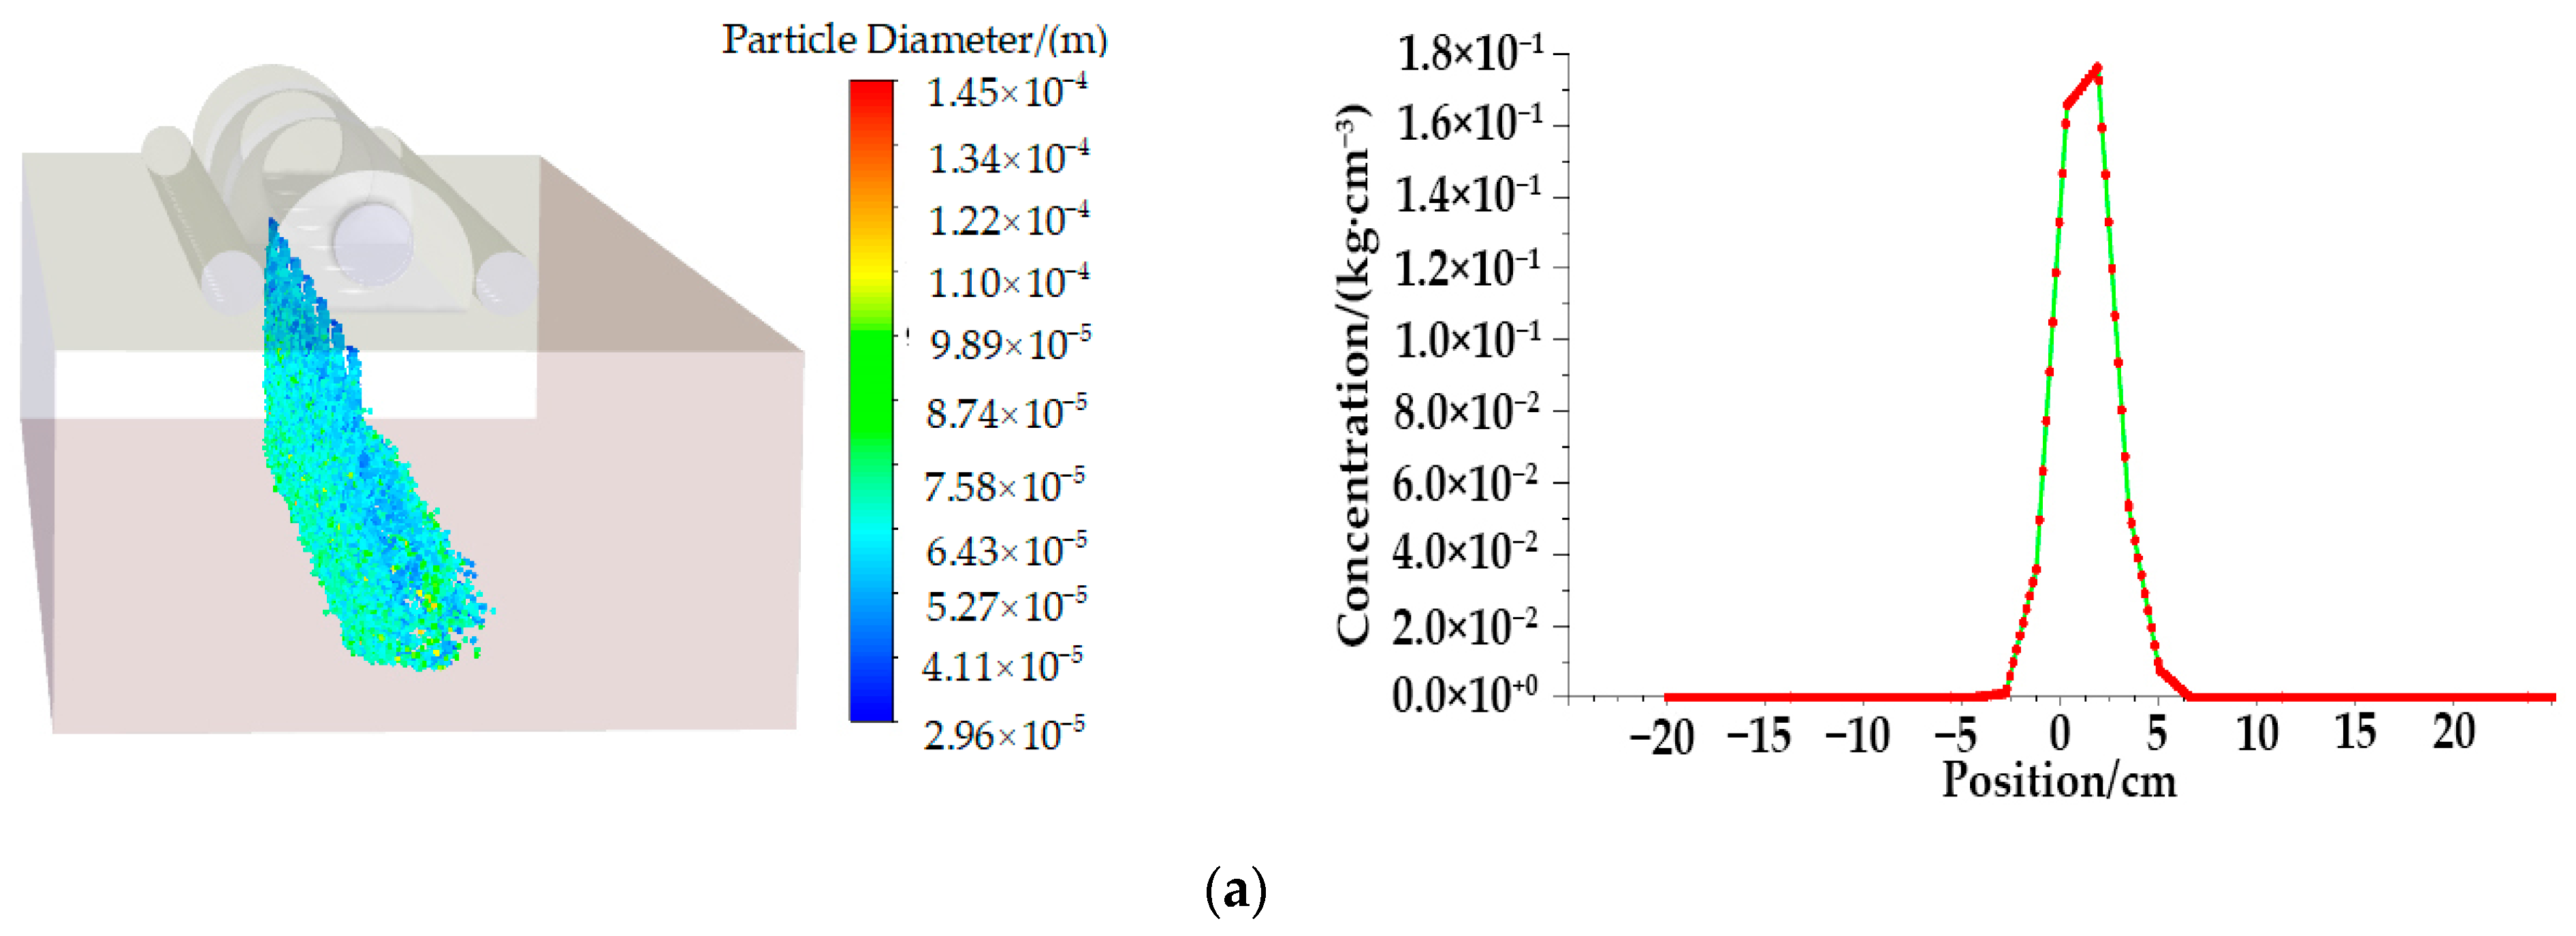
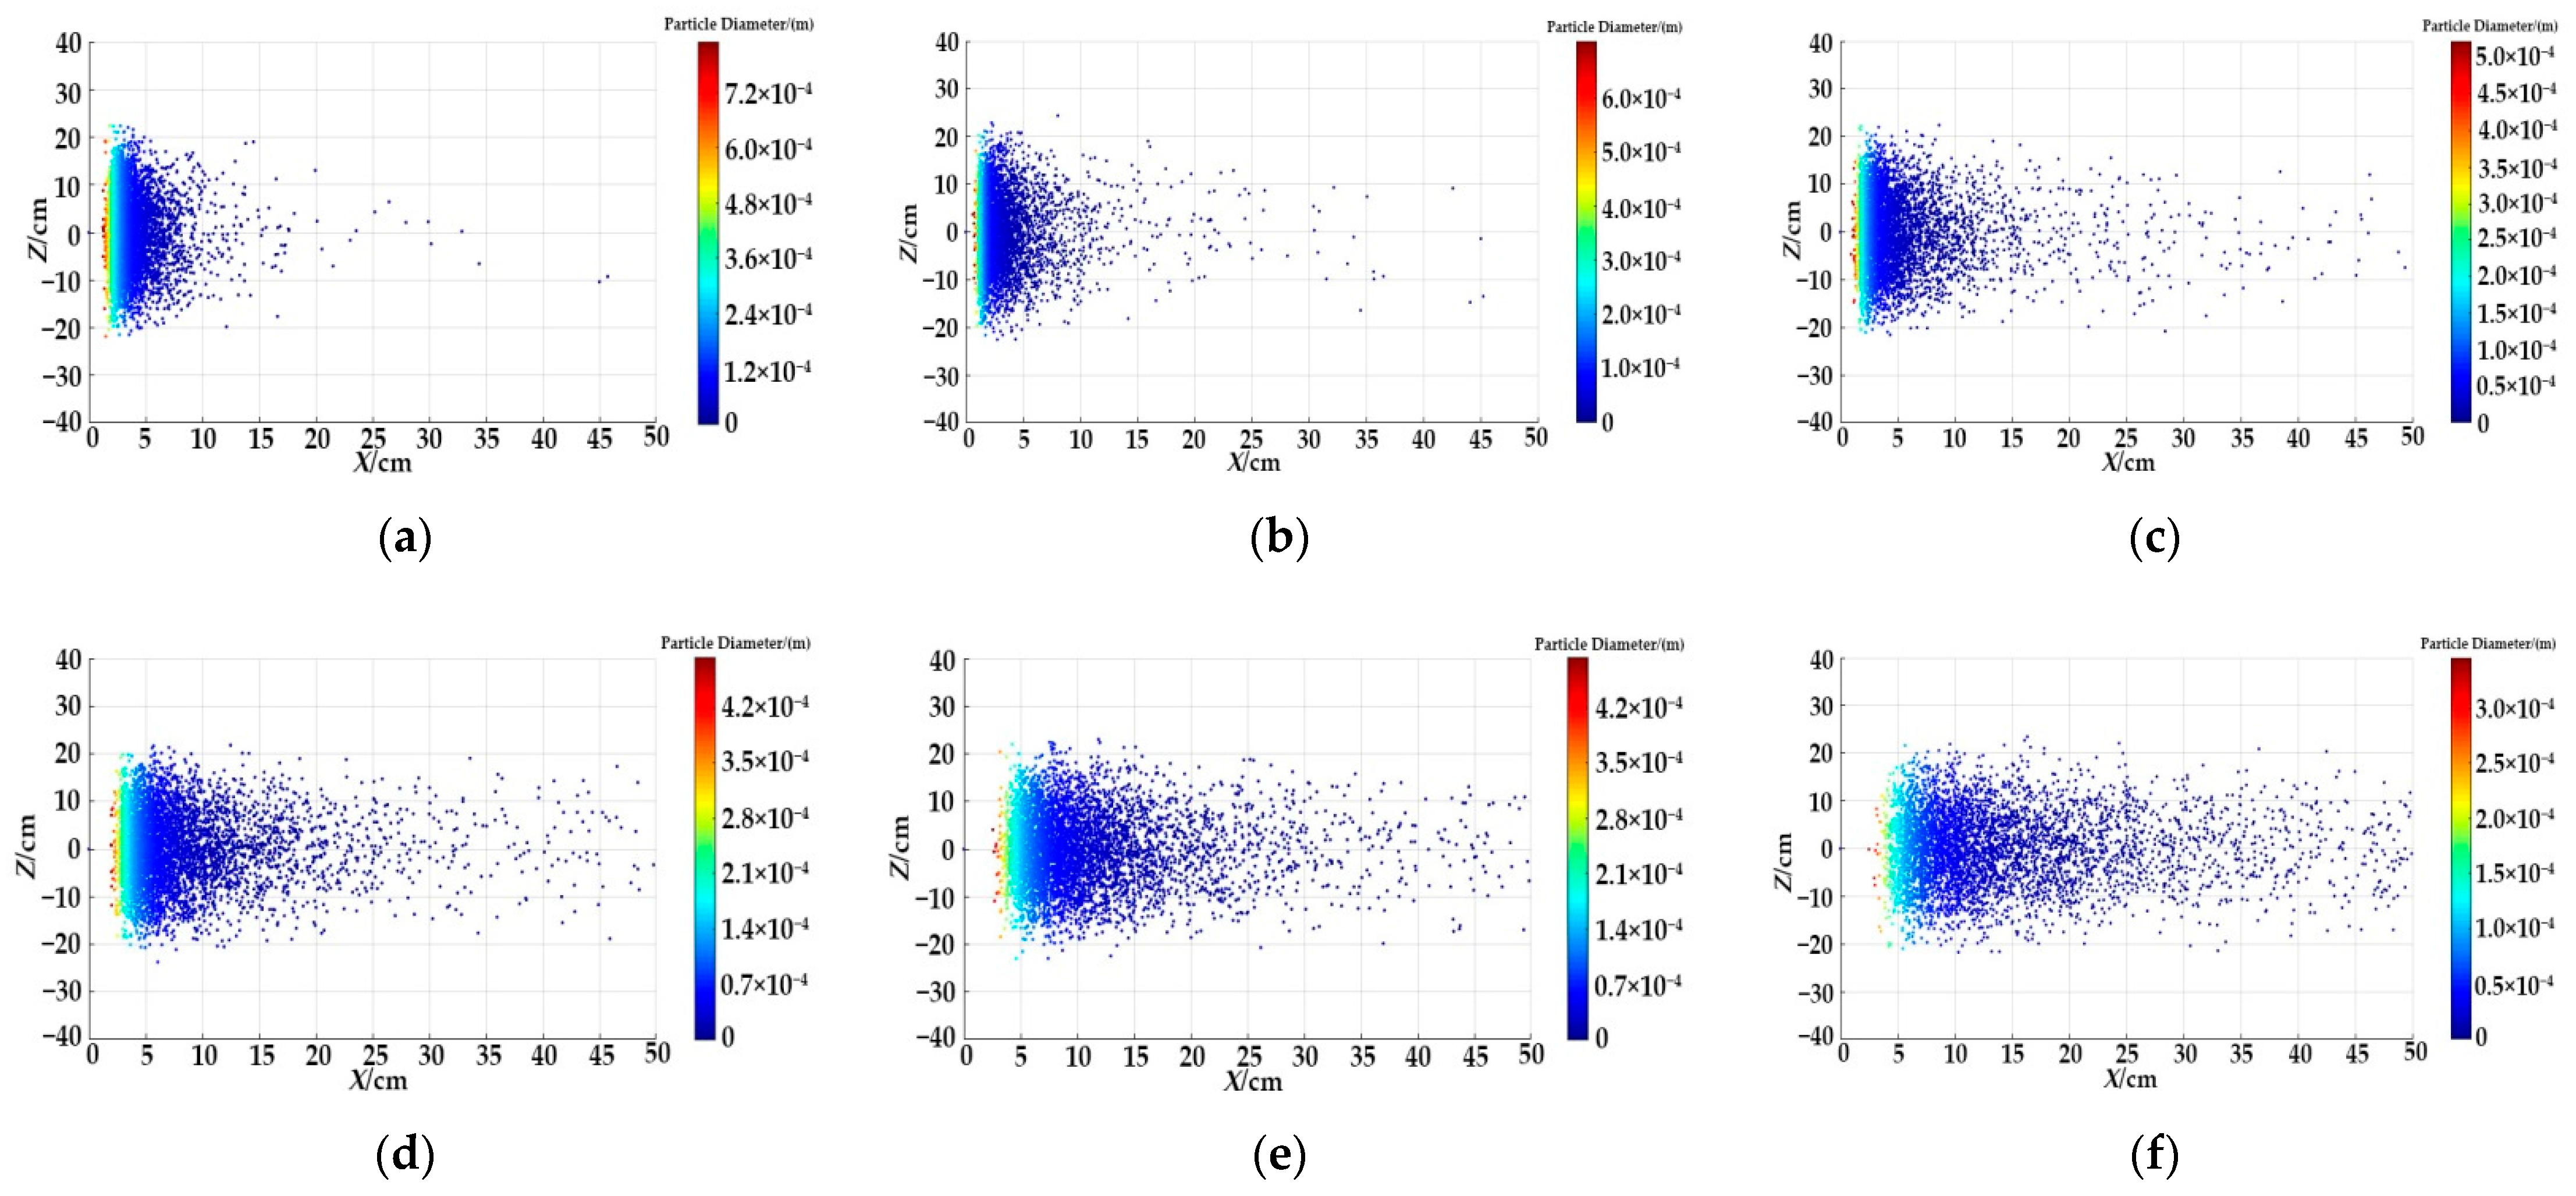
3.2.2. Simulation of the Influence of Different Factors on Droplets Deposition

According to the droplet’s spatial distribution, the droplet concentration in the calibration line was obtained by the fluent post-processing. The maximum concentration point was regarded as the droplet deposition center. Therefore, the influences on droplet deposition were analyzed by comparing the drifting distance of the droplet’s deposition center.
(a)
Influence of crosswind wind speed on droplet deposition
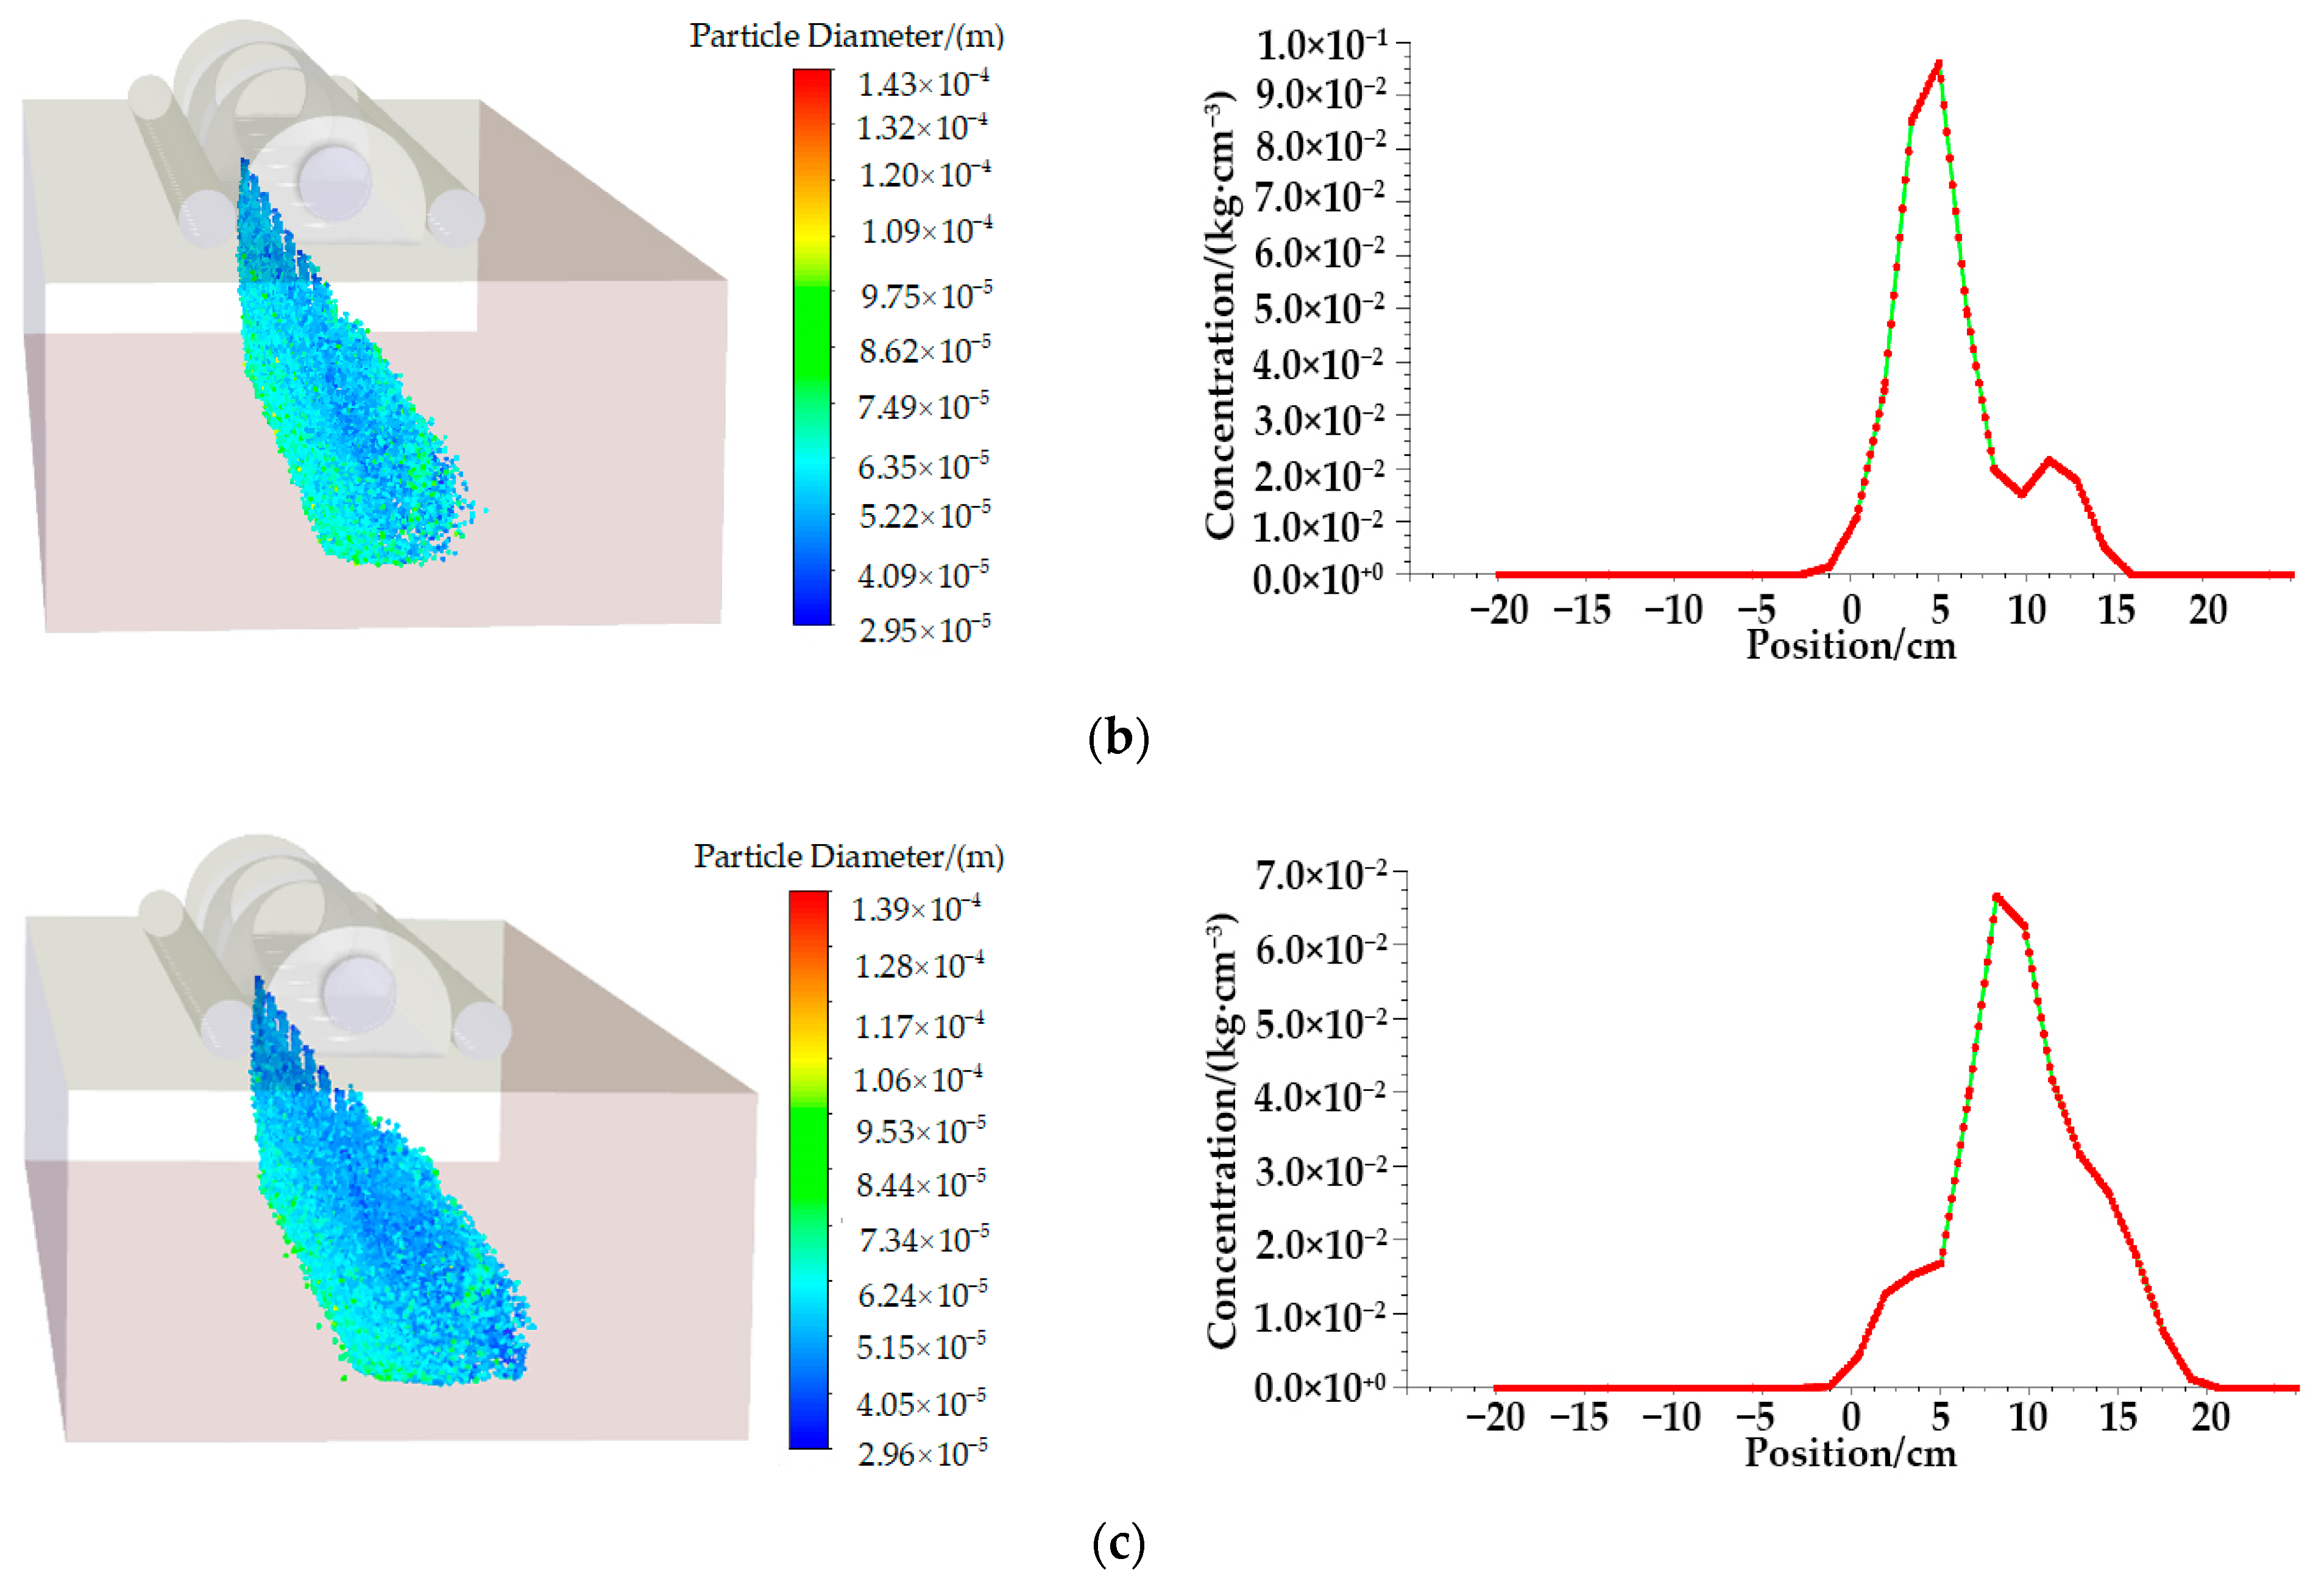
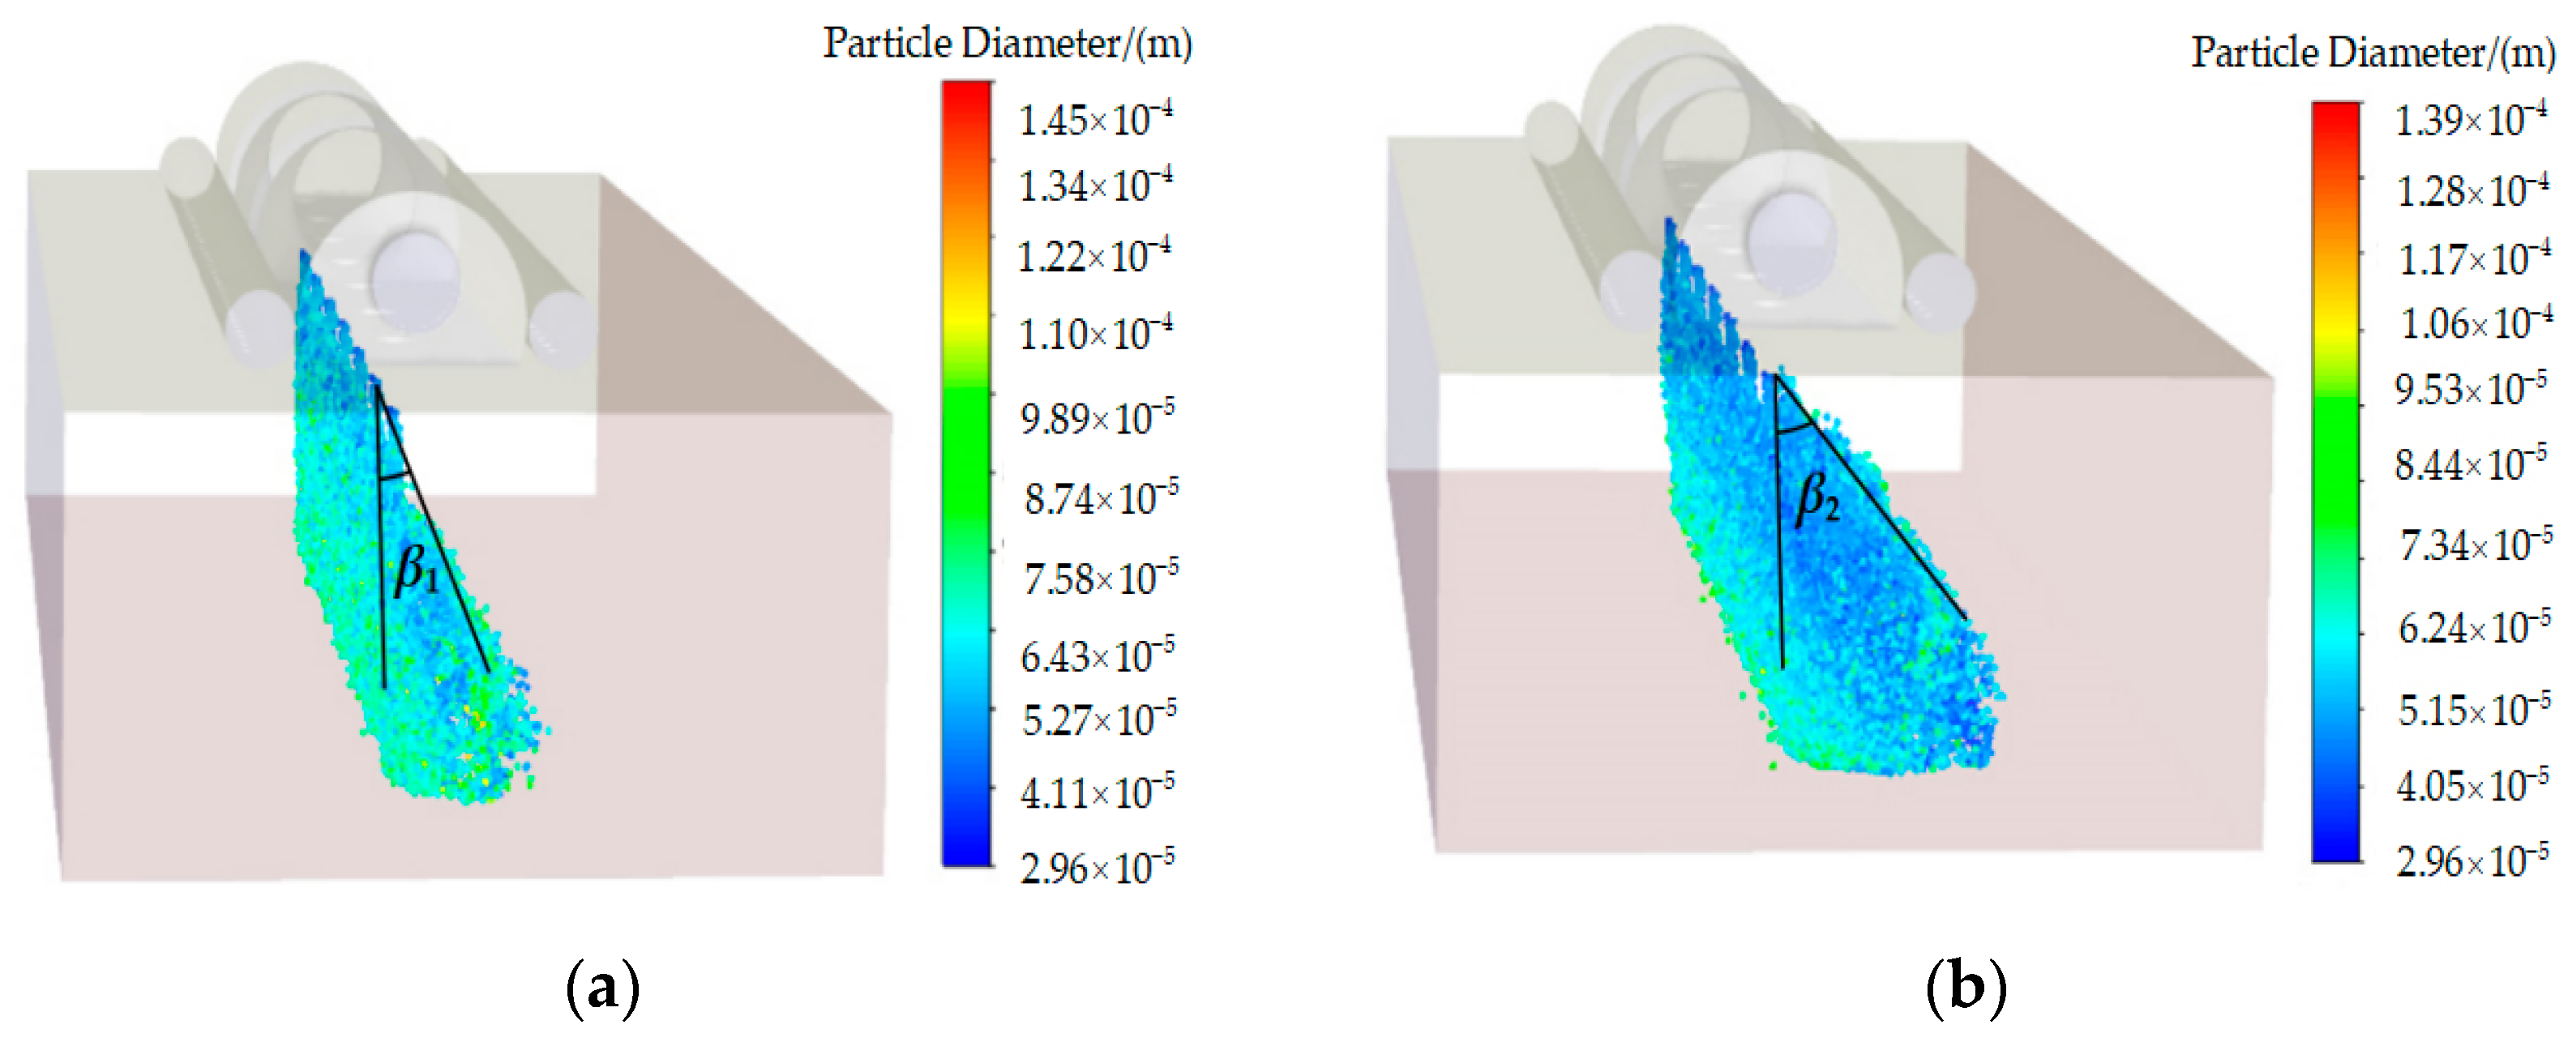
When the V-shaped wind speed was 20 m/s, and the spray pressure was 0.5 MPa, the crosswind wind was changed from 2 m/s to 4 m/s at an equal interval of 1 m/s. The droplet’s spatial distribution and the droplet concentration in the calibration line are shown in Figure 11.
As shown in Figure 11, when the V-shaped wind speed and the spray pressure are the same, the faster the crosswind wind speed is, the bigger β is, the smaller the droplet concentration in the calibration line is, and the further the drifting distance of droplet deposition center is. When the crosswind wind speed remains constant, the droplet concentration in the calibration line increases first and then decreases. When the crosswind speed is 4 m/s, the drifting distance of the droplet’s deposition center is about 7.5 cm, which is 1.7 times bigger than that of 2 m/s.
(b)
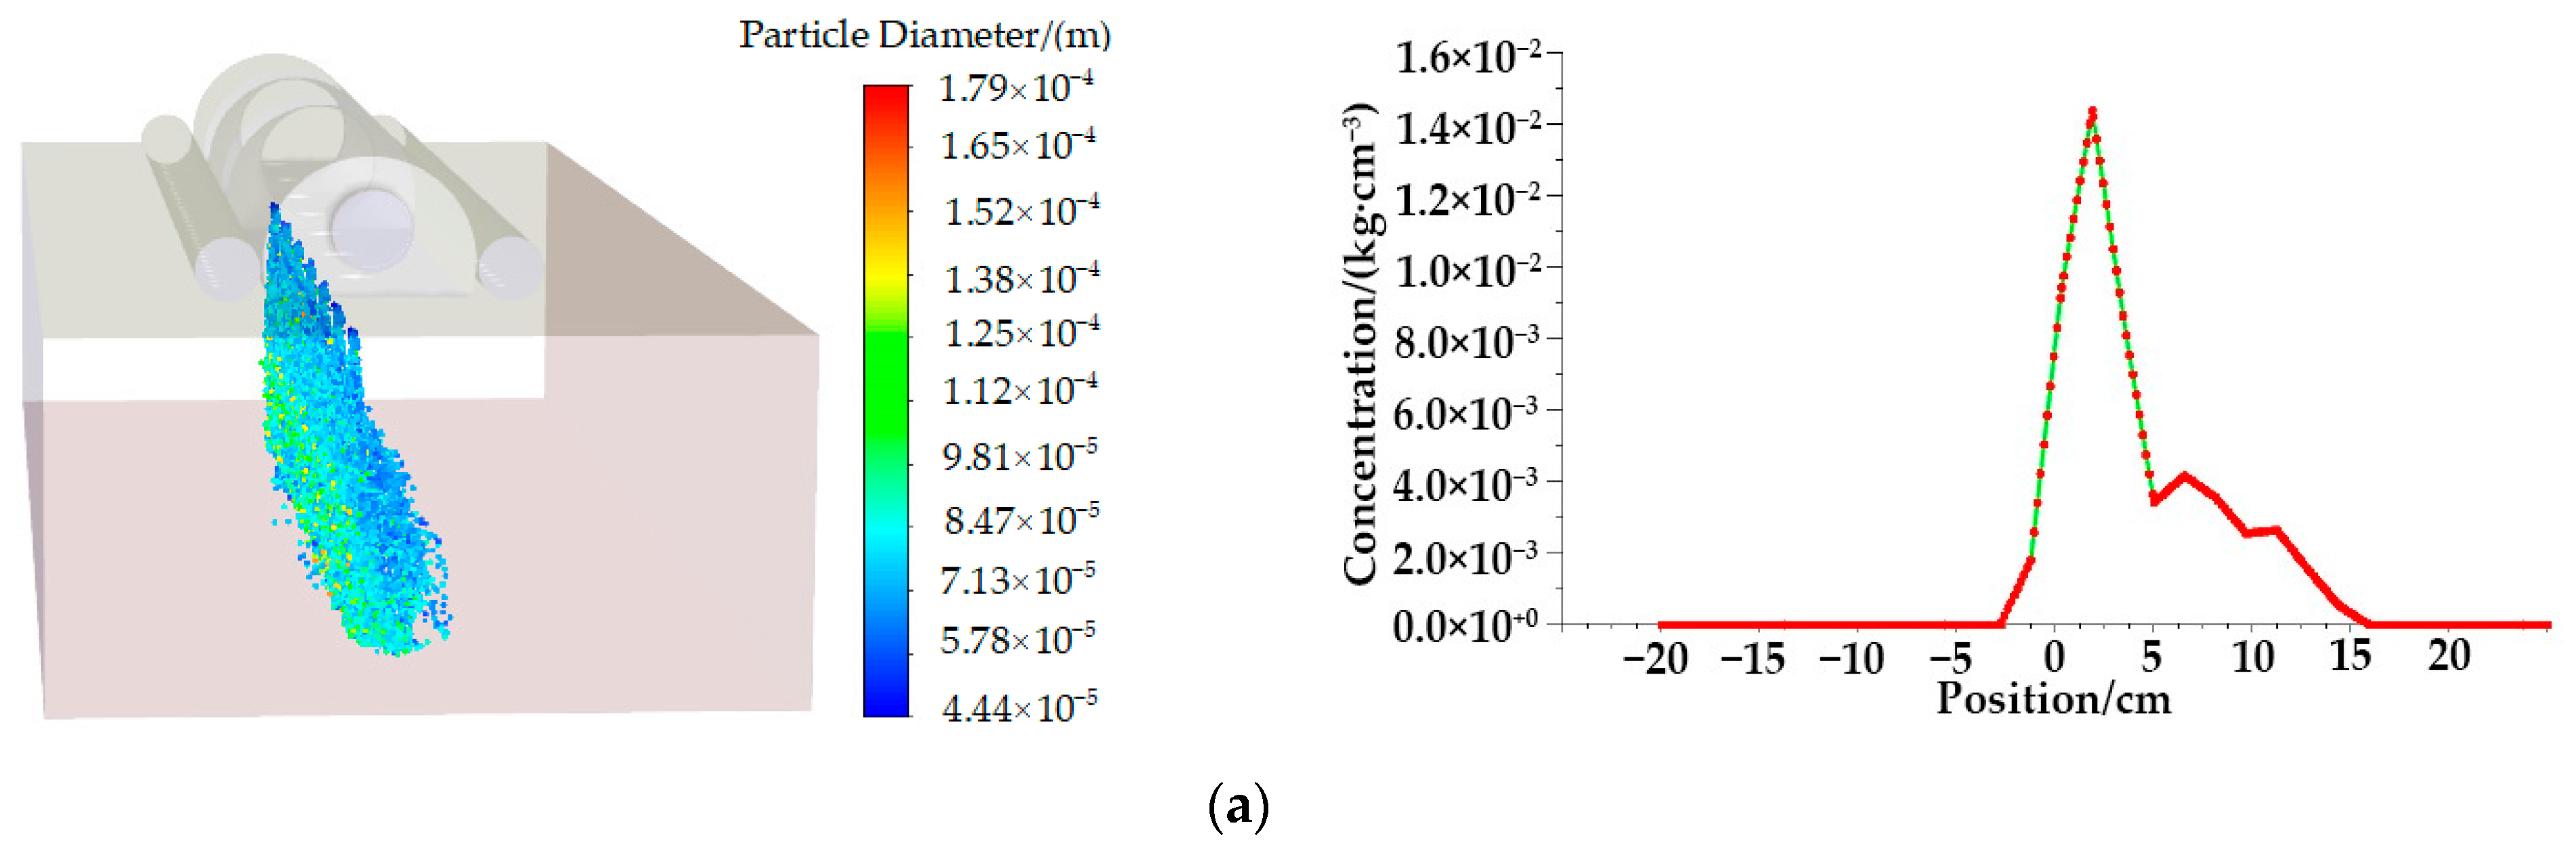
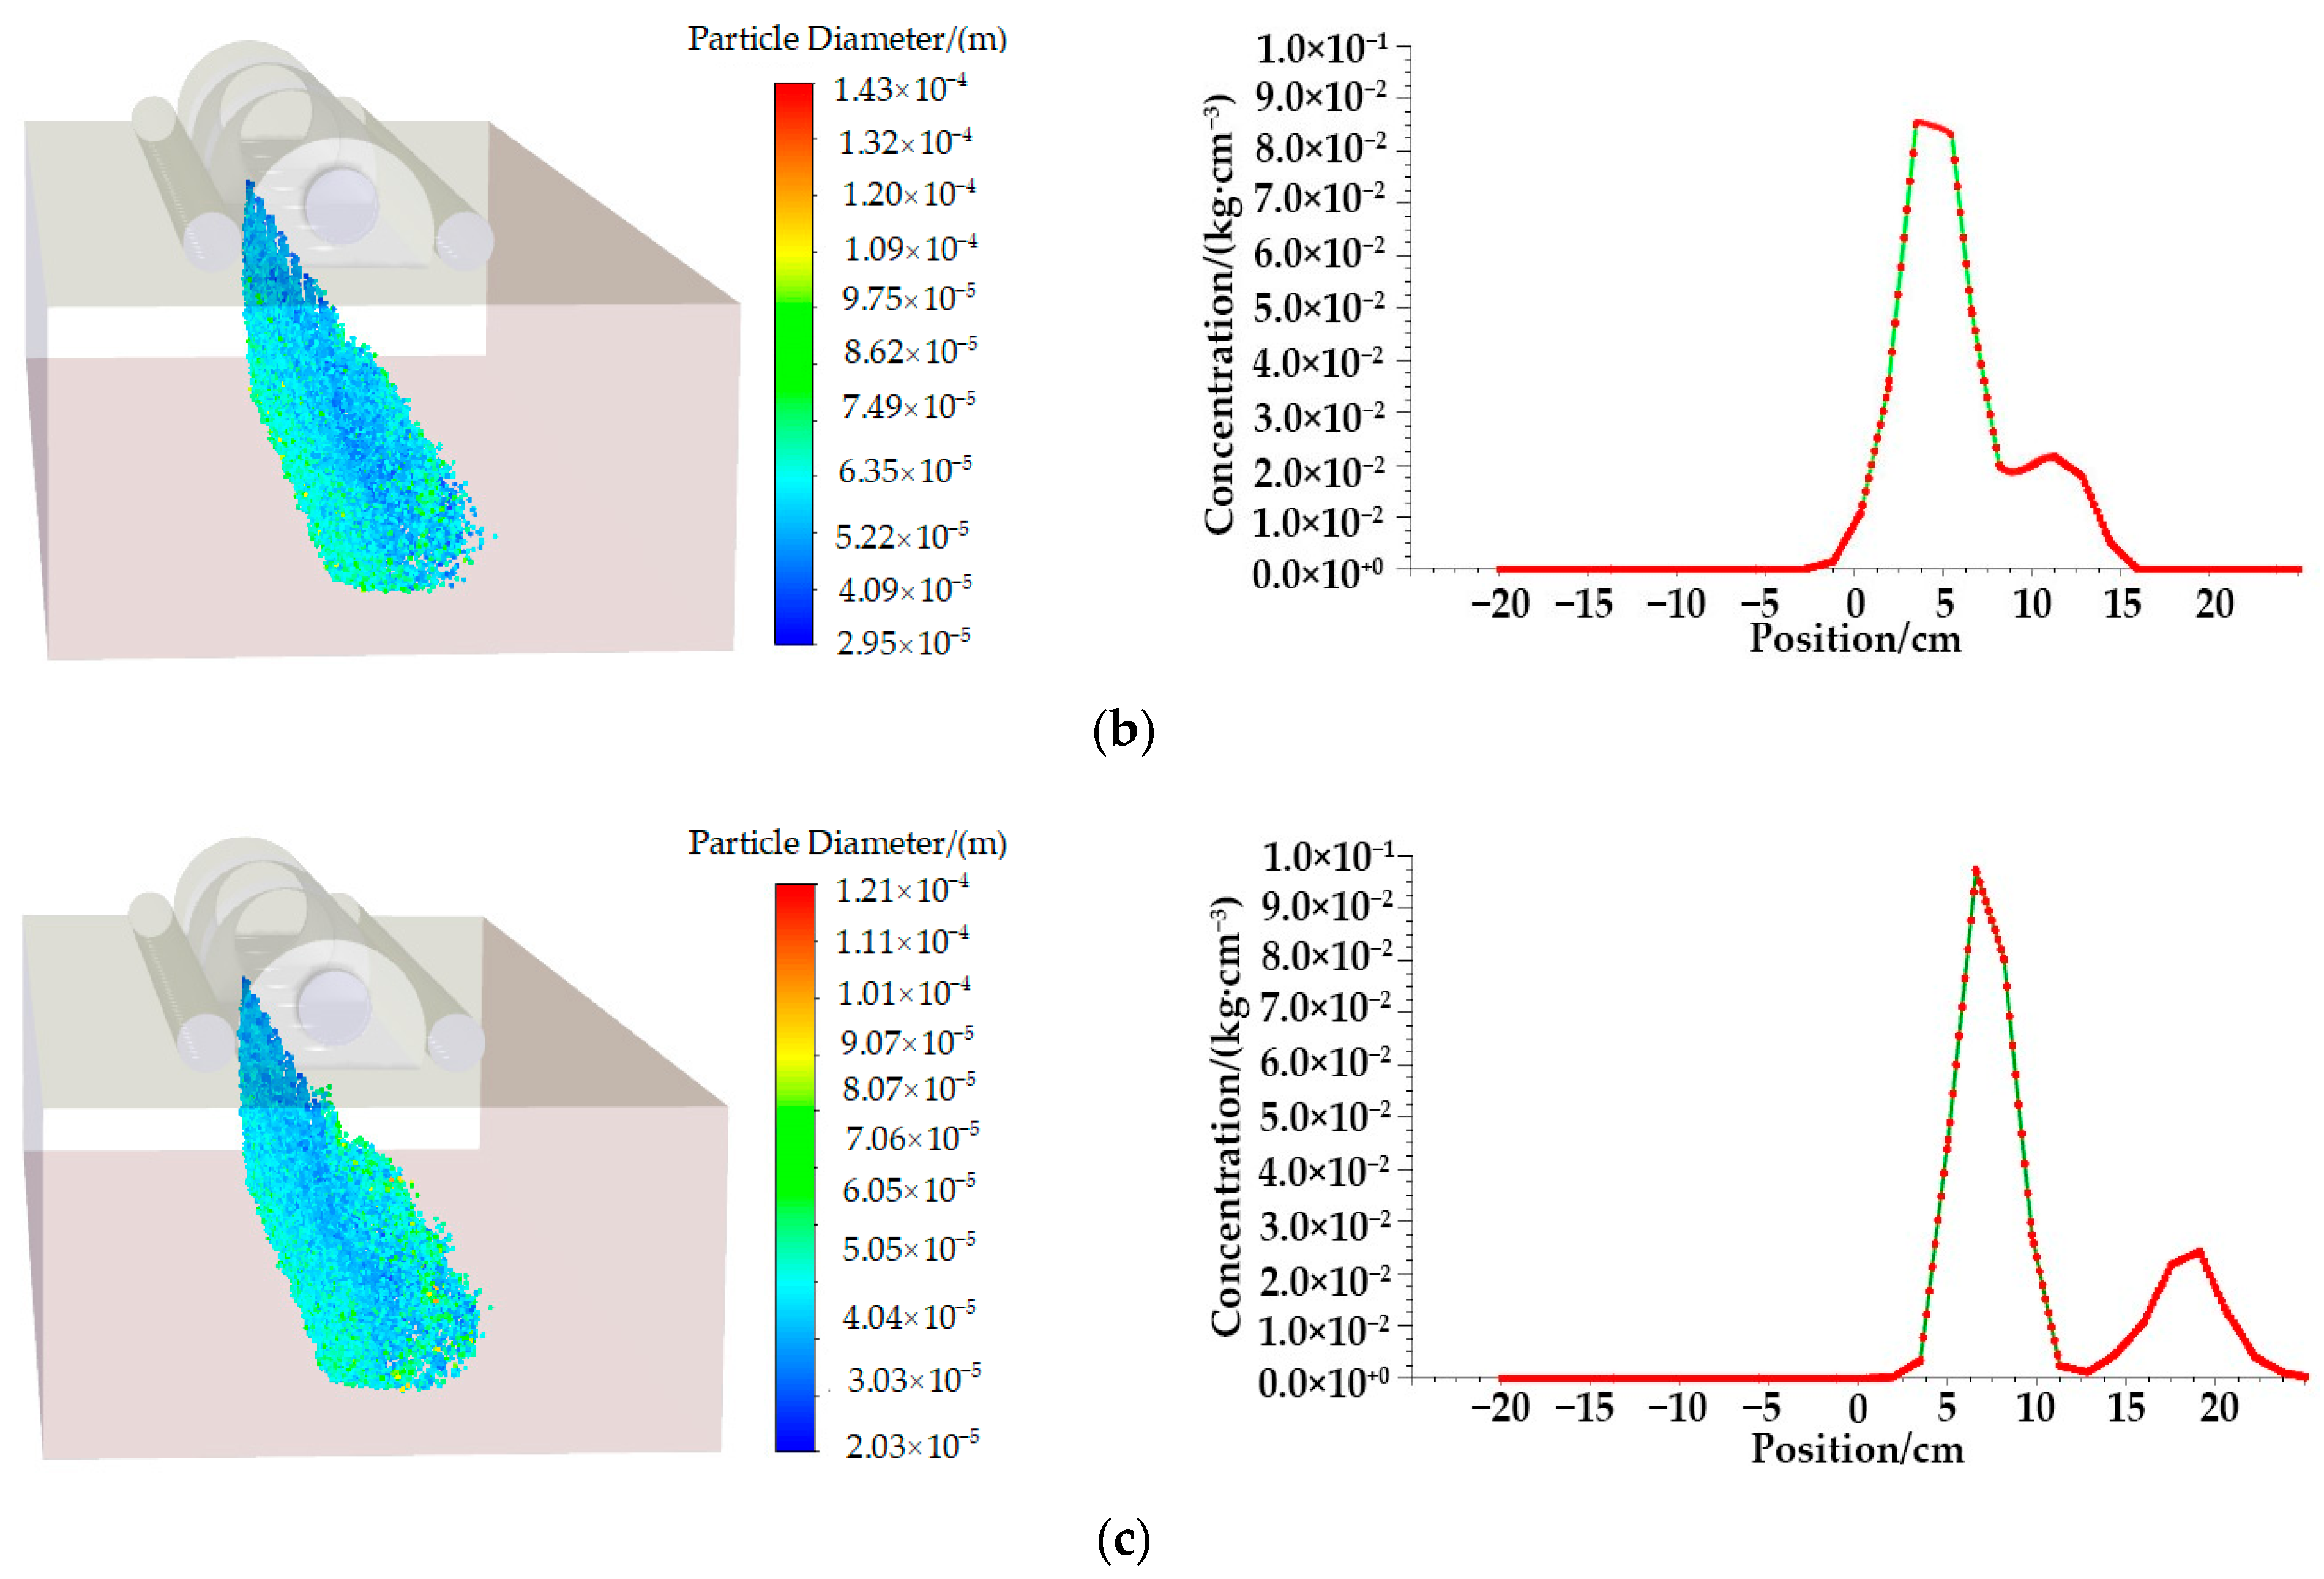
Influence of V-shaped wind speed on droplet deposition
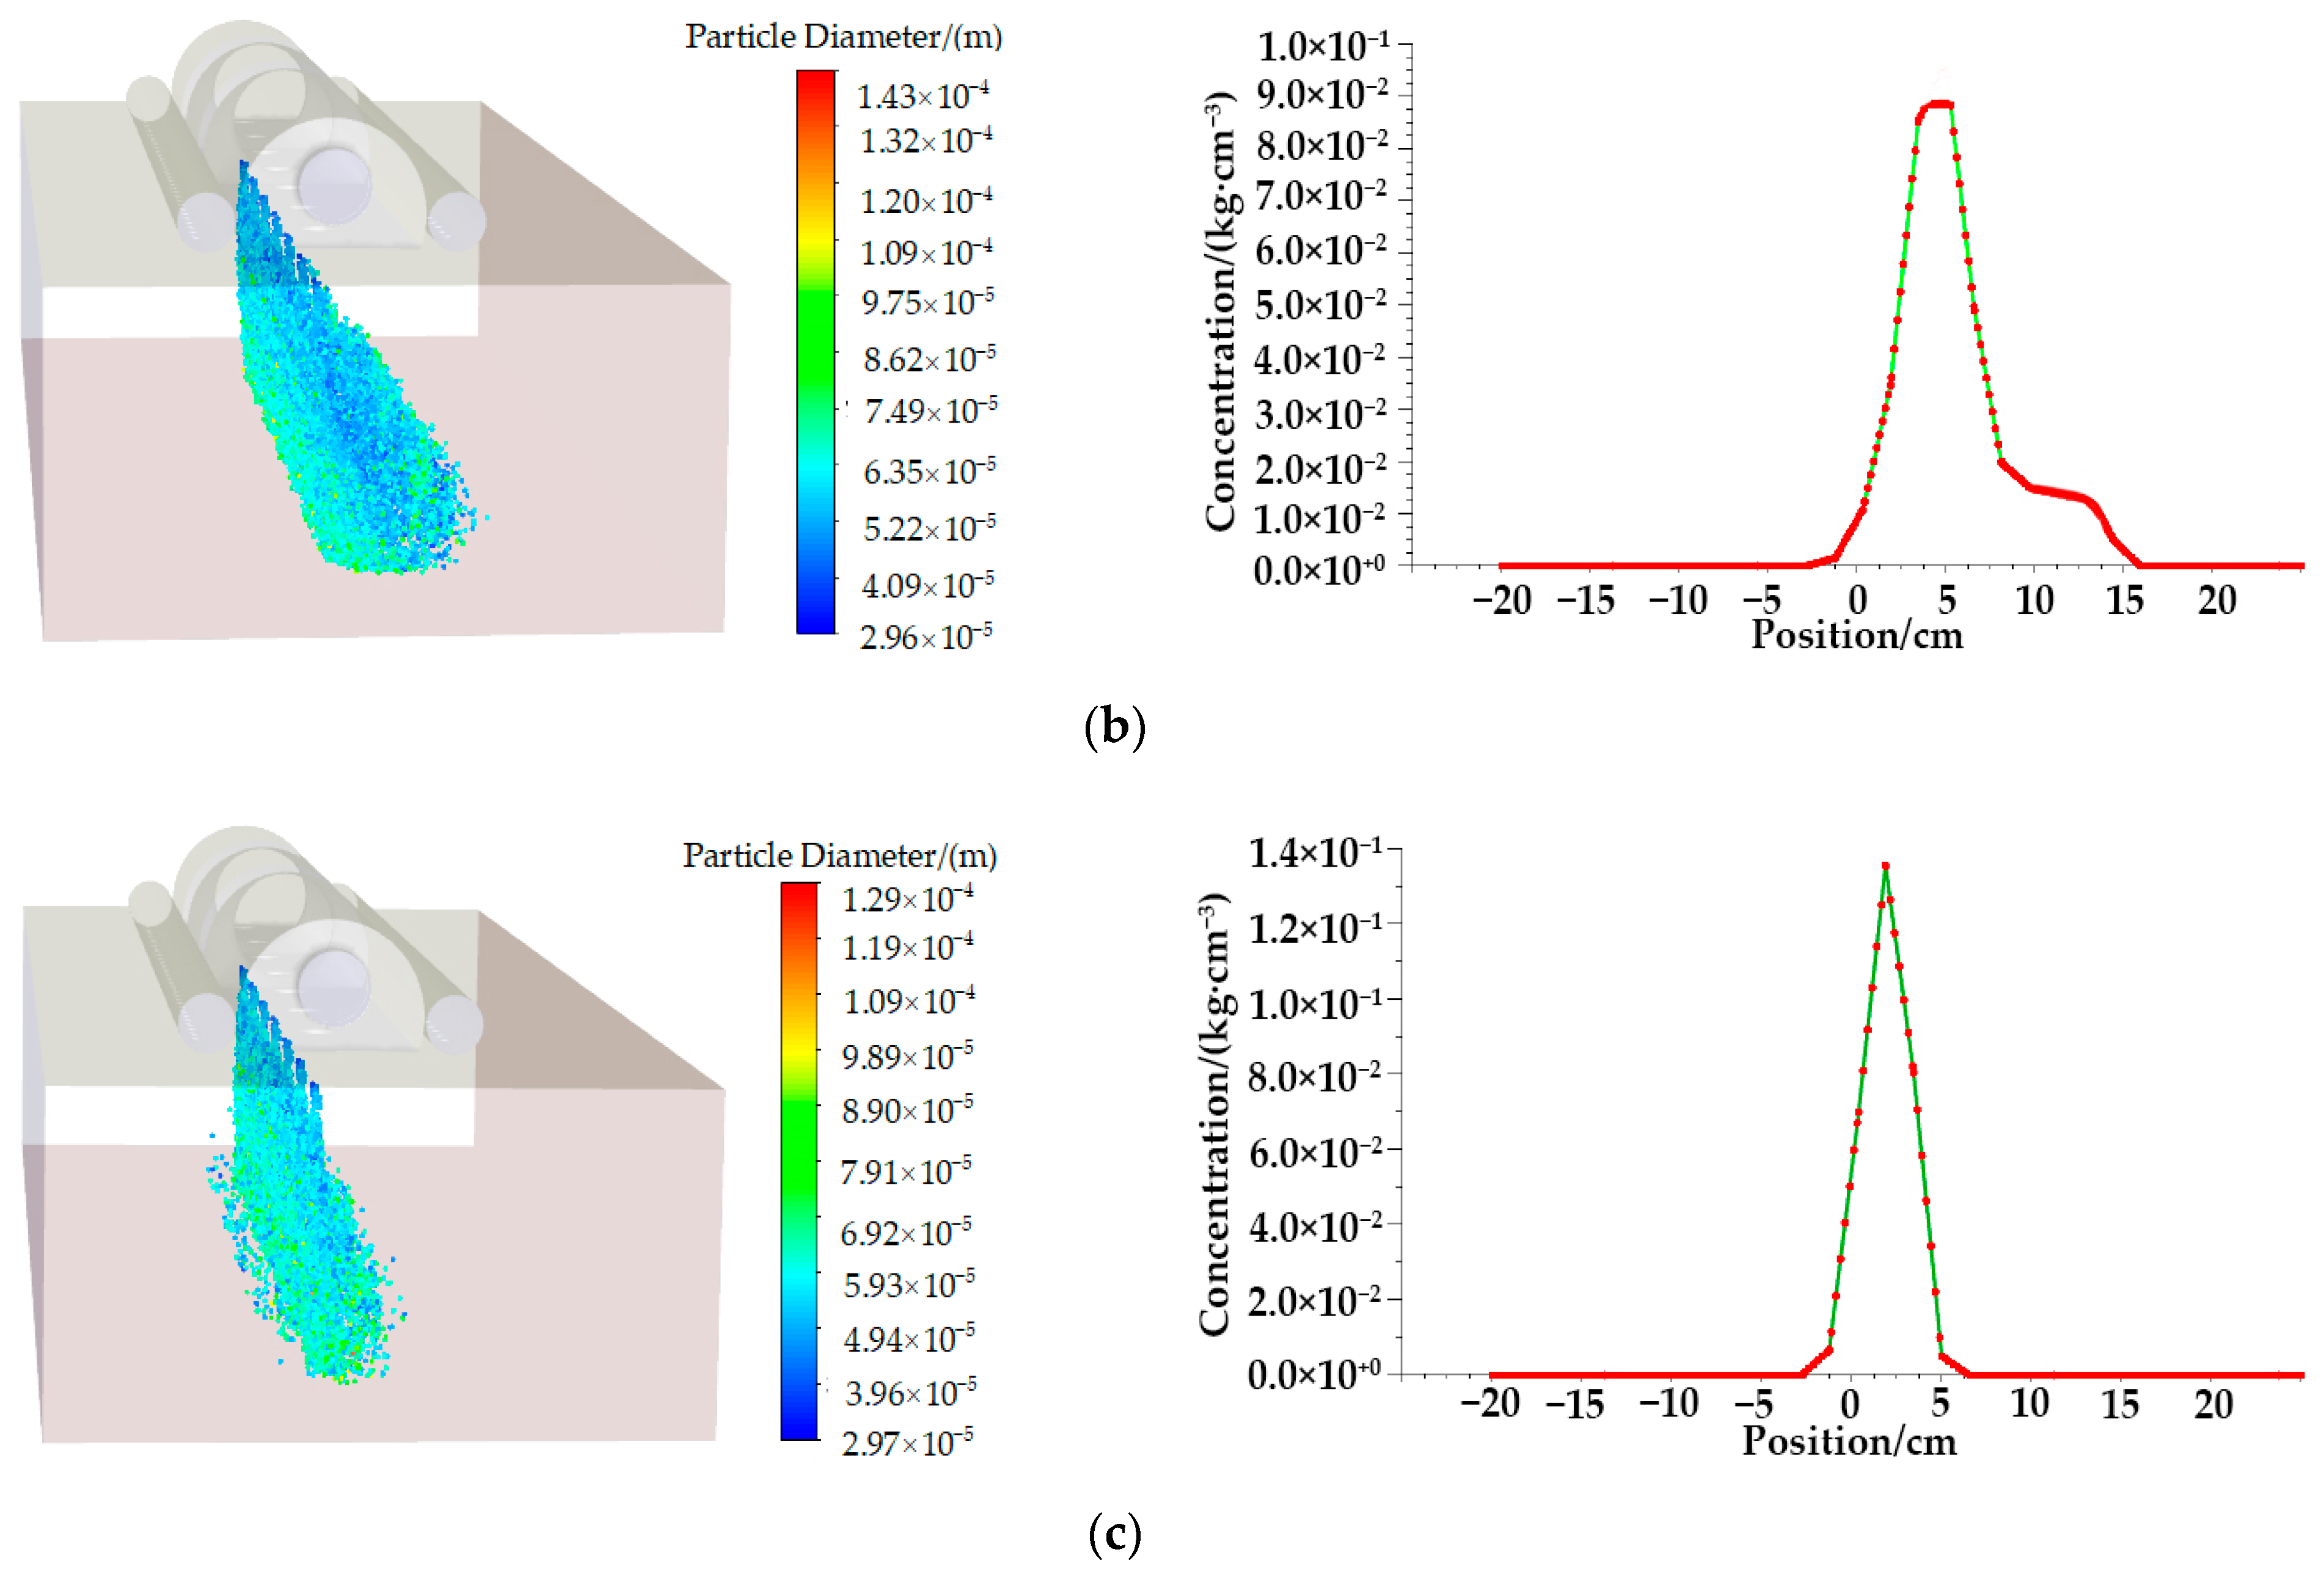
When the crosswind wind was 3 m/s, and the spray pressure was 0.5 MPa, the V-shaped wind speed was changed from 15 m/s to 20 m/s at an equal interval of 5 m/s. The droplet’s spatial distribution and the droplet concentration in the calibration line are shown in Figure 12.
As shown in Figure 12, when crosswind wind speed and the spray pressure are the same, the faster the V-shaped wind speed is, the smaller β is, the bigger the droplet concentration in the calibration line is, and the nearer the drifting distance of droplet deposition center is. When the V-shaped wind speed remains constant, the droplet concentration in the calibration line increases first and then decreases. When the V-shaped wind speed is 25 m/s, the drifting distance of the droplet’s deposition center is only 1.2 cm, which is 1.8 times smaller than that of 15 m/s.
(c)
Influence of spray pressure on droplet deposition
When the crosswind wind was 3 m/s, and the V-shaped wind speed was 20 m/s, the spray pressure was changed from 0.4 MPa to 0.6 MPa at an equal interval of 0.1 MPa. The droplet’s spatial distribution and the droplet concentration in the calibration line are shown in Figure 13.
As shown in Figure 13, when the V-shaped wind speed and the crosswind wind are the same, the bigger the spray pressure is, the bigger β is, the bigger the droplet concentration in the calibration line is, and the further the drifting distance of the droplet deposition center is. When the spray pressure remains constant, the droplet concentration in the calibration line increases first and then decreases. When the spray pressure is 0.6 MPa, the drifting distance of the droplet deposition center is 9.0 cm, which was 6.2 times larger than that of 2 m/s.

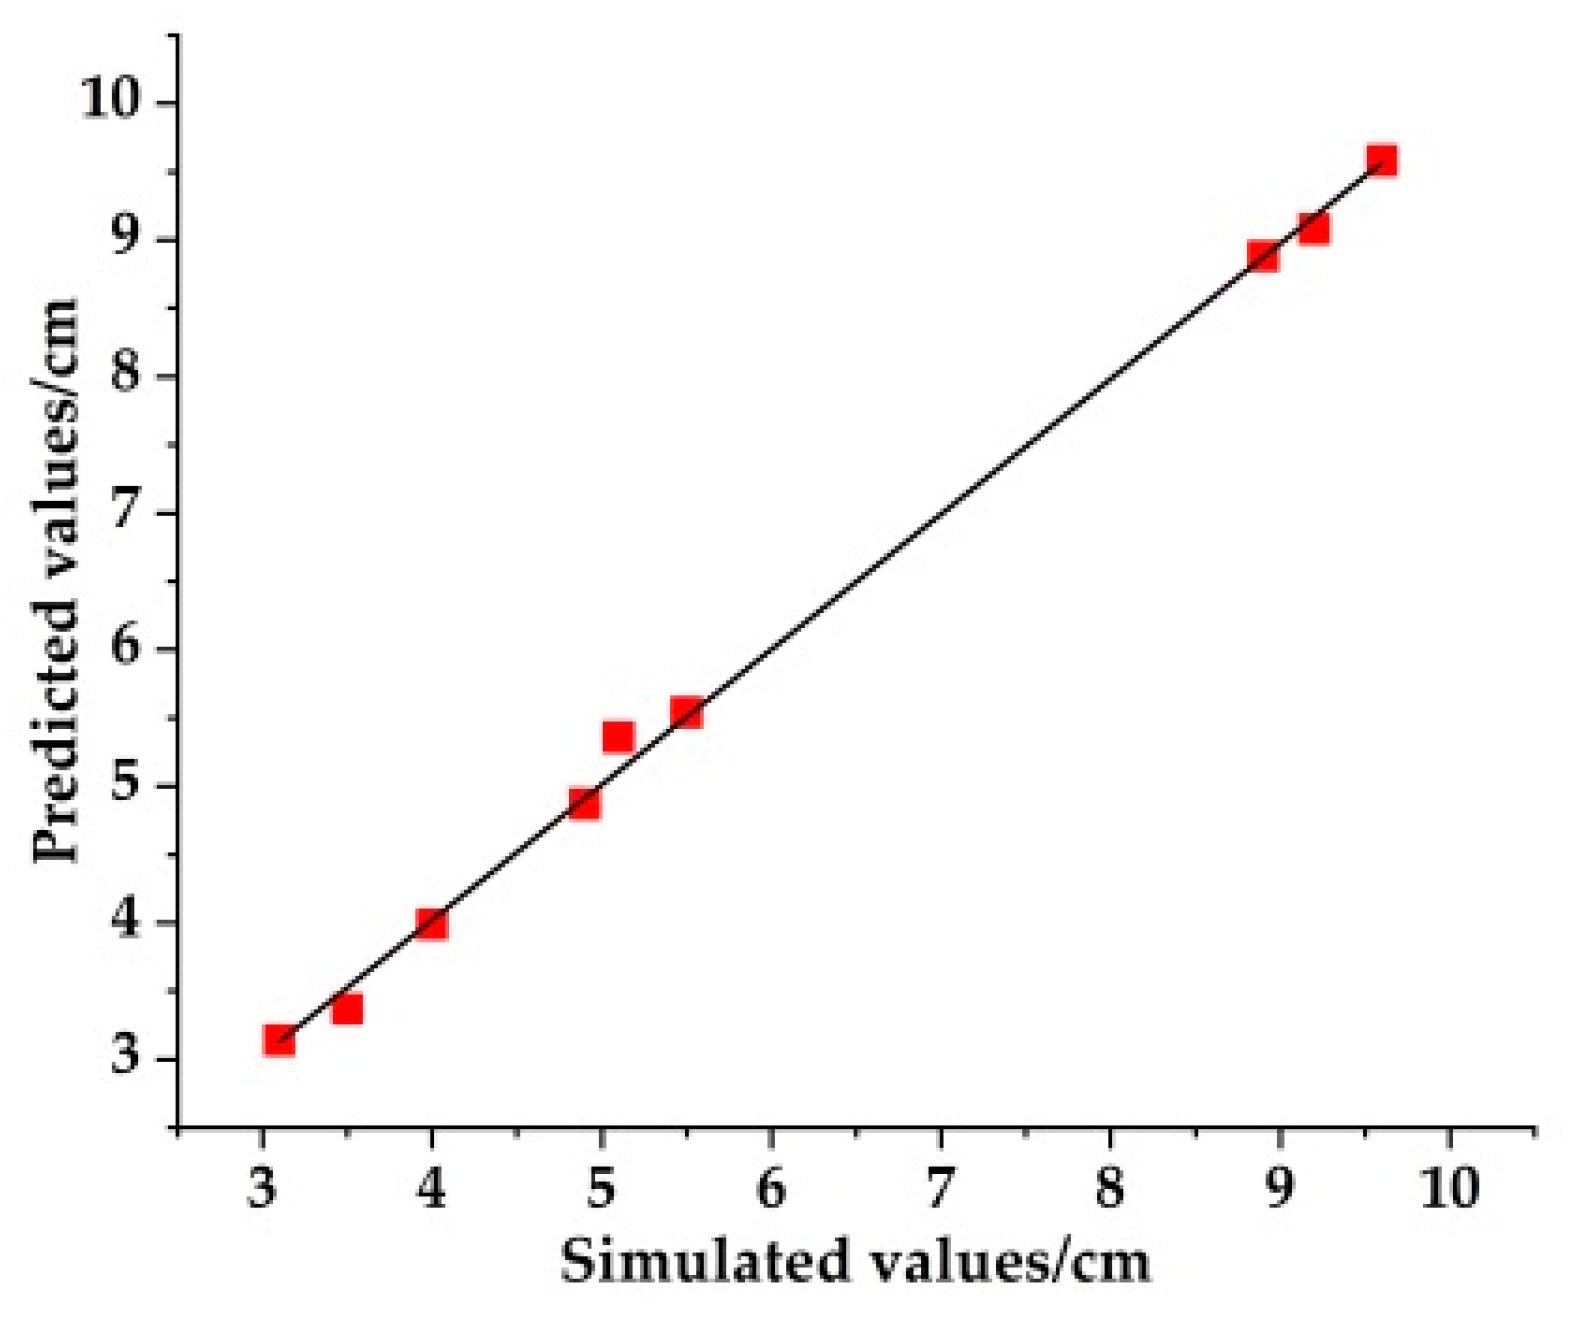
3.2.3. Prediction Model of the Drift Distance of the Droplets Deposition Center

According to the above analysis and Table 2, simulation experiments of droplet deposition were designed for three factors, including the V-shaped wind speed, the crosswind wind, and the spray pressure. The design and range analysis of the experiments are shown in Table 3.
As shown in Table 3, the three factors have a significant influence on the drifting distance of the droplet’s deposition center, and the degree from big to small is V-shaped wind speed, crosswind speed, and spray pressure. By using the method of partial multivariate orthogonal regression, the results are shown in Table 4 and Table 5.
The relationship between Z and x can be as follows:
Z 1 ( x 1 ) = 1   ×   x 1     x ¯ 1 Δ 1 = x 1 3 Z 2 ( x 1 ) = 3   ×   [ ( x 1     x ¯ 1 Δ 1 ) 2 N 2     1 12 ] = 3 ( x 1 3 ) 2 2 Z 1 ( x 2 ) = 1   ×   x 2     x ¯ 2 Δ 2 = 1 5 x 2 4 Z 2 ( x 2 ) = 3   ×   [ ( x 2     x ¯ 2 Δ 2 ) 2 N 2     1 12 ] = 3 25 ( x 2 20 ) 2 Z 1 ( x 3 ) = 1   ×   x 3     x ¯ 3 Δ 3 = 10 x 3 5 Z 2 ( x 3 ) = 3   ×   [ ( x 3     x ¯ 3 Δ 3 ) 2 N 2     1 12 ] = 300 ( x 3 0.5 ) 2
Therefore, the prediction model of the drifting distance of the droplet’s deposition center is as follows:
y = 5.98 + 0.37 Z 1 ( x 1 ) + 0.02 Z 2 ( x 1 ) 2.85 Z 1 ( x 2 ) + 0.41 Z 2 ( x 2 ) 0.02 Z 1 ( x 3 ) 0.03 Z 2 ( x 3 )
By plugging Equation (6) into Equation (7), the prediction model is as follows:
y = 15.57 + 0.06 ( x 1 3 ) 2 + 0.37 x 1 + 0.0492 ( x 2 20 ) 2 0.57 x 2 9 ( x 3 0.5 ) 2 0.2 x 3
When the spray conditions are the same, the correlation between the prediction model and the simulation is shown in Figure 14.
As shown in Figure 14, the correlation coefficient is 0.998, which indicates that the model can be used to predict the drifting distance of the droplet deposition center.

3.3. Measurement of the Predicted Drift Distance of the Droplets Deposition Center

According to Section 2.4, a single airflow and multi-airflow spray operation were carried out, respectively. The crosswind speed, the spray pressure, and V-shaped wind speed at the scene were measured, which were 2.2 m/s, 0.52 MPa, and 20.8 m/s, respectively. By collecting the liquid volume in each test tube, the droplet deposition distribution is shown in Figure 15.
As shown in Figure 15, the distribution range of droplet deposition of multi-airflow synergy is more concentrated than that of a single airflow. The droplets are mainly distributed in tubes No. 28~50. The anti-drift performance is measured by the droplet drift rate; it is as follows:
α = V z i = 1 n V i V z × 100 %
where α is the droplet drift rate (%), i is the number of droplet collecting troughs, n is the total number of droplet collecting troughs, V i is the volume of liquid collected in the “i”th droplet collecting trough (mL), V z is the total spray volume (mL).
By calculation, the droplet drift rate of multi-airflow synergy is 29.2% lower than that of single-airflow.
The tube with the largest droplet volume was recorded as the droplet deposition center. The drifting distance of droplet deposition center (d) is as follows:
d = d v d m
where d v is the center line of the droplet collecting trough corresponding to the tube with the largest droplet volume and d m is the center line of the droplet collecting plate.
As shown in Figure 15, the 38th tube collecting droplet volume is the largest. According to Section 2.4, the distance between the two adjacent droplet collecting troughs is 2 cm, and the width of the droplet collecting plate is 140 cm. Therefore, d is 5 cm. When the parameters were set as the same as the experiment, simulations were carried out by the method of CFD, and the results are shown in Figure 16.
As shown in Figure 16, the drifting distance of the droplet’s deposition center is 4.6 cm. Substituting experimental parameters into Formula (8), the predicted drifting distance of the droplet deposition center is 4.5 cm. These results show that the method of CFD is feasible for analyzing droplet characteristics, the prediction model of the drifting distance of the droplet deposition center is correct, and multi-airflow synergy can improve the droplet deposition. However, in the process of the experiment, sudden changes in wind values and direction influence the spray system. It is necessary to continue the research on the sensitivity of the proposed spray system to sudden changes in wind values and direction.

4. Conclusions

(1)
There are still many droplets leaving the canopy and drifting loss, which results in pesticide waste and environmental pollution. A V-shaped anti-drift spray device in multi-airflow synergy was designed according to modern orchards with low root stock in a high-density planting. The two auxiliary air ducts are arranged in a V shape in the horizontal direction. The droplet’s spatial motion model was constructed based on the particle dynamics analysis, and the anti-drift mechanism of multi-airflow synergy was clarified. The influences of spray pressure and V-shaped wind speed on the droplets’ movement were illuminated by Matlab. When the V-shaped wind speed ranges from 15 m/s to 25 m/s, the anti-drift effect of the machine is better;
(2)
A simulation model of the flow field between the spray device and the fruit trees canopy was constructed by the method of CFD. By considering crosswind speed, V-shaped wind speed, and spray pressure and using partial multivariate orthogonal regression, three-level simulation experiments of the droplets’ deposition were designed. The influence of V-shaped wind speed on the spatial distribution of droplets was analyzed, which indicated that the three factors had a significant influence on the droplet deposition characteristics, and the degree from big to small was V-shaped wind speed, crosswind speed, spray pressure. The prediction model of the drift distance of the droplets deposition center was constructed, its fitting degree is high, and the correlation coefficient is 0.998;
(3)
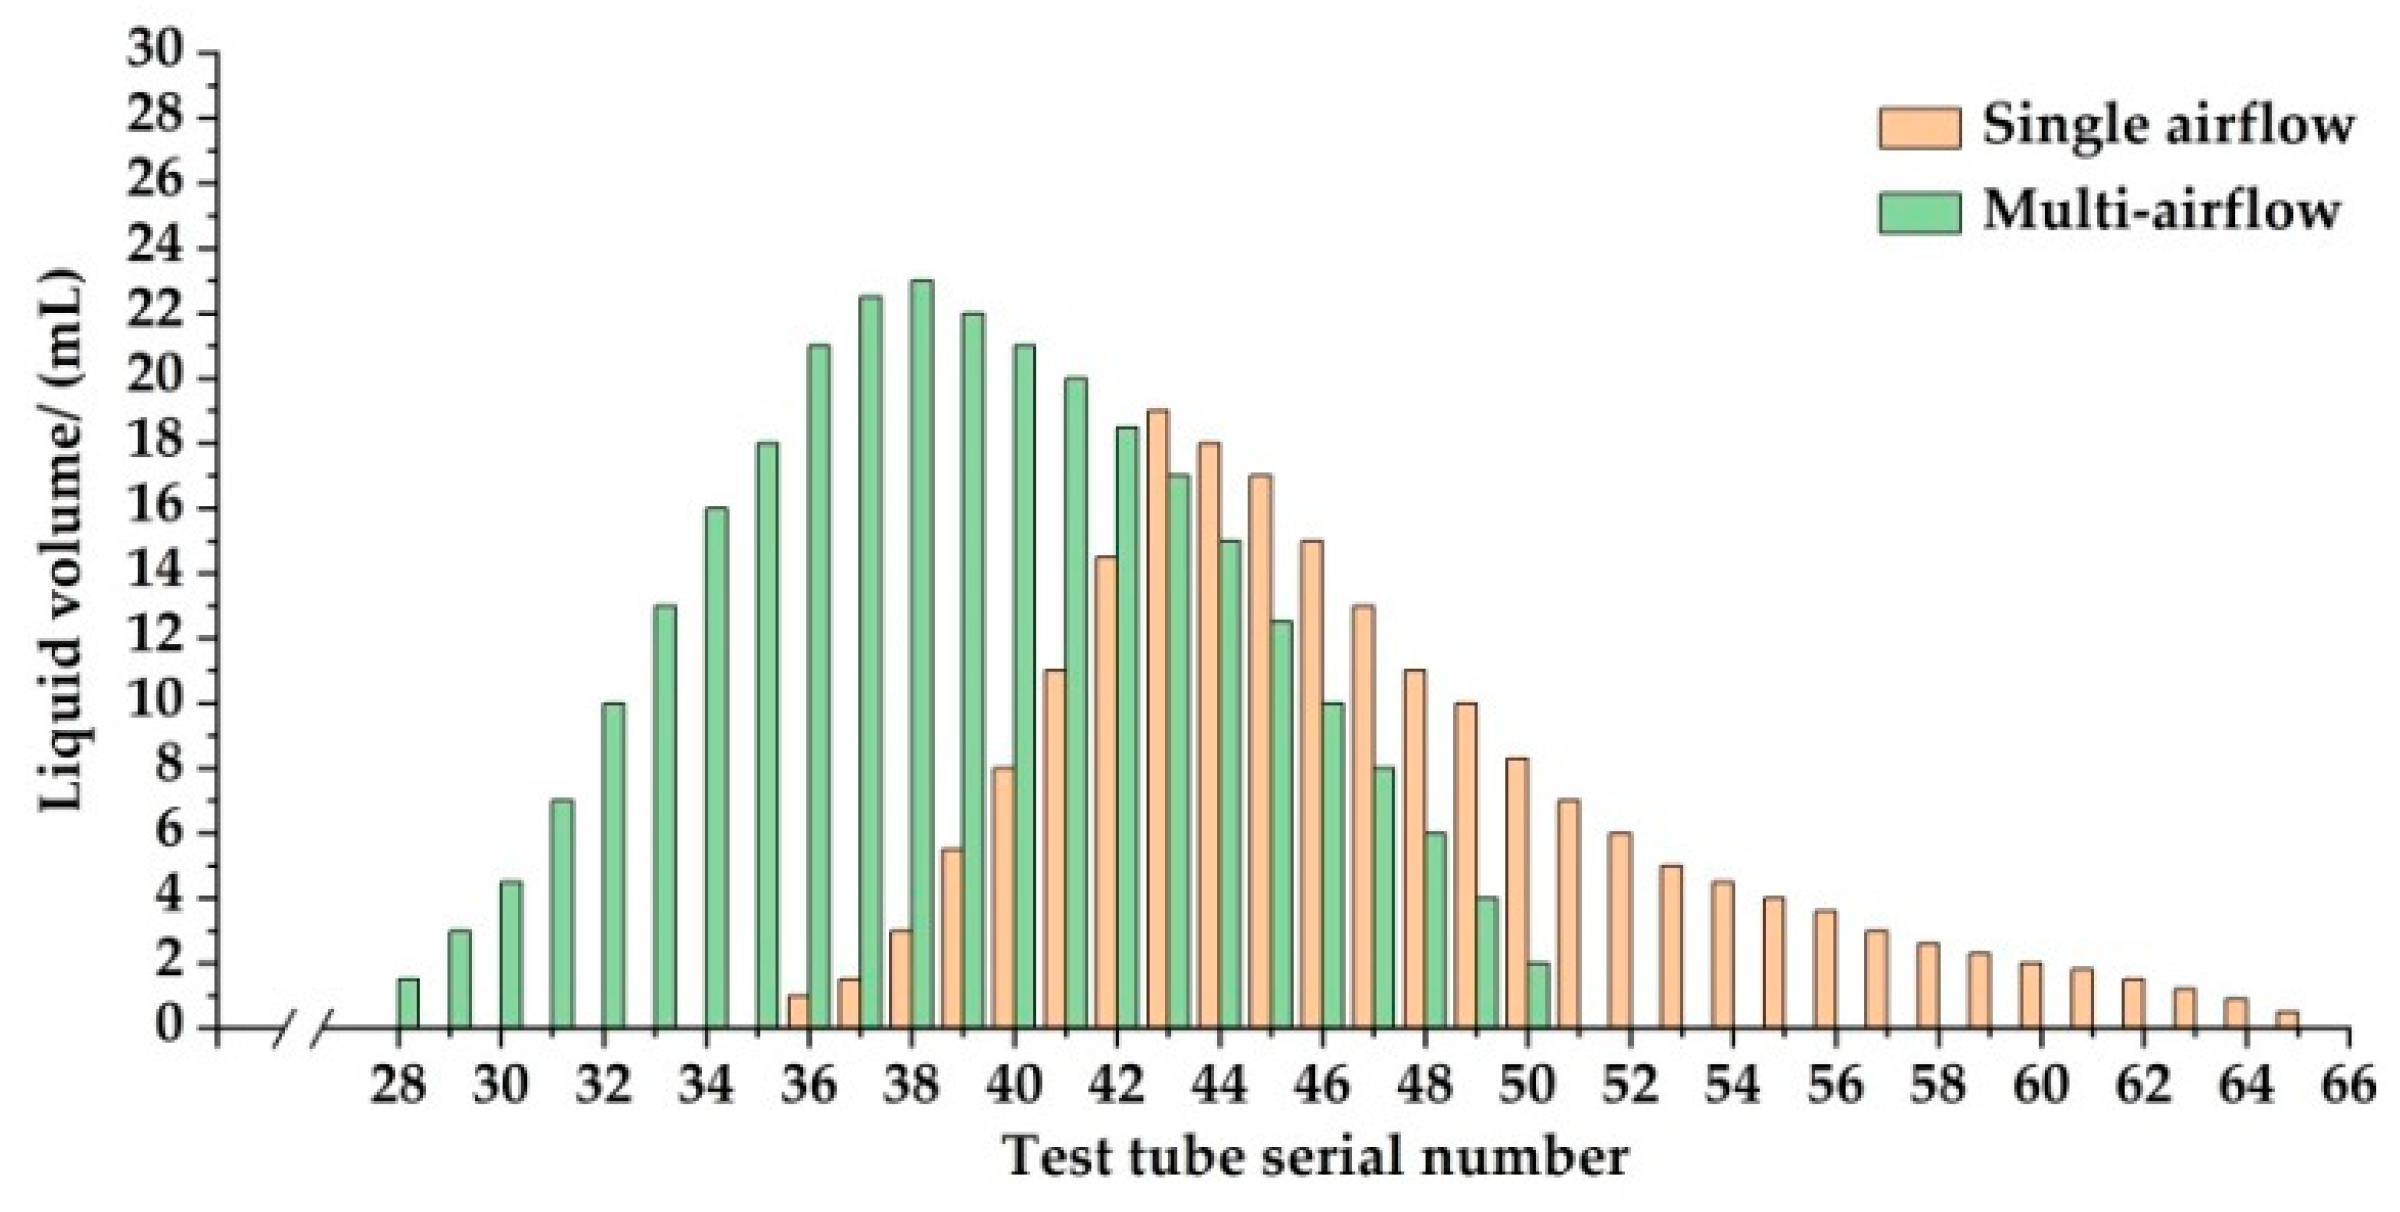
The experiments on the machine were carried out. The results show that when the crosswind speed, the spray pressure, and V-shaped wind speed are 2.2 m/s, 0.52 MPa, and 20.8 m/s, respectively, the droplet drifting rate was 29.2% lower than that of single-airflow. The drifting distance of the droplet deposition center is 5.0 cm, which is consistent with the prediction model. The research can provide a basis for the design and parameters optimization of the similar sprayers used in modern orchards with low root stock in a high-density planting.

Author Contributions

Conceptualization, G.F. and C.N.; methodology, G.F. and P.B.; validation, D.W. and C.N.; data curation, W.S.; writing—original draft preparation, G.F. and C.N.; writing—review and editing, S.W. All authors have read and agreed to the published version of the manuscript.

Funding

This research was supported by the Shandong Provincial Natural Science Foundation (ZR2018MC017), Major Agricultural Application Technology Innovation Project of Shandong Province (SD2019NJ001), and Shandong Key Laboratory of Horticultural Machinery and Equipment Project (YYJX-2019-07).

Institutional Review Board Statement

Not applicable.

Informed Consent Statement

Not applicable.

Conflicts of Interest

The authors declare no conflict of interest.

References

  1. National Bureau of Statistics of the People’s Republic of China. China Statistical Yearbook 2020[R]; China Statistics Press: Beijing, China, 2020. Available online: http://www.stats.gov.cn/tjsj/ndsj/ (accessed on 1 June 2022). (In Chinese)
  2. Zhao, Y.; Xiao, H.; Mei, S.; Song, Z.; Ding, W.; Jin, Y.; Han, Y.; Xia, X.; Yang, G. Current status and development strategies of orchard mechanization production in China. J. China Agric. Univ. 2017, 22, 116–127. (In Chinese) [Google Scholar]
  3. Zheng, J.; Xu, Y. Development and prospect in environment-friendly pesticide sprayers. Trans. Chin. Soc. Agric. Mach. 2021, 52, 1–16. (In Chinese) [Google Scholar]
  4. Xiang, D.; Tie, Z.; Mingde, Y. Design and experiment of 3WPZ-4 type air-assisted grape sprayer. Trans. Chin. Soc. Agric. Mach. 2018, 49, 205–213. (In Chinese) [Google Scholar]
  5. Foqué, D.; Pieters, J.G.; Nuyttens, D. Spray deposition and distribution in a bay laurel crop as affected by nozzle type, air assistance and spray direction when using vertical spray booms. Crop Prot. 2012, 41, 77–87. [Google Scholar] [CrossRef]
  6. Jin, X.; Dong, X.; Yang, X.J. Design and experiment of target spraying system of 3WGZ-500 sprayer. Trans. Chin. Soc. Agric. Mach. 2016, 47, 21–27. (In Chinese) [Google Scholar]
  7. Nestor Circular Sprayer [EB/OL]. Available online: https://www.agriexpo.cn/prod/weremczuk-fmr-sp-z-o-o/product-170611-17417.html (accessed on 2 October 2020).
  8. ASIA TECH Self-Propelled Pneumatic Sprayer [EB/OL]. Available online: https://www.agriexpo.cn/prod/asia-technologyco-ltd/product-180444-55544.html (accessed on 2 October 2020).
  9. Salcedo, R.; Zhu, H.; Zhang, Z.; Wei, Z.; Chen, L.; Ozkan, E.; Falchieri, D. Foliar deposition and coverage on young apple trees with PWM-controlled spray systems. Comput. Electron. Agric. 2020, 178, 105794. [Google Scholar] [CrossRef]
  10. Zheng, Y.J.; Chen, B.T.; Lyu, H.T.; Kang, F.; Jiang, S.J. Research progress of orchard plant protection mechanization technology and equipment in China. Trans. Chin. Soc. Agric. Eng. 2020, 36, 110–124. (In Chinese) [Google Scholar]
  11. Li, X.; Wang, P.; Li, J.; Yang, Y.; Bian, Y. A comparative study on the spraying effect of orchard wind sprayers under different air supply modes. J. Fruit Sci. 2020, 37, 1065–1072. (In Chinese) [Google Scholar]
  12. Li, B. Present situation and technical requirements of apple dwarf stock cultivation in China. Deciduous Fruits 2020, 52, 1–3. (In Chinese) [Google Scholar]
  13. da Cunha, J.P.; Reis, E.F.D.; de Assunção, H.H.; Landim, T.N. Evaluation of droplet spectaa of the spray TIP AD 11002 using different techniques. Eng. Agric. 2019, 39, 476–481. [Google Scholar]
  14. Griesang, F.; Decaro, R.A.; dos Santos, C.A.M.; Santos, E.S.; de Lima Roque, N.H.; da Costa Ferreira, M. How much do adjuvant and nozzles models reduce the spraying drift? Drift in agricultural spraying. Am. J. Plant Sci. 2017, 8, 2785–2794. [Google Scholar] [CrossRef] [Green Version]
  15. Al Heidary, M.; Douzals, J.P.; Sinfort, C.; Vallet, A. Influence of spray characteristics on potential spray drift of field crop sprayers: A literature review. Crop Prot. 2014, 63, 120–130. [Google Scholar] [CrossRef]
  16. Chen, Y.; Hou, C.; Tang, Y.; Zhuang, J.; Lin, J.; Luo, S. An effective spray drift-reducing method for a plant-protection unmanned aerial vehicle. Int. J. Agric. Biol. Eng. 2019, 12, 14–20. [Google Scholar] [CrossRef]
  17. De Cock, N.; Massinon, M.; Salah, S.O.; Lebeau, F. Investigation on optimal spray properties for ground based agricultural applications using deposition and retention models. Biosyst. Eng. 2017, 162, 99–111. [Google Scholar] [CrossRef] [Green Version]
  18. Felsot, A.S.; Unsworth, J.B.; Linders, J.B.; Roberts, G.; Rautman, D.; Harris, C.; Carazo, E. Agrochemical spray drift; assessment and mitigation—A review. Pestic. Food Contam. Agric. Wastes 2010, 45, 889–911. [Google Scholar] [CrossRef]
  19. Palleja, T.; Landers, A.J. Electro-leaf, a biomimicry system to estimate in-canopy airflow in fruit crops. Comput. Electron. Agric. 2016, 127, 606–614. [Google Scholar] [CrossRef]
  20. Salcedo, R.; Pons, P.; Llop, J.; Zaragoza, T.; Campos, J.; Ortega, P.; Gallart, M.; Gil, E. Dynamic evaluation of airflow stream generated by a reverse system of an axial fan sprayer using 3D-ultrasonic anemometers. Effect of canopy structure. Comput. Electron. Agric. 2019, 163, 104851. [Google Scholar] [CrossRef]
  21. Qiu, W.; Sun, H.; Sun, Y.H. Design and test of circulating air-assisted sprayer for dwarfed orchard. Trans. Chin. Soc. Agric. Eng. 2021, 37, 18–25. (In Chinese) [Google Scholar]
  22. Jun, H.; Changxi, L.; Xin, C. Droplet deposition characteristics of conical wind field anti-drift device. Trans. Chin. Soc. Agric. Mach. 2020, 51, 142–149, 174. (In Chinese) [Google Scholar]
  23. Calomino, F.; Alfonsi, G.; Gaudio, R.; D’Ippolito, A.; Lauria, A.; Tafarojnoruz, A.; Artese, S. Experimental and numerical study of free-surface flows in a corrugated pipe. Water 2018, 10, 638. [Google Scholar] [CrossRef] [Green Version]
  24. Abbas, N.; Rehman, K.U.; Shatanawi, W.; Malik, M.Y. Numerical study of heat transfer in hybrid nanofluid flow over permeable nonlinear stretching curved surface with thermal slip. Int. Commun. Heat Mass Transf. 2022, 135, 106107. [Google Scholar] [CrossRef]
  25. Hong, S.W.; Zhao, L.; Zhu, H. CFD simulation of airflow inside tree canopies discharged from air-assisted sprayers. Comput. Electron. Agric. 2018, 149, 121–132. [Google Scholar] [CrossRef]
  26. Lan, Y.; Shengde, C.; Fritz, B.K. Current status and future trends of precision agricultural aviation technologies. Int. J. Agric. Biol. Eng. 2017, 10, 1–17. [Google Scholar]
  27. Duga, A.T.; Delele, M.A.; Ruysen, K.; Dekeyser, D.; Nuyttens, D.; Bylemans, D.; Nicolai, B.M.; Verboven, P. Development and validation of a 3D CFD model of drift and its application to air-assisted orchard sprayers. Biosyst. Eng. 2016, 154, 62–75. [Google Scholar] [CrossRef]
  28. García-Ramos, F.J.; Malón, H.; Aguirre, A.J.; Boné, A.; Puyuelo, J.; Vidal, M. Validation of a CFD model by using 3D Sonic Anemometers to analyse the air velocity generated by an air-assisted sprayer equipped with two axial fans. Sensors 2015, 15, 2399–2418. [Google Scholar] [CrossRef] [Green Version]
  29. Nadeem, S.; Amin, A.; Abbas, N. On the stagnation point flow of nanomaterial with base viscoelastic micropolar fluid over a stretching surface. Alex. Eng. J. 2020, 59, 1751–1760. [Google Scholar] [CrossRef]
  30. Hong, S.W.; Zhao, L.; Zhu, H. SAAS, a computer program for estimating pesticide spray efficiency and drift of air-assisted pesticide applications. Comput. Electron. Agric. 2018, 155, 58–68. [Google Scholar] [CrossRef]
  31. Bahlol, H.Y.; Chandel, A.K.; Hoheisel, G.A.; Khot, L.R. The smart spray analytical system: Developing understanding of output air-assist and spray patterns from orchard sprayers. Crop Prot. 2020, 127, 104977. [Google Scholar] [CrossRef]
  32. Fan, G.; Niu, C.; Zhang, Z.; Wang, D.; Mao, W.; Jiang, H. Design and experiment of V-shaped orchard anti-drift spray device with multi-airflow cooperation. Trans. Chin. Soc. Agric. Mach. 2022, 53, 138–147. (In Chinese) [Google Scholar]
  33. Zhao, L.; Guoqiang, F.; Guangming, W.; Hao, D.; Xiaohui, Z. Distribution model of wind-stressed droplet deposition based on bimodal distribution. Trans. Chin. Soc. Agric. Mach. 2020, 51, 28–37. [Google Scholar]
  34. Fritz, B.K.; Hoffmann, W.C.; Bagley, W.E.; Kruger, G.R.; Czaczyk, Z.; Henry, R.S. Measuring droplet size of agricultural spray nozzles-measurement distance and airspeed effects. Atom. Sprays 2014, 24, 747–760. [Google Scholar] [CrossRef] [Green Version]
  35. Jiyu, L.; Lan, Y.; Jianwei, W.; Shengde, C.; Cong, H.; Qi, L.; Qiuping, L. Distribution law of rice pollen in the wind field of small UAV. Int. J. Agric. Biol. Eng. 2017, 10, 32–40. [Google Scholar] [CrossRef]
  36. NY/T 2849-2015 Technical Specifcations of Application for Air-Assisted Sprayers; Ministry of Agriculture and Rural Affairs of the People’s Republic of China: Beijing, China, 2015.
  37. Lauria, A.; Alfonsi, G.; Tafarojnoruz, A. Flow pressure behavior downstream of ski jumps. Fluids 2020, 5, 168. [Google Scholar] [CrossRef]
  38. Tafarojnoruz, A.; Lauria, A. Large eddy simulation of the turbulent flow field around a submerged pile within a scour hole under current condition. Coast. Eng. J. 2020, 62, 489–503. [Google Scholar] [CrossRef]
  39. Khan, A.A.; Abbas, N.; Nadeem, S.; Shi, Q.H.; Malik, M.Y.; Ashraf, M.; Hussain, S. Non-Newtonian based micropolar fluid flow over nonlinear starching cylinder under Soret and Dufour numbers effects. Int. Commun. Heat Mass Transf. 2021, 127, 105571. [Google Scholar] [CrossRef]
  40. Abbas, N.; Nadeem, S.; Saleem, A. Computational analysis of water based Cu-Al2O3/H2O flow over a vertical wedge. Adv. Mech. Eng. 2020, 12, 1687814020968322. [Google Scholar] [CrossRef]
  41. Zhang, H.Y.; Lan, Y.B.; Wen, S.; Xu, T.; Yu, F. Research progress in rotor airflow model of plant protection UAV and droplet motion mechanism. Trans. Chin. Soc. Agric. Eng. 2020, 36, 1–12. [Google Scholar]
  42. Ren, X.; Yu, X. Multivariate Statistical Analysis; China Statistics Press: Beijing, China, 2010; Volume 12, p. 393.
  43. Ding, S.; Xue, X.; Dong, X.; Gu, W.; Zhou, Q. Effects of spraying parameters on droplet deposition performance. Trans. Chin. Soc. Agric. Mach. 2020, 51, 308–315. [Google Scholar]
Figure 1. Structure diagram of the V-shaped anti-drift spray device in multi-airflow synergy: 1. Centrifugal fan; 2. Distributor; 3. Frame; 4. Conveying air duct; 5. Auxiliary air duct; 6. Main air duct; 7. Medicine box; 8. Crawler chassis.
Applsci 12 07082 g001
Figure 2. Anti-drift schematic diagram of spray device with multi-airflow synergy. Three-dimensional map of spray operation (a); Top view of spray operation (b).
Applsci 12 07082 g002
Figure 3. Forces diagram of a droplet.
Applsci 12 07082 g003
Figure 4. Calculation model structure diagram. Schematic diagram of the spray flow model (a). Top view of the spray flow field model (b): 1. Anti-drift airflow duct; 2. Spray airflow duct; 3. Turbulent airflow duct; 4. Crosswind; 5. Droplet concentration calibration line (paralleling the X-axis direction and coinciding with the origin of the model coordinates).
Applsci 12 07082 g004
Figure 5. Diagram of the experimental devices: 1. FS-75 industrial fan; 2. Anti-drift spray device in multi-airflow synergy; 3. Droplet collecting plate; 4. Test tube.
Applsci 12 07082 g005
Figure 6. Droplet distributions on the reference surface with different spray pressure: 0.3 MPa (a); 0.4 MPa (b); 0.5 MPa (c); 0.6 MPa (d); 0.7 MPa (e); 0.8 MPa (f).
Applsci 12 07082 g006
Figure 7. Proportion of drift droplets with different spray pressure.
Applsci 12 07082 g007
Figure 8. Droplet distributions on the reference surface with different V-shaped wind speed: 15 m/s (a); 17.5 m/s (b); 20 m/s (c); 22.5 m/s (d); 25 m/s (e); 27.5 m/s (f).
Applsci 12 07082 g008aApplsci 12 07082 g008b
Figure 9. Proportion of drift droplets with different V-shaped wind speed.
Applsci 12 07082 g009
Figure 10. Droplet spatial distribution with different crosswind speed: 2 m/s (a); 4 m/s (b).
Applsci 12 07082 g010
Figure 11. Droplet spatial distribution and the droplet concentration in the calibration line with different crosswind wind speed; 2 m/s (a); 3 m/s (b); 4 m/s (c).
Applsci 12 07082 g011aApplsci 12 07082 g011b
Figure 12. Droplet spatial distribution and the droplet concentration in the calibration line with different V-shaped wind speed: 15 m/s (a); 20 m/s (b); 25 m/s (c).
Applsci 12 07082 g012aApplsci 12 07082 g012b
Figure 13. Droplet spatial distribution and the droplet concentration in the calibration line with different spray pressure: 0.4 MPa (a); 0.5 MPa (b); 0.6 MPa (c).
Applsci 12 07082 g013aApplsci 12 07082 g013b
Figure 14. Correlation between the predicted values and the simulated values.
Applsci 12 07082 g014
Figure 15. Distribution of droplet deposition in two states.
Applsci 12 07082 g015
Figure 16. Droplet spatial distribution and the droplet concentration in the calibration line.
Applsci 12 07082 g016
Table 1. Work parameters of flat sector nozzle.
Parameter Name (Unit)Value
X-Fan Normal Vector1
Y-Fan Normal Vector0
Z-Fan Normal Vector0
Flow Rate (kg/s)0.01316
Spray Half Angle (deg)40
Orifice Width (m)0.00091
Flat Fan Sheet Constant3
Atomizer Dispersion Angle (deg)6
Table 2. Design of three-level simulation experiments of droplet deposition.
Cross Wind Speed (m/s)123
V-Shaped Wind Speed (m/s)123123123
Spray Pressure (MPa)
1A11A21A31B11B21B31C11C21C31
2A12A22A32B12B22B32C12C22C32
3A13A23A33B13B23B33C13C23C33
Table 3. Experimental design and range analysis.
Exp. No.Test FactorDeposition Center Drift Distance
A(x1)B(x2)C(x3)Y (cm)
11(2)1(15)1(0.4)8.9
212(20)2(0.5)4.9
313(25)3(0.6)3.1
42(3)129.2
52235.1
62313.5
73(4)139.6
83215.5
93324.0
y15.639.235.97Priority: B > A > C
y25.935.176.03
y36.373.535.93
Ry0.735.700.10
Table 4. Design and results of orthogonal polynomial regression experiment.
Exp. No.x1x2x3Z0(x1)Z1(x1)Z2(x1)Z1(x2)Z2(x2)Z1(x3)Z2(x3)y (cm)y2
11111−11−11−118.979.21
21221−110−20−24.924.01
31331−1111113.19.61
421210−2−110−29.284.64
522310−20−2115.126.01
623110−211−113.512.25
7313111−11119.692.16
83211110−2−115.530.25
9332111110−24.016.00
Table 5. Regression coefficient and calculation analysis.
CoefficientZ0Z1(x1)Z2(x1)Z1(x2)Z2(x2)Z1(x3)Z2(x3) y y 2
Dj961861861853.80374.14
Bj53.802.200.40−17.107.30−0.10−0.50S = 52.54
f = 8
bj5.980.370.02−2.850.41−0.02−0.03
Sj321.720.810.0148.742.990.000.02
Publisher’s Note: MDPI stays neutral with regard to jurisdictional claims in published maps and institutional affiliations.

