Abstract
The Monte Carlo simulation is a popular statistical method to estimate the effect of uncertainties on the solutions of nonlinear partial differential equations, but it requires a huge computational cost of the deterministic model, and the convergence may become slow. For this reason, we developed the multi-fidelity Monte Carlo (MFMC) methods based on data-driven low-fidelity models for uncertainty analysis of nonlinear partial differential equations. Firstly, the nonlinear partial differential equations are transformed into ordinary differential equations (ODEs) by using finite difference discretization or Fourier transformation. Then, the reduced dimension model and discrete empirical interpolation method (DEIM) are coupled to construct effective nonlinear low-fidelity models in ODEs system. Finally, the MFMC method is used to combine the output information of the high-fidelity model and the low-fidelity models to give the optimal estimation of the statistics. Experimental results of the nonlinear Schrodinger equation and the Burgers’ equation show that, compared with the standard Monte Carlo method, the MFMC method based on the data-driven low-fidelity model in this paper can improve the calculation efficiency significantly.
1. Introduction
Nonlinear partial differential equations are often used to describe mathematical models of physical, mechanical and engineering problems. However, the complexity of the real world and the limitations of people’s cognition, the mathematical models and numerical calculation processes of partial differential equations have various sources of uncertainties, such as uncertain parameters, initial and boundary conditions and a variety of model forms in the same process [1]. In recent years, uncertainty quantification [2,3] has become an emerging discipline in the aerospace and defense security industries, and it has attracted great attention in many cutting-edge areas, including academia and engineering applications.
Among the common uncertainty quantification methods, the Monte Carlo (MC) method is simple, easy to implement and robust [4]. However, the convergence speed of MC method is slow, especially in the application for the uncertainty analysis of high-dimensional problems of numerical methods for partial differential equations (e.g., finite element, finite difference and the Laplace adomian decomposition method [5]), which limits the application in some uncertainty quantification problems. Bonvin et al. [6] proposed a type of MC variance reduction technique, which ameliorates the error partially. However, there is no comprehensive consideration to reduce error, improve convergence speed and optimize the computational cost. Ng and Willcox [7] first proposed a multi-fidelity Monte Carlo method (MFMC) to estimate the mean using the control variate technique. They used efficient low-fidelity models to reduce the computational cost of high-fidelity models in uncertain optimization. Moreover, Peherstorfer et al. [8,9,10,11] extended the multi-fidelity method by using a large number of low-fidelity models and optimized the model allocation according to its corresponding authenticity and cost. In addition, Fleeter et al. [12] proposed a hybrid multi-fidelity method under a reasonable calculation cost, which improved the accuracy of the uncertainty quantification of cardiovascular dynamics. Recently, uncertainty quantification based on multi-fidelity Monte Carlo method has been successfully applied in many fields, as can be seen in [13,14,15,16,17,18,19].
In this work, we aim to extend the application of MFMC to the field of nonlinear partial differential equations, such as the nonlinear Schrodinger (NLS) equation and Burges’ equation, using some of the latest data-driven low-fidelity models, to improve the computational efficiency. As we know, in the framework of MFMC method, the high-fidelity models are selected according to the type and parameter characteristics of the actual problems, and the low-fidelity models are computationally cheap approximations of the underlying high-fidelity models. In recent years, several different types of low-fidelity models, for example, projection-based models [20,21,22], surrogate models [23], up-scaled models [24], have been applied to the MFMC framework.
Here, for the NLS equation, inspired by Ref. [19], the proper orthogonal decomposition (POD) method [22,25,26] coupled with discrete empirical interpolation method (DEIM) [27,28,29,30] is used to construct an optimal low fidelity model, which can deal with the complexity of higher order nonlinear terms of the NLS equation. Otherwise, for Burgers’ equation, we attempt to construct another kind of the low-fidelity model by using the operator reduction (OR) method [31,32,33], combined with DEIM for the parameterized Burgers’ equation. In particular, the quality of MFMC approach based on data-driven low-fidelity models is determined by its Pearson correlation coefficient relative to the high-fidelity model. Even if the accuracy of the data-driven low-fidelity models cannot be guaranteed, our MFMC estimator is unbiased for the output statistics of the high-fidelity models.
This paper is organized as follows. In Section 2, the MFMC algorithm and how to construct low-fidelity models are introduced. In Section 3, the MFMC method is used to solve the NLS equation with initial value uncertainty and the Burgers’ equation with parameter uncertainty, and the numerical results are compared with those calculated by the standard MC method. Conclusions are presented in Section 4.
2. Multi-Fidelity Monte Carlo Method
In this section, we first present the estimation models of MC method, and then describe the framework of MFMC. Then, we discuss how to construct appropriate and effective low-fidelity models of nonlinear partial differential equations.
2.1. Monte Carlo Method
Let and define the input domain and the output domain . Suppose the function is , that maps an input to an output . Let be the sample space and a random variable with range . Independent and identically distributed realizations of are denoted as , where . We consider the models for . The high-fidelity model denoted as and lower-fidelity models are with . The variance of is denoted as:
The Monte Carlo method draws independent and identical distribution sample of and the estimated expectation of MC estimation is:
The MC estimator is an unbiased estimator of . If the variance , then the mean-square error (MSE) of the estimator with respect to is given by the estimator variance
2.2. Multi-Fidelity Monte Carlo Method
2.2.1. Control Variables in Multi-Fidelity Estimation
The multi-fidelity method takes the random variable generated by the low-fidelity models as the control variable, to estimate the statistics of the random variable of the high-fidelity model . Let the number of model calculations be a vector with integer components and
so let be independent and identically distributed realizations of the random variable . For , evaluate model at the realizations of (4) to obtain
The component of is the number of calculations of model for . Derive the Monte Carlo estimate as in (2) from the model evaluations for . Additionally, the Monte Carlo estimate computed from the model evaluations for . The high-fidelity model expectation estimation is . The MFMC estimate of is then
where are control variable coefficients and is the Monte Carlo estimate using model and the first the number of calculations of model in the MFMC approach. The estimator (5) of MFMC is to correct the estimation of high-fidelity by using the sum of difference estimation of low-fidelity models. It can be seen from (5) that the estimation of MFMC method depends on number of model calculations and coefficients . In [8] (lemma3.1) show that the MFMC estimator is an unbiased estimator of .
Consider the Monte Carlo estimates of and with , the variance of the MFMC estimator is:
where is the Pearson correlation coefficient of random variables and for . The Pearson correlation coefficient is .
2.2.2. Multi-Fidelity Monte Carlo Framework
The MSE of MFMC method is estimated by the number of model calculations and the coefficients , and the cost of estimation is equal to the calculated budget. Since , it is sufficient to minimize the variance of the MFMC estimator. Therefore, the objective of the MFMC method is to minimize the variance of multi-fidelity estimation under a given computational budget , which can be achieved by solving of the optimization problem:
where the control variable coefficients and the number of model calculations are variables The inequality constraints for and ensure . Note that we will show for the optimal and therefore . The equality constraint guarantees that the cost of the corresponding MFMC estimator is equal to the computation budget . Peherstorf et al. [8] proved that the optimization problem in Equation (7) has unique approximate optimal solution under certain conditions of the high-fidelity and low-fidelity models. Let the models satisfy and the costs satisfy the ratios , for . The optimal control variable coefficients are:
The optimal numbers of model calculations are:
where , , and is the calculation budget. The global minimum solution of Equation (7) is . The MFMC framework is shown in Figure 1. Using the number of model calculations and the coefficients , the MSE of the multi-fidelity estimation is
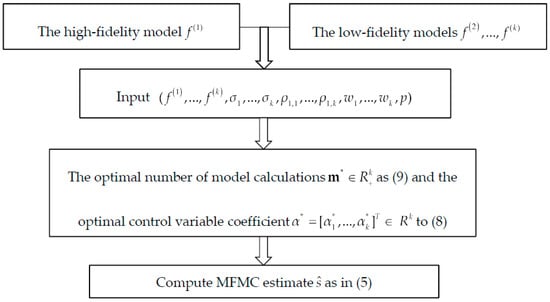
Figure 1.
The MFMC framework.
Since the cost of MC estimate is , is the numbers of model calculations and is the input calculation cost. The MSE of the MC estimator is rewritten as:
If we compare the MSE of the MFMC with the MSE of the standard MC estimator, it holds that , if and only if
The low-fidelity models lead to a MFMC estimator with a smaller MSE than the MSE of the standard MC estimator with the same budget .
2.3. Data-Driven Low-Fidelity Models of Nonlinear Partial Differential Equations
The uncertainty analysis framework of MFMC estimation needs to combine the output information of high-fidelity model and low-fidelity models to accelerate the estimation of statistics. In this paper, based on the data-driven low-fidelity models, the nonlinear partial differential equation is converted into ODEs system according to the type and parameter characteristics of the actual problem equations. Then, the reduced dimension model and DEIM are coupled to construct effective nonlinear low-fidelity models in ODEs system.
First, the nonlinear partial differential equations are transformed into ordinary differential equations in numerical simulation of partial differential equations. We can use the finite difference discretization or Fourier transformation to obtain the following nonlinear ordinary differential equations:
where is time, is the state vector or solution of the initial condition . The operator is the approximate matrix of linear space differential operator. The matrix is the input matrix, and is the nonlinear function calculated on the component with .
2.3.1. POD Coupled with DEIM
Consider a set of snapshots and the corresponding snapshot matrix . Let be the POD basis in dimensional space. The POD basis vector of the matrix is the largest left singular vectors of the matrix . The POD reduced-order system is obtained by Galerkin projection [22,26]:
where the reduced operator is , the reduced input operator is and state vector is .
We use POD method to construct low-fidelity models. Although the dimension of solving complex systems can be reduced, the complexity of higher order nonlinear terms may be as challenging as the original equation. DEIM [30,33] provides an effective calculation method for evaluating nonlinear terms.
Select vectors as columns stored in DEIM as base vector . The nonlinear terms are approximately , where and are the corresponding coefficient vectors. Then DEIM selects pairs of different interpolation points and assumes that DEIM interpolation point matrix , where is the -th standard unit vector. The coefficient vector can be uniquely determined by . The DEIM interpolation points of nonlinear function are composed of tuples defined by DEIM basis and DEIM interpolation point matrix . The DEIM approximate of nonlinear function is estimated at the state vector as:
By coupling POD (14) and DEIM (15), the POD-DEIM low-fidelity models are:
2.3.2. Operator Reduction
Another strategy of constructing the low-fidelity models is operator reduction [22,31]. We first construct a reduced space from trajectories of the full-model states, and the original operator is replaced by the reduced operator to construct the low-fidelity models of nonlinear partial differential equations.
Let be a matrix composed of the first POD basis vectors. The projection state of the full-model state is . Let be the trajectory and the input matrix be . Consider the time step with time step . For , let be the approximation of the derivative of the projection state at time that converges to under norm when . Suppose approximates the operators , and by the reduced operators , and . The reduction operators satisfy the equation:
We define the reduced operators , and as the solution of the optimization problem.
Let be the data matrix, where is the projection trajectory, is the input matrix, we define the matrix by using the finite difference scheme
The final optimization problem (18) is transformed into the least-square problem with the data matrix and the matrix :
The solution is .
3. Numerical Results
In this section, we give two numerical examples of nonlinear partial differential equations, using MFMC with data-driven low-fidelity models and the initial value uncertainty of NLS equation and the parameter uncertainty of Burgers’ equation are studied, respectively.
3.1. Uncertainty Analysis of NLS Equation with Initial Value
3.1.1. Estimate Analysis
NLS equation is a basic equation in quantum mechanics [33,34]. It can be used to describe the propagation phenomena and principles of optical solitons in fibers, the propagation of optical pulses in dispersion and nonlinear media and the motion of superconducting electrons in electromagnetic fields. We consider the NLS nonlinear partial differential equation:
where is a complex number function. Let be the spatial domain and the time be . We assume that the initial value is an uncertain input variable. In the NLS equation, the initial condition satisfies , is the double soliton order, is the propagation distance and obeys the normal distribution for the uncertainty analysis. Rewriting (21) by Fourier transformation, gives the set of differential equations
where is linear term and is nonlinear term.
To investigate the performance of our multi-fidelity estimation method based on data-driven low-fidelity models. We use the fourth- and fifth-order Runge–Kutta method to solve Equation (22), and the numerical solutions of NLS Equation are regarded as the high-fidelity model . The data-driven low-fidelity model of NLS equation is used to reduce the dimension for the numerical solutions by POD method and select three POD basis functions. Then, DEIM is used to reduce the dimension of higher order nonlinear terms and we obtain a type of the low-fidelity model . Table 1 shows the information for calculating these models with 1000 samples.

Table 1.
Number of samples per model, coefficients and costs for NLS equation.
We show the Pearson correlation coefficients and variances of the high- and low-fidelity models for NLS equation in Table 2. The two statistics are estimated using 100 evaluations of the high-fidelity and low-fidelity model. We can see that the low-fidelity model is highly correlated with a correlation coefficient of 0.9989. Note that the correlation is high enough and the low-fidelity model is cheap enough for the multi-fidelity estimator to be worthwhile.

Table 2.
The Pearson correlation coefficient and variances of high- and low-fidelity models for NLS equation.
We are interested in the expectation of the NLS equation if the initial value is uncertain. We choose the sample output function is and the time is . The Monte Carlo estimate of is computed from realizations and is used to estimate the MSE. We use the high-fidelity and the low-fidelity models listed in Table 1 to estimates the mean, variance and sensitivity index of output function for the NLS equation.
We compare the MC and MFMC expectation estimators in terms of their MSE that is estimated from 20 replicates as
where is the reference expectation estimator and is either an MFMC estimator (10) or an MC estimator (11). The reference expectation is computed from samples and we obtain .
Figure 2 reports the estimated MSE (23) of the standard MC estimators and the MFMC estimators of budgets from to . Compared with the standard MC method, the MSE of our MFMC method is smaller. That is, the MFMC method can be significantly better than the standard MC. The multi-fidelity method based on data-driven low-fidelity model has the same convergence speed as the MC method. Under the same budget , MSE estimated by the MFMC method is about 30 times lower than the MC method. For the same convergence rate, this means that the speed of the MC estimation is increased by 30 times. In other words, the MSE estimation of MFMC is 0.1 when the calculation budget is 300, but the budget of MC is 9000 with the same value of MSE.
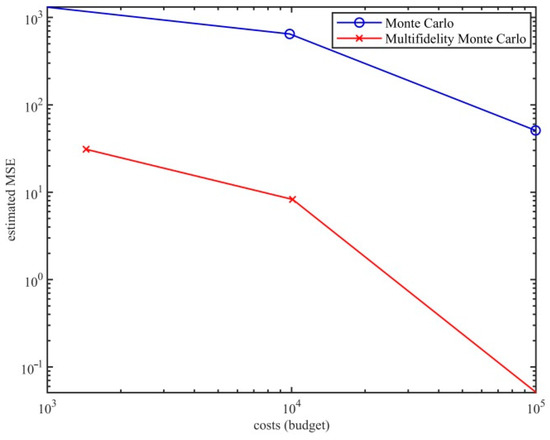
Figure 2.
The budgets of estimated MSE for the standard MC and MFMC estimators range from to .
To further study the stability of the MFMC method, Figure 3a shows that the MSE of the standard MC and MFMC estimator changes with runtime when the numbers of samples are 100, 500 and 1000. We can see, with the increase of running time, that MSE decreases under different sample numbers, indicating that MFMC is stable in the time evolution direction. On the other hand, the MSE of the MFMC is estimated by the number of model evaluations and the coefficients , while the number of model evaluations and coefficients are determined by the sample correlation coefficients and sample variances. Table 3 give the sample correlation coefficients computed from 100, 500 and 1000 samples. When the number of samples increases, the sample correlation coefficients change only slightly. Table 4 list the sample variance calculated by the same samples as before. Since calculating coefficients , only the sample variance ratios affect the value of coefficients. When increasing the samples 100 to 500, the ratios also change very little. Hence, the disturbance of sample variances and sample correlation coefficients has minimal effect on MSE estimated by MFMC method. Figure 3b reports the proportion plot of the number of model calculations for MFMC estimator when the sample numbers are 100, 500 and 1000. As the number of samples increases, the change of percentage is small, and it is confirmed that small perturbations in the sample estimates lead to small changes in the number of model evaluations .
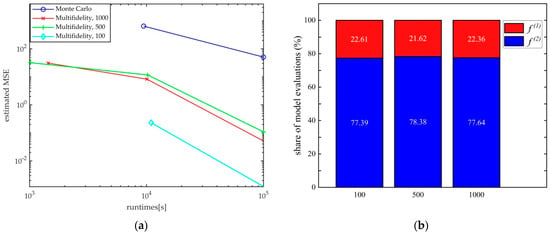
Figure 3.
(a) Comparison the estimated MSE of our MFMC estimators from 100, 500 and 1000 samples, respectively; (b) Proportion plot of the number of model calculations for MFMC estimator when the sample numbers are 100, 500 and 1000.

Table 3.
Comparison of correlation coefficient using 100, 500 and 1000 samples, respectively.

Table 4.
Comparison of sample variances by 100, 500 and 1000 samples, respectively.
3.1.2. Sensitivity Analysis
In uncertainty quantification analysis, another concern is the sensitivity for initial value of random input to output variation. We use the Sobol index [35,36,37] to analyze the contribution of each input variable to the output variance. Figure 4 displays the main and total sensitivities box plots of the estimators repeated 100 times under different computational budgets. We note that the MFMC estimator can accurately predict the contribution of each input variable compared with the standard MC estimator. When the low-fidelity model is used, the sensitivity index of the estimator decreases, and the variance of the estimator is also reduced.
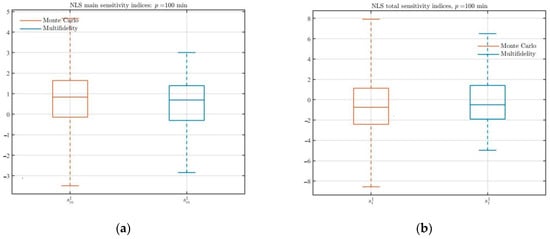
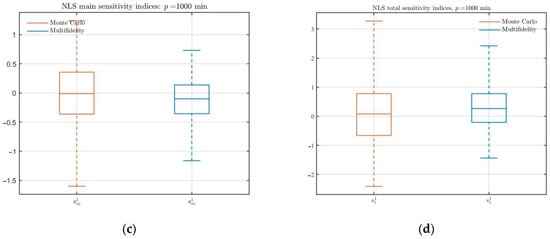
Figure 4.
(a,b) Comparison of the MFMC and standard MC estimates of main or total effect sensitivities for the NLS Equation (18) with computational budgets . (c,d) Comparison of the MFMC and standard MC estimates of main or total effect sensitivities for the NLS Equation (21) with computational budgets .
3.2. Parameter Uncertainty Analysis of Burgers’ Equation
3.2.1. Estimate Analysis
Let be the spatial domain and the time be . We consider the Burgers’ partial differential equation [25,38]:
where is the state at spatial coordinate , and is the input uncertainty parameter, which obeys the uniform distribution in the domain for uncertainty analysis. The boundary conditions are and for . We use the finite difference method to discretize the Burgers’ Equation (24) in an iso-spacing grid with 129 points of the spatial domain . We obtain parameterized nonlinear ordinary differential equations:
where is the operator of Burgers’ equation linear term, is the operator corresponding to the nonlinear term, and is the operator of boundary condition.
To develop a multi-fidelity estimator based on the data-driven low-fidelity model of nonlinear partial differential equations. The numerical solutions of Equation (24) are used as a high-fidelity model . Then, the data-driven low-fidelity models are obtained by using operator reduction coupled with DEIM. Two types of low-fidelity models are constructed, respectively. The values of random parameter space for one of the low-fidelity model are calculated by DEIM of high fidelity models. We construct other reduction model from 129 to 20 dimensions by using the operator reduction of the full-model. The value of random parameter space is calculated by DEIM for reduction model, and we obtain the low-fidelity model . The information of each multi-fidelity model, calculated using 20,000 samples, is reported in Table 4.
In the uncertainty quantification analysis of nonlinear partial differential equation, we are interested in the expected of random parameter. The sample output function is and the time is . The MC estimate of is computed from and is used to estimate the MSE. The MC method is compared with the MFMC estimator under the given calculation budgets. It is hoped that the optimal MFMC method can obtain satisfactory estimation. We use the high-fidelity and the low-fidelity models as shown in Table 5 to estimates the mean, variance and sensitivity of output function for the Burgers’ equation, where the low-fidelity models use the operator reduction method and the DEIM for the parameterization Burgers’ equation.

Table 5.
Number of samples per model, coefficients and costs for Burgers’ equation.
High-fidelity (FD) The high-fidelity model , low-fidelity models and are divided into three groups for comparative study. Figure 5 displays the estimated MSE (23) of those three models, respectively. The MSE of the MFMC estimator achieves a speedup of up to two orders of magnitude compared to the standard MC estimator. In the three numerical experiments, when the cost is , the MSEs estimated by the multi-fidelity models are , and in sequence. Therefore, the MSE of the models are further decreased when the calculation budget for output function expectation is increased.
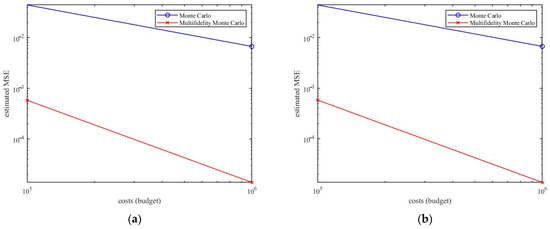
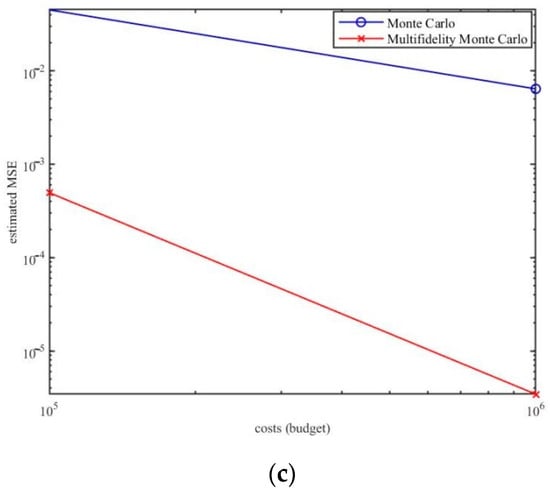
Figure 5.
The estimated MSE of the standard MC estimators and the MFMC estimators of budgets from to . (a) MSE estimation of , . (b) MSE estimation of , . (c) MSE estimation of , , .
Compared with the standard MC method, under the same computational budget, the MFMC can be superior to the MC for each statistical quantity. Figure 6 shows the relative share of each model in the total number of samples. The shares of the models vary by orders of magnitude between the high-fidelity and low-fidelity models, reflecting their correlations and costs. It should be noted that the relative share of the model is not related to the calculation budget , because all components of are linearly proportional to .
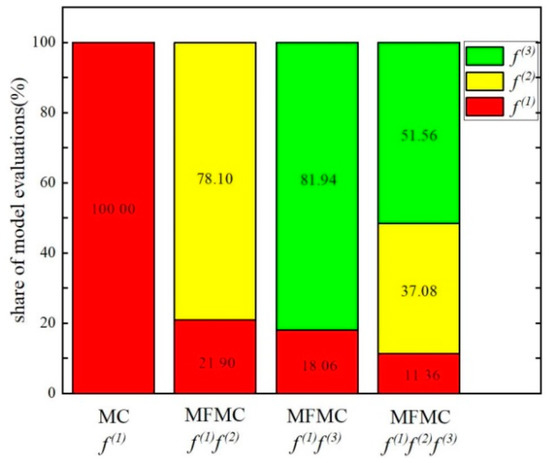
Figure 6.
The total number of samples distribution in high-fidelity and low-fidelity models.
3.2.2. Sensitivity Analysis
To further analyze the parameter uncertainty law of Burgers’ equation, the sensitivity of the parameter is studied. Figure 7 reports the standard MC and MFMC estimator, respectively, in and computational budget, repeated times estimates of the main sensitivity and total sensitivity box plots. It is worth noting that compared with the standard MC estimation, the sensitivity index of the MFMC method estimator decreases and the estimated variance is also reduced. Therefore, in all cases, compared with the standard MC estimation, the multi-fidelity estimation has smaller variance with the budget increases. When the true value of the sensitivity index is closer to zero, the variance of the estimator is similar as the order of sensitivity magnitudes.
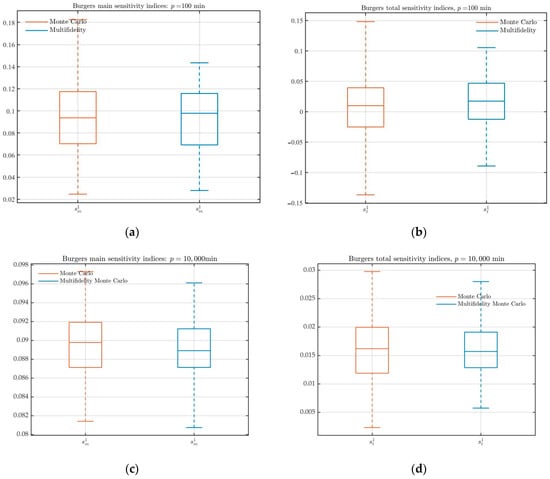
Figure 7.
(a,b) Comparison of the MFMC and standard MC estimates of main or total effect sensitivities for the Burgers’ Equation (24) with computational budgets . (c,d) Comparison of the MFMC and standard MC estimates of main or total effect sensitivities for the Burgers’ Equation (24) with computational budgets .
4. Conclusions
We developed the MFMC based on the data-driven low-fidelity models of nonlinear partial differential equations in order to solve the problem of high computational cost in the uncertainty quantification of numerical solutions. The main strategy is that the reduced dimension model and DEIM are coupled to construct effective nonlinear low-fidelity models in ODEs system. Our method combined the output information of high-fidelity models and low-fidelity models to speed up the estimation of statistics, so that the calculation cost is lower and the MSE is smaller.
The presented MFMC approach is used to calculate the statistical information, including mean, variance and sensitivity for the NLS equation with the initial value uncertainty and Burgers′ equation with parameter uncertainty. The results shows that the MFMC estimation with the data-driven low-fidelity models can effectively reduce the MSE and predict the output statistics well under the condition of multiple numbers of sample points for nonlinear partial differential equations. It provides a good solution for solving the uncertainty quantification problem of multivariate in physics, mechanics and engineering technologies. However, it should be pointed out that the key point of MFMC method is the necessity of having suitable low-fidelity models for our high-fidelity models. For an unknown complex system, how to construct an appropriate low-fidelity model needs further research and discussion.
Author Contributions
W.D. developed the numerical method, analyzed the data and drafted the manuscript. J.S. conceived of the study and finalized the manuscript and edited the manuscript. All authors have read and agreed to the published version of the manuscript.
Funding
This research was funded by National Natural Science Foundation of China, grant number 11601411, and the Natural Science Foundation of Shanxi Province of China, grant number 2021JM-448.
Institutional Review Board Statement
Not applicable.
Informed Consent Statement
Not applicable.
Data Availability Statement
The results presented in this study are available on request from the corresponding author.
Conflicts of Interest
The authors declare no conflict of interest.
References
- Kharazmi, E.; Zayernouri, M. Operator-based uncertainty quantification of stochastic fractional partial differential equations. J. Verif. Valid. Uncert. 2019, 4, 041006. [Google Scholar] [CrossRef]
- Chen, P. Model Order Reduction Techniques for Uncertainty Quantification Problems; EPFL: Lausanne, Switzerland, 2014. [Google Scholar]
- Baklouti, A.; Dammak, K.; El Hami, A. Uncertainty Analysis Based on Kriging Meta-Model for Acoustic-Structural Problems. Appl. Sci. 2022, 12, 1503. [Google Scholar] [CrossRef]
- Rudisill, J.W.; Cummings, P.T. Brownian dynamics simulation of model polymer fluids in shear flow. I. Dumbbell models. J. Non-Newton. Fluid 1992, 41, 275–288. [Google Scholar] [CrossRef]
- Shah, R.; Khan, H.; Kumam, P.; Arif, M. An analytical technique to solve the system of nonlinear fractional partial differential equations. Mathematics 2019, 7, 505. [Google Scholar] [CrossRef]
- Bonvin, J.; Picasso, M. Variance reduction methods for CONNFFESSIT-like simulations. J. Non-Newton. Fluid 1999, 84, 191–215. [Google Scholar] [CrossRef]
- Ng, L.W.; Willcox, K.E. Multi-fidelity approaches for optimization under uncertainty. Int. J. Numer. Meth. Eng. 2014, 100, 746–772. [Google Scholar] [CrossRef]
- Peherstorfer, B.; Willcox, K.; Gunzburger, M. Optimal model management for multi-fidelity Monte Carlo estimation. SIAM J. Sci. Comput. 2016, 38, A3163–A3194. [Google Scholar] [CrossRef]
- Peherstorfer, B.; Willcox, K.; Gunzburger, M. Survey of multi-fidelity methods in uncertainty propagation, inference, and optimization. SIAM Rev. 2018, 60, 550–591. [Google Scholar] [CrossRef]
- Peherstorfer, B.; Beran, P.S.; Willcox, K.E. Multi-fidelity Monte Carlo estimation for large-scale uncertainty propagation. In Proceedings of the 2018 AIAA Non-Deterministic Approaches Conference, Kissimmee, FL, USA, 8–12 January 2018; American Institute of Aeronautics and Astronautics: Reston, VA, USA, 2018. [Google Scholar] [CrossRef]
- Peherstorfer, B.; Cui, T.; Marzouk, Y.; Willcox, K. Multifidelity importance sampling. Comput. Methods Appl. Mech. Eng. 2016, 300, 490–509. [Google Scholar] [CrossRef]
- Fleeter, C.M.; Geraci, G.; Schiavazzi, D.E.; Kahn, A.M.; Marsden, A.L. Multilevel and multifidelity uncertainty quantification for cardiovascular hemodynamics. Comput. Methods Appl. Mech. Eng. 2020, 365, 113–130. [Google Scholar] [CrossRef]
- Cook, L.W.; Mishra, A.; Jarrett, J.P.; Willcox, K.E.; Iaccarino, G. Optimization under turbulence model uncertainty for aerospace design. Phys. Fluids 2019, 31, 105–111. [Google Scholar] [CrossRef]
- Ng, L.W.; Willcox, K.E. Monte Carlo information-reuse approach to aircraft conceptual design optimization under uncertainty. J. Aircr. 2016, 53, 427–438. [Google Scholar] [CrossRef]
- Peherstorfer, B. Multifidelity Monte Carlo estimation with adaptive low-fidelity models. SIAM/ASA J. Uncertain. Quantif. 2019, 7, 579–603. [Google Scholar] [CrossRef]
- Marques, A.N.; Opgenoord, M.M.; Lam, R.R.; Chaudhuri, A.; Willcox, K.E. Multifidelity method for locating aeroelastic flutter boundaries. AIAA J. 2020, 58, 1772–1784. [Google Scholar] [CrossRef]
- Feldstein, A.; Lazzara, D.; Princen, N.; Willcox, K. Multifidelity data fusion: Application to blended-wing-body multidisciplinary analysis under uncertainty. AIAA J. 2020, 58, 889–906. [Google Scholar] [CrossRef]
- Law, F.; Cerfon, A.; Peherstorfer, B. Accelerating the estimation of collisionless energetic particle confinement statistics in stellarators using multifidelity Monte Carlo. Nucl. Fusion 2022, 62, 076019. [Google Scholar] [CrossRef]
- Konrad, J.; Farcaş, I.G.; Peherstorfer, B.; Di Siena, A.; Jenko, F.; Neckel, T.; Bungartz, H.J. Data-driven low-fidelity models for multi-fidelity Monte Carlo sampling in plasma microturbulence analysis. J. Comput. Phys. 2022, 451, 110898. [Google Scholar] [CrossRef]
- Benner, P.; Gugercin, S.; Willcox, K. A survey of projection-based model reduction methods for parametric dynamical systems. SIAM Rev. 2015, 57, 483–531. [Google Scholar] [CrossRef]
- Swischuk, R.; Mainini, L.; Peherstorfer, B.; Willcox, K. Projection-based model reduction: Formulations for physics-based machine learning. Comput. Fluids 2019, 179, 704–717. [Google Scholar] [CrossRef]
- Park, C.; Haftka, R.T.; Kim, N.H. Remarks on multi-fidelity surrogates. Struct. Multidiscip. Optim. 2017, 55, 1029–1050. [Google Scholar] [CrossRef]
- Durlofsky, L.J.; Chen, Y. Uncertainty quantification for subsurface flow problems using coarse-scale models. In Numerical Analysis of Multiscale Problems; Springer: Berlin/Heidelberg, Germany, 2012; pp. 163–202. [Google Scholar] [CrossRef]
- Sirovich, L. Turbulence and the dynamics of coherent structures. I. Coherent structures. Quart. Appl. Math. 1987, 45, 561–571. [Google Scholar] [CrossRef]
- Peherstorfer, B.; Willcox, K. Data-driven operator inference for nonintrusive projection-based model reduction. Comput. Methods Appl. Mech. Eng. 2016, 306, 196–215. [Google Scholar] [CrossRef]
- Chen, J.; Han, D.; Yu, B.; Sun, D.; Wei, J. A POD-Galerkin reduced-order model for isotropic viscoelastic turbulent flow. Int. Commun. Heat Mass Transf. 2017, 84, 121–133. [Google Scholar] [CrossRef]
- Quarteroni, A.; Manzoni, A.; Negri, F. Reduced Basis Methods for Partial Differential Equations: An Introduction; Springer International Publishing: Cham, Switzerland, 2015; pp. 115–242. [Google Scholar]
- Chaturantabut, S.; Sorensen, D.C. Nonlinear model reduction via discrete empirical interpolation. SIAM J. Sci. Comput. 2010, 32, 2737–2764. [Google Scholar] [CrossRef]
- Buffoni, M.; Willcox, K. Projection-based model reduction for reacting flows. In Proceedings of the 40th Fluid Dynamics Conference and Exhibit, Chicago, IL, USA, 28 June–1 July 2010; American Institute of Aeronautics and Astronautics: Reston, VA, USA, 2012. [Google Scholar] [CrossRef][Green Version]
- Qian, E.Y. A Scientific Machine Learning Approach to Learning Reduced Models for Nonlinear Partial Differential Equations; Massachusetts Institute of Technology: Cambridge, MA, USA, 2021; pp. 17–164. Available online: http://dspace.mit.edu/handle/1721.1/7582 (accessed on 1 February 2021).
- Peherstorfer, B.; Willcox, K. Dynamic data-driven reduced-order models. Comput. Methods Appl. Mech. Eng. 2015, 291, 21–41. [Google Scholar] [CrossRef]
- Uy, W.I.T.; Peherstorfer, B. Operator inference of non-Markovian terms for learning reduced models from partially observed state trajectories. J. Sci. Comput. 2021, 88, 91. [Google Scholar] [CrossRef]
- Brunton, S.L.; Kutz, J.N. Data-Driven Science and Engineering: Machine Learning, Dynamical Systems, and Control; Cambridge University Press: Cambridge, UK, 2019; pp. 438–504. [Google Scholar]
- Bhatti, M.I. Plane Wave Solutions of a Quantum Fractional Schrödinger Equation and Uncertainty Principle. Curr. Sci. 2017, 6, 707–709. [Google Scholar]
- Qian, E.; Peherstorfer, B.; O’Malley, D.; Willcox, K. Multi-fidelity Monte Carlo estimation of variance and sensitivity indices. SIAM/ASA J. Uncertain. Quantif. 2018, 6, 683–706. [Google Scholar] [CrossRef]
- Homma, T.; Saltelli, A. Importance measures in global sensitivity analysis of nonlinear models. Reliab. Eng. Syst. Saf. 1996, 52, 1–17. [Google Scholar] [CrossRef]
- Kucherenko, S.; Delpuech, B.; Iooss, B.; Tarantola, S. Application of the control variate technique to estimation of total sensitivity indices. Reliab. Eng. Syst. Saf. 2015, 134, 251–259. [Google Scholar] [CrossRef]
- Jornet, M. Uncertainty quantification for the random viscous Burgers’ partial differential equation by using the differential transform method. Nonlinear Anal. 2021, 209, 112340. [Google Scholar] [CrossRef]
Publisher’s Note: MDPI stays neutral with regard to jurisdictional claims in published maps and institutional affiliations. |
© 2022 by the authors. Licensee MDPI, Basel, Switzerland. This article is an open access article distributed under the terms and conditions of the Creative Commons Attribution (CC BY) license (https://creativecommons.org/licenses/by/4.0/).