1. Introduction
1.1. Review of Related Works
Historic Building Information Modeling (HBIM) has been widely applied for digital documentation of cultural heritage and generally consists of several steps: onsite investigation, modeling, knowledge association, and delivery [
1,
2,
3,
4]. With the increasing scale of a project, modeling and knowledge association become time-consuming, which rely on the development of tools or methods to check [
5,
6,
7], exchange or transform [
6,
8,
9,
10,
11,
12], extract or retrieve [
10,
12,
13,
14,
15,
16,
17], and match or map [
10,
12,
13,
15,
18,
19,
20].
Ontology modeling is adopted for semantically indexing and retrieving information. Zhang and Issa [
16] developed a Java prototype application for generating ontology from the model. Kim et al. [
21] and Hor et al. [
22] focused on the development of the ontology for integration between GIS and BIM. To improve the efficiency of the query, Wang et al. [
13] proposed a method for mapping from ontology to graph database, improving the efficiency of the query. Jiang and Wu [
14] proposed a solution to retrieve relationship data from the IFC model of large quantities, then expressed in the graph database. Yang et al. [
23] developed an algorithm for twinning the model into the graph database, which was designed for IFC-based construction management information. The machine-learning and deep-learning methods were applied to automatically segment the point cloud by semantics [
17,
20].
However, with the development of the investigation, the models need to be updated dynamically, as well as the heterogeneous metadata. Mistakes may occur in practice. Using the integrated repository to exchange information was proven to be effective and flexible in application [
24].
It is worth noting that Sadeghineko et al. [
25] proposed a method that translated RDF data to IFC data, stored it in XML format, then generated the parametric model from the IFC XML. All the information was stored as an open-source data model. Once changes were applied, the RDF data could be correspondingly modified to fit the changes to the Revit model, simplifying the process.
Celeste et al. [
26] suggested the synergy between metamodel and ontology to integrate GIS and BIM. Compared to the metamodeling technique, data in ontologies were linked, rather than merged or transformed. The metamodel could be subdivided into four ‘metalevels’:
M3: the meta-object facility or meta-metamodel, e.g., IFC XML;
M2: the metamodel, e.g., IFC schema, structure;
M1: the model, e.g., IFC file;
M0: the real-world object, e.g., cultural heritage assets.
The Grasshopper is a node-visible, visual programing, and open-source modeling platform in Rhino. It uses algorithm binaries as calculators of different functions. Through algorithm modeling, complex problems can be simplified and then form an automatic workflow to output models and data [
27,
28].
Therefore, in the Grasshopper platform, the algorithm binaries could be regarded as the M3 metalevel, the modularized cluster as the M2 metalevel, and the output geometry baked into Rhino as the M1 metalevel.
Ontology could be regarded as the M2 metalevel, for it is written in XML format (M3 metalevel) to describe the model instance (M1 metalevel); however, it does not depend on the model instance [
9,
29]. The Neo4j was selected as the platform to build the graph database, for its high performance in processing big data. The query speed will not decrease with the increasing scale of data [
12,
13,
15,
30,
31,
32].
In conclusion, it is relatively less complicated to manage data in the M3 or M2 metalevel and then distribute the data to the model in the M1 metalevel. This method needs further research to dynamically generate the IFC model along with its graph database.
1.2. Purpose and Significance
To minimize data loss of format exchange and frequent switching between different software platforms, the proposed approach develops a modeling algorithm in Grasshopper, which is a top-down method. It aims to output both the model and data from high metalevel to low metalevel, with information associated in between. It was tested on Grasshopper and Neo4j but is also applicable to other platforms.
This approach simplified the procedure of data check, exchange, extract, etc., by centralizing the management of metadata and metamodel with each corresponding repository. The metadata and metamodel are real-time connected by the unique identifier that is given to each model unit (in this case, a roof tile is defined as a model unit). Participants from different disciplines can collaborate through the spreadsheet and check the deliverables from input parameters (
Figure 1).
1.3. Overview of the Roof Tile in Yangxindian Palace
The term Yangxindian means hall of mental cultivation [
33]. It was built in the Ming Dynasty (1368–1644) in the Forbidden City (Beijing, China) and has been reconstructed many times. Eight emperors lived there.
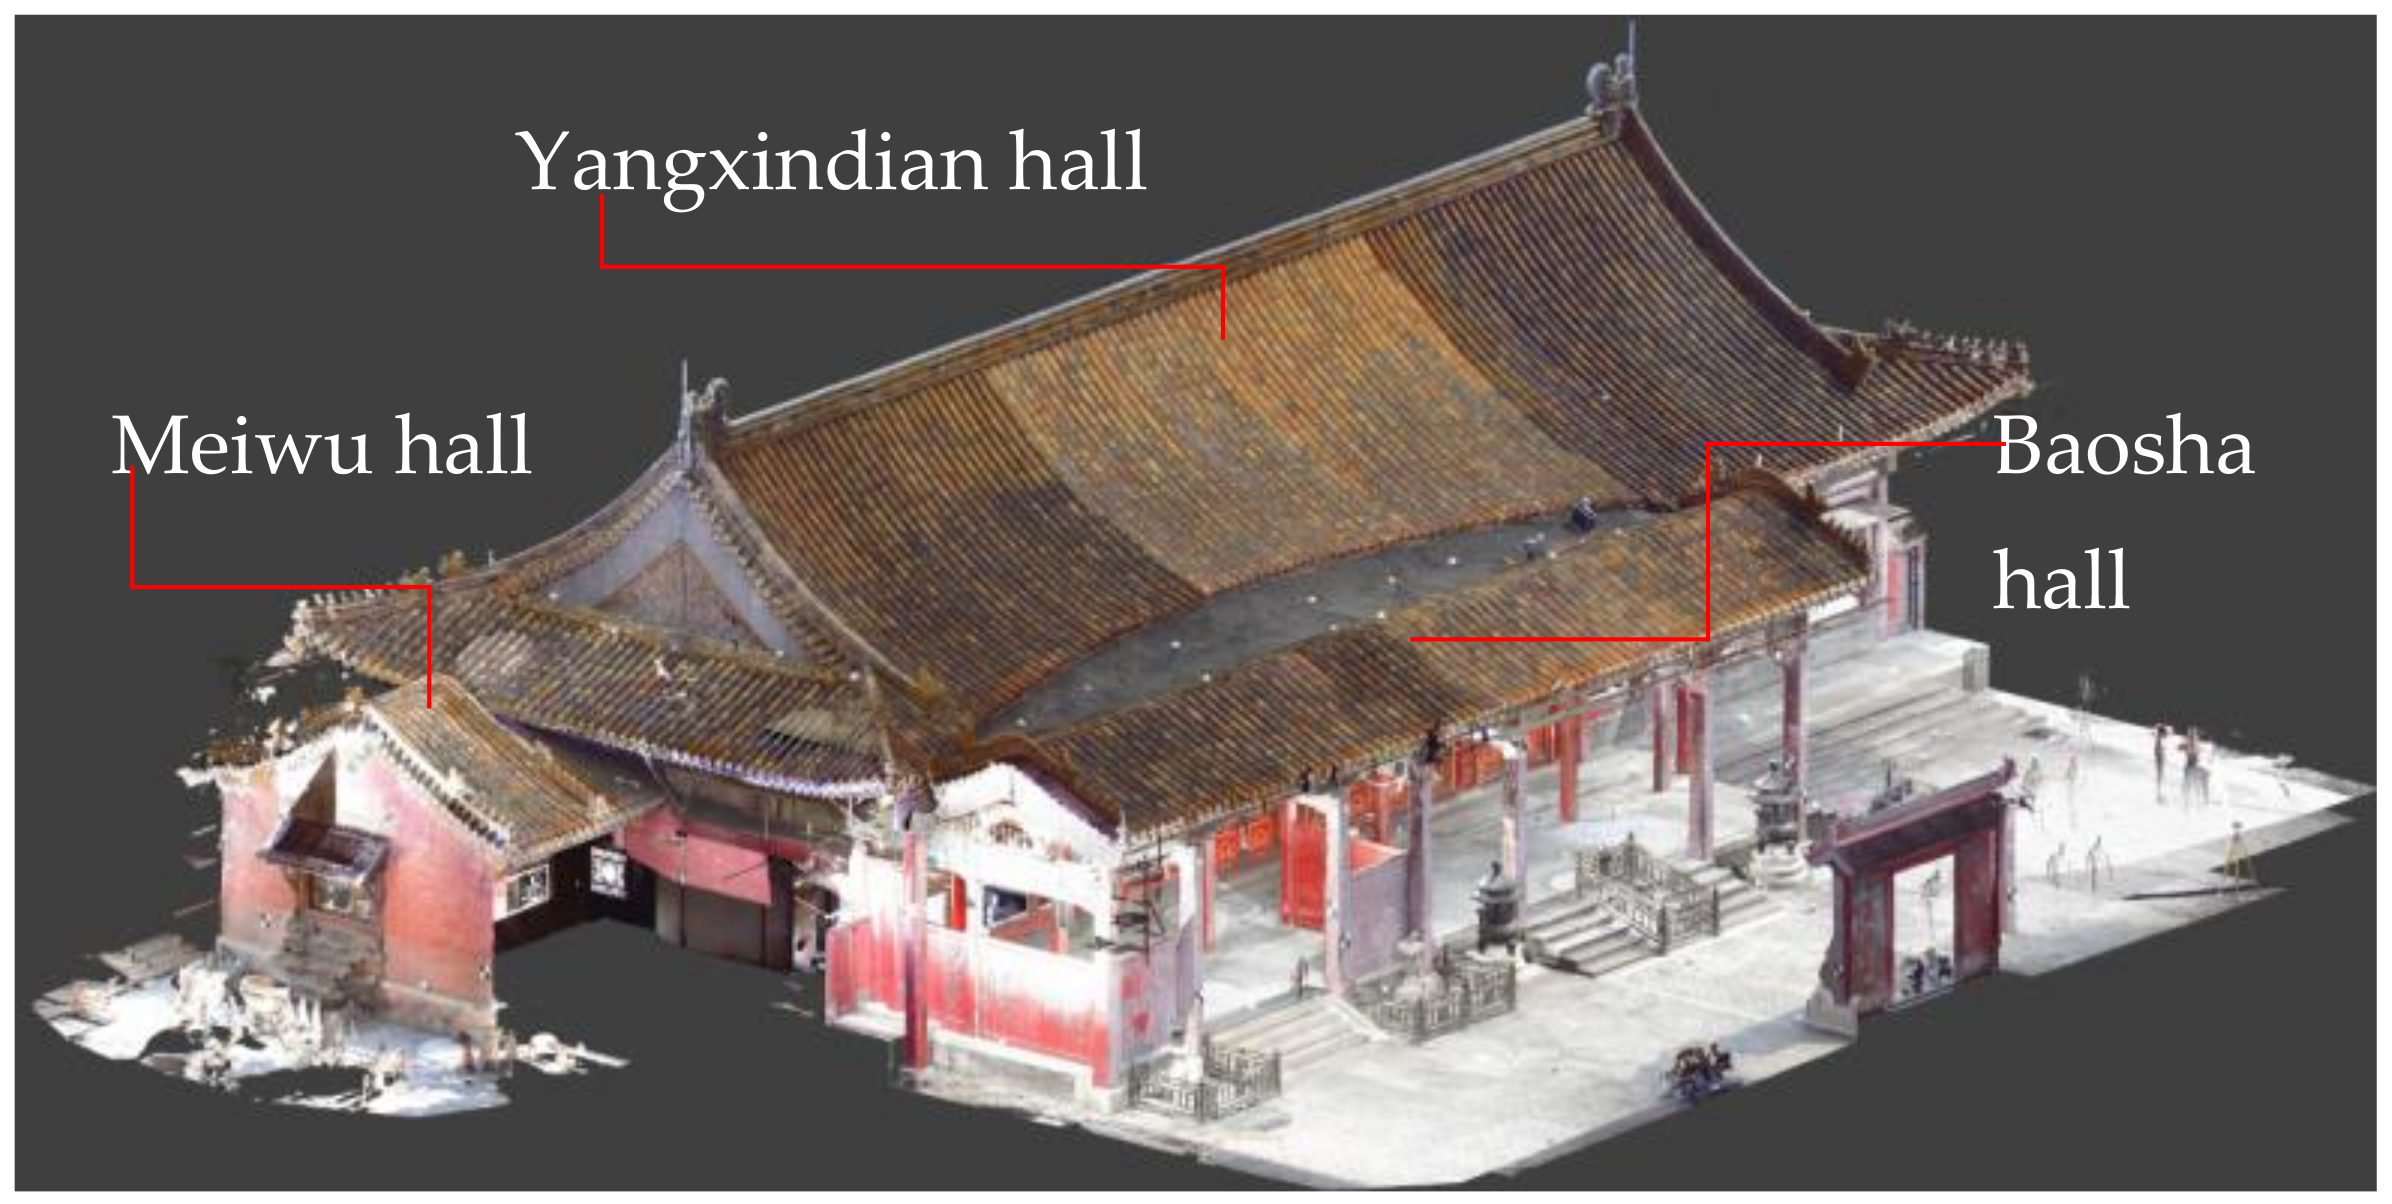
The Yangxindian Palace consists of three halls: the Yangxindian hall, the Baosha hall, and the Meiwu hall. The submodel of this project was also divided as such. The policy prohibits aerial photography; thus, point cloud obtained by laser scanning was the only available method to display the current status of the roof (
Figure 2).
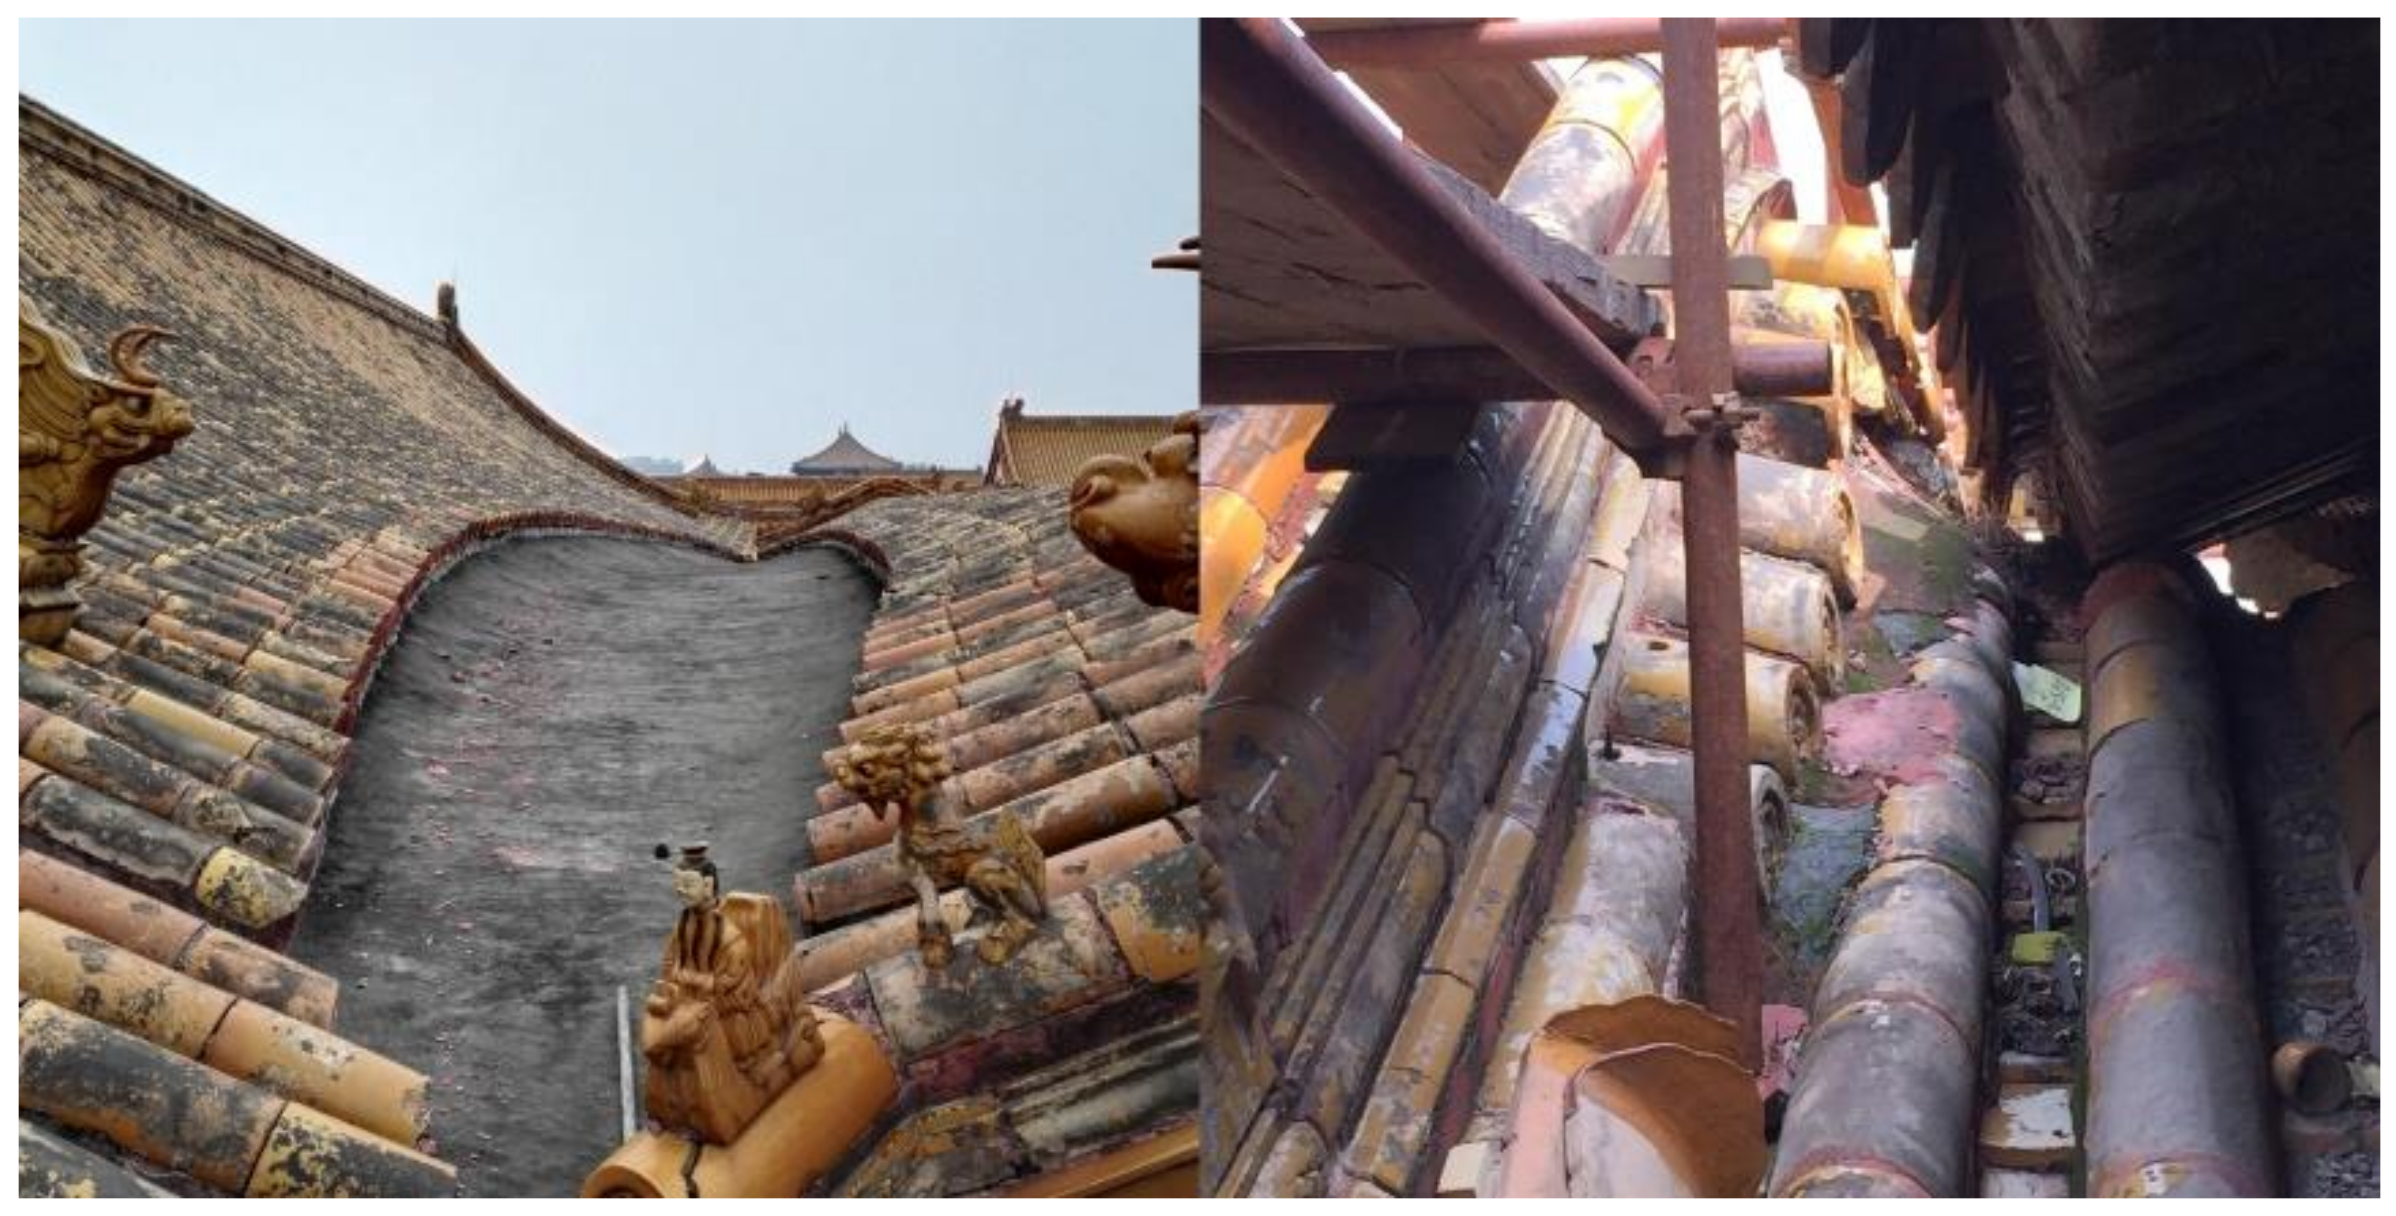
None of these three roofs are regular in shape: the roof of Yangxindian hall and Baosha hall are connected with a gutter; the roof watershed of Meiwu hall is falling to avoid collision with Yangxindian hall (
Figure 3). All tiles are equally distributed on double-curved irregular surfaces, most of them sharing two prototypes: the under tile and the cover tile. Ridges can be regarded as linear objects, and ornaments can be regarded as shared units.
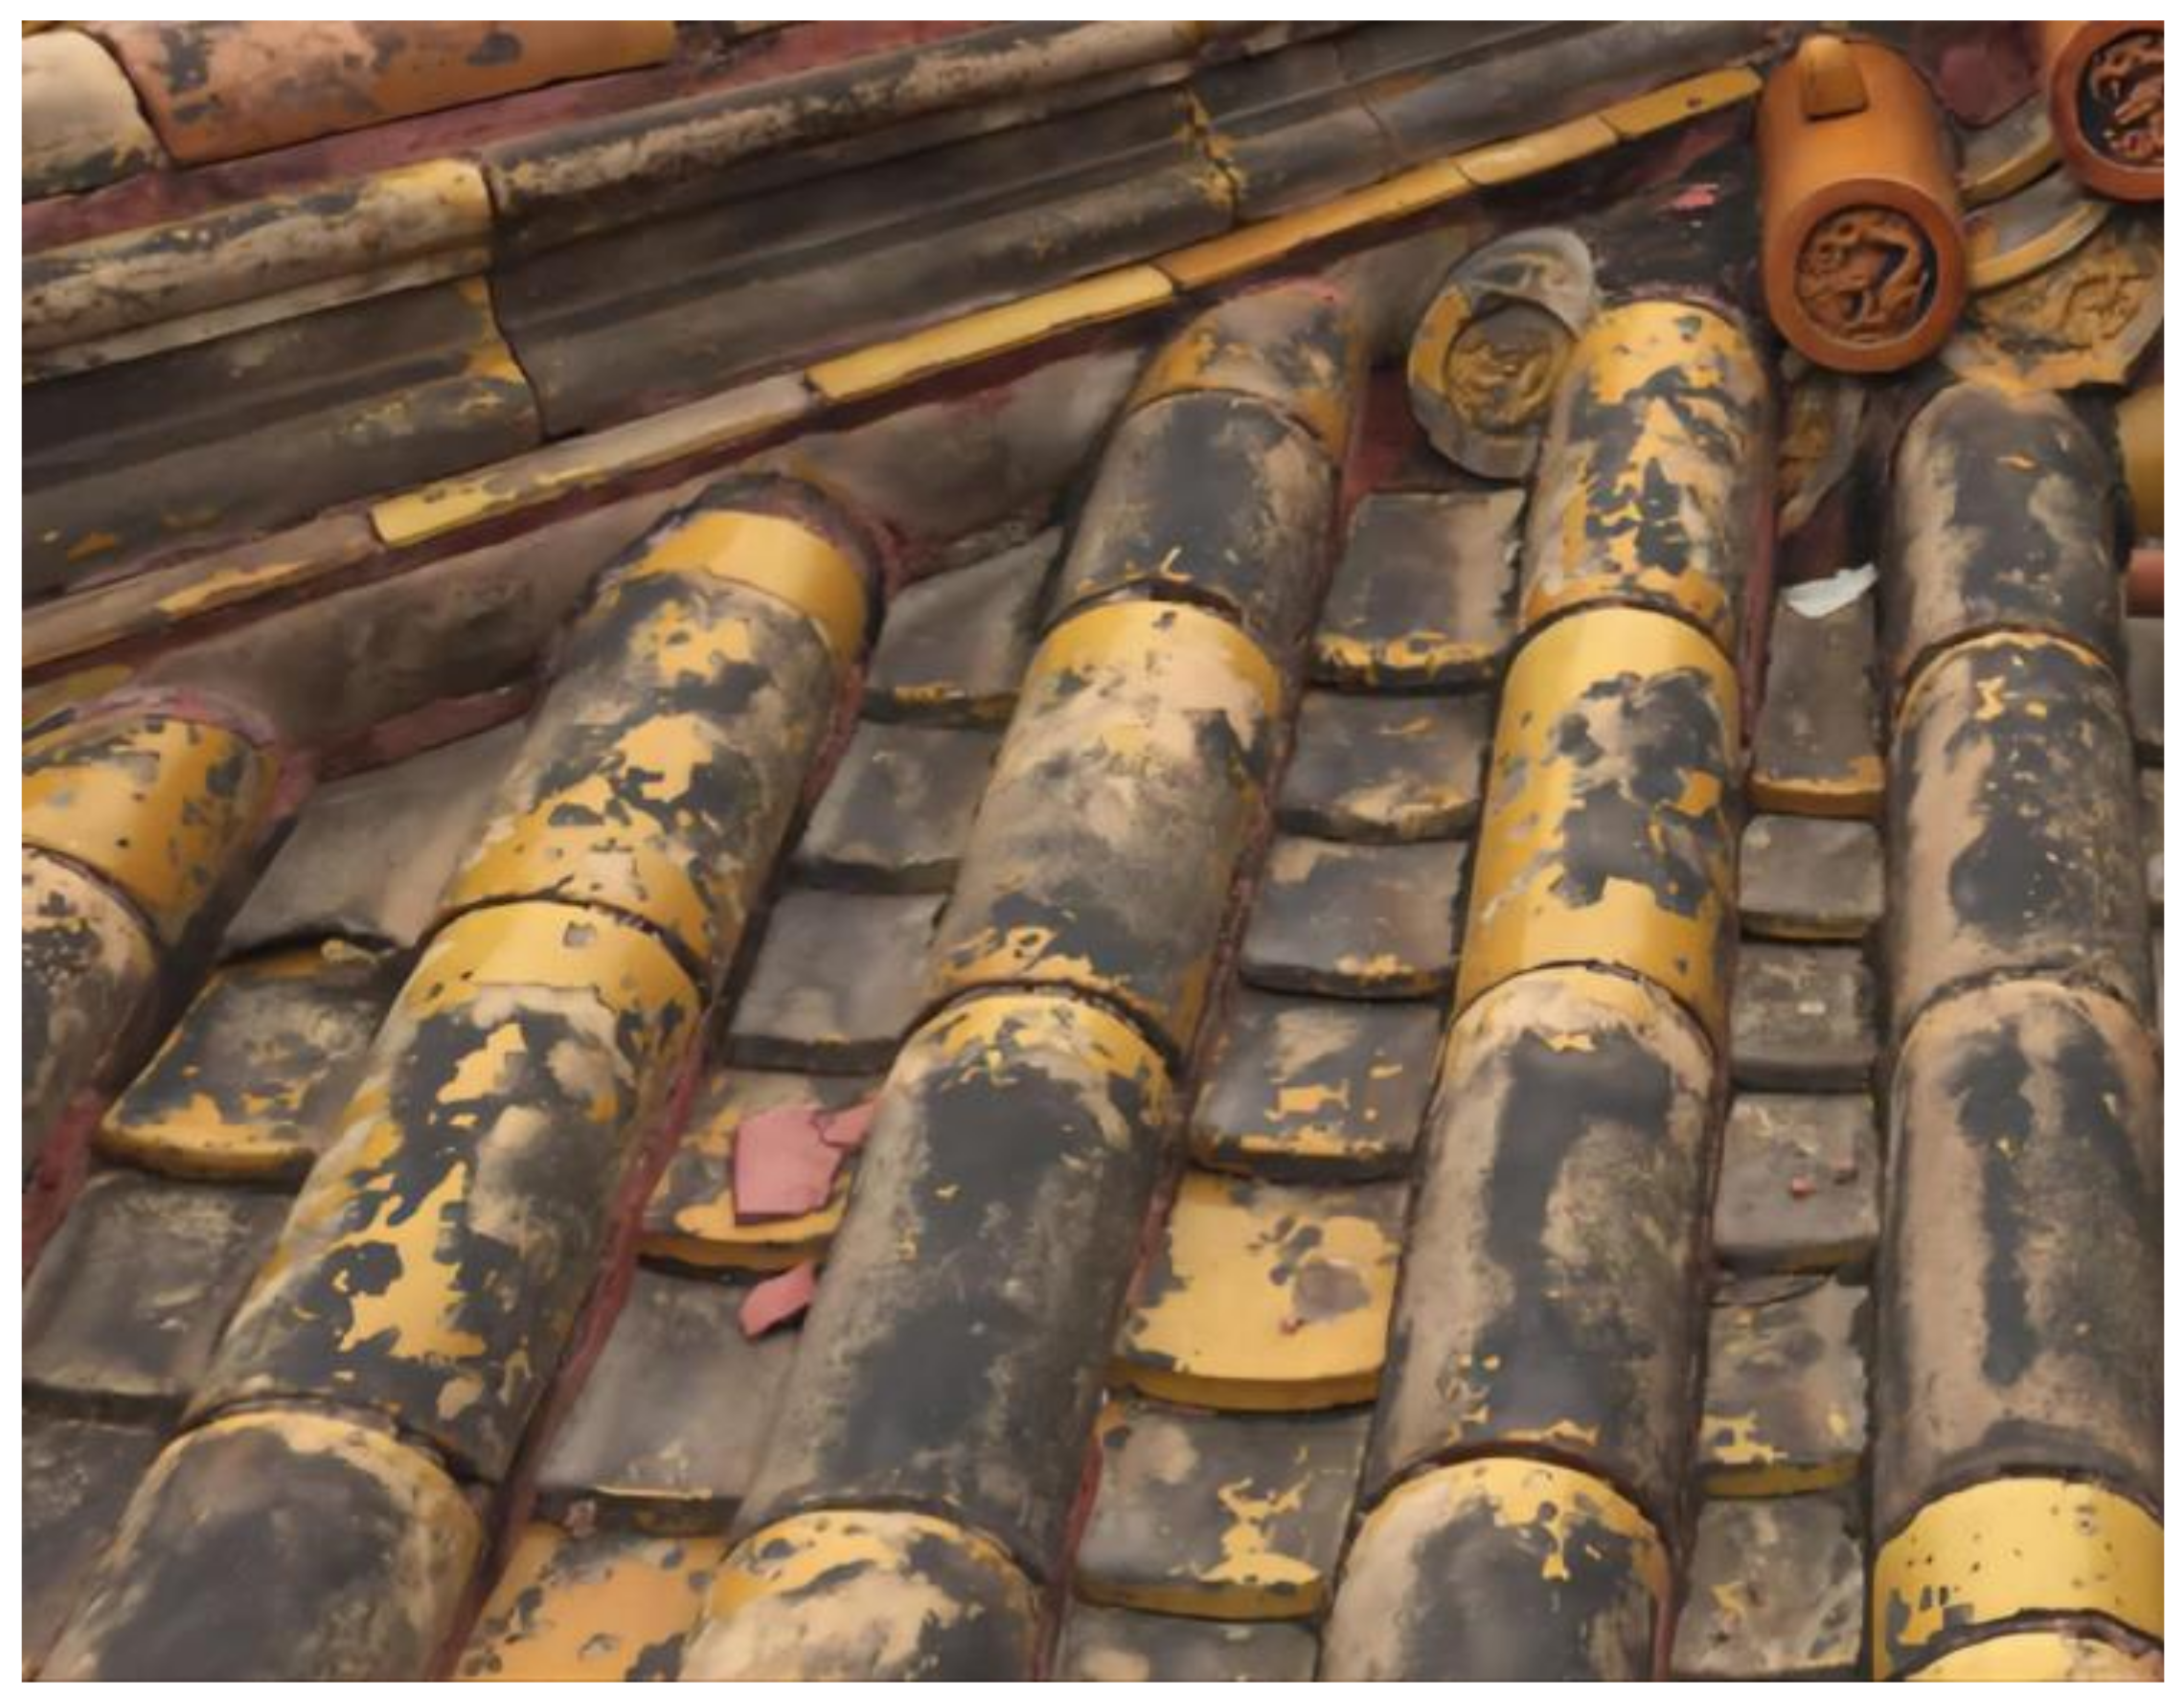
Based on the building techniques, the under tiles are laid on the roofing plaster by stacking; each cover tile is next to two or three under tiles (
Figure 4), which means for one tile row, the actual number of the under tiles should be twice or triple the number of the cover tiles. However, to rebuild a regularized model, every two under tiles were documented as one record, given the same identifier. Therefore, the level of the model unit definition should follow the level of investigation [
34].
2. Materials and Methods
2.1. Data Collection
The point cloud was collected in different periods. Most of the wooden structures were measured with a tape measure manually. The precision of the point cloud was controlled to a 10 mm error. Improving accuracy and reducing errors will be future work.
In this case, the cover tile was recorded one as one, while the under tile was recorded with every two as one; therefore the model unit had to follow this rule. A total number of 25,903 units were modeled, and only 2015 units were documented for deterioration, along with the condition data and intervention data. Since the roof contains several kinds of components, statistics of the roof are listed in
Table 1.
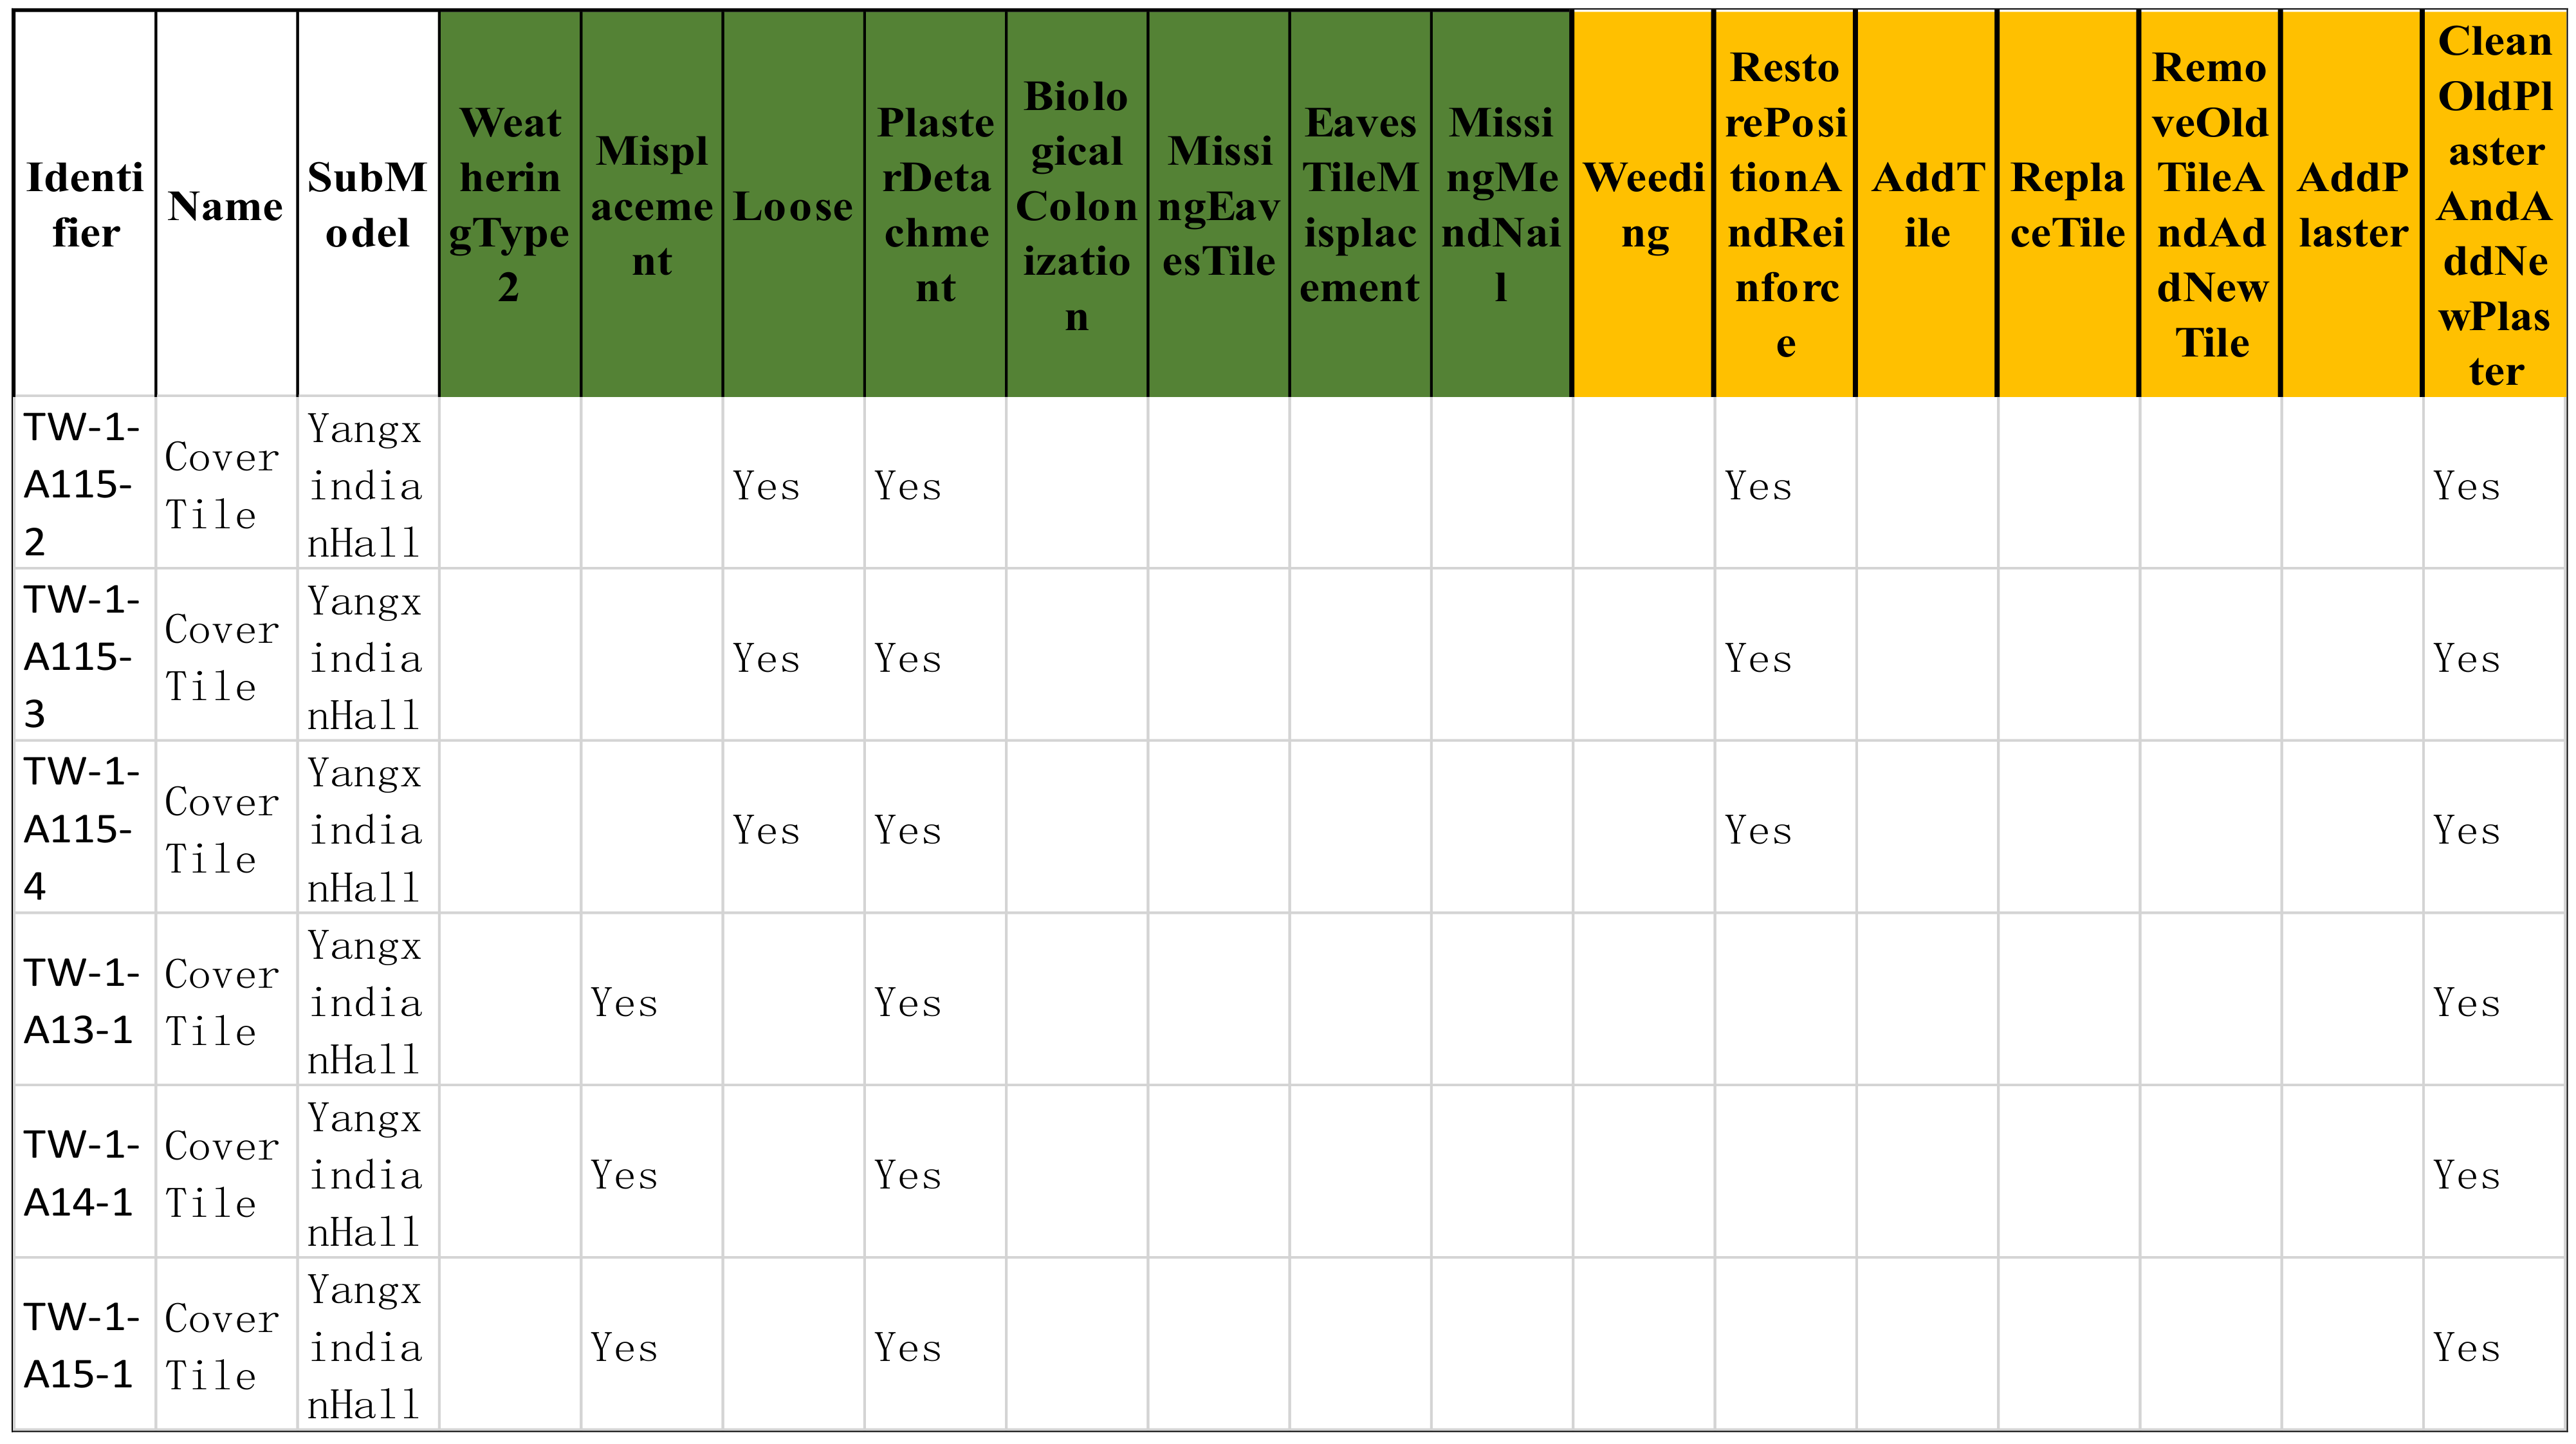
During the continuous process of onsite investigation, metadata gradually accumulated, i.e., condition data, intervention data, and the comprehension of building techniques. The condition data and intervention data were associated with the identifier, then rearranged as the metadata repository. All of the data processed in this session were stored as a spreadsheet (
Figure 5). The green cells are the condition data, and the yellow cells are the intervention data. The deterioration pattern written in the column headers followed the rules in the
Illustrated glossary on stone deterioration patterns [
35].
This spreadsheet was used to give each identifier to each model unit in the algorithm modeling session. It was also used to import metadata into the graph database and to check the IFC model in the delivery session.
The data in this repository were manually collected and managed. All cells were formatted in text and could be queried in the graph database.
The analysis of the metadata repository is shown in
Table 2.
Before modeling, the initial data, i.e., the investigation photo, engineering drawing, and point cloud, were stored on the cloud server. The photo was reorganized according to architectural typology, thus easy to retrieve. The engineering drawing was imported to Rhino for profile curve extraction. The point cloud was processed to be clear for observation, then converted into a mesh model to reduce the file size; its shape was used to correct the possible errors caused by the engineering drawing. Since the mesh model was only used for shape correction, it could be simplified as much as possible (500 MB in this case). The point cloud represents the real-world roof, which is irregular resulting from the displacement of the wooden carpentry system. Finally, all of the profile curves of the roof were readjusted to match the outline of the wood roofing base to avoid collision.
2.2. Algorithm Modeling
The algorithm modeling technique is practicable for documenting and simulating the rebuild process. To avoid mistakes in manual operation, the whole process was auto-generated.
Five sample tiles were measured as prototype tiles, which were also the minimum model unit to build the block instance (
Figure 6).
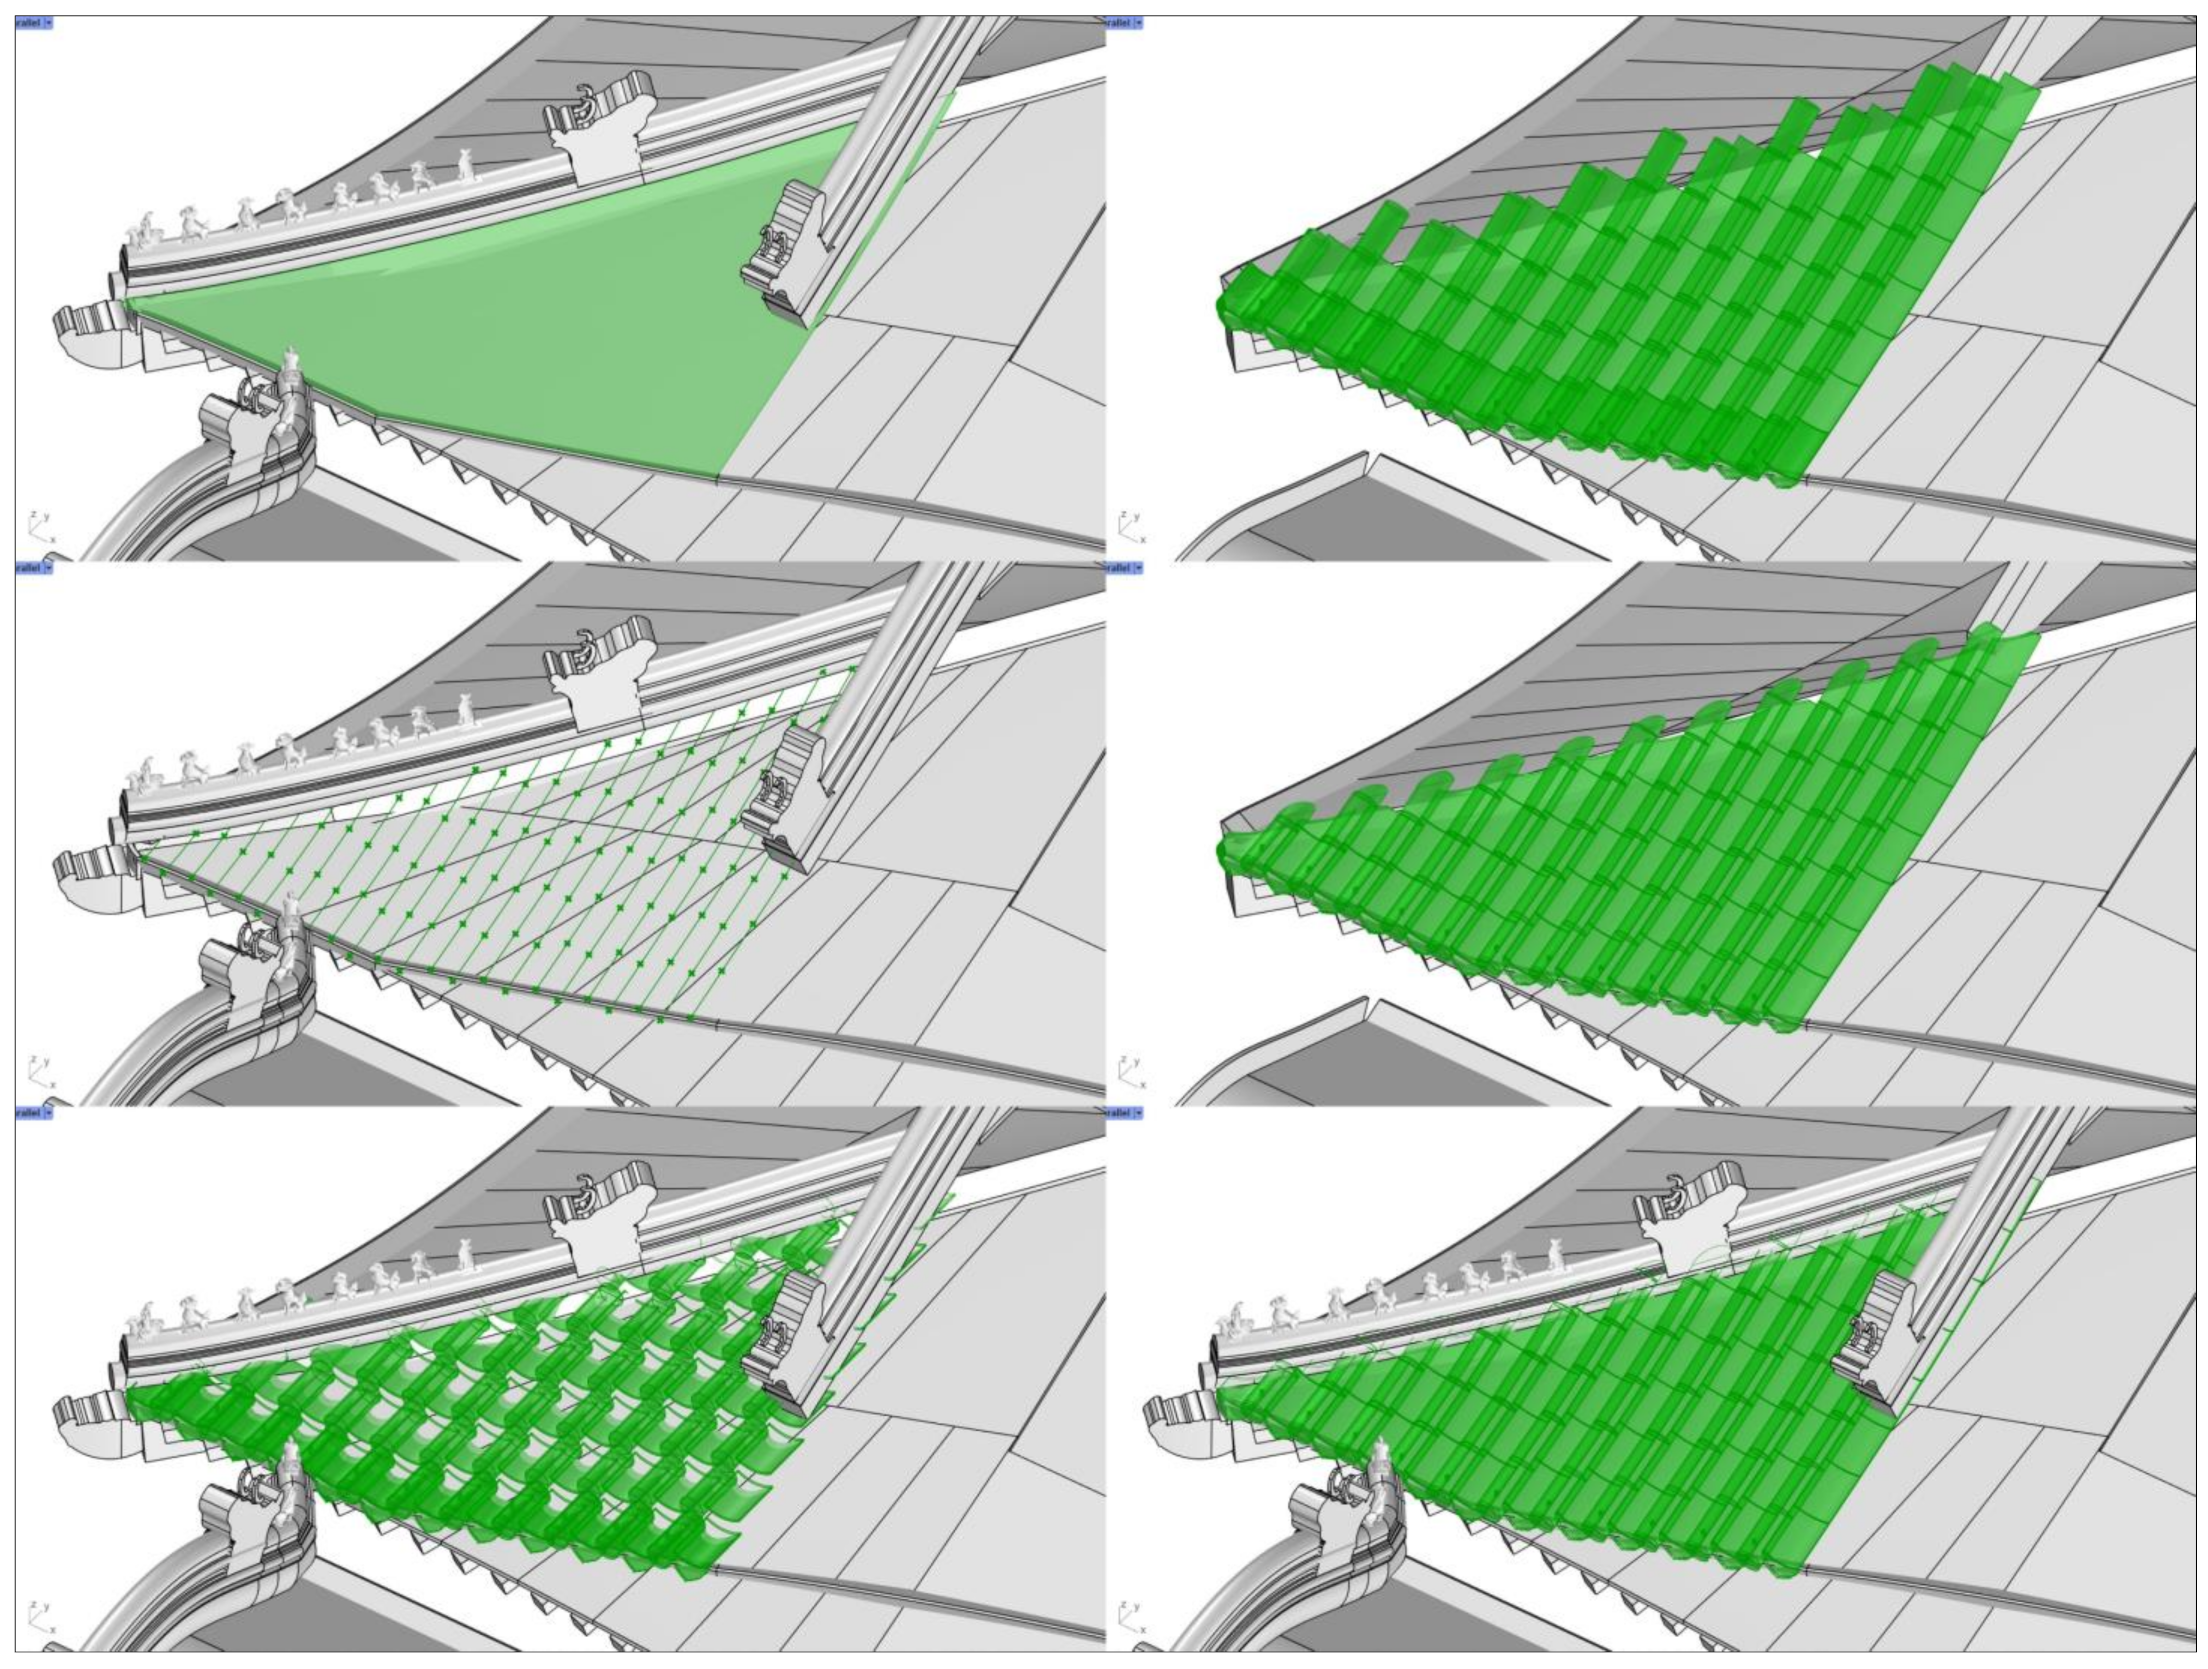
Based on the point cloud, the profile curve of the roof was manually drawn in Rhino. Importing these curves to Grasshopper, the algorithm cluster autoprocessed in the following steps (
Figure 7):
Rebuild the irregular double-curved surface, using the Network Surface battery;
Obtain the profile curve on the surface for the tile row, using the Brep|Plane intersect battery;
Divide the profile curve by length, and output the anchor point, which was 350 mm in this case, and also the length of each model unit, using the Divide Distance battery;
Evaluate the surface to output the surface normal at the anchor points, using the Evaluate Surface battery;
Use the Move battery to move the correspondence block instance of each tile to their anchor points (divide points of profile curves); each cover tile was next to one under tile following the level of investigation rather than the two under tiles in reality;
Use the Rotate battery to rotate each tile in three planes (XY, XZ, YZ), respectively; the origin of the plane was the anchor point, and the angle (in radians) of the rotation was calculated by the surface normal and the X, Y, Z vector;
Explode the last tile of each row from block instance to polysurface, and cut it to fit the onsite processing technique, using the VisualARQ Explode and the Solid Difference Battery.
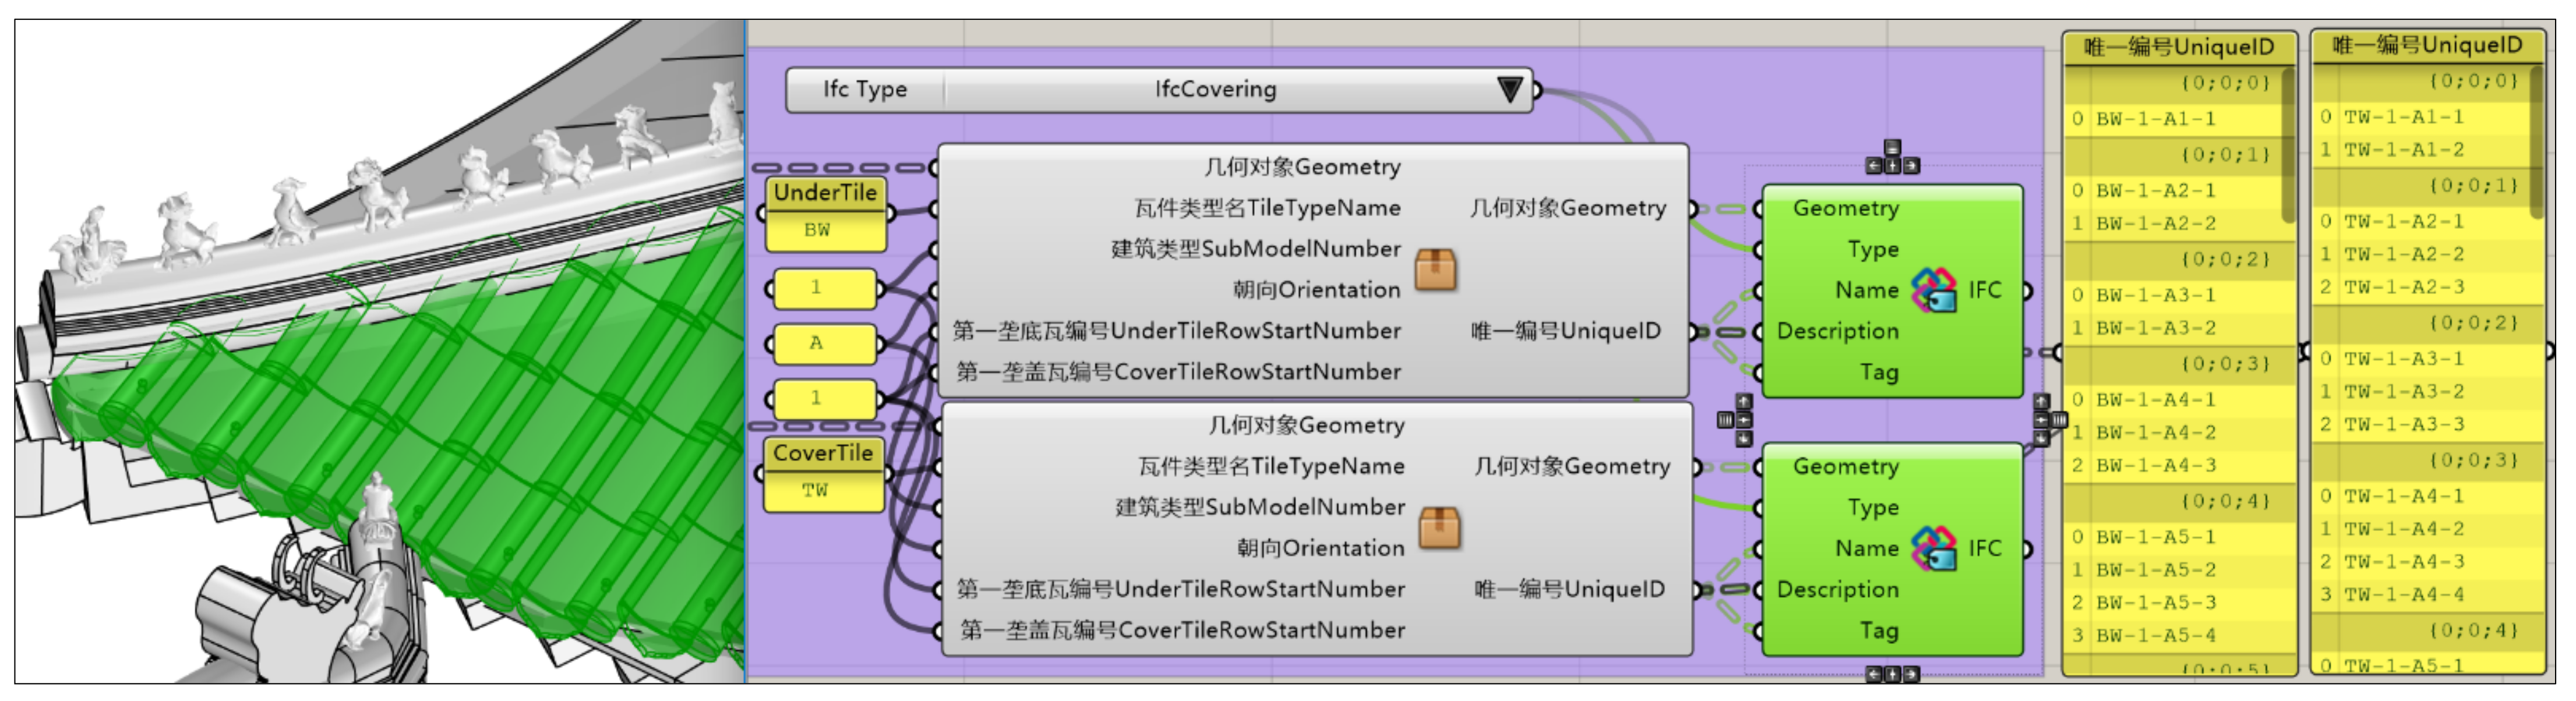
Using the block instance to rebuild the roof successfully reduced the size of the 3 dm file to 87.4 MB, with 17,154 units (16,135 block instances and 1019 polysurfaces). Before baking to Rhino, all tiles were given identifiers by the algorithm cluster (
Figure 8 and
Figure 9).
The algorithm clusters (M2 metalevel), which generated the IFC models (M1 metalevel) and Cypher clauses (M2 metalevel), embodied data and model as the metamodel repository for the synergy.
The metadata repository (
Figure 5) was imported to the graph database following Cypher syntax (
Table 3):
Each condition and intervention was created as the node; the relationships were created to show the condition and intervention of each tile. The whole process finished in one second.
Through the query in the graph database, the identifier, condition, intervention, and property could be visually presented. If the tile had conditions and interventions, the relationship between them was created automatically through the Cypher in
Table 3.
2.3. Delivery
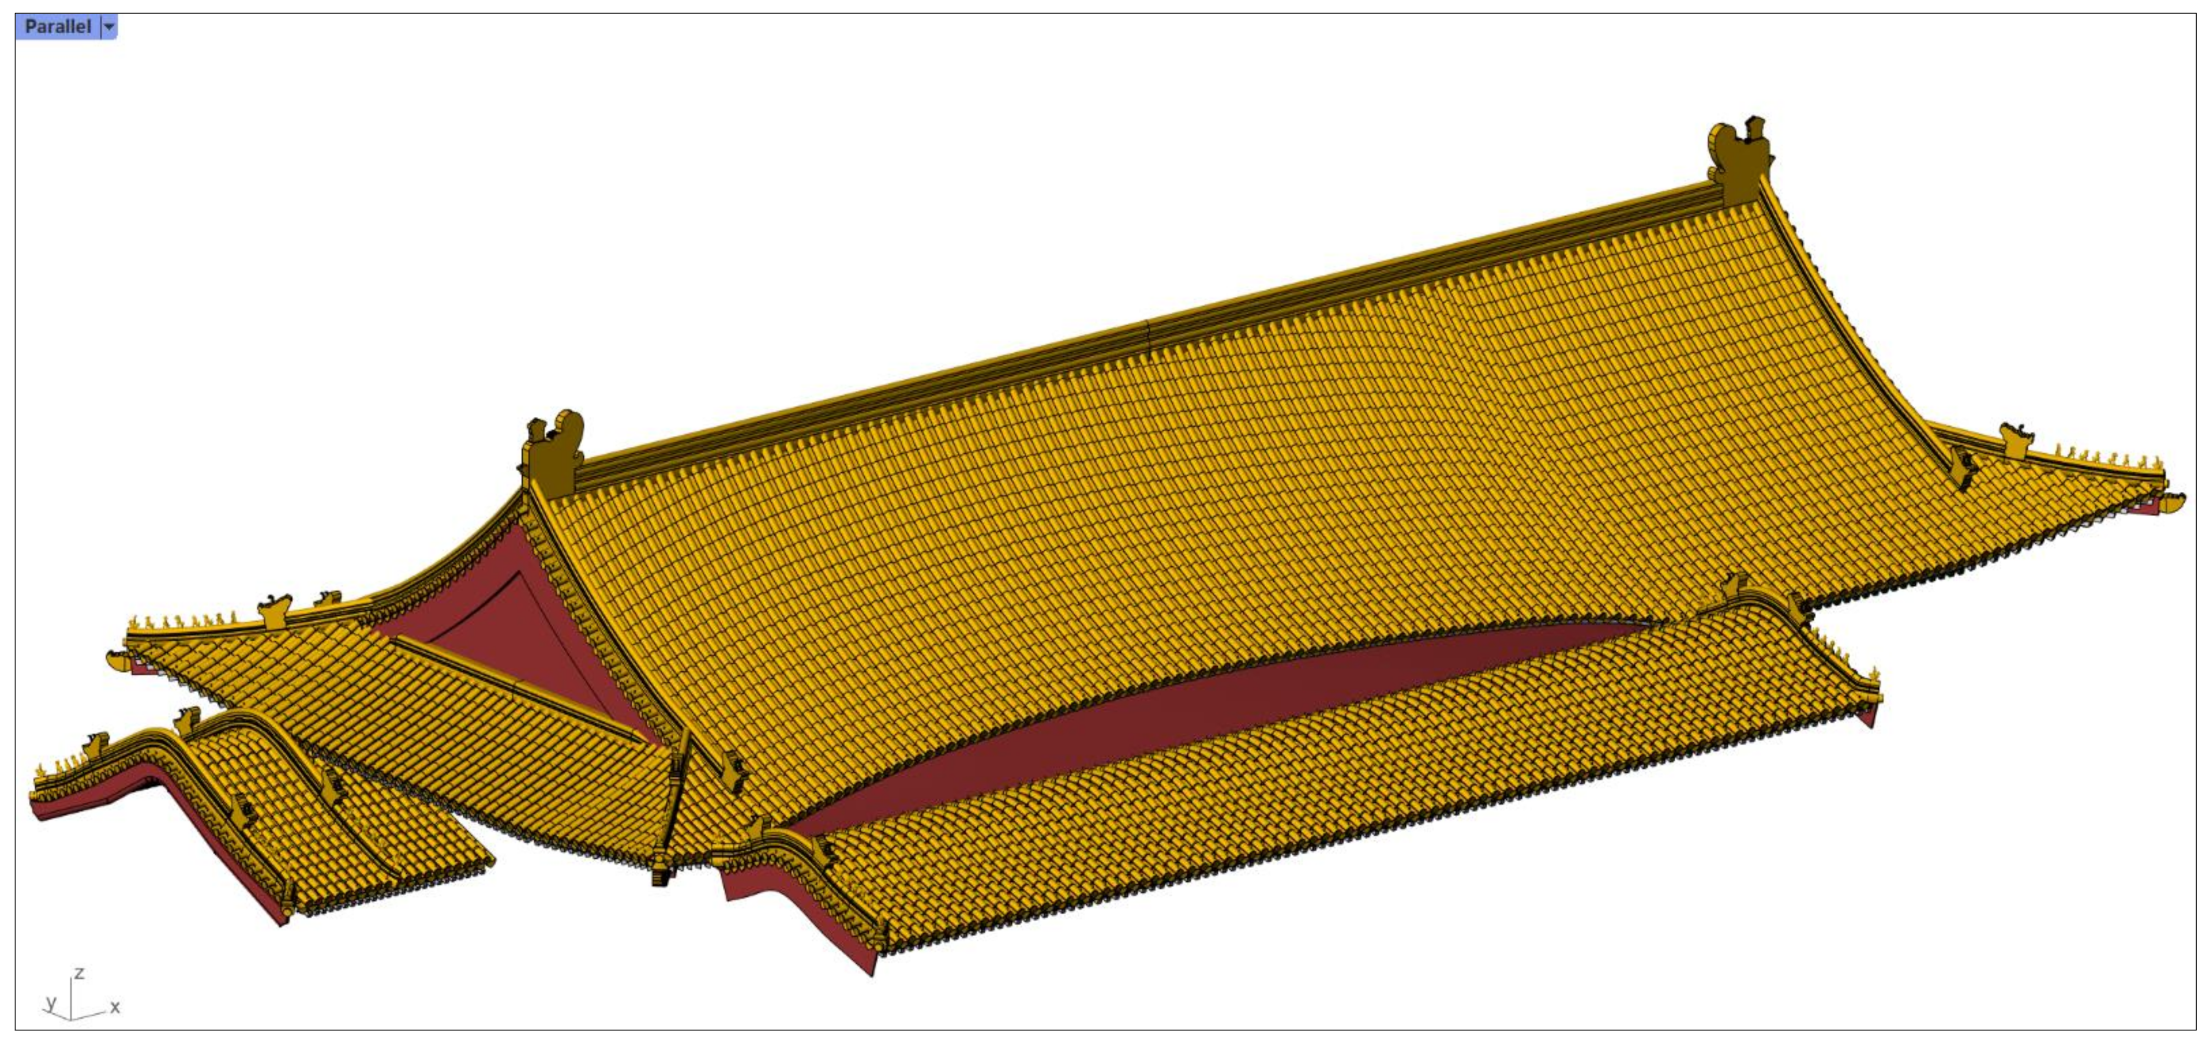
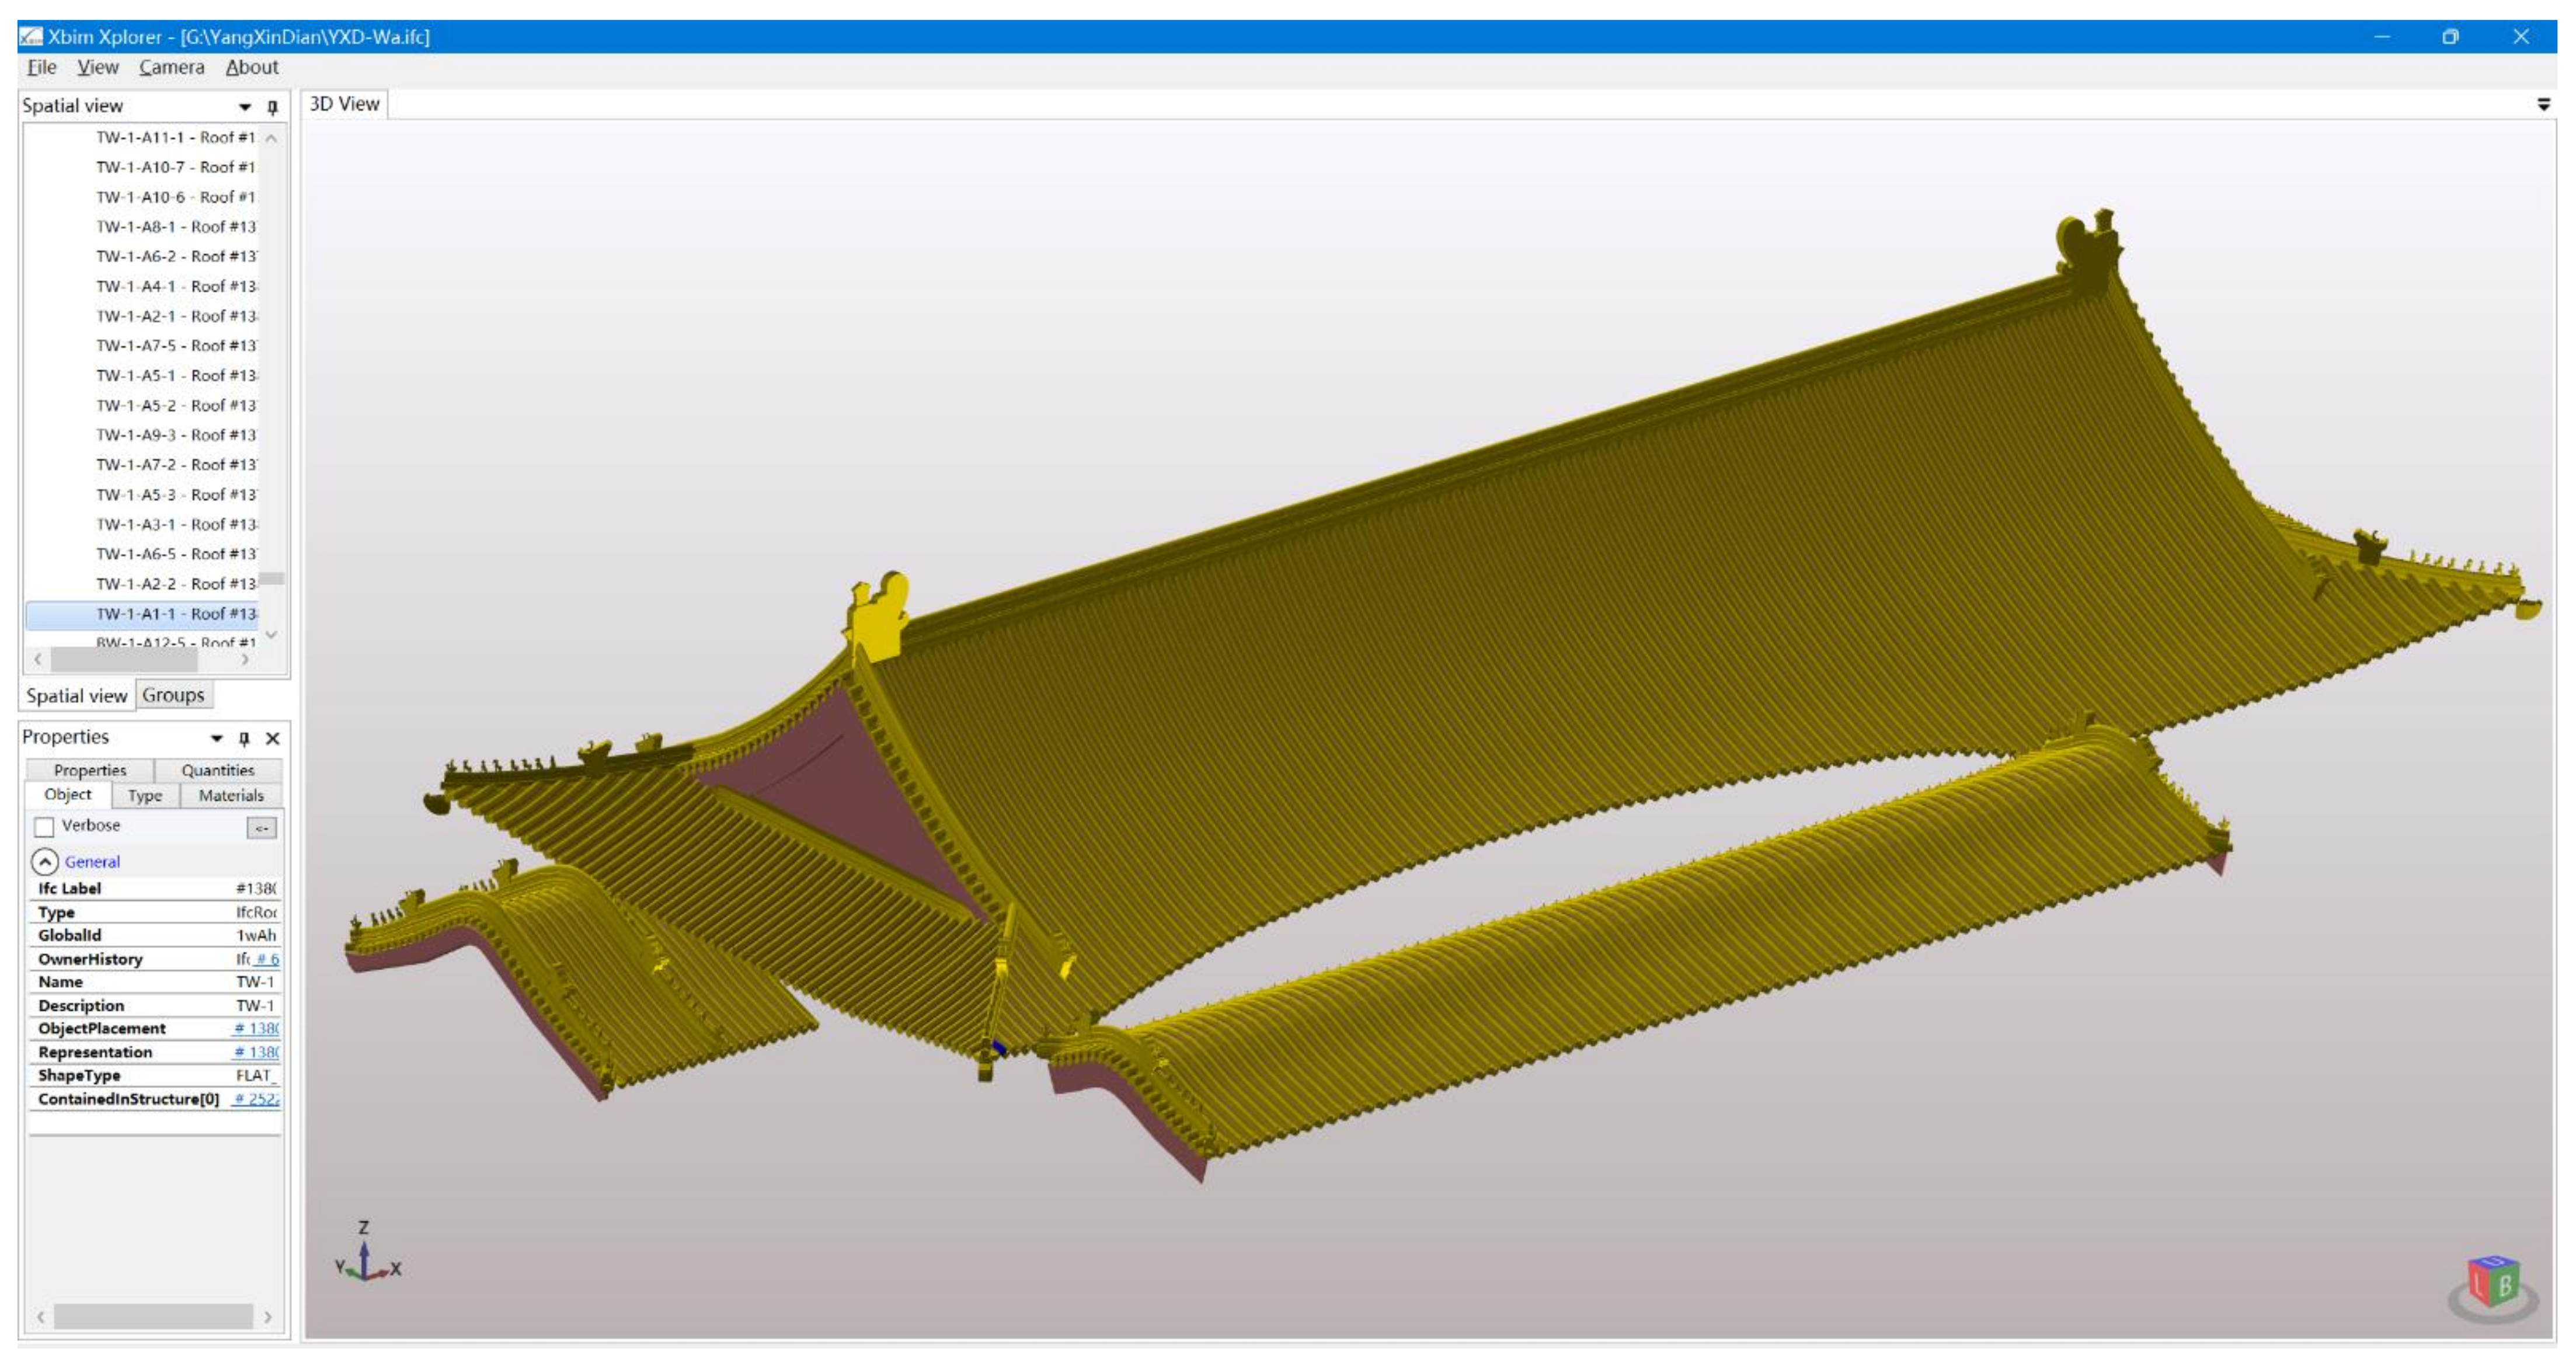
All three roofs’ tiles were generated with identifiers area by area; then materials were added by layer. The IFC model was exported by VisualARQ, a plugin of Rhino, with materials. The total number of IFC objects was 25,903, and the size of the IFC file was 113 MB (
Figure 10).
The most complex parts were the connection parts, which were the connection between Yangxindian hall and Baosha hall and the connection between Yangxindian hall and Meiwu hall. The comparison between the real-world ontology and its digital twin is shown in
Figure 11.
The graph database was built by Cypher, which was generated in Grasshopper and then exported to spreadsheets (
Table 3), using the ‘MATCH p = ()--() RETURN p’ clause to show 2045 nodes (including 2015 nodes of tiles and 30 nodes of conditions and interventions) and 8762 relationships (
Figure 12).
3. Results
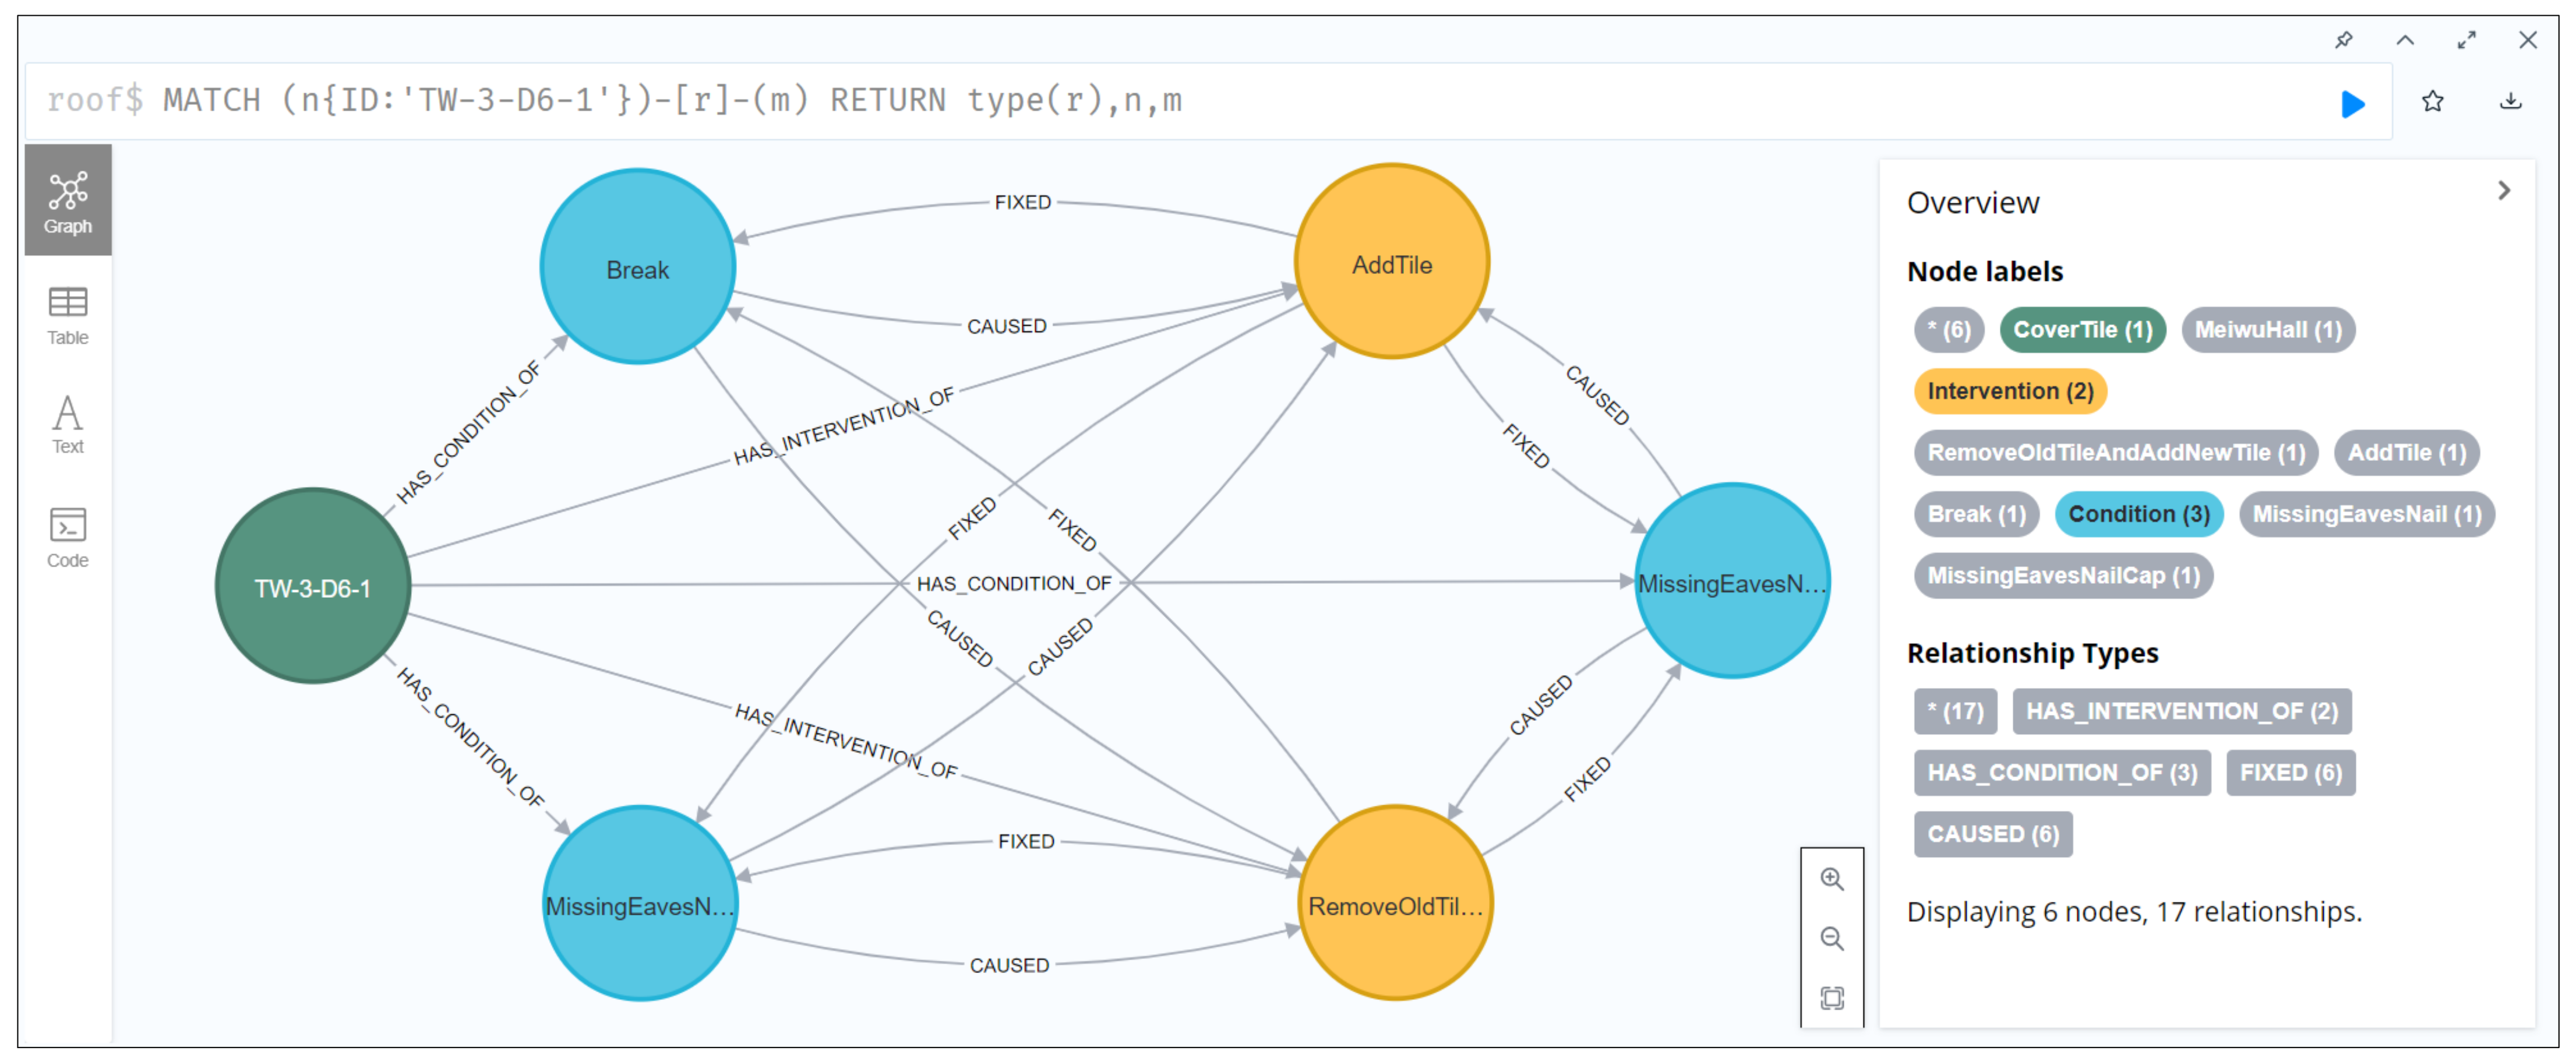
After the graph database was built, the semantic relationships of conditions and interventions could be queried. For example, the under tile named ‘TW-3-D6-1′, which belongs to ‘Meiwu hall’, has 3 conditions and 2 interventions. The relationship could be queried and illustrated in
Figure 13.
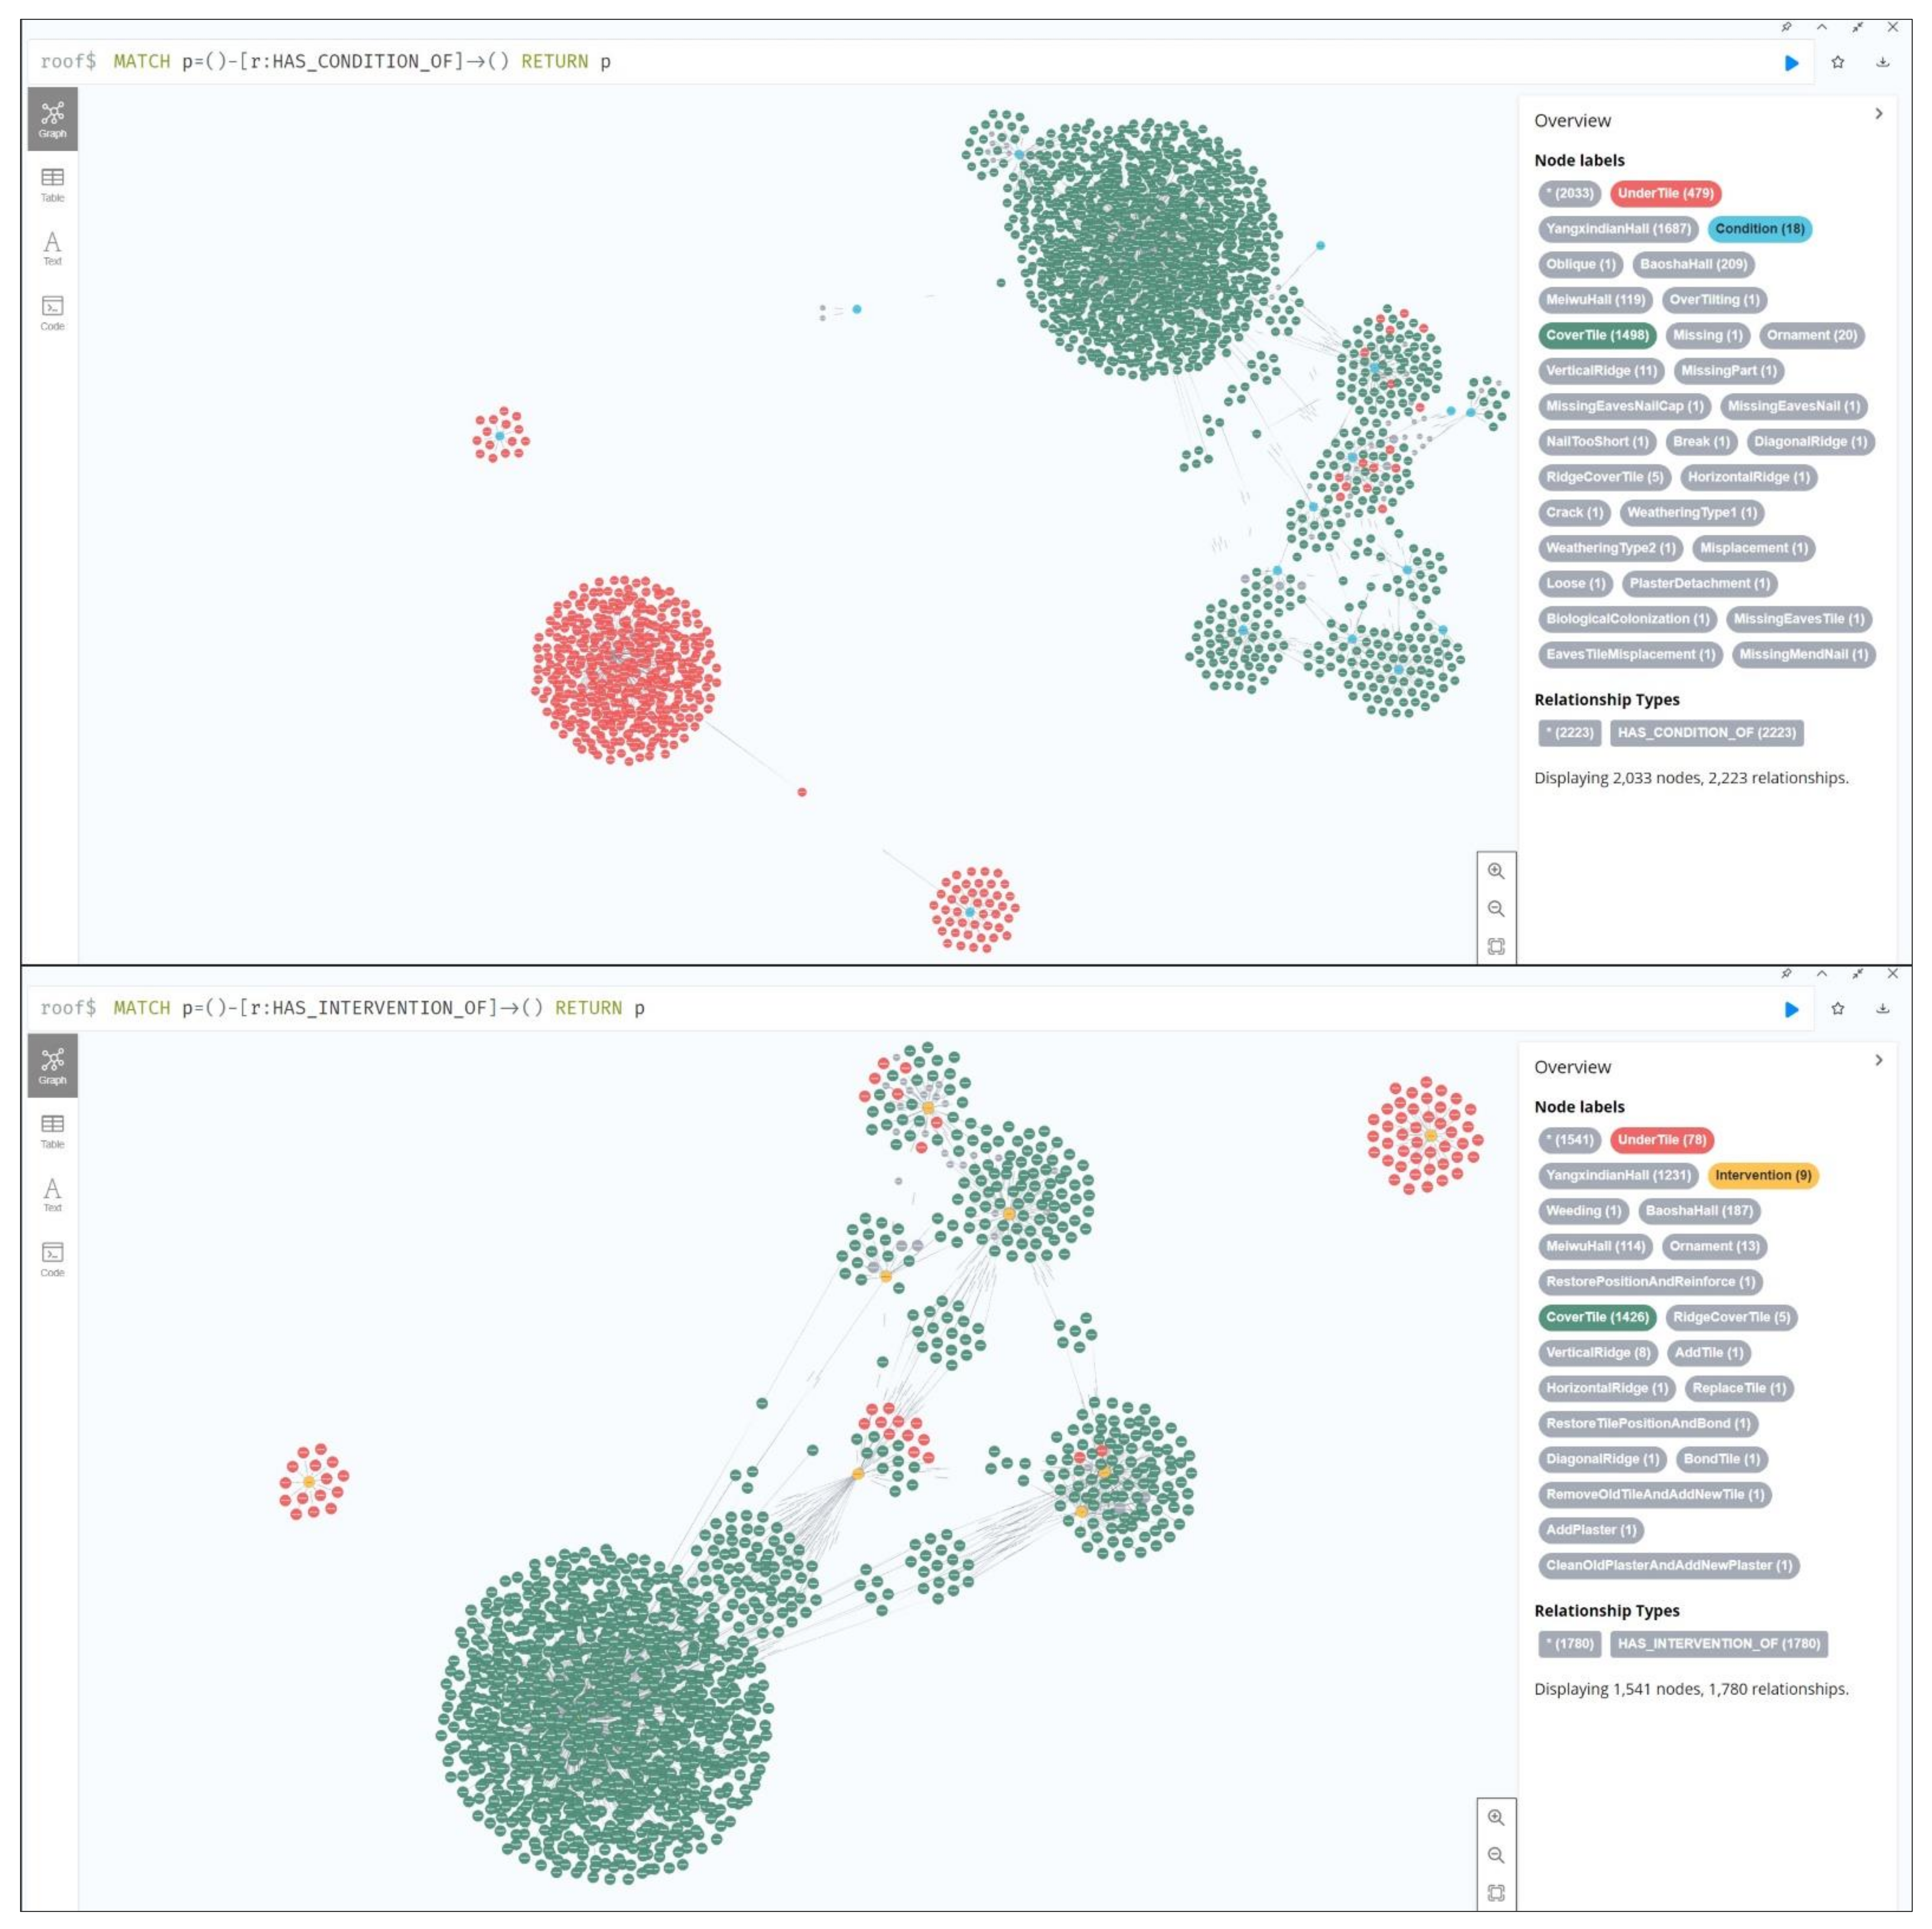
All tiles had 2223 conditions in total, and 1780 interventions were applied.
Among 2223 conditions, 1498 were documented to the cover tile, while only 479 were documented to the under tile.
Among 1780 interventions, 1426 were applied to the cover tile, while only 78 were applied to the under tile (
Figure 14).
There were obvious differences in conditions between the under tile and the cover tile. Most of the cover tiles had the condition of ‘plaster detachment’, while most of the under tiles had the condition of ‘oblique’.
Consequently, there were also differences in interventions between the under tile and the cover tile. Most of the interventions were applied to the cover tile. Because the under tile is covered by the cover tile, it is unavailable for operation without moving the cover tile.
Most of the cover tiles had the intervention of ‘add tile, replace tile, and bond tile’. Most of the under tiles had the intervention of ‘add plaster’.
This synergy approach generated the IFC model with its graph database. Both of them were associated with identifiers. The approach was developed on Grasshopper and Neo4j.
The shapes of the roofs in Yangxindian Palace are irregular double-curved surfaces. The algorithm cluster, as the metamodel repository of the M3 or M2 metalevel, stores most of the data used for information modeling and can flexibly export any required data. The spreadsheet, as the metadata repository of M2 metalevel, stores most of the data collected before modeling and the generated data while modeling.
4. Discussion
The establishment of a graph database was just the beginning. The application scenarios include online and offline. Different participants can query, browse, and analyze through this integrated database. For example, the metadata could be matched in the graph database; then, the corresponding model instance could be visually presented in the IFC browser or any other BIM management tools, such as Navisworks.
The graph database provides a solution to complement the HBIM for knowledge management. Future works will focus on the application of the graph database, the comprehensive investigation, and further improvement of rules, etc.
5. Conclusions
The proposed synergy approach was developed for cultural heritage conservation but is also applicable to other disciplines and for educational purposes.
Training new students to learn modeling techniques is time-consuming and unsustainable because they will graduate. Consequently, a practicable workflow for both modeling and data collecting is essential, which could shorten the training time and reduce errors caused by manual operation.
The separation of metadata and metamodel meets the requirement. This dual-track system provides convenience for participants from different disciplines.
Since investigating the condition and intervention accumulates a large amount of data, it is more efficient for the data collection group to focus on data reorganization and repository management. This process is manually operated.
The modeling group only has to focus on how to link the data and model. The algorithm cluster as the metamodel repository provides a repeatable and traceable method for HBIM modeling. The graph database provides an efficient method for knowledge association, query, and graphical illustration. The synergy of metadata and metamodel, therefore, has been established on the graph database by the linkage of the identifier.
It should be noted that the data migration is one-directional, from high metalevel to low metalevel. In the M3 or M2 metalevel, the metadata and metamodel are more integrated; while in the M1 metalevel, they are less integrated. The algorithm cluster enables customized input and output, suitable for developing tools.
The knowledge graph presents a clear overview of the whole project.
Migrating data and models from the M3 or M2 metalevel to the M1 metalevel has been proved to be practicable. Applying the algorithm modeling techniques to other cross-platforms is still an open topic to be tackled.
Author Contributions
Conceptualization, X.W. and C.W.; Funding acquisition, C.W.; Investigation, X.W., C.W., Y.L. and M.T.; Methodology, X.W. and C.W.; Project administration, C.W.; Resources, C.W.; Software, X.W.; Validation, X.W.; Visualization, X.W.; Writing—original draft preparation, X.W.; Writing—review and editing, X.W. and C.W. All authors have read and agreed to the published version of the manuscript.
Funding
This research was funded by the National Natural Science Foundation of China (project NO. 51878440).
Institutional Review Board Statement
Not applicable.
Informed Consent Statement
Not applicable.
Data Availability Statement
The source code of the node-visible algorithm is not openly available due to the consideration of data safety. The exported IFC model is available on request from the authors.
Acknowledgments
This paper was partially supported by the following institutions: The Palace Museum, Beijing; Jiayuguan Academy of Silk Road (the Great Wall) Culture, Jiayuguan; and the Cultural Heritage Administration of Jizhou District, Tianjin.
Conflicts of Interest
The authors declare no conflict of interest.
References
- Martinelli, L.; Calcerano, F.; Gigliarelli, E. Methodology for an HBIM workflow focused on the representation of construction systems of built heritage. J. Cult. Herit. 2022, 55, 277–289. [Google Scholar] [CrossRef]
- Adami, A.; Fregonese, L.; Rosignoli, O.; Scala, B.; Taffurelli, L.; Treccani, D. Geometric survey data and historical sources interpretation for HBIM process: The case of Mantua Cathedral façade. Int. Arch. Photogramm. Remote Sens. Spat. Inf. Sci. 2019, XLII-2/W11, 29–35. [Google Scholar] [CrossRef] [Green Version]
- Conti, A.; Fiorini, L.; Massaro, R.; Santoni, C.; Tucci, G. HBIM for the preservation of a historic infrastructure: The Carlo III bridge of the Carolino Aqueduct. Appl. Geomat. 2022, 14, 41–51. [Google Scholar] [CrossRef]
- Scianna, A.; Gaglio, G.F.; la Guardia, M. HBIM data management in historical and archaeological buildings. Archeol. E Calc. 2020, 31, 231–252. [Google Scholar]
- Gao, G.; Zhang, Y.; Liu, H.; Li, Z.; Gu, M. Research on IFC model checking method based on knowledge base. J. Graph. 2019, 40, 1099–1108. [Google Scholar]
- Akanbi, T.; Zhang, J.S.; Lee, Y.C. Data-driven reverse engineering algorithm development method for developing interoperable quantity takeoff algorithms using IFC-based BIM. J. Comput. Civ. Eng. 2020, 34, 15. [Google Scholar] [CrossRef]
- Ma, C.; Molnár, B.; Benczúr, A. A semi-automatic semantic consistency-checking method for learning ontology from relational database. Information 2021, 12, 188. [Google Scholar] [CrossRef]
- Karimi, S.; Iordanova, I.; St-Onge, D. Ontology-based approach to data exchanges for robot navigation on construction sites. J. Inf. Technol. Constr. 2021, 26, 546–565. [Google Scholar] [CrossRef]
- Zedlitz, J.; Jörke, J.; Luttenberger, N. From UML to OWL 2. Knowledge TechnologyLukose, D., Ahmad, A.R., Suliman, A., Eds.; Communications in Computer and Information ScienceSpringer: Berlin/Heidelberg, Germany, 2012; Volume 295, pp. 154–163. [Google Scholar] [CrossRef]
- Al Hattab, M. The dynamic evolution of synergies between BIM and sustainability: A text mining and network theory approach. J. Build. Eng. 2021, 37, 19. [Google Scholar] [CrossRef]
- Fu, B.; Li, D.; Wang, M. Review and prospect on research of cloud model. Appl. Res. Comput. 2011, 28, 420–426. [Google Scholar]
- Hor, A.E.H.; Gunho, S.; Claudio, P.; Jadidi, M.; Afnan, A. A semantic graph database for BIM-GIS integrated information model for an intelligent urban mobility web application. Presented at the ISPRS TC IV Mid-Term Symposium on 3D Spatial Information Science—The Engine of Change, Delft, The Netherlands, 1–5 October 2018. [Google Scholar]
- Wang, H.; Zhang, Q.; Cai, W.; Jiang, Y. Research on storage method for domain ontology based on Neo4j. Appl. Res. Comput. 2017, 34, 2404–2407. [Google Scholar]
- Jiang, S.; Wu, Z. Research on cloud storage and retrieval method of BIM spatial relational data. J. Graph. 2018, 39, 835–842. [Google Scholar]
- Rinaldi, A.M.; Russo, C.; Madani, K. A semantic matching strategy for very large knowledge bases integration. Int. J. Inf. Technol. Web Eng. 2020, 15, 1. [Google Scholar] [CrossRef]
- Zhang, L.; Issa, R.R.A. Ontology-based partial building information model extraction. J. Comput. Civ. Eng. 2013, 27, 576–584. [Google Scholar] [CrossRef] [Green Version]
- Colucci, E.; Xing, X.F.; Kokla, M.; Mostafavi, M.A.; Noardo, F.; Spano, A. Ontology-based semantic conceptualisation of historical built heritage to generate parametric structured models from point clouds. Appl. Sci. 2021, 11, 2813. [Google Scholar] [CrossRef]
- Abubakar, M.; Hamdan, H.; Mustapha, N.; Aris, T.N.M. Instance-based ontology matching: A literature review. Recent Advances on Soft Computing and Data MiningGhazali, R., Deris, M., Nawi, N., Abawajy, J., Eds.; Advances in Intelligent Systems and ComputingSpringer: Cham, Switzerland, 2018; Volume 700, pp. 455–469. [Google Scholar] [CrossRef]
- Lee, P.-C.; Xie, W.; Lo, T.-P.; Long, D.; Tang, X. A cloud model-based knowledge mapping method for historic building maintenance based on building information modelling and ontology. KSCE J. Civ. Eng. 2019, 23, 3285–3296. [Google Scholar] [CrossRef]
- Croce, V.; Caroti, G.; de Luca, L.; Jacquot, K.; Piemonte, A.; Véron, P. From the semantic point cloud to Heritage-Building Information Modeling: A semiautomatic approach exploiting machine learning. Remote Sens. 2021, 13, 461. [Google Scholar] [CrossRef]
- Kim, J.I.; Koo, B.; Suh, S.; Suh, W. Integration of BIM and GIS for formal representation of walkability for safe routes to school programs. KSCE J. Civ. Eng. 2015, 20, 1669–1675. [Google Scholar] [CrossRef]
- Hor, A.H.; Jadidi, A.; Sohn, G. BIM-GIS integrated geospatial information model using semantic web and RDF graphs. ISPRS Ann. Photogramm. Remote Sens. Spat. Inf. Sci. 2016, III-4, 73–79. [Google Scholar] [CrossRef] [Green Version]
- Yang, B.; Dong, M.; Wang, C.; Liu, B.; Wang, Z.; Zhang, B. IFC-based 4D construction management information model of prefabricated buildings and its application in graph database. Appl. Sci. 2021, 11, 7270. [Google Scholar] [CrossRef]
- Hao, X.; Ji, Z.; Li, X.; Yin, L.; Liu, L.; Sun, M.; Liu, Q.; Yang, R. Construction and application of a knowledge graph. Remote Sens. 2021, 13, 2511. [Google Scholar] [CrossRef]
- Sadeghineko, F.; Kumar, B.; Chan, W. A semantic web-based approach for generating parametric models using RDF. In Advanced Computing Strategies for Engineering; Springer: Cham, Switzerland, 2018; pp. 361–377. [Google Scholar]
- Celeste, G.; Lazoi, M.; Mangia, M.; Mangialardi, G. Innovating the construction life cycle through BIM/GIS integration: A review. Sustainability 2022, 14, 766. [Google Scholar] [CrossRef]
- Xi, W.; Wu, C.; Bai, C. Generating the regular axis from irregular column grids through genetic algorithm. Appl. Sci. 2022, 12, 2109. [Google Scholar] [CrossRef]
- Calvano, M.; Martinelli, L.; Calcerano, F.; Gigliarelli, E. Parametric processes for the implementation of HBIM—Visual programming language for the digitisation of the index of masonry quality. ISPRS Int. J. Geo-Inf. 2022, 11, 93. [Google Scholar] [CrossRef]
- Wu, M.H.; Ying, J.; Yan, H. Semantic model driven architecture based method for enterprise application development. Presented at the International Conference on Web Information Systems and Mining, Shanghai, China, 7–8 November 2009. [Google Scholar]
- Zhu, Z.; Zhou, X.; Shao, K. A novel approach based on Neo4j for multi-constrained flexible job shop scheduling problem. Comput. Ind. Eng. 2019, 130, 671–686. [Google Scholar] [CrossRef]
- Tuck, D. A cancer graph: A lung cancer property graph database in Neo4j. BMC Res. Notes 2022, 15, 45. [Google Scholar] [CrossRef]
- Li, G.; Li, W. Research on storage method for fuzzy RDF graph based on Neo4j. Evol. Intell. 2022, 1–11. [Google Scholar] [CrossRef]
- Yang, H.; Xie, J.; Ji, L. The historical information of the decorative polychrome painting in the hall of mental cultivation complex, forbidden city. Built Herit. 2018, 2, 19–38. [Google Scholar] [CrossRef]
- Xi, W.; Cong, W. Remote practice methods of survey education for HBIM in the post-pandemic era: Case study of Kuiwen Pavilion in the Temple of Confucius (Qufu, China). Appl. Sci. 2022, 12, 708. [Google Scholar] [CrossRef]
- Bromblet, P.; Vallet, J.M.; Verges-Belmin, V. Illustrated glossary on stone deterioration patterns. Monum. Sites 2008, 3. [Google Scholar]
| Publisher’s Note: MDPI stays neutral with regard to jurisdictional claims in published maps and institutional affiliations. |
© 2022 by the authors. Licensee MDPI, Basel, Switzerland. This article is an open access article distributed under the terms and conditions of the Creative Commons Attribution (CC BY) license (https://creativecommons.org/licenses/by/4.0/).


