Article

Time-Dependent Reliability Assessment Method for RC Simply Supported T-Beam Bridges Based on Lateral Load Distribution Influenced by Reinforcement Corrosion

1
College of Transportation, Jilin University, Changchun 130025, China
2
College of Construction Engineering, Jilin University, Changchun 130025, China
3
China State Construction Railway Investment & Engineering Group Co., Ltd., Beijing 100053, China
*
Author to whom correspondence should be addressed.
Appl. Sci. 2022, 12(14), 7028; https://doi.org/10.3390/app12147028
Submission received: 31 May 2022 / Revised: 9 July 2022 / Accepted: 11 July 2022 / Published: 12 July 2022

Abstract

:
The safety and reliability of bridges gradually decrease over time under the influence of disadvantageous environmental factors, primarily due to reinforcement corrosion caused by chloride ingress. The traditional lateral load distribution (LLD) theory does not consider the influence of corrosion, which degrades the accuracy of bridge performance and reliability calculation. A time-dependent reliability assessment method for simply supported T-beam bridges is proposed in this paper, which considers the influence of reinforcement corrosion on LLD. Firstly, the steel corrosion process and degree are predicted based on the chloride ingress model, into which the water/cement ratio and concrete strength are innovatively introduced in order to improve the prediction accuracy. Secondly, the effective stiffness calculation method for corroded reinforcement bridges is established with the moment of inertia and section crack condition employed. Thirdly, the modified eccentric compression method is improved by the effective stiffness and iterative algorithm, which is suitable for the LLD calculation of corroded reinforcement bridges. The time-dependent vehicle load effect can be computed combined with the probability distribution of live load. Finally, the time-dependent reliability of the flexural bearing capacity is obtained by the Monte Carlo method and Bayesian theory without prior information. A simply supported bridge with five T-beams is taken as an example for analysis. It is indicated that the results calculated by the traditional reliability method are conservative, which cannot make a true and accurate evaluation. The method proposed in this paper can effectively reduce the assessment error caused by model uncertainty while considering the interaction between reinforcement corrosion and vehicle live load effect.

1. Introduction

As a key hub of the transportation network, bridges play an essential role in social and economic development. Among them, simply supported T-beam bridges have been widely used owing to their advantages of low construction cost and simple construction. Additionally, they have a typical beam-grid structure. This kind of bridge has a simple structure for theoretical analysis [1,2,3]. However, simply supported T-beam bridges are inevitably influenced by disadvantageous environmental and vehicle load factors during their service life. Reinforcement corrosion caused by chloride erosion is one of the main degeneration types [4,5] that can reduce the vertical and horizontal load-bearing and seismic capacity of bridges under service conditions [6,7]. The bearing capacity and stiffness of T-beams severely decrease with the increase in reinforcement corrosion degree, which poses a serious threat to the safety of people’s property and normal traffic [8]. Therefore, it is of great significance for research on bridge maintenance strategies and guaranteeing normal traffic to improve the accuracy of the bridge degradation prediction model and reliability assessment. Special attention is focused on the reliability assessment of corroded reinforcement bridges considering bridge inspection, which is an essential part of civil infrastructure maintenance.
The oxidation/reduction reaction caused by environmental chloride erosion is a mechanism of reinforcement corrosion [9]. With the development of research on this topic, the chloride diffusion model based on Fick’s second law has been modified and verified according to the study of laboratory-accelerated and field tests [10,11]. Using electrochemical techniques, the influence of reinforcement microstructure on corrosion behavior was analyzed [12]. Reinforcement steel corrosion not only leads to steel quality loss and section area reduction but also reduces the reinforcement strength and the bond strength between concrete and reinforcement steel, which further results in the reduction of bearing capacity [13,14].
Combined with the analysis of shrinkage, creep, and deterioration of concrete, the adverse effects of steel corrosion and structural deterioration on the reliability of simply supported bridges were clarified [15,16,17]. Furthermore, the time-dependent bearing capacity was predicted based on the degradation model, which considered reinforcement corrosion, concrete, and structural deterioration as the main influencing factors [18]. In addition, time-dependent reliability and life prediction methodologies for bridge components and systems were developed by considering the uncertainties of environmental factors and geometric dimensions [19,20,21]. The seismic performance assessment of corroded reinforcement bridges was analyzed by the finite-element model and nonlinear material model [22]. A time-dependent sensitivity analysis was adopted to evaluate the chloride ingress model and bridge performance [23]. Accurate evaluation of bridge state was achieved by analyzing bridge safety and serviceability reliability of bending resistance, shear resistance, and deformation. Hajkova et al. predicted reinforcement corrosion caused by chloride ingress and analyzed the effect of corrosion on bridge serviceability [24]. However, the above studies only focused on the relationship between performance degradation and bridge reliability without considering the influence of structural deterioration on vehicle load effect. Utilizing the weigh-in-motion system, a reliability calculation method with LLD, number of lanes, and vehicle axle load was proposed [25,26,27]. The maintenance strategy can be drawn up with time-dependent reliability, which is improved by the influence of structural resistance and load on reliability [28]. However, reinforcement corrosion of aging simply supported T-beam bridges not only results in bridge resistance reduction but also changes the load-bearing effect of each beam. Consequently, the above works are no longer suitable for the reliability evaluation of existing simply supported T-beam bridges.
Reinforcement steel corrosion can also cause stiffness changes in bridges. Moreover, load action is mainly calculated by the modified eccentric compression method, with stiffness as one of the main parameters. Balim and Malumbela et al. analyzed the relationship between steel corrosion degree and deflection and strain of bridges using laboratory-accelerated and static load tests. The results demonstrated that both structural resistance and stiffness would decrease when steel corrosion occurred [29,30]. Li et al. proved that reinforcement corrosion increased the vulnerability of bridges while reducing stiffness [31]. Based on accelerated and fatigue load testing, Sun et al. studied the flexural stiffness of a corroded beam under repeated loading [32]. It was found that if quantization between reinforcement corrosion and structural stiffness is established, it will be effective for the accurate reliability analysis of simply supported T-beam bridges considering the effect of steel corrosion on LLD. The American Concrete Association put forward the product of the elastic modulus of concrete and the effective moment of inertia to calculate the flexural stiffness of cracked concrete structures [33]. Based on the flexural mechanical experimental study of corroded reinforced concrete bridges, a modified model of structural stiffness was obtained by regression analysis [34]. On this basis, experimental results can be deeply excavated to obtain the LLD coefficient calculation method under the condition of steel corrosion, which improves the accuracy of load action analysis.
In practical engineering, the corrosion process is accelerated under the action of vehicle load, which further aggravates the decrease in bridge stiffness [35]. When the stiffness of a simply supported T-beam bridge decreases, it will affect the reinforcement corrosion process with the load action redistributed. Hence, an iterative algorithm can be employed to deal with the interaction between vehicle load, chloride erosion process, and reinforcement corrosion. The chloride erosion process is directly related to the water/cement ratio of concrete [36]. In the Chinese concrete design code [37], the formula between water/cement ratio and concrete strength is proposed. Thus, the water/cement ratio computed by the measured data can be integrated into the iterative process mentioned above, which greatly improves the accuracy of bridge reliability analysis.
Mid- and small-span bridges account for the largest proportion of the existing bridge structure system, among which simply supported T-beam bridges are widely used due to their reasonable structure, convenient construction, and economical efficiency. However, the variation of LLD caused by reinforcement corrosion has a great adverse influence on the reliability of simply supported T-beam bridges. To overcome this drawback, a reliability analysis method is established considering the variation of structural resistance and LLD influenced by reinforcement corrosion. In this paper, a calculation method for corrosion rate and degree of reinforcement is proposed based on the measured data of concrete strength and concrete cover thickness. Consequently, reinforcement corrosion analysis is improved by the proposed method, in which the relationship between reinforcement corrosion and water/cement ratio is innovatively derived by inspections of concrete strength. The LLD theory considering the effect of reinforcement corrosion is formed using a modified eccentric compression method and an iterative algorithm, of which the parameters are updated by Bayesian theory without prior information. Considering the influence of reinforcement corrosion on the LLD theory, the modified eccentric compression method is optimized by effective stiffness. This provides an effective method for the vehicle effect calculation of corroded reinforcement bridges. The performance function of the bearing capacity is constructed by the time-dependent structural resistance and vehicle load action model, which is adopted for the reliability analysis. On this basis, a time-dependent reliability evaluation method for corroded reinforcement bridges is established, which improves the accuracy of bridge condition assessment.

2. Reinforcement Steel Corrosion Model

The study of the reinforcement corrosion model is mainly based on Fick’s second law, which can effectively simulate the diffusion process of chloride. In order to accurately analyze reinforcement corrosion, concrete strength is introduced into the reinforcement corrosion model by the relationship between concrete strength and water/cement ratio. The reinforcement corrosion model is calculated and improved based on the inspection data of concrete strength and concrete cover thickness. The reinforcement corrosion rate is evaluated by the residual area of corroded reinforcement steel, which is defined as uniform corrosion and pit corrosion of reinforcement based on the proposed model. The effective stiffness is put forward considering the influence of crack caused by reinforcement corrosion and external load so that the proposed reinforcement corrosion model can be used for the stiffness degradation of corroded reinforcement bridges.

2.1. Corrosion Time and Rate of Reinforcement

Existing research results show that chloride erosion is the main cause of reinforcement corrosion. The initial corrosion of reinforcement is marked by a critical chloride concentration on the surface of the reinforcement. Additionally, the diffusion process of chloride conforms to Fick’s second diffusion law. It can be concluded that the initial time T i of reinforcement corrosion can be expressed as follows:
T i = C 2 D C e r f C 0 C c r C 0 2 ,
where e r f is the error function; C is the concrete cover thickness; D C is the chloride diffusion coefficient; C c r is the critical chloride concentration; C 0 is the mass concentration of chloride on the concrete surface; C , D C , C c r , and C 0 are all random variables; the probability distribution types and characteristic parameters of such variables can be obtained by experimental and theoretical model calculation [13,38]; and the initial corrosion time of reinforcement T i is also a random variable according to Equation (1).
The corrosion of reinforcement is an electrochemical reaction process, and there is a quantitative relationship between the corrosion rate of reinforcement and the corrosion current density at time t. Stewart provided calculation equations of the corrosion current density and corrosion rate of reinforcement at time t after the beginning of corrosion [39,40], which can be expressed as:
i c t = i c 0 × 0.85 t T i 0.29 ,
r ( t ) = 0.0116 i c t ,
where i c 0 is the current density at the initiation of reinforcement corrosion, expressed as i c 0 = 37.8 1 w / c 1.64 / C , which is related to water/cement ratio w/c and concrete cover thickness C. As the water/cement ratio of bridge concrete is difficult to be directly obtained by experimental methods, the relationship between the water/cement ratio and strength of structural concrete in the specification for mix proportion design of ordinary concrete in China is innovatively introduced in this paper [37], and the water/cement ratio of concrete can be indirectly calculated by Equation (4),
w / c = α a f b f c u , k + α a α b f b ,
where f c u , k is measured compressive strength of concrete; f b is the 28d compressive strength of cement mortar, and the value is 32.5 MPa; and α a and α b are regression coefficients, which are adopted as 0.53 and 0.2, respectively, in this paper.
By substituting Equation (4) into Equation (3), the relationship between the corrosion rate of reinforcement, the concrete strength, and the concrete cover thickness can be obtained, which is expressed as:
r ( t ) = 0.3727 f c u , k + 3.445 f c u , k 13.78 1.64 t T i 0.29 C .
Equation (5), used to calculate the corrosion rate, is derived based on Equation (2) to Equation (4). Reinforcement corrosion is related to chloride diffusion, and concrete strength and concrete cover thickness are essential influencing factors for chloride diffusion. The corrosion rate decreases with the concrete strength and concrete cover thickness increasing [39].

2.2. Degree of Reinforcement Corrosion

Generally, the reinforcement corrosion degree is described by the mass loss rate of reinforcement or the cross-sectional area loss rate, and the latter is used to represent the reinforcement corrosion degree in this paper, as shown in Equation (6):
ρ t = A s t A 0 × 100 % ,
where A s t is the residual cross-sectional area of generally corroded reinforcement at time t, and A 0 is the cross-sectional area of reinforcement before corrosion.
Reinforcement corrosion can be divided into uniform corrosion and pit corrosion according to the shape types of reinforcement section corrosion. The residual diameter of uniformly corroded reinforcement at time t can be obtained by Equation (7):
D u t = D 0 2 T i t r t d t .
Thus, the remaining cross-sectional area of uniform corrosion of reinforcement is:
A u t = π D u t 2 4 = π 4 D 0 1.0499 f c u , k + 3.445 f c u , k 13.78 1.64 t T i 0.71 C 2 .
The corrosion depth of pit corrosion of reinforcement is presented as [34]:
p t = R T i t r t d t = 2.2362 f c u , k + 3.445 f c u , k 13.78 1.64 t T i 0.71 C ,
where R is the nonuniformity coefficient of pit corrosion, whose value range is [4, 6], and it is adopted as 6 in this paper.
The residual cross-sectional area of pit corrosion of reinforcement is expressed as [40]:
A p ( t ) = π D 0 2 / 4 A 1 A 2   p ( t ) D 0 / 2 A 1 A 2   D 0 / 2 < p ( t ) < D 0 0   p ( t ) D 0 ,
where A 1 and A 2 are auxiliary surfaces A 1 = 1 2 θ 1 D 0 2 2 b ( t ) D 0 2 p ( t ) 2 D 0 , and A 2 = 1 2 θ 2 p ( t ) 2 b ( t ) p ( t ) 2 D 0 ; θ 1 and θ 2 are auxiliary angles θ 1 = 2 arcsin b ( t ) D 0 and θ 2 = 2 arcsin b ( t ) 2 p ( t ) ; and b ( t ) = 2 p ( t ) 1 p ( t ) D 0 2 .
Reinforced concrete bridges generally have two forms of corrosion simultaneously in practical engineering. Therefore, the residual cross-sectional area of reinforcement under general corrosion conditions is
A s t = A u t + A p t π D 0 2 / 4 .

2.3. Flexural Stiffness of Bridge with Corroded Reinforcement

Concrete cracking caused by reinforcement corrosion and external load will lead to bridge stiffness degradation. The American Concrete Institute uses the product of concrete elastic modulus and effective bending moment of inertia to calculate the bending stiffness of cracked bridges [33], where the effective bending moment of inertia is shown in Equation (12):
I e = M c r M a 3 I g + 1 M c r M a 3 I c r ,
where I e is the effective bending moment of inertia, I g is the bending moment of inertia of the intact bridge section and I c r is the bending moment of inertia of the cracked bridge section, M a is the maximum bending moment, and M c r is the cracking moment, which can be deduced as Equation (13):
M c r = f r I g y t ,
where f r is the fracture modulus of concrete, and y t is the distance from the neutral axis of an intact section to its outer edge.
The bending stiffness of the bridge is also affected by many factors such as the cross-sectional area reduction of reinforcement and the degradation of bond performance when the reinforcement is corroded. Based on the research of Equation (12) in this paper, the correction coefficient as shown in Equation (14) is proposed to comprehensively characterize the influence of various adverse factors caused by reinforcement corrosion on bridge stiffness.
I c e = γ ρ I e ,
where I c e is the effective bending moment of inertia of the bridge after reinforcement corrosion, γ ρ is the correction coefficient, and ρ is the corrosion rate of reinforcement. The relationship between the correction coefficient and the corrosion rate of reinforcement is shown in Equation (15) based on the experimental results of flexural mechanical properties of 48 corroded beams [34].
γ ρ = 1 1.22 + 12.88 ρ 2 5.05 ρ ρ 0.05 ρ > 0.05 .

3. Load Effect Calculation Method of Corroded Reinforcement Bridges

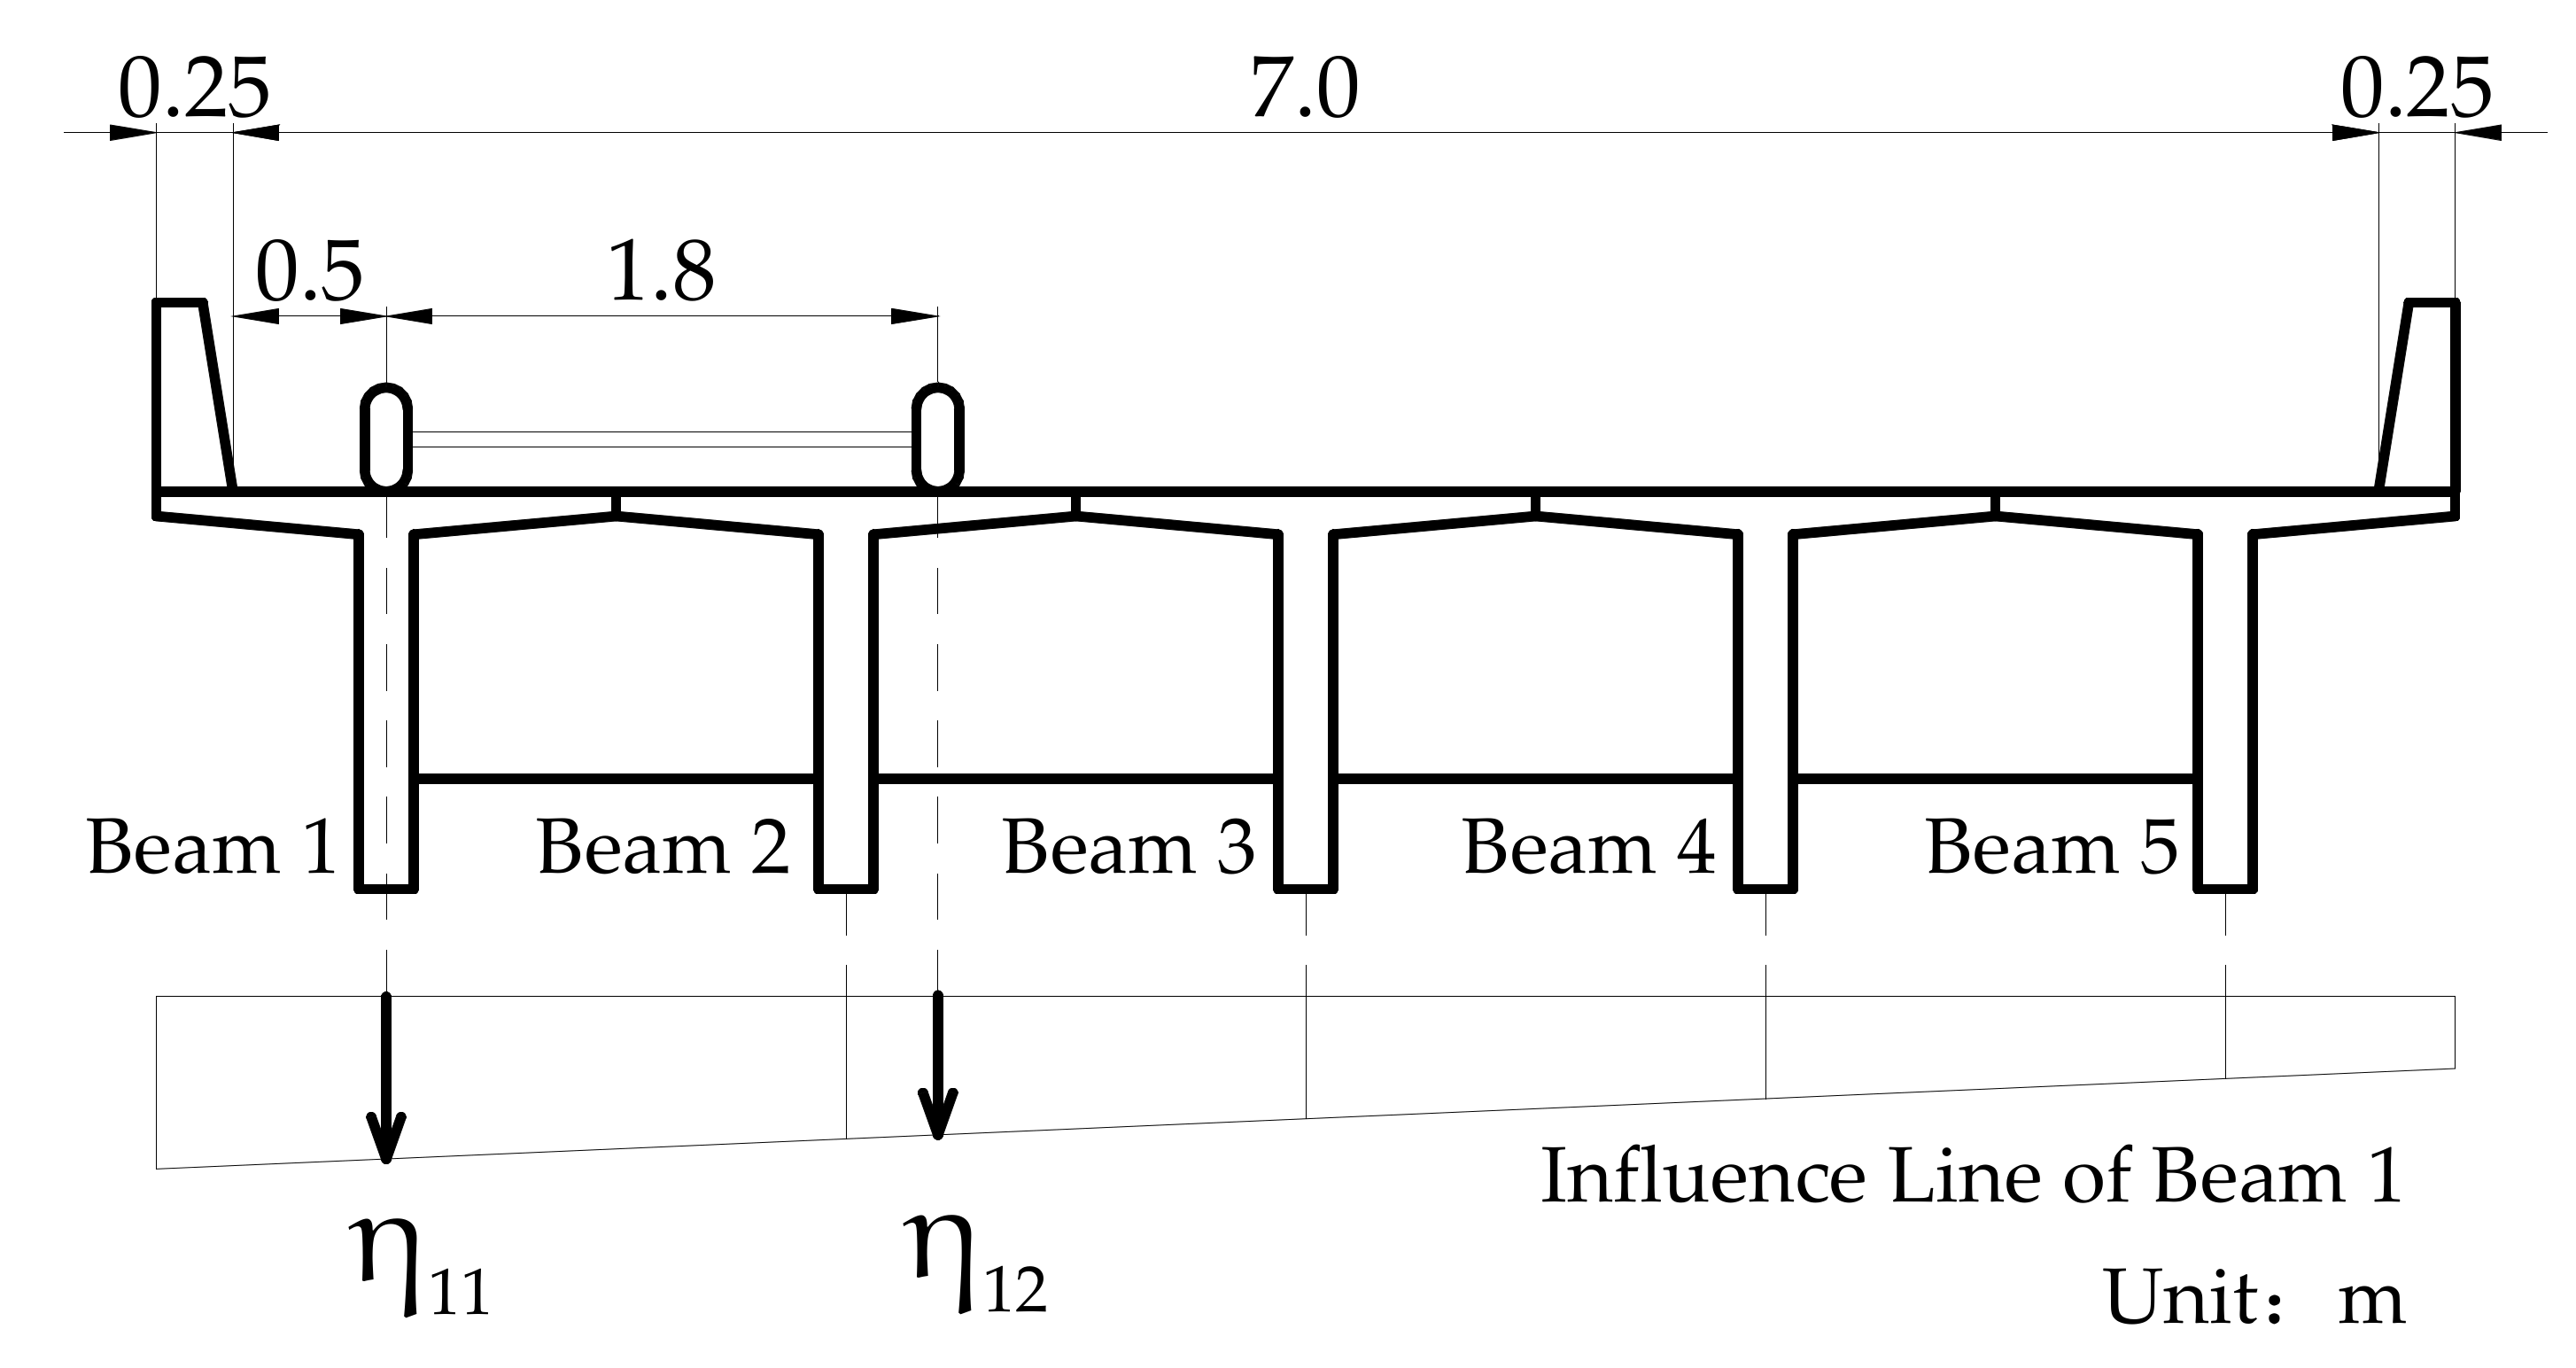
3.1. Influence Lines of Lateral Load Distribution Considering Reinforcement Corrosion

The modified eccentric compression method is typically used to calculate the LLD influence lines of simply supported T-beam bridges with diaphragm plates. The modified eccentric compression method is related to the bending moment of inertia and the torsional moment of inertia. According to the effective bending moment of inertia shown in Equation (14), the LLD influence lines considering the influence of reinforcement corrosion are depicted as follows:
η i j = I c e i j = 1 n I c e j ± β a i I c e i j = 1 n a j 2 I c e j ,
β = I c e i 1 + G l 2 12 E j = 1 n T T j j = 1 n a j 2 I j ,
where I c e i is the effective bending moment of inertia of the i-th T-beam after corrosion, G and E are the shear modulus and elastic modulus of concrete, respectively, and T T j is the torsional moment of inertia of the j-th beam.

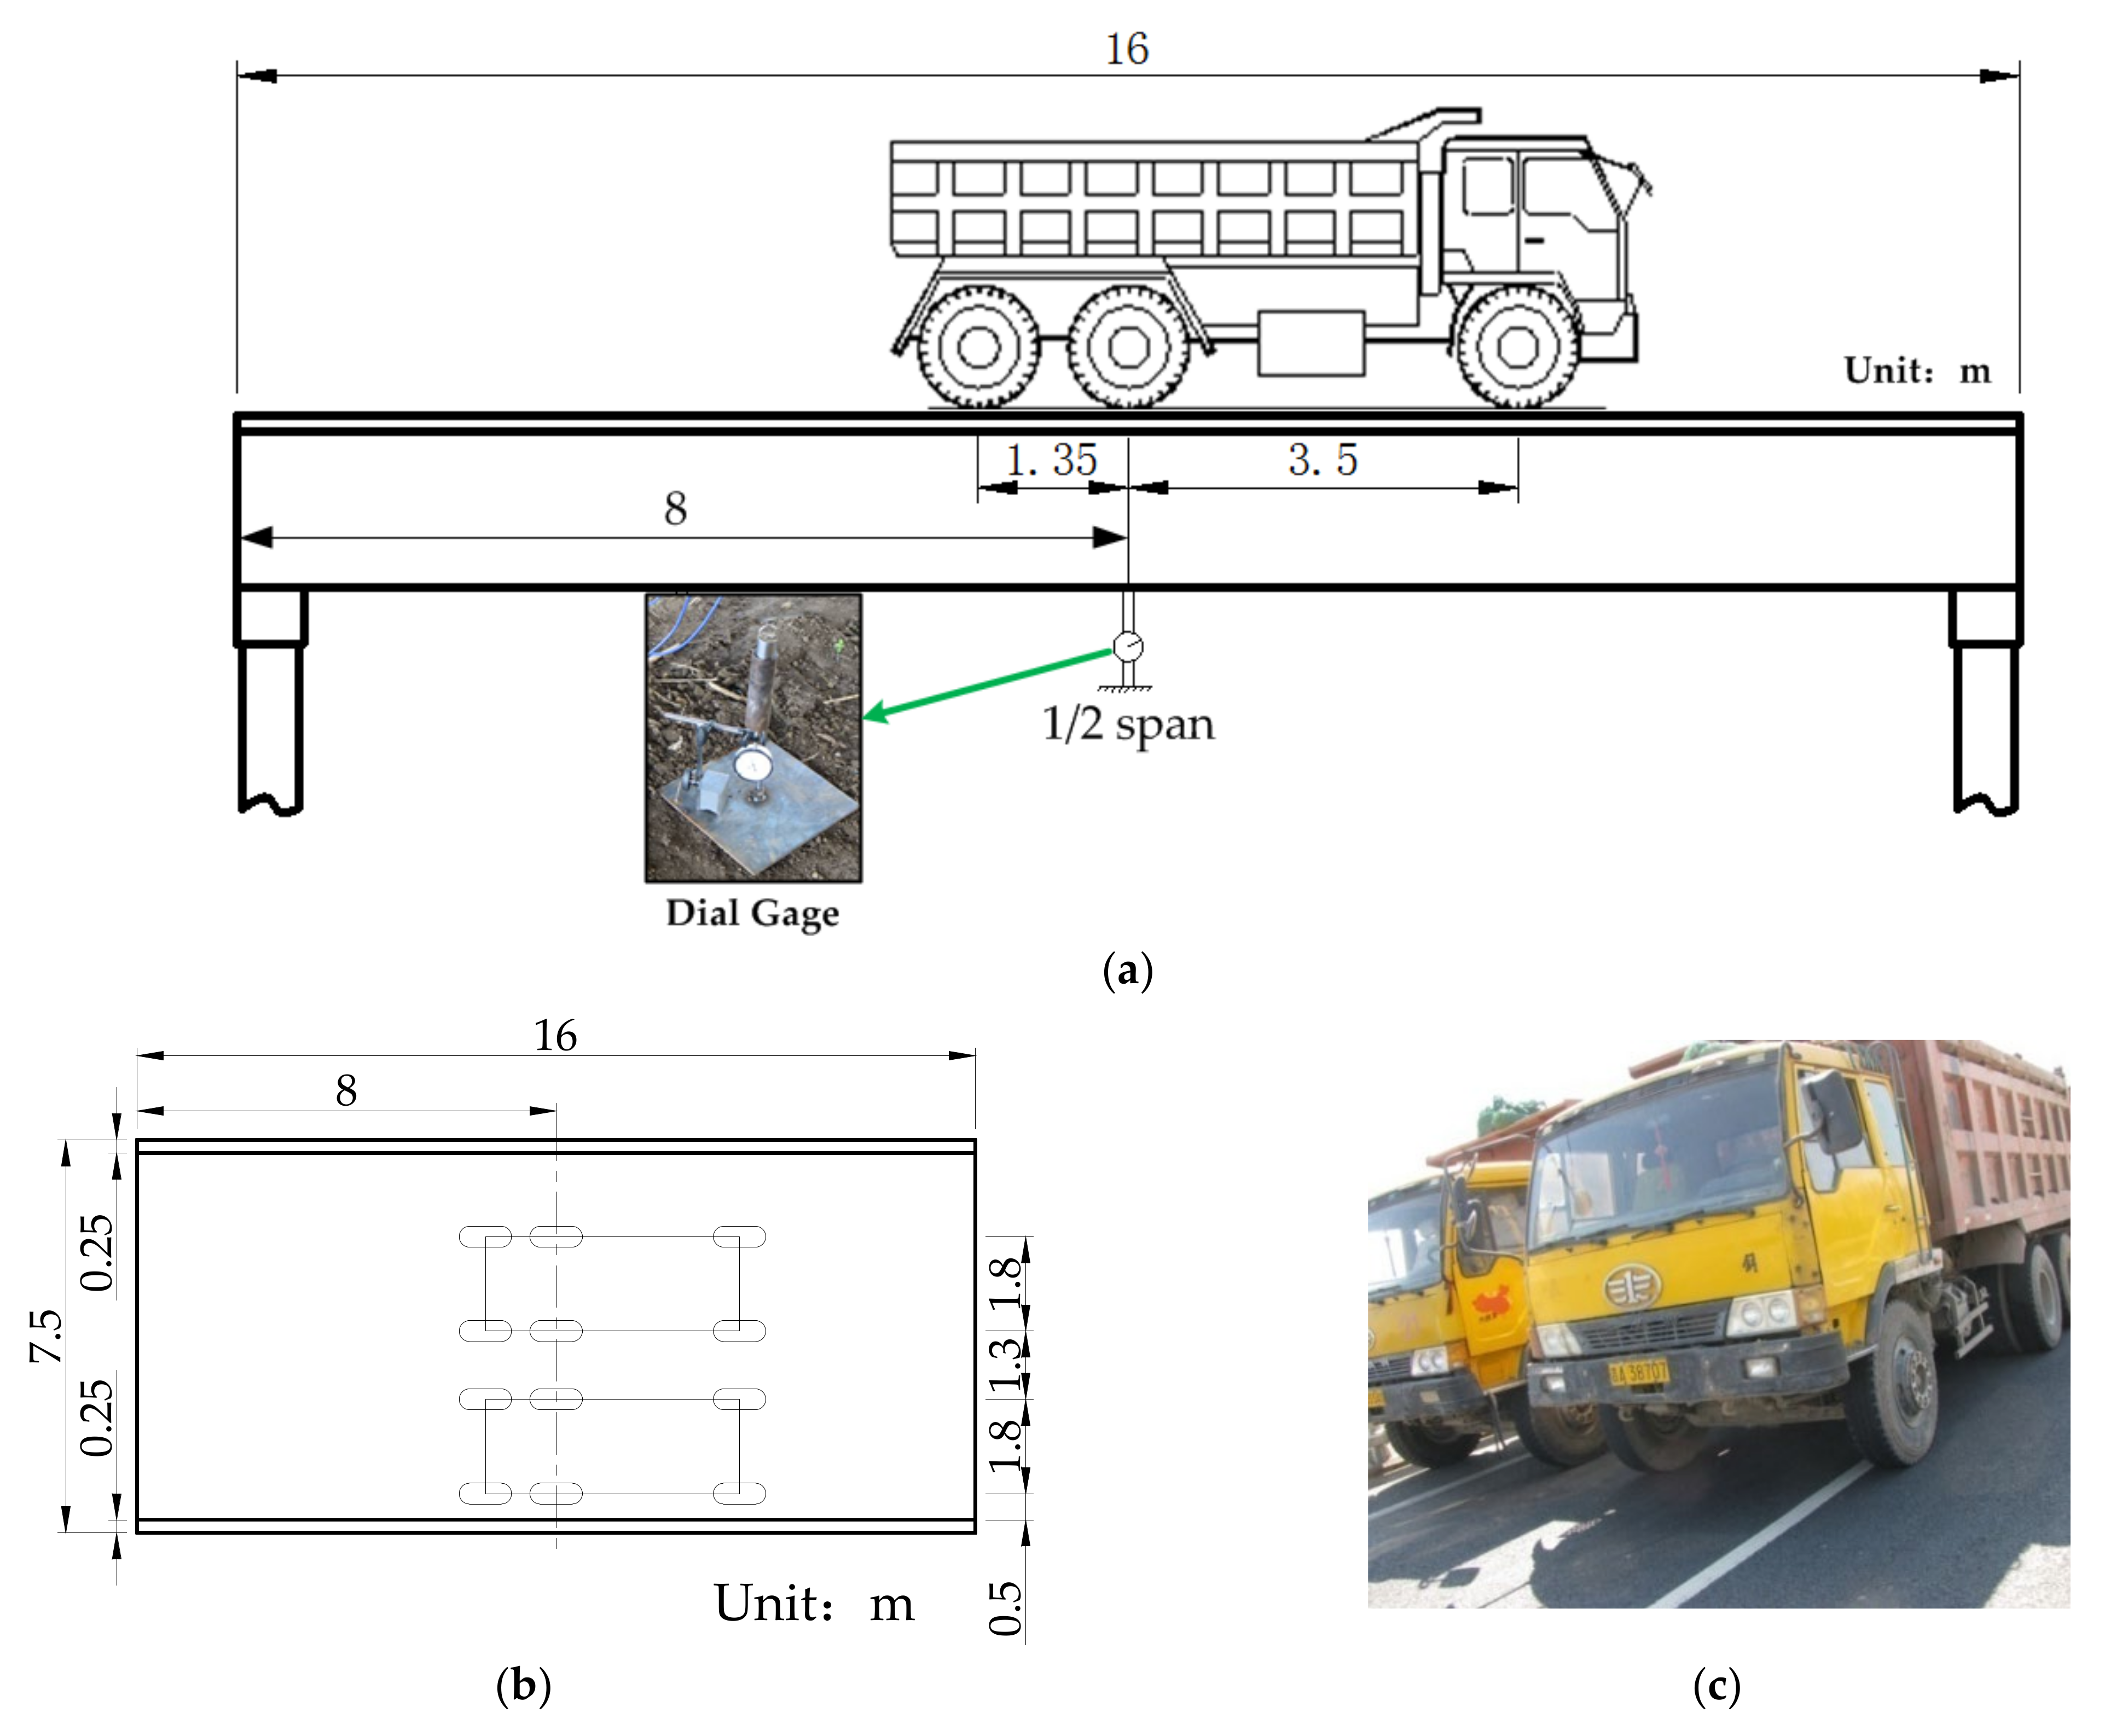
3.2. Vehicle Load Effect Calculation Model

The specific position of vehicles in the lateral direction is determined on the basis of the principle of the most unfavorable load distribution according to the LLD influence lines. Then, the influence line value of the wheel position can be obtained in accordance with the action position of the vehicle. Finally, the LLD coefficient of each beam can be deduced as Equation (18):
m i = λ 2 k = 1 2 q η i k ,
where m i is the LLD coefficient of the i-th beam; λ is the reduction coefficient, whose value is determined according to the specification [41]; q is the number of vehicle axles with 2 × q wheels; and η i k is the influence line value of the k-th wheel at the i-th beam, and its value can be obtained by linear interpolation with the wheel at any position.
Taking Beam 1 as an example, Figure 1 shows the most unfavorable transverse loading position and its LLD influence line under the action of a single vehicle.
Thus, the vehicle load effect of each beam can be concluded to be
S Q i = m i S Q ,
where S Q is the total effect produced by vehicle load on the bridge, which follows the extreme value I-type distribution, as shown in Equation (20) during the design reference period.
F S Q T = exp exp x β i α i ,
where α i and β i are the parameters of extreme value type I distribution. The vehicle load operation state of highway bridges is divided into two kinds in the Chinese Design Code [41]. One is the general operation state corresponding to Class II, where α i = 0.084 S Q k 1 and β i = 0.6376 S Q k 1 . The other is the intensive operation state corresponding to the Class I, where α i = 0.0537 S Q k 2 and β i = 0.7685 S Q k 2 . S Q k 1 and S Q k 2 are the standard values of load effect for class II and class I, respectively.
The evaluation standard period is not the same as the design standard period for a specific evaluation time, and the vehicle load in the evaluation standard period also follows the I-type distribution, which is expressed as:
F S Q T r = exp exp x β T r α T r ,
where α T r = α i and β T r = β i + α i / n T r l , and T r is the evaluation standard period. Therefore, the load expectation and standard deviation in the evaluation standard period are μ = 0.5772 1 α T r + β T r and σ = 1.2825 1 α T r , respectively.

3.3. Performance Function of Flexural Bearing Capacity

The limit state of flexural bearing capacity of the i-th beam can be expressed as,
Z = R i S G i S Q i ,
where R i is the resistance of the i-th beam; S G i is the load effect generated by the secondary dead load, which obeys normal distribution; and S Q i is the load effect produced by vehicle load on the i-th beam.
It is worth noting that the M a in Equation (12) is equal to the sum of the largest vehicle load S Q i and dead load S G i . M a in Equation (12) has a direct effect on the effective moment of inertia of reinforced concrete bridge after corrosion, and the effective bending moment of inertia also affects the lateral distribution of vehicle load. The LLD coefficient in turn affects M a in Equation (12). Therefore, the iterative algorithm combined with the Monte Carlo method is used to calculate the reliability index of bridges in this paper.
Figure 2 shows the reliability calculation method for the corroded reinforcement bridge combined with inspection data of concrete strength and concrete cover thickness, which takes into consideration the influence of reinforcement corrosion on vehicle load effect. The inspection results of concrete strength and concrete cover thickness should be obtained at first and taken into the computational procedure as inputs. The reliability assessment established in this work is based on the Monte Carlo method, and the iterative algorithm is also employed due to the interaction between the effective bending moment of inertia and the LLD coefficient. The allowable error and the parameters of the Monte Carlo method and the iterative algorithm should be determined at first. Using the inspection results, the initial time of reinforcement corrosion can be calculated by the reinforcement corrosion model. When the corrosion occurs, the reinforcement corrosion rate and degree can be computed. Then, we can calculate and obtain the moment of inertia and cracking moment with reinforcement corrosion. According to the above results, the LLD coefficient m 0 of the first iteration is calculated by the modified eccentric compression method, which is used to compute the maximum bending moment M a . The effective bending moment of inertia I c e of the corroded reinforcement bridge is obtained by Equation (12) to Equation (15). Therefore, the LLD coefficient can be recalculated based on I c e and marked as m 1 . If the absolute difference between m 0 and m 1 is less than the allowable error, it demonstrates m 1 is the actual value of the LLD coefficient of corroded reinforcement bridge. It will be recorded and used to compute the flexural bearing capacity reliability. When the absolute difference is greater than the allowable error, m 1 is assigned to m 0 . M a and I c e will be recalculated until the absolute difference is less than the allowable error. When the termination condition of Monte Carlo method is met, it will terminate the algorithm and output the reliability index.

4. Results and Analysis

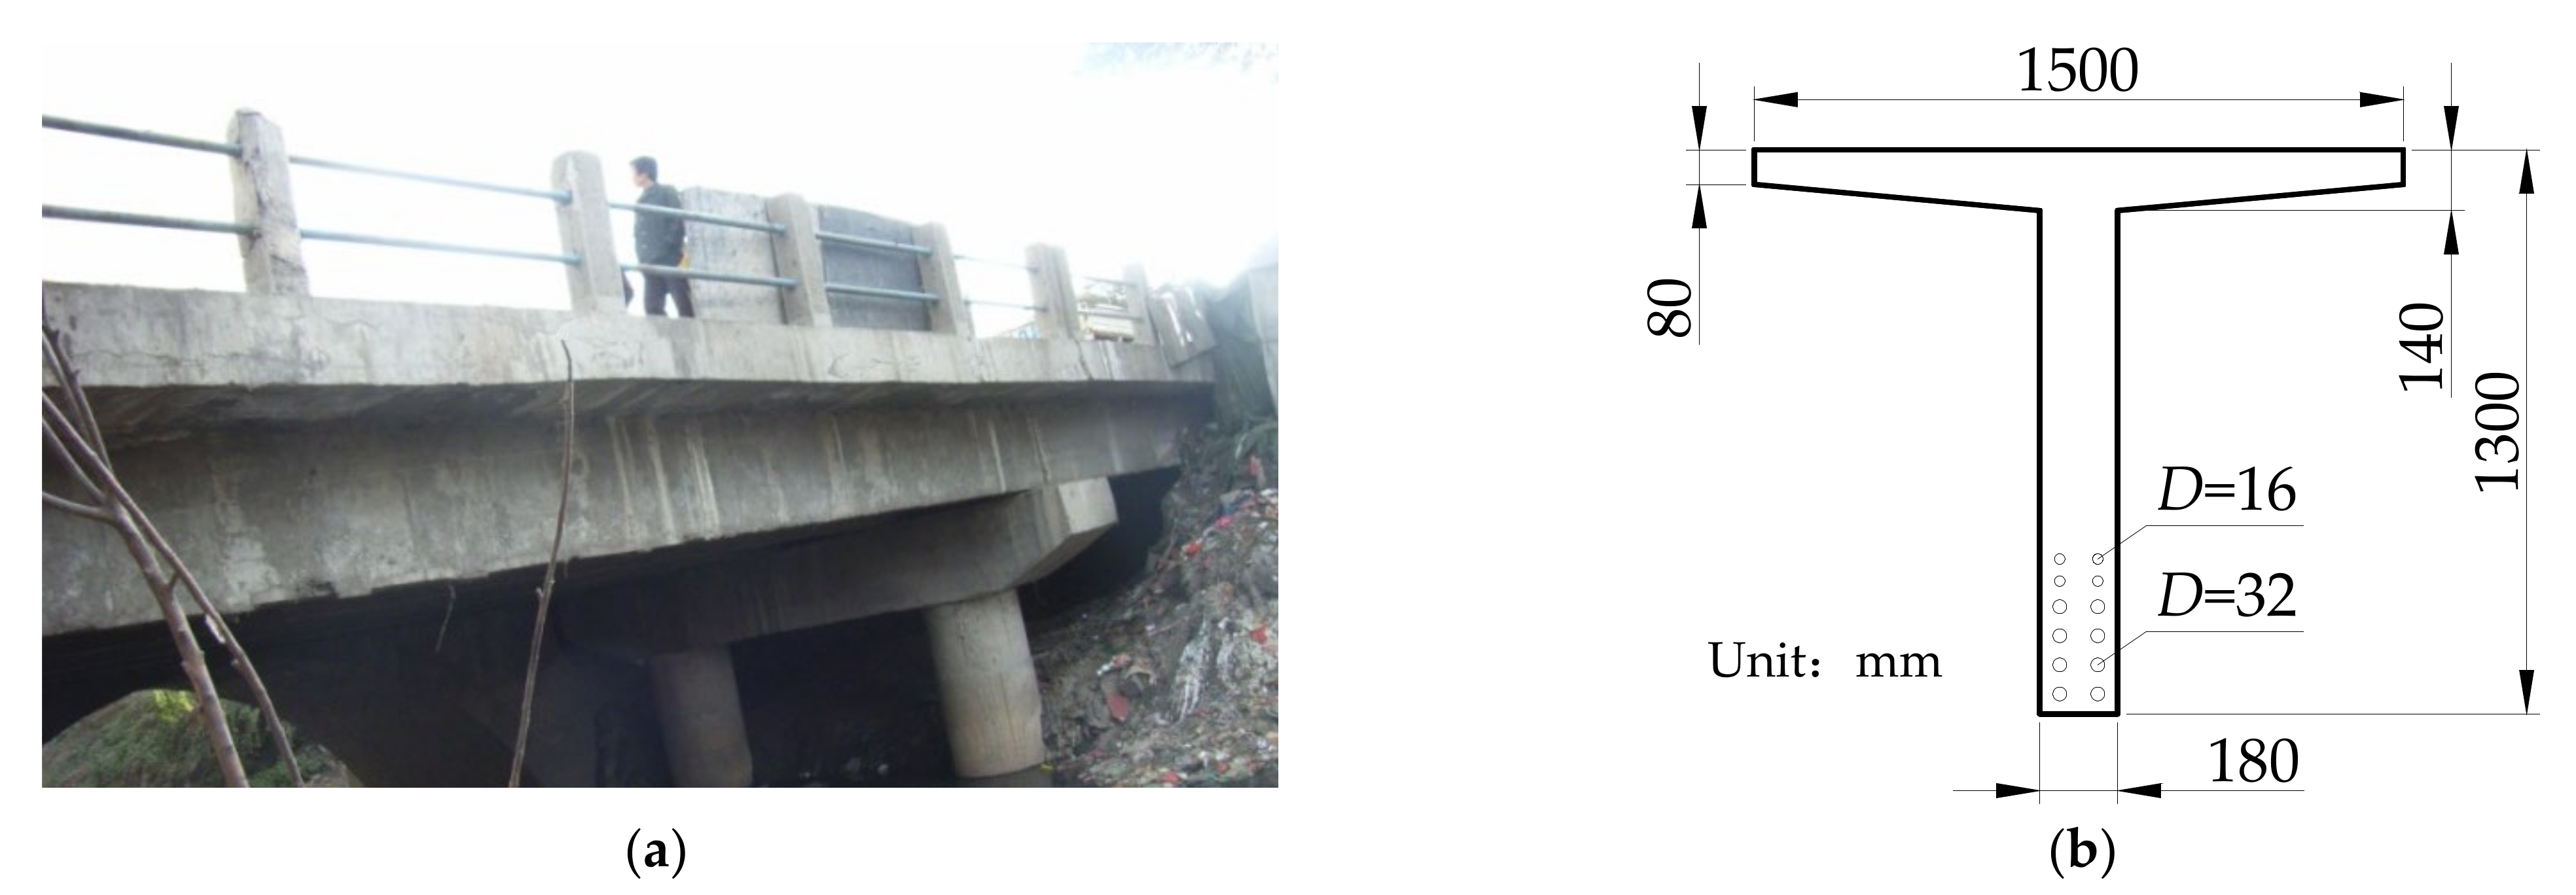
4.1. Overview of the Simply Supported T-Beam Bridge

This paper takes the Xiaobai Bridge located in Jinqianbao, Changchun City, Jilin Province, as a typical example for calculation and analysis. The bridge is a simply supported bridge with 5 T-beams, built in 1989 with a span length of 16 m, height of 1.3 m, and roof width of 1.5 m for each T-beam. The simply supported T-beam bridge is 7.5 m in width, including 7 m lane width and 0.25 m guardrail width. Four layers of Φ32 mm reinforcement steel and two layers of Φ16 mm reinforcement steel are arranged in total, and each layer has two reinforcement steel bars with static spacing of each layer at 35 mm. Figure 3 illustrates the specific cross-sectional size.

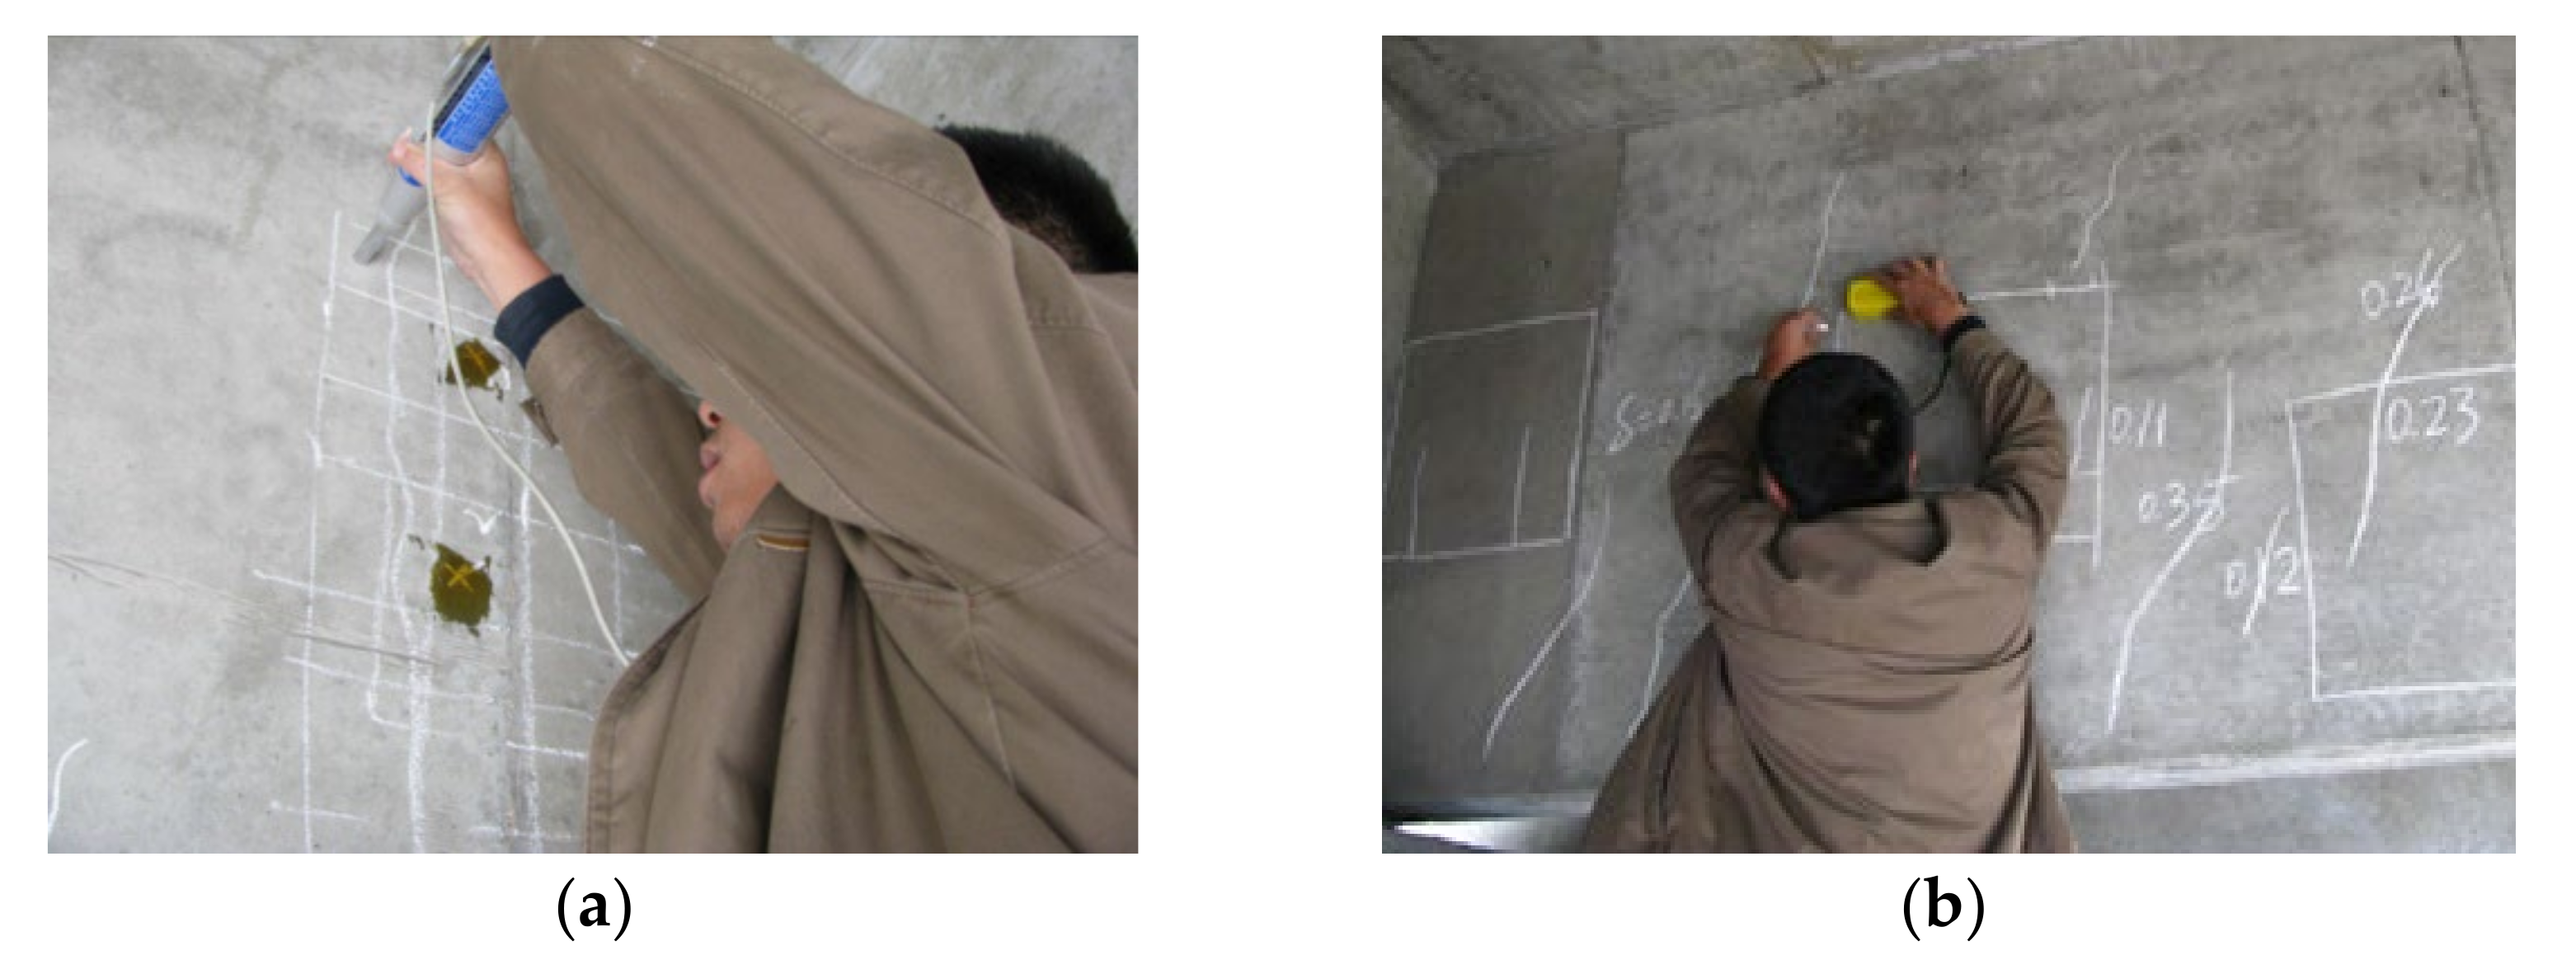
4.2. Bridge Detection Data and Probability Distribution Information of Influencing Factors

As shown in Figure 4, the latest regular bridge inspection test was carried out from May 19 to May 21, 2020. The concrete strength and concrete cover thickness of the abdominal plate in the mid-span test area were tested by the steel reinforcement detector and the rebound detector, and the measured data are shown in Table 1.
Based on the existing references, Table 2 shows the probability distribution types and parameters of the main influencing factors for reinforcement corrosion adopted in this paper.

4.3. Analysis of Bridge Load Effect Considering Reinforcement Corrosion

Considering that most small- and medium-span bridges lack historical data and reference information, which limits the bridge reliability analysis, it can be regarded as a problem without prior distribution for analysis and solution. The nonprior information Bayesian analysis method in Reference [43] is adopted for calculation in this paper, and the inspection data of concrete strength and concrete cover thickness are assumed to follow a normal distribution N μ , σ 2 .
The Bayesian estimation of parameter μ is x ¯ , and the posterior distribution of σ 2 is:
σ ^ 2 = 2 λ + i = 1 n x i x ¯ 2 2 α + n 3 ,
where α and λ are the shape parameter and scale parameter of the inverse gamma distribution; α = 102 and λ = 154 for analyzing the concrete cover thickness, while α = 102 and λ = 536 for analyzing the concrete strength; and n is the number of samples.
The inspection data in Table 1 were processed and analyzed by the above Bayesian update method without prior information, and the posterior probability distribution parameters of concrete strength and cover thickness were obtained, as shown in Table 3.
In combination with the Monte Carlo and Latin hypercube sampling methods, Equation (5) was used to calculate the reinforcement corrosion rate modified based on the measured data. The probability distribution of the LLD coefficient considering the influence of reinforcement corrosion was obtained based on the aforementioned derivation process. The deflection values of the mid-span section of the bridge were obtained by means of dial gages through the vehicle load test shown in Figure 5. The vehicle load test was taken at the same time as the bridge inspection test. For the elastic beam, the deflection of each beam is proportional to the load it bears. In other words, the LLD coefficient of the k-th beam can be calculated by the measured deflections:
m k = u k / i = 1 n T u i ,
where u k and u i are the deflection values of the k-th beam and the i-th beam under vehicle load, respectively, and n T is the number of T-beams.
The probability distribution of the LLD coefficient of Beam 1 and Beam 2 was obtained according to the method proposed in this paper, and the LLD coefficient without considering the influence of reinforcement corrosion μ 0 was also calculated, whose results and measured data are given in Figure 6.
In this study, an in situ test was carried out to verify the proposed method. Actual reinforcement corrosion cannot be measured by nondestructive testing, while the LLD coefficient can be obtained by static testing. In addition, reinforcement corrosion may not occur in the early stage of service time. The reinforcement corrosion model proposed in this paper is still suitable for bridge performance analysis. At this point, reinforcement without corrosion is treated as intact. The computation results of Equations (11) and (14) are the same as the uncorroded results. As shown in Figure 6, μ is equal to μ 0 , and both possess little standard deviation. This proves the effectiveness of the proposed reinforcement corrosion model to calculate uncorroded reinforcement. When a bridge has been in service for 20 to 30 years, the influence of reinforcement corrosion on its performance will be prominent. Regular bridge inspections are usually carried out every three to five years. Therefore, the test results of regular bridge inspection in 2020 were used to validate the study. Meanwhile, the theoretical model was employed to calculate the results for 100 years of bridge service life, and the theoretical results in 2020 were used to compare with the measured results and predict the variation trend.
As seen in Figure 6, the LLD coefficients of Beam 1 and Beam 2 are constant without considering the influence of reinforcement corrosion. When the influence of reinforcement corrosion is considered, the mean value of the LLD coefficient of Beam 1 is basically stable in the first 20 years of service, but it drops sharply in the following 20–60 years of service and then tends to be stable. In addition, the LLD coefficient of Beam 2 shows an upward trend and is relatively stable in the preservice and postservice periods. This phenomenon shows that reinforcement corrosion will affect the stiffness of the bridge structure and further lead to the redistribution of the load effect. In the case of a vehicle loaded at one side, the load effect of Beam 1 decreases gradually with the increase in reinforcement corrosion. Moreover, part of the load effect is redistributed to the internal beams.
The standard deviation of Beam 1 and Beam 2 does not change significantly during the first 10 years of service but increases with the increase in service time from the 10th year and then stabilizes between 30 and 90 years of service. Furthermore, the measured data of the LLD coefficient are within the range of one standard deviation, which is close to the mean value of the LLD coefficient of the load test, which verifies the validity and accuracy of the calculation method of LLD considering the influence of reinforcement corrosion established in this paper. The results show that the structure is not affected by the external environment at the initial stage of service, for which the traditional calculation method can still be used for structural calculation and analysis. However, performing the calculation method without considering the influence of reinforcement corrosion will cause substantial errors with the increase in service time, whereas the method established in this paper fully considers the influence of reinforcement corrosion on structural stiffness and LLD.

4.4. Reliability Analysis Considering LLD Affected by Reinforcement Corrosion

Based on the analysis of the vehicle load effect influenced by reinforcement corrosion, the reliability of the flexural bearing capacity was calculated according to the process shown in Figure 2. The reliability indexes of Beam 1 and Beam 2 were calculated as examples because the simply supported T-beam bridge in this paper is a five-beam symmetrical structure, and the beams close to the bridge edge bear a greater load effect. The reliability indexes shown in Figure 7 were calculated under the combination of LLD variation caused by reinforcement corrosion and inspection data updates. We present the following three cases: Case 1: The influence of reinforcement corrosion on LLD variation is not considered, and the model is not updated by the inspection data; Case 2: The influence of reinforcement corrosion on LLD variation is not considered, and the model is updated by the inspection data; Case 3: The influence of reinforcement corrosion on LLD variation is considered, and the model is updated by the inspection data.
It can be seen from Figure 7 that the reliability indexes of Beam 1 and Beam 2 are the largest in Case 1 and the smallest in Case 3. The reliability obtained by the modified calculation method based on the comprehensive consideration of concrete strength and concrete cover thickness is lower, which indicates that the reliability results of the bridge bearing capacity obtained by the existing reinforcement corrosion calculation method are too conservative, and the modified calculation method based on Equation (5) in this paper can reduce this error. The influence of load effect on the reliability caused by reinforcement corrosion should not be ignored, either. In addition, the reliability index differences between the three cases are small. For Beam 1 and Beam 2, there is the same pattern, namely, the difference between Case 1 and Cases 2 or 3 is greater than that between Case 2 and Case 3. In this study, special attention is focused on reinforcement corrosion, which is one of the main influence factors for bridge degradation. In the early stage of structural degradation, the reduction of reinforcement capacity is so small that the reliability index difference is small.
The probability distribution information of influencing factors as shown in Table 2, and the measured data processed by the Bayesian method without prior information as shown in Table 3 are taken as the input data of reliability analysis and compared with the time-dependent reliability results calculated according to the traditional LLD theory. Also taking Beam 1 and Beam 2 as examples, Figure 8 illustrates the time-dependent reliability index results calculated by the two methods.
It turns out that the reliability indexes of Beam 1 and Beam 2 calculated by the traditional analysis method are larger than those calculated by the proposed method according to the time-dependent reliability curve of the flexural bearing capacity, and the reliability indexes calculated by the two methods have the same variation trend. The results indicate that the reliability evaluation method established in this paper can consider the influence of reinforcement corrosion on the bearing capacity of the T-beam and the vehicle load effect. This possible scenario enhances the accuracy of the reliability evaluation of the bridge, whereas the evaluation results obtained by the traditional method are too conservative.
It is worth noting the variation tendency of the reliability index difference between the traditional method and the proposed method. In the early stage of reinforcement corrosion, the corrosion makes less contribution to bridge degradation. Therefore, the difference between the results of the two methods is small. With increasing service time, the difference becomes greater and greater. The main factor for the difference between the traditional and proposed methods is whether the bridge inspection data are used for analysis. If the corroded bridge reliability is calculated by the proposed method without bridge inspection, the reliability result will coincide with that of the traditional method. When the bridge inspection data are updated in time, the reliability assessment will be more accurate and reflect the real condition of the bridge. In the later stage, the bridge reliability calculated by the proposed method was also analyzed based on the inspection of concrete strength and concrete cover thickness, which was measured in 2020. As a result, the difference between the two methods is small for the later stage. This also demonstrates the effectiveness of the method proposed in this paper.
The bearing capacity and load effect of the bridge will change substantially after the reinforcement corrosion in practical engineering. Beam 1 is located at the side of the bridge, which has a larger contact surface with the environment, and it is more susceptible to the disadvantageous influence of environmental chloride erosion and vehicle loads. Consequently, the deterioration process of the side T-beam is aggravated, which further leads to the reduction of stiffness. Therefore, the effective stiffness of Beam 1 decreases more than that of the inner T-beam, which is consistent with the degradation law of a degraded structure. This indicates that the proposed method can truly reflect the changing trend of degraded structure stiffness. The load effect of the T-beam increases with the increase in its stiffness according to the calculation principle of the modified eccentric compression method. Therefore, the effective stiffness of Beam 1 decreases more than the change of the internal T-beam. In addition, the resistance of each beam decreases gradually over time. As shown in Figure 8, although the load effect borne by Beam 1 is reduced, it is clear that the reliability index of the proposed method clearly remains lower than that of the traditional method.
The results show that reinforcement corrosion not only reduces the bearing capacity of the structure but also causes the change of the transverse mechanical properties of the bridge, thus redistributing the load effect of each T-beam. Meanwhile, the calculation method of bridge bearing capacity based on the reinforcement corrosion model does not consider the influence of reinforcement corrosion degradation on load effect, which increases the error of bridge performance evaluation. The calculation method of LLD theory with reinforcement corrosion in this paper can fully consider the interaction between reinforcement corrosion caused by chloride erosion and load effect, which reduces the influence of calculation model error on bridge reliability analysis.

5. Discussion

In this paper, time-dependent reliability was evaluated considering the influence of reinforcement corrosion on bridge bearing capacity and vehicle load effect. The computational results reveal that the LLD coefficient has time-dependent characteristics. This study proves that bridge stiffness is related to reinforcement corrosion. As one of the most important parameters of the LLD theory, the vehicle load effect is also shown to be inevitably influenced by reinforcement corrosion. As a result, the LLD coefficient changes with the increase in reinforcement corrosion. However, it may present an increasing or decreasing trend based on the reinforcement corrosion degree of each beam. The LLD coefficient of Beam 1 decreases over time, which means Beam 1 bears less load effect. However, the reliability index of Beam 1 still presents a downward trend. This indicates that the reliability assessment should synthetically consider the influence of reinforcement corrosion on bridge performance and load effect.
A reinforcement corrosion model combined with bridge inspection data based on Fick’s second law is established in this work. The model is proposed as a generalized method that is also suitable for bridges with different geometrical and structural characteristics. Combined with the corrosion model, an LLD coefficient calculation method with reinforcement corrosion considered is proposed using a modified eccentric compression method and an iterative algorithm. Therefore, the proposed method is only applicable for the vehicle load effect analysis of the kind of bridges calculated by the modified eccentric compression method, of which the simply supported T-beam bridge is the most typical bridge model. The method is not limited by other parameters; thus, the proposed method and analytical results can be extended and suitable for bridges under different conditions.
Moreover, the traditional reinforcement corrosion model is analyzed by chloride diffusion, of which the distribution parameters can be only obtained by literature and theoretical analysis. A reinforcement corrosion model combined with bridge inspection data is proposed. In other words, it can perform specific analysis on the target bridge. As for the traditional LLD theory, it is an accurate and effective method for uncorroded bridges. The proposed LLD coefficient calculation method takes into consideration the influence of reinforcement corrosion on vehicle load effect, which reduces the analysis model error. The method is also suitable for uncorroded bridge or structural designs. In addition, a reliability assessment is established by the proposed methods. An iterative algorithm is adopted to deal with the interaction between effective stiffness and LLD coefficient considering reinforcement corrosion. Compared with the proposed method, the reliability index calculated by the traditional method is more conservative. This demonstrates that the influence of reinforcement corrosion on bridge reliability cannot be ignored.

6. Conclusions

A time-dependent reliability assessment method for simply supported T-beam bridges was proposed considering the influence of reinforcement corrosion on vehicle load effect. Compared with existing reinforcement corrosion model studies, the inspection result of concrete strength was innovatively introduced to the corrosion model by the relationship between reinforcement corrosion and water/cement ratio. The modified eccentric compression method was improved by effective stiffness. The interaction between reinforcement corrosion and vehicle load effect, it was combined with an iterative algorithm to calculate the LLD coefficient for corroded reinforcement bridges. The time-dependent reliability of corroded reinforcement bridges was computed and discussed by the Monte Carlo method. The following conclusions can be drawn.
(1)
Reinforcement corrosion due to chloride ingress not only reduces the bearing capacity of simply supported T-beam bridges but also results in the deterioration of stiffness. As a result, the vehicle load effect will be changed, which will conversely aggravate the reinforcement corrosion process. The traditional LLD theory is no longer suitable for actual bridge engineering.
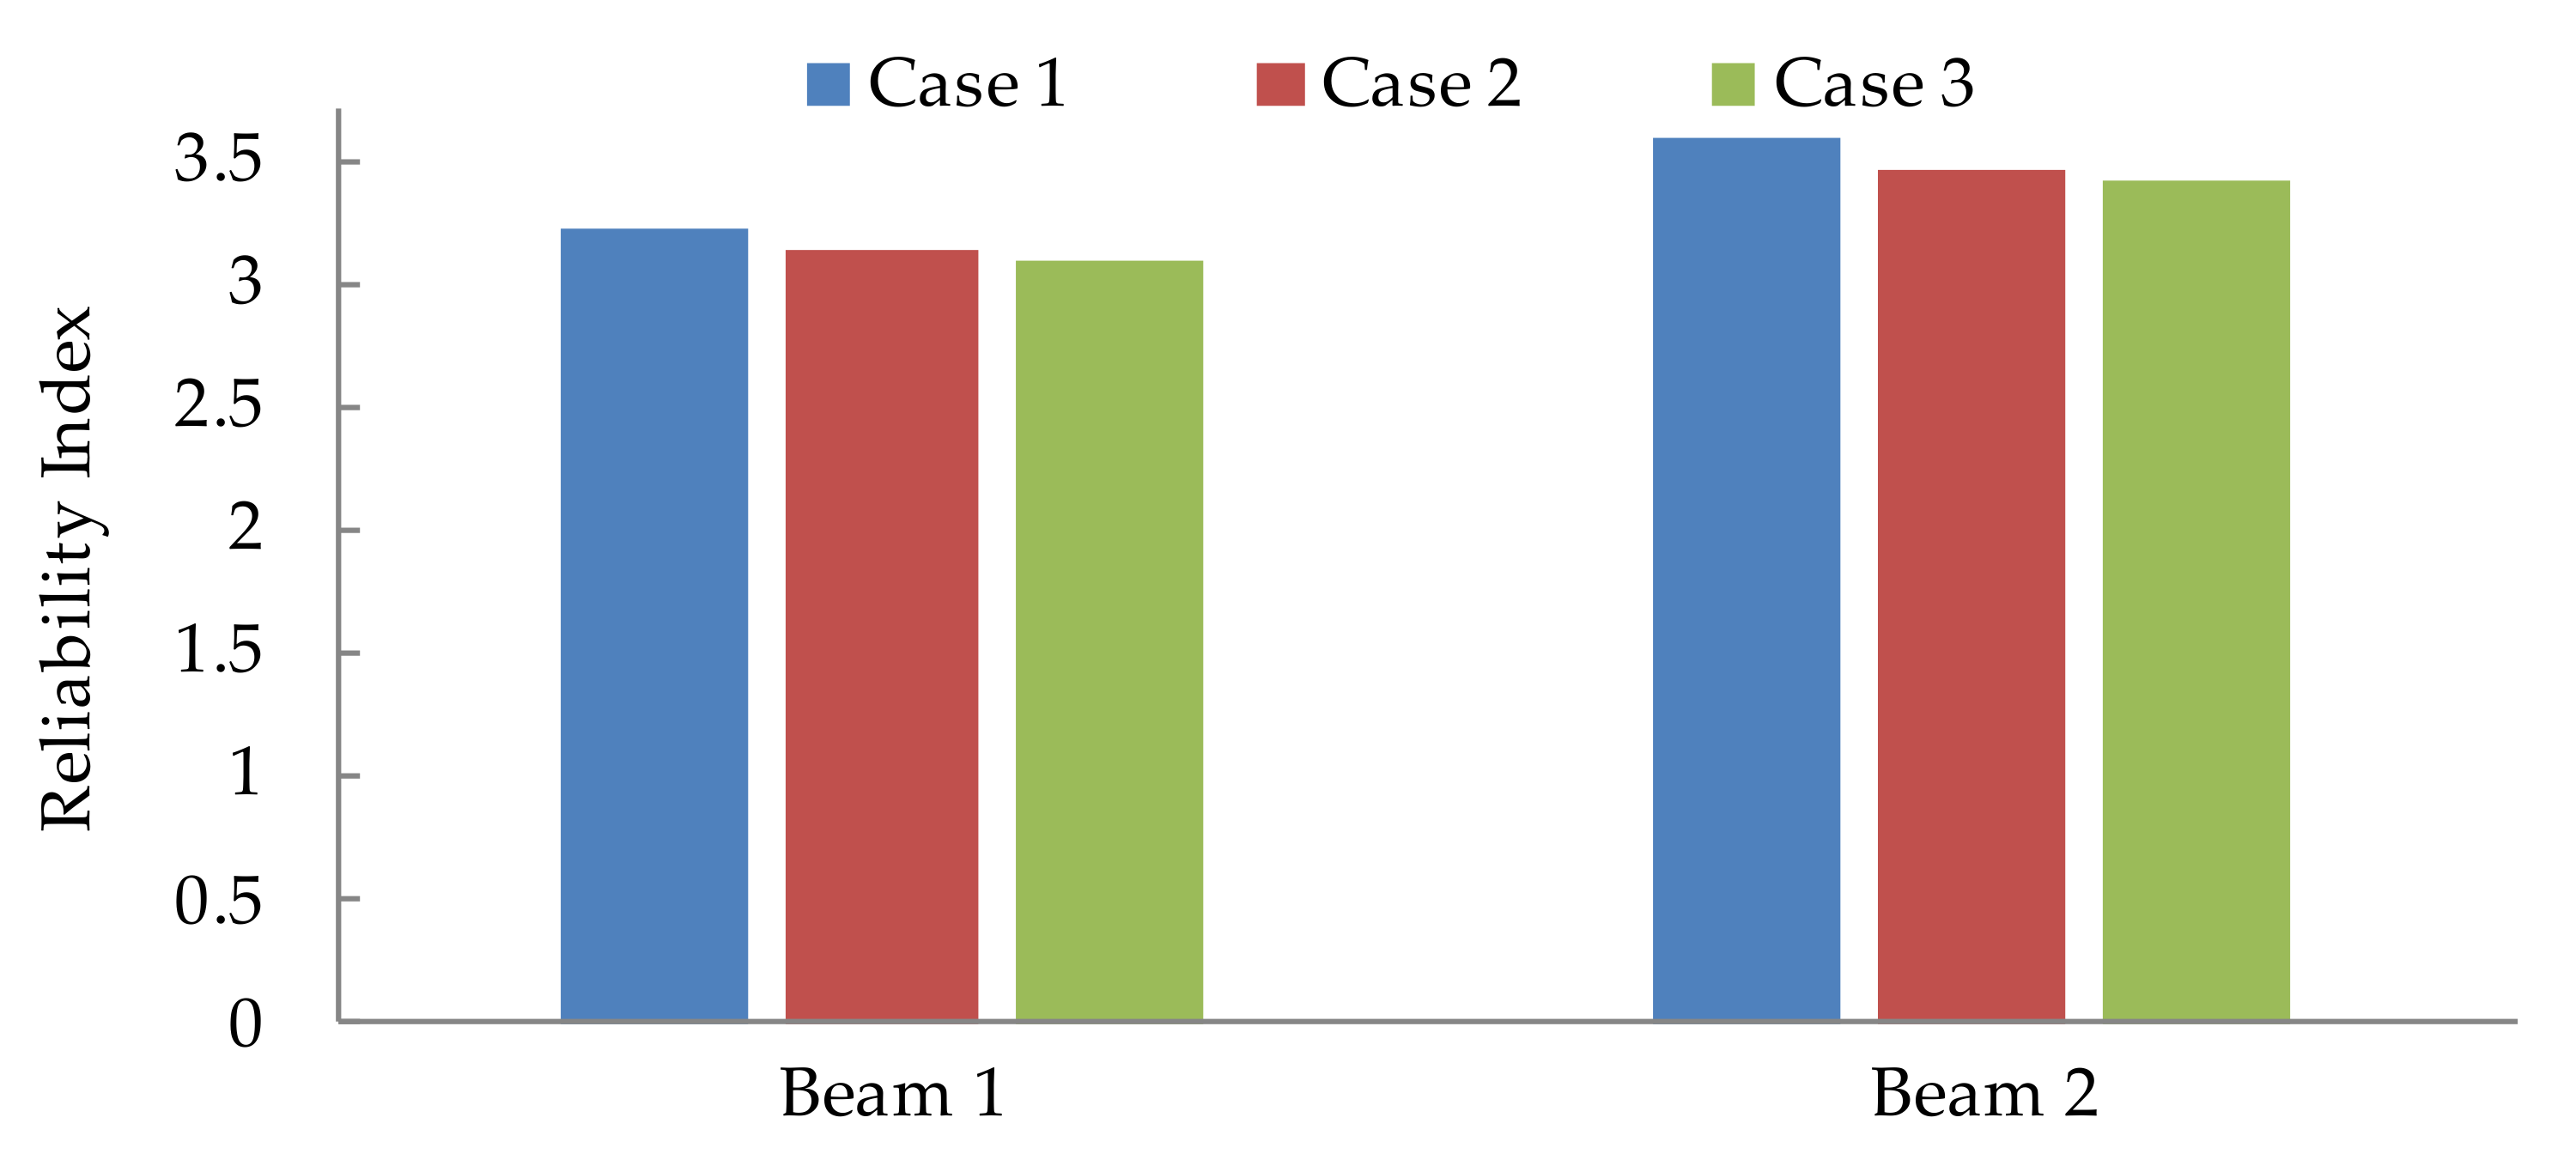
(2)
Reinforcement corrosion can lead to the redistribution of vehicle load effect. In both the theoretical and experimental analysis, the load effect of Beam 1 decreases gradually with the increase in reinforcement corrosion, and part of the load effect is redistributed to the internal beam. Due to the coincidence of the computational and experimental results, the correctness of the LLD calculation method for corroded reinforcement bridges is verified.
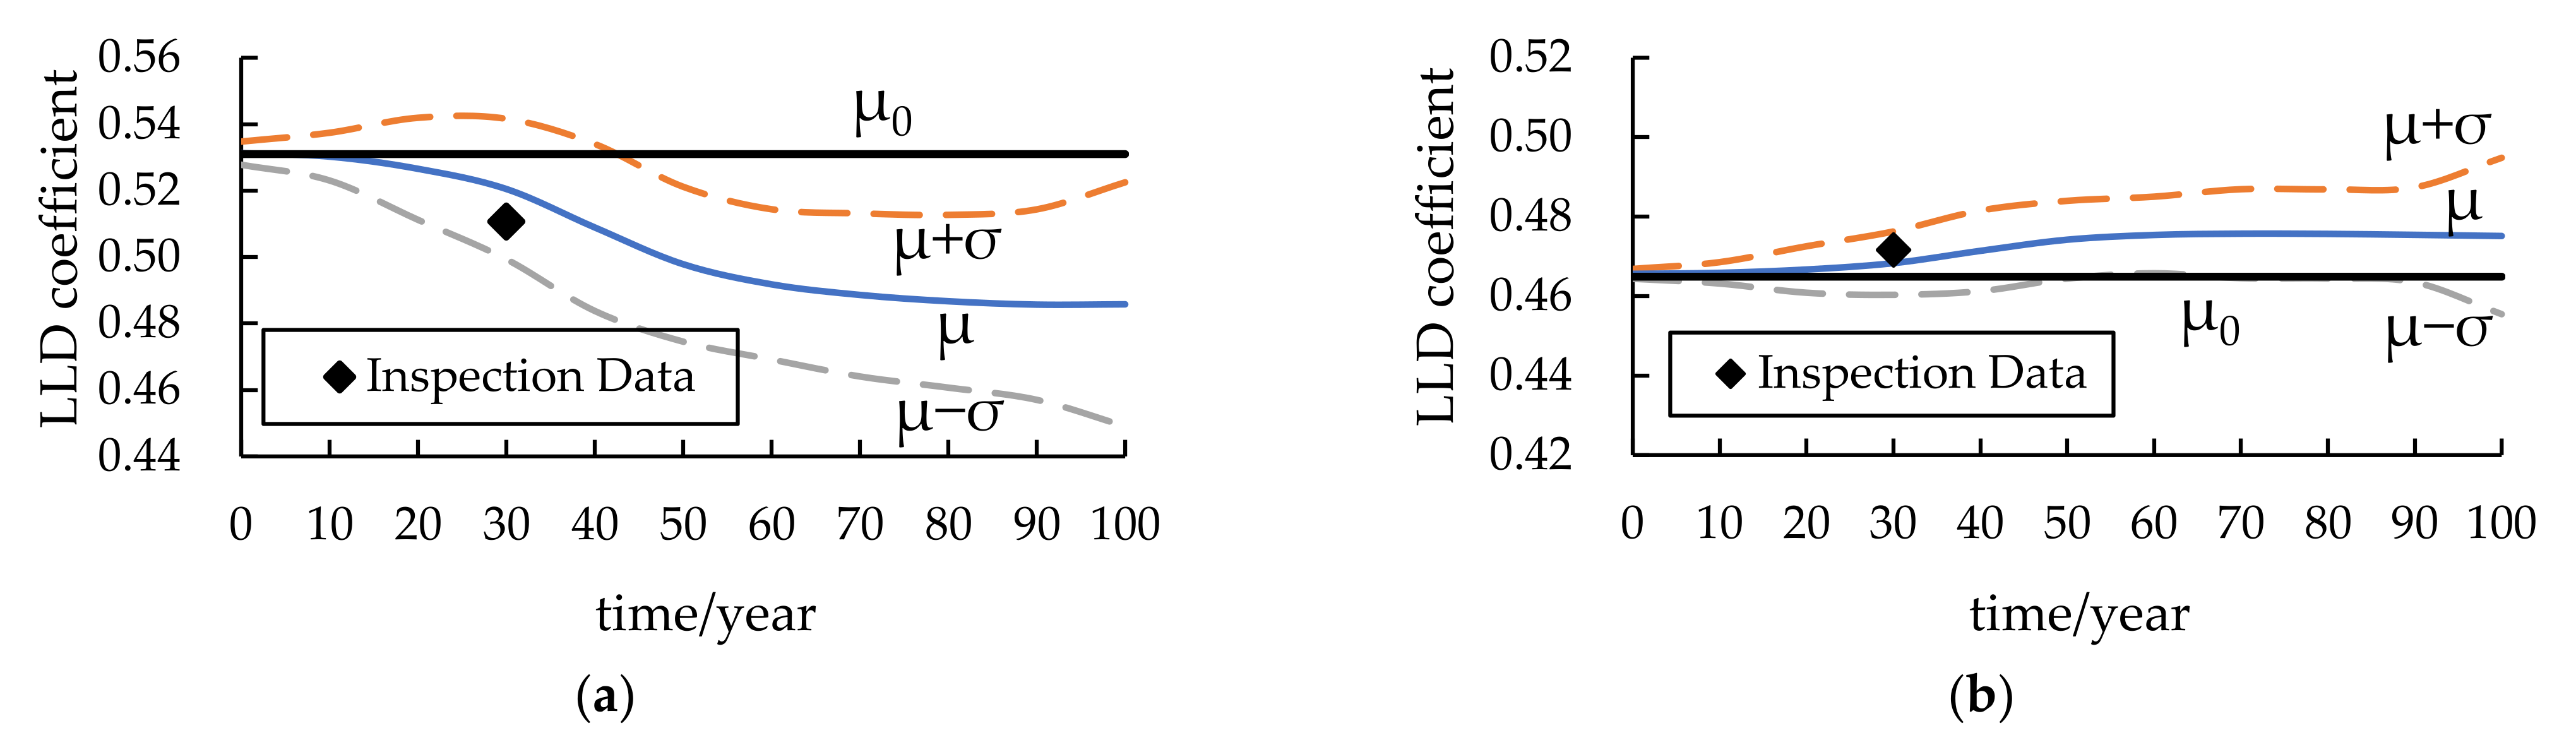
(3)
The LLD coefficient also possesses time-dependent properties. Because the reinforcement of the bridge is not corroded at the initial stage of service, there is little fluctuation with increasing time. After that, the LLD coefficients of T-beams will observably increase or decrease according to the position on the bridge and the reinforcement corrosion degree.
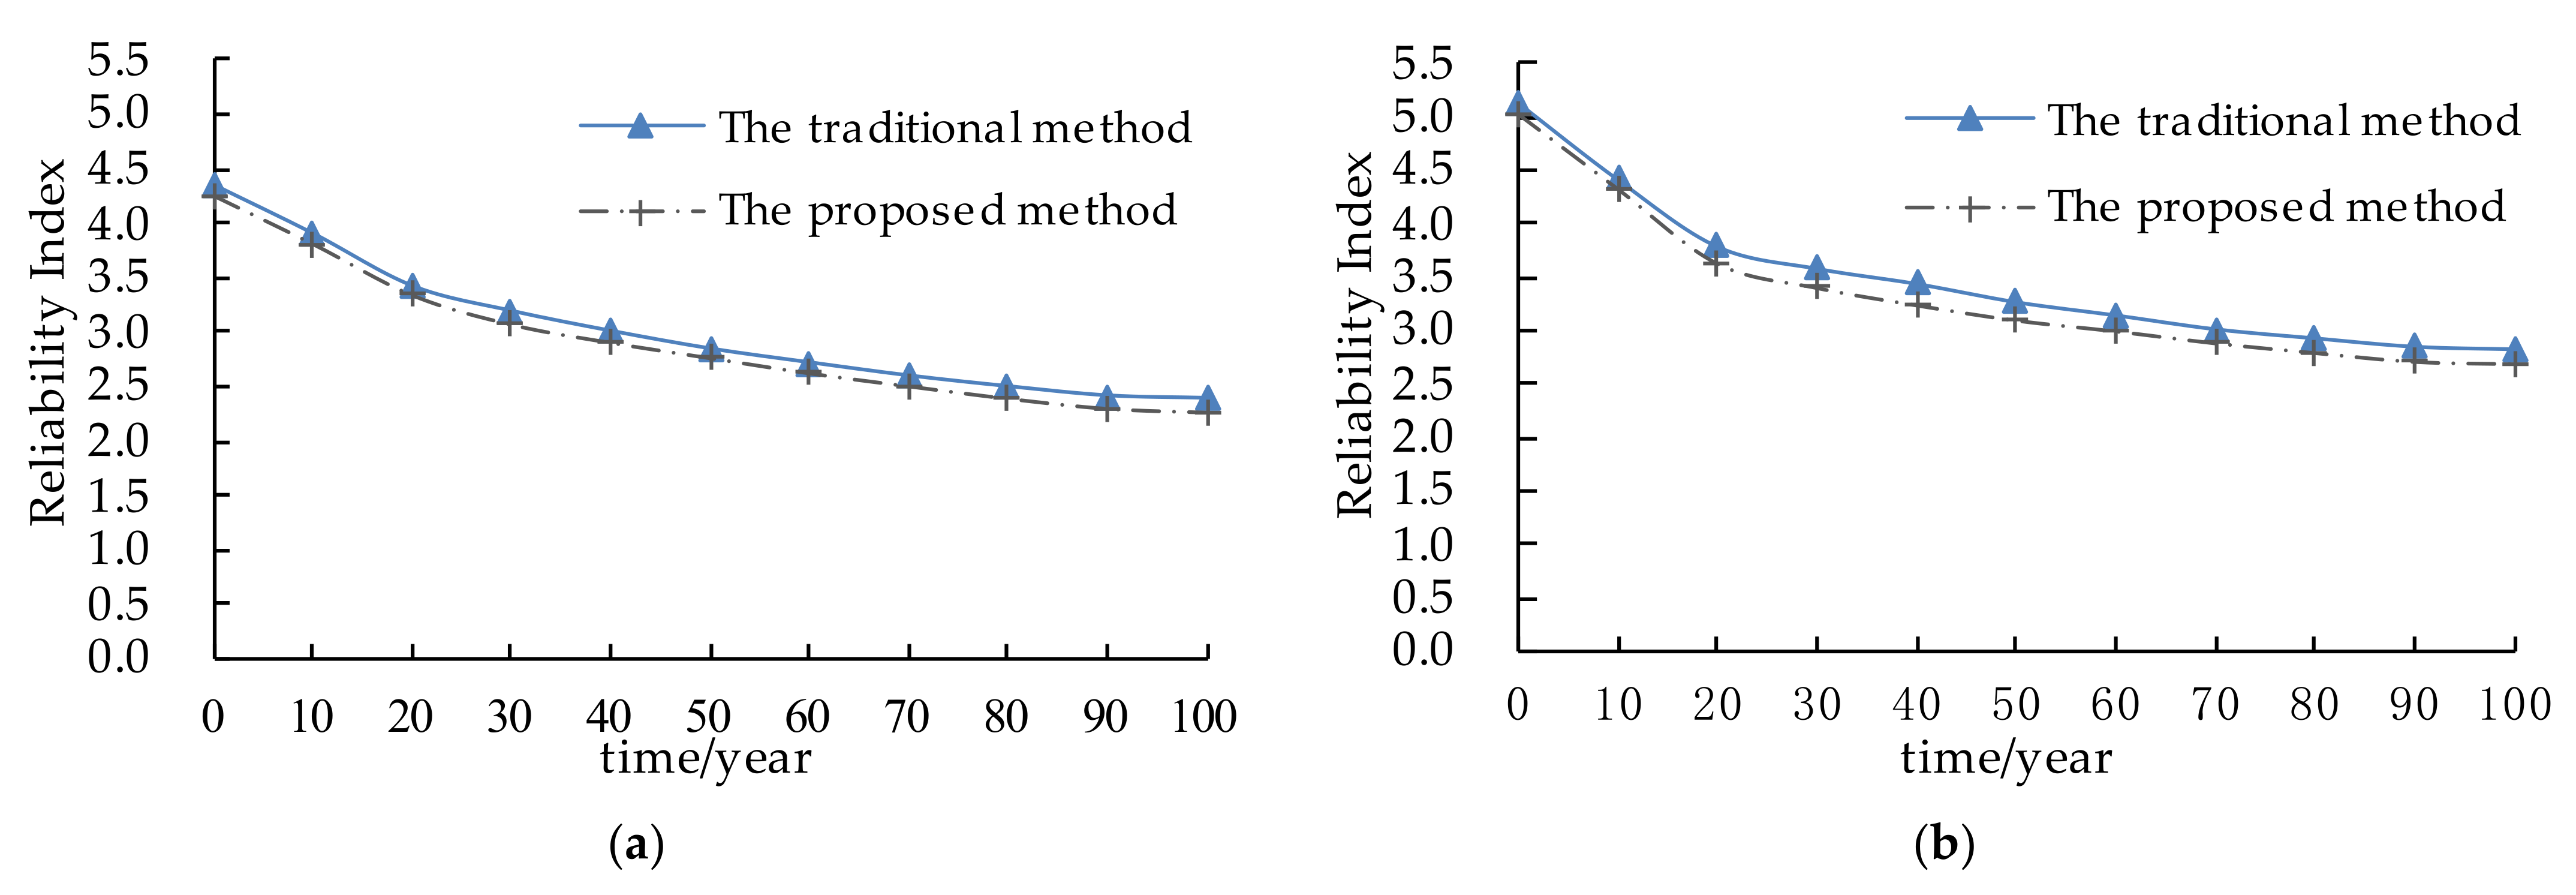
(4)
The traditional reliability analysis method for corroded reinforcement bridges only focuses on the bridge bearing capacity change. The interaction between the effective bending moment of inertia and the LLD coefficient caused by reinforcement corrosion is ignored. It increases the reliability calculation model error. The comparison results demonstrate the reliability index calculated by the traditional method is greater than that of the method proposed in this paper. This indicates the traditional method is too conservative and does not consider the influence of reinforcement corrosion on the LLD of simply supported T-beam bridges.
(5)
In this paper, the influence of reinforcement corrosion on the superstructure of simply supported bridges was researched based on bridge inspection data. For future study, the reinforcement corrosion influence on vehicle effects for other types of bridges will be extended. Moreover, modal parameters are used as important indicators for structural health monitoring, and they are also influenced by reinforcement corrosion. If the relationship between modal parameters and reinforcement corrosion is explicit, structural health monitoring data can be employed to accurately evaluate the reinforcement corrosion degree and the reliability of corroded bridges.

Author Contributions

Conceptualization, X.H. and G.T.; Formal analysis, G.T. and W.W.; Funding acquisition, G.T. and W.W.; Investigation, X.H. and Q.K.; Methodology, G.T.; Resources, W.C. and W.W.; Software, W.C. and Q.K.; Validation, X.H., W.C. and Q.K.; Writing—original draft, X.H. and Q.K.; Writing—review and editing, G.T., W.C. and W.W. All authors have read and agreed to the published version of the manuscript.

Funding

This research was funded by the National Natural Science Foundation of China, Grant Number: 51978309; the Key Project of Department of Transportation of Heilongjiang Province, Grant Number: 2022-1; the Transportation Innovation Development Support Project of the Department of Transportation of Jilin Province, Grant Numbers: 2021ZDGC-5 and 2020-1-3; the Scientific and Technological Project of the Science and Technology Department of Jilin Province, Grant Number: 20210508028RQ; and the Scientific Research Project of the Department of Education of Jilin Province, Grant Number: JJKH20221019KJ.

Institutional Review Board Statement

Not applicable.

Informed Consent Statement

Not applicable.

Data Availability Statement

The data presented in this study are available on request from the corresponding author.

Acknowledgments

The authors would like to thank the anonymous reviewers for their constructive suggestions and comments to improve the quality of this paper.

Conflicts of Interest

The authors declare no conflict of interest.

References

  1. Melhem, M.M.; Caprani, C.C.; Stewart, M.G. Reliability of Super-T PSC Girders at Serviceability Limit State Stresses across All Span Ranges. Struct. Infrastruct. Eng. 2019, 15, 812–821. [Google Scholar] [CrossRef]
  2. Murad, M.O.F.; Chik, Z.; Mustafa, A.; Absar, B.M.N.; Shikdar, K.H.; Nayan, K.A.M. A Comparative Study between Structural Properties of Pre-Tensioned Inverted T-Girder and Actual Post-Tensioned Box Girder in Bridge Construction. KSCE J. Civ. Eng. 2016, 20, 2403–2409. [Google Scholar] [CrossRef]
  3. Xie, H.; Wang, Y.; Gong, J.; Liu, M.; Yang, X. Effect of Global Warming on Chloride Ion Erosion Risks for Offshore RC Bridges in China. KSCE J. Civ. Eng. 2018, 22, 3600–3606. [Google Scholar] [CrossRef]
  4. Huang, C.; Huang, S. Seismic Resilience Assessment of Aging Bridges with Different Failure Modes. Structures 2021, 33, 3682–3690. [Google Scholar] [CrossRef]
  5. Zambon, I.; Santamaria Ariza, M.P.; Campos e Matos, J.; Strauss, A. Value of Information (VoI) for the Chloride Content in Reinforced Concrete Bridges. Appl. Sci. 2020, 10, 567. [Google Scholar] [CrossRef] [Green Version]
  6. Crespi, P.; Zucca, M.; Valente, M. On the Collapse Evaluation of Existing RC Bridges Exposed to Corrosion under Horizontal Loads. Eng. Fail. Anal. 2020, 116, 104727. [Google Scholar] [CrossRef]
  7. Crespi, P.; Zucca, M.; Valente, M.; Longarini, N. Influence of Corrosion Effects on the Seismic Capacity of Existing RC Bridges. Eng. Fail. Anal. 2022, 140, 106546. [Google Scholar] [CrossRef]
  8. Chen, C.; Yang, C. Experimental and Simulation Studies on the Mechanical Performance of T-Girder Bridge Strengthened with Transverse Connection. J. Perform. Constr. Fac. 2019, 33, 04019055. [Google Scholar] [CrossRef]
  9. El Hassan, J.; Bressolette, P.; Chateauneuf, A.; El Tawil, K. Reliability-Based Assessment of the Effect of Climatic Conditions on the Corrosion of RC Structures Subject to Chloride Ingress. Eng. Struct. 2010, 32, 3279–3287. [Google Scholar] [CrossRef]
  10. Darmawan, M.S.; Stewart, M.G. Spatial Time-Dependent Reliability Analysis of Corroding Pretensioned Prestressed Concrete Bridge Girders. Struct. Saf. 2007, 29, 16–31. [Google Scholar] [CrossRef]
  11. Naito, C.; Fox, J.; Bocchini, P.; Khazaali, M. Chloride Migration Characteristics and Reliability of Reinforced Concrete Highway Structures in Pennsylvania. Constr. Build. Mater. 2020, 231, 117045. [Google Scholar] [CrossRef]
  12. Bautista, A.; Pomares, J.C.; Gonzalez, M.N.; Velasco, F. Influence of the Microstructure of TMT Reinforcing Bars on Their Corrosion Behavior in Concrete with Chlorides. Constr. Build. Mater. 2019, 229, 116899. [Google Scholar] [CrossRef] [Green Version]
  13. Yang, D.; Li, G.; Yi, T.; Li, H. A Performance-Based Service Life Design Method for Reinforced Concrete Structures under Chloride Environment. Constr. Build. Mater. 2016, 124, 453–461. [Google Scholar] [CrossRef]
  14. Liu, Y.; Hao, H.; Hao, Y. Blast Fragility Analysis of RC Columns Considering Chloride-Induced Corrosion of Steel Reinforcement. Struct. Saf. 2022, 96, 102200. [Google Scholar] [CrossRef]
  15. Chehade, F.E.; Younes, R.; Mroueh, H.; Chehade, F.H. Time-Dependent Reliability Analysis for A Set of RC T-Beam Bridges under Realistic Traffic Considering Creep and Shrinkage. Eur. J. Environ. Civ. Eng. 2021, 1, 1–25. [Google Scholar] [CrossRef]
  16. Saad, L.; Aissani, A.; Chateauneuf, A.; Raphael, W. Reliability-Based Optimization of Direct and Indirect LCC of RC Bridge Elements under Coupled Fatigue-Corrosion Deterioration Processes. Eng. Fail. Anal. 2016, 59, 570–587. [Google Scholar] [CrossRef]
  17. Lu, X.; Xu, L.; Wei, K.; Xu, L. Transverse Seismic Damage Mode Identification of Deteriorating Simply-Supported Highway Bridges. Structures 2022, 38, 1529–1541. [Google Scholar] [CrossRef]
  18. Val, D.V.; Stewart, M.G.; Melchers, R.E. Effect of Reinforcement Corrosion on Reliability of Highway Bridges. Eng. Struct. 1998, 20, 1010–1019. [Google Scholar] [CrossRef]
  19. Duprat, F. Reliability of RC Beams under Chloride-Ingress. Constr. Build. Mater. 2007, 21, 1605–1616. [Google Scholar] [CrossRef]
  20. Tu, B.; Dong, Y.; Fang, Z. Time-Dependent Reliability and Redundancy of Corroded Prestressed Concrete Bridges at Material, Component, and System Levels. J. Bridge Eng. 2019, 24, 04019085. [Google Scholar] [CrossRef]
  21. Yogalakshmi, N.J.; Rao, K.B.; Anoop, M.B. Safety Assessment of In-Service Reinforced Concrete T-Girders of Bridge Decks. Struct. Concr. 2017, 18, 733–746. [Google Scholar] [CrossRef]
  22. Kim, T.H. Seismic Performance Assessment of Deteriorated Two-Span Reinforced Concrete Bridges. Int. J. Concr. Struct. Mater. 2022, 16, 4. [Google Scholar] [CrossRef]
  23. Ghosh, P.; Konecny, P.; Lehner, P.; Tikalsky, P.J. Probabilistic Time-Dependent Sensitivity Analysis of HPC Bridge Deck Exposed to Chlorides. Comput. Concr. 2017, 19, 305–313. [Google Scholar] [CrossRef]
  24. Hajkova, K.; Smilauer, V.; Jendele, L.; Cervenka, J. Prediction of reinforcement corrosion due to chloride ingress and its effects on serviceability. Eng. Struct. 2018, 174, 768–777. [Google Scholar] [CrossRef]
  25. Zhou, J.; Liu, Y.; Yi, J. Effect of Uneven Multilane Truck Loading of Multigirder Bridges on Component Reliability. Struct. Concr. 2020, 21, 1644–1661. [Google Scholar] [CrossRef]
  26. Liberati, E.A.P.; Nogueira, C.G.; Leonel, E.D.; Chateauneuf, A. Nonlinear Formulation Based on FEM, Mazars Damage Criterion and Fick’s Law Applied to Failure Assessment of Reinforced Concrete Structures Subjected to Chloride Ingress and Reinforcements Corrosion. Eng. Fail. Anal. 2014, 46, 247–268. [Google Scholar] [CrossRef]
  27. Tu, B.; Fang, Z.; Dong, Y.; Frangopol, D.M. Time-Variant Reliability Analysis of Widened Deteriorating Prestressed Concrete Bridges Considering Shrinkage and Creep. Eng. Struct. 2017, 153, 1–16. [Google Scholar] [CrossRef]
  28. Sajedi, S.; Huang, Q. Reliability-Based Life-Cycle-Cost Comparison of Different Corrosion Management Strategies. Eng. Struct. 2019, 186, 52–63. [Google Scholar] [CrossRef]
  29. Ballim, Y.; Reid, J.C. Reinforcement Corrosion and the Deflection of RC Beams—An Experimental Critique of Current Test Methods. Cement Concr. Comp. 2003, 25, 625–632. [Google Scholar] [CrossRef]
  30. Malumbela, G.; Moyo, P.; Alexander, M. Longitudinal Strains and Stiffness of RC Beams under Load as Measures of Corrosion Levels. Eng. Struct. 2012, 35, 215–227. [Google Scholar] [CrossRef]
  31. Li, C.; Hao, H.; Li, H.; Bi, K. Seismic Fragility Analysis of Reinforced Concrete Bridges with Chloride Induced Corrosion Subjected to Spatially Varying Ground Motions. Int. J. Struct. Stab. Dyn. 2016, 16, 1550010. [Google Scholar] [CrossRef]
  32. Sun, J.; Huang, Q.; Ren, Y. Performance deterioration of corroded RC beams and reinforcing bars under repeated loading. Constr. Build. Mater. 2015, 96, 404–415. [Google Scholar] [CrossRef]
  33. ACI 3188-05; Building Code Requirements for Structural Concrete and Commentary. American Concrete Institute: Farmington Hills, MI, USA, 2005.
  34. Ma, Y. Reliability Assessment and Life Prediction for Existing RC Bridges Under Multi-Source Uncertainties. Ph.D. Thesis, Changsha University of Science & Technology, Changsha, China, 2014. (In Chinese). [Google Scholar]
  35. Cui, J.; Xie, H.; Cui, P.; Kim, D. Seismic Performance Evaluation of Existing RC Structures Based on Hybrid Sensing Method. Neural Comput. Appl. 2018, 31, 4653–4663. [Google Scholar] [CrossRef]
  36. Suo, Q.; Stewart, M.G. Corrosion Cracking Prediction Updating of Deteriorating RC Structures using Inspection Information. Reliab. Eng. Syst. Safe 2009, 94, 1340–1348. [Google Scholar] [CrossRef]
  37. Specification for Mix Proportion Design of Ordinary Concrete, 1st ed.; China Architecture & Building Press: Beijing, China, 2011. (In Chinese)
  38. Stewart, M.G. Mechanical Behaviour of Pitting Corrosion of Flexural and Shear Reinforcement and Its Effect on Structural Reliability of Corroding RC Beams. Struct. Saf. 2009, 31, 19–30. [Google Scholar] [CrossRef]
  39. Vu, K.A.T.; Stewart, M.G. Structural Reliability of Concrete Bridges Including Improved Chloride-Induced Corrosion Models. Struct. Saf. 2000, 22, 313–333. [Google Scholar] [CrossRef]
  40. Stewart, M.G.; Al-Harthy, A. Pitting Corrosion and Structural Reliability of Corroding RC Structures: Experimental Data and Probabilistic Analysis. Reliab. Eng. Syst. Safe 2008, 93, 373–382. [Google Scholar] [CrossRef]
  41. General Code for Design of Highway Bridges and Culverts, 1st ed.; China Communications Press: Beijing, China, 2015. (In Chinese)
  42. Guo, T.; Chen, Z.; Liu, T.; Han, D. Time-Dependent Reliability of Strengthened PSC Box-Girder Bridge using Phased and Incremental Static Analyses. Eng. Struct. 2016, 117, 358–371. [Google Scholar] [CrossRef]
  43. Mao, S.; Tang, Y. Bayesian Statistics, 2nd ed.; China Statistics Press: Beijing, China, 2012; pp. 82–87. (In Chinese) [Google Scholar]
Figure 1. The most unfavorable position and LLD influence line of Beam 1.
Applsci 12 07028 g001
Figure 2. Flow chart of reliability calculation.
Applsci 12 07028 g002
Figure 3. Appearance of typical simply supported T-beam bridge: (a) profile of Xiaobai Bridge; (b) cross-sectional dimension drawing of T-beam.
Applsci 12 07028 g003
Figure 4. Field test diagram: (a) detection of concrete strength; (b) detection of concrete cover thickness.
Applsci 12 07028 g004
Figure 5. Vehicle load arrangement: (a) load vehicle layout along the bridge and measuring point layout; (b) transverse arrangement of load vehicle; (c) field test.
Applsci 12 07028 g005
Figure 6. Time-dependent curves of mean value and standard deviation of LLD coefficients: (a) Beam 1; (b) Beam 2.
Applsci 12 07028 g006
Figure 7. Influence analysis of LLD variation caused by reinforcement corrosion and inspection data updating on reliability.
Applsci 12 07028 g007
Figure 8. Time-dependent reliability of simply supported T-beam bridge: (a) Beam 1; (b) Beam 2.
Applsci 12 07028 g008
Table 1. Detection data of concrete strength and concrete cover thickness of simply supported T-beam bridge.
Number Concrete Cover Thickness/mmConcrete Strength/MPa
Beam 1Beam 2Beam 3Beam 4Beam 5Beam 1Beam 2Beam 3Beam 4Beam 5
128.132.529.929.632.524.635.834.135.333.3
227.930.430.730.233.128.830.636.627.926.1
329.330.329.633.529.533.630.028.130.232.6
425.632.729.830.633.227.736.334.529.329.5
527.529.830.031.330.526.929.928.836.531.4
628.532.829.431.531.432.136.734.537.328.3
727.030.928.430.730.928.430.833.231.428.7
827.530.131.933.731.534.635.627.934.133.2
928.930.131.832.929.932.328.135.533.735.8
1027.329.229.831.930.527.630.833.835.028.9
Table 2. Probability distribution and statistical parameters of influencing factors of simply supported T-beam bridge.
ParameterUnitDispersion PatternMean ValueCoefficient of VariationExplanationReference
C s %Lognormal distribution0.120.10Chloride concentration on concrete surface[42]
D c m2/yearLognormal distribution0.50.10Diffusion coefficient of chloride[42]
C c r %Lognormal distribution0.0450.10Critical chloride centration[42]
f u 0 MPaNormal distribution3350.0719Tensile strength of reinforcement steel[40]
D 0 mmNormal distribution160.035Initial diameter of reinforcement steel[40]
mmNormal distribution320.035[40]
Table 3. Bayesian estimation results of concrete strength and cover thickness of the simply supported T-beam bridge.
Influence Factor Beam 1Beam 2Beam 3Beam 4Beam 5
Concrete strength/MPaStatisticMean value29.732.532.733.130.8
Standard deviation3.2743.2373.2033.1902.952
Bayesian estimationMean value29.732.532.733.130.8
Standard deviation2.3532.3512.3492.3482.335
Concrete cover thickness/mmStatisticMean value27.830.930.131.631.3
Standard deviation1.0501.3071.0861.4061.295
Bayesian estimationMean value27.830.930.131.631.3
Standard deviation1.2281.2381.2291.2431.237
Publisher’s Note: MDPI stays neutral with regard to jurisdictional claims in published maps and institutional affiliations.

