1. Introduction
Binary decision models have been the subject of renewed research in recent years [
1,
2,
3]. Kirman [
4] explained the process of ant social herding using a simple model. The fat-tail distribution in the security market is well known [
5]. In this article, the beauty competition of Keynes [
6] is kept in mind, and the fat tail observed for price fluctuations is reproduced.
If you put two mounds of sugar with identical conditions near an ants’ nest, at which one will the ants congregate? We know from experiments that the ants do not congregate in equal numbers at the two sugar mounds and that a large bias occurs toward one of the mounds [
7,
8]. Biologists believe that this is because the ant that finds the sugar first invites its companions, causing a chain reaction that produces the bias. Economists, on seeing the biased outcome, might surmise that the ants were not indifferent to the two mounds of sugar. However, even if the ants are completely indifferent to the two mounds of sugar, this sort of bias can still occur. Kirman [
4] explained the process of ant social herding with a simple model and conducted an interesting simulation.
The presence of a fat-tail distribution in the security market is well known [
5], but its causes are still not fully understood. Realistically, many small price trends that alternate quote spreads repeatedly reduce the mean and the variance of the price fluctuation distribution; as a result, the fat tail appears. However, neither microeconomics nor behavioral economics have provided a sufficient theoretical explanation. Nirei, Takaoka and Watanabe [
9] tried to connect the fat-tail distribution to microeconomic foundations, but there are many strong assumptions that are indispensable to the model such as the monotone likelihood ratio property(MLRP), risk neutrality, a demand curve that bends to the upper right and an automatic supply; furthermore, the theoretical structure of the model is extremely complex. In contrast to their study, the aim of this article is to clarify them with a very simple model. Using a natural computing algorithm called Kirman’s Ant Model, I conducted a time series analysis of finance that appears when simplifying the human “behavior of imitating others”. The results show that natural fat tails appear. There may be other unknown causes, but it is certain that fat tails do appear by imitating others.
Following the rise of game theory, the traditional assumption in economics that economic agents mutually and independently make rational decisions is no longer accepted. Although not directly dealing with the fat-tail phenomenon like Nirei, Takaoka and Watanabe [
9], Chamley [
10] comprehensively introduced economic models in a similar manner based on social interaction using Bayesian rational decision making. This has been a dominant theme in economic research along with the application of artificial intelligence; however, in this article, the model by Kirman [
4], which seemingly comprises only extremely simple noise and interaction, is applied to the trading process in a security market model where traders undergo a phase transition.
Recent research in neuroscience has shown that noise plays a positive role in systems. Anderson et al. [
11] discovered that the responsiveness of nerves is enhanced by the application of noise when the stimulus is weak. The phenomenon of weak information being detected by noise is called stochastic resonance, and it can be found in various physical systems. Stemmler et al. [
12] noted that in the mathematical model of the cerebral cortex, lateral input from the peripheral circuits can be a source of noise for stochastic resonance. Mao et al. [
13] and Cossart et al. [
14] found synchronization for noise that was conventionally thought to be random. In Izhikevich et al. [
15], in the artificial neural circuitry from a model of neurons consisting of 0.1 million cells, individual neurons that showed random activity in the initial period gradually began repeating specific activity patterns. Beggs and Plenz [
16] interpreted this as a self-organizing criticality phenomenon of nerve cells and called the phenomenon of neural synchronization a neuronal avalanche. Diesmann et al. [
17] called the synchronization of individual nerve activity a synfire chain, and Ikegaya et al. [
18] considered that it plays a role in stabilizing the behavior of cortical circuits. Moreover, interestingly, as noted by Fujisawa et al. [
19], it is possible that the macro behavior of this neural activity corresponds to the phase transition of the synchronization circuit.
Studies on empathetic systems cover how humans share common emotions with each other and recognize others’ emotional states. The last two decades have witnessed enormous growth in the neuroscience of empathy. Zaki and Ochsner [
20] surveyed research in this domain with an eye toward evaluating its strengths and weaknesses. They took stock of the notable progress made by early research in characterizing the neural systems supporting two empathetic sub-processes: sharing others’ internal states and explicitly considering those states. Brass and Heyes [
21] reported the recent research in cognitive neuroscience, stimulated by the discovery of mirror neurons. Imitation is based on the automatic activation of motor representations by movement observation. These externally triggered motor representations are then used to reproduce the observed behavior. This imitative capacity depends on learned perceptual motor links. The father of economics, Adam Smith [
22], understood as no other that the pursuit of self-interest needs to be tempered by “fellow feeling”. However, today’s economics focuses exclusively on the rational behavior of egocentric economic agents and omits consideration of the existence and effects of empathy. Recent studies on empathetic systems support Smith’s idea.
In this article, by establishing a simple security market model and by applying the Ants’ Model of Kirman [
4], a stochastic binary decision model of traders in the security market who switch from long to neutral positions and vice versa is established. Then, a Markov chain simulation is carried out, and the fat tail observed for price fluctuations is reproduced. Identical to Kirman [
4] and Nirei, Takaoka and Watanabe [
9], the beauty competition of Keynes [
6] is kept in mind, and it is shown that a cause of the fat tail is the balance between independence and interdependence of the economic agents.
2. The Model
2.1. An Example of a Real Trading Process
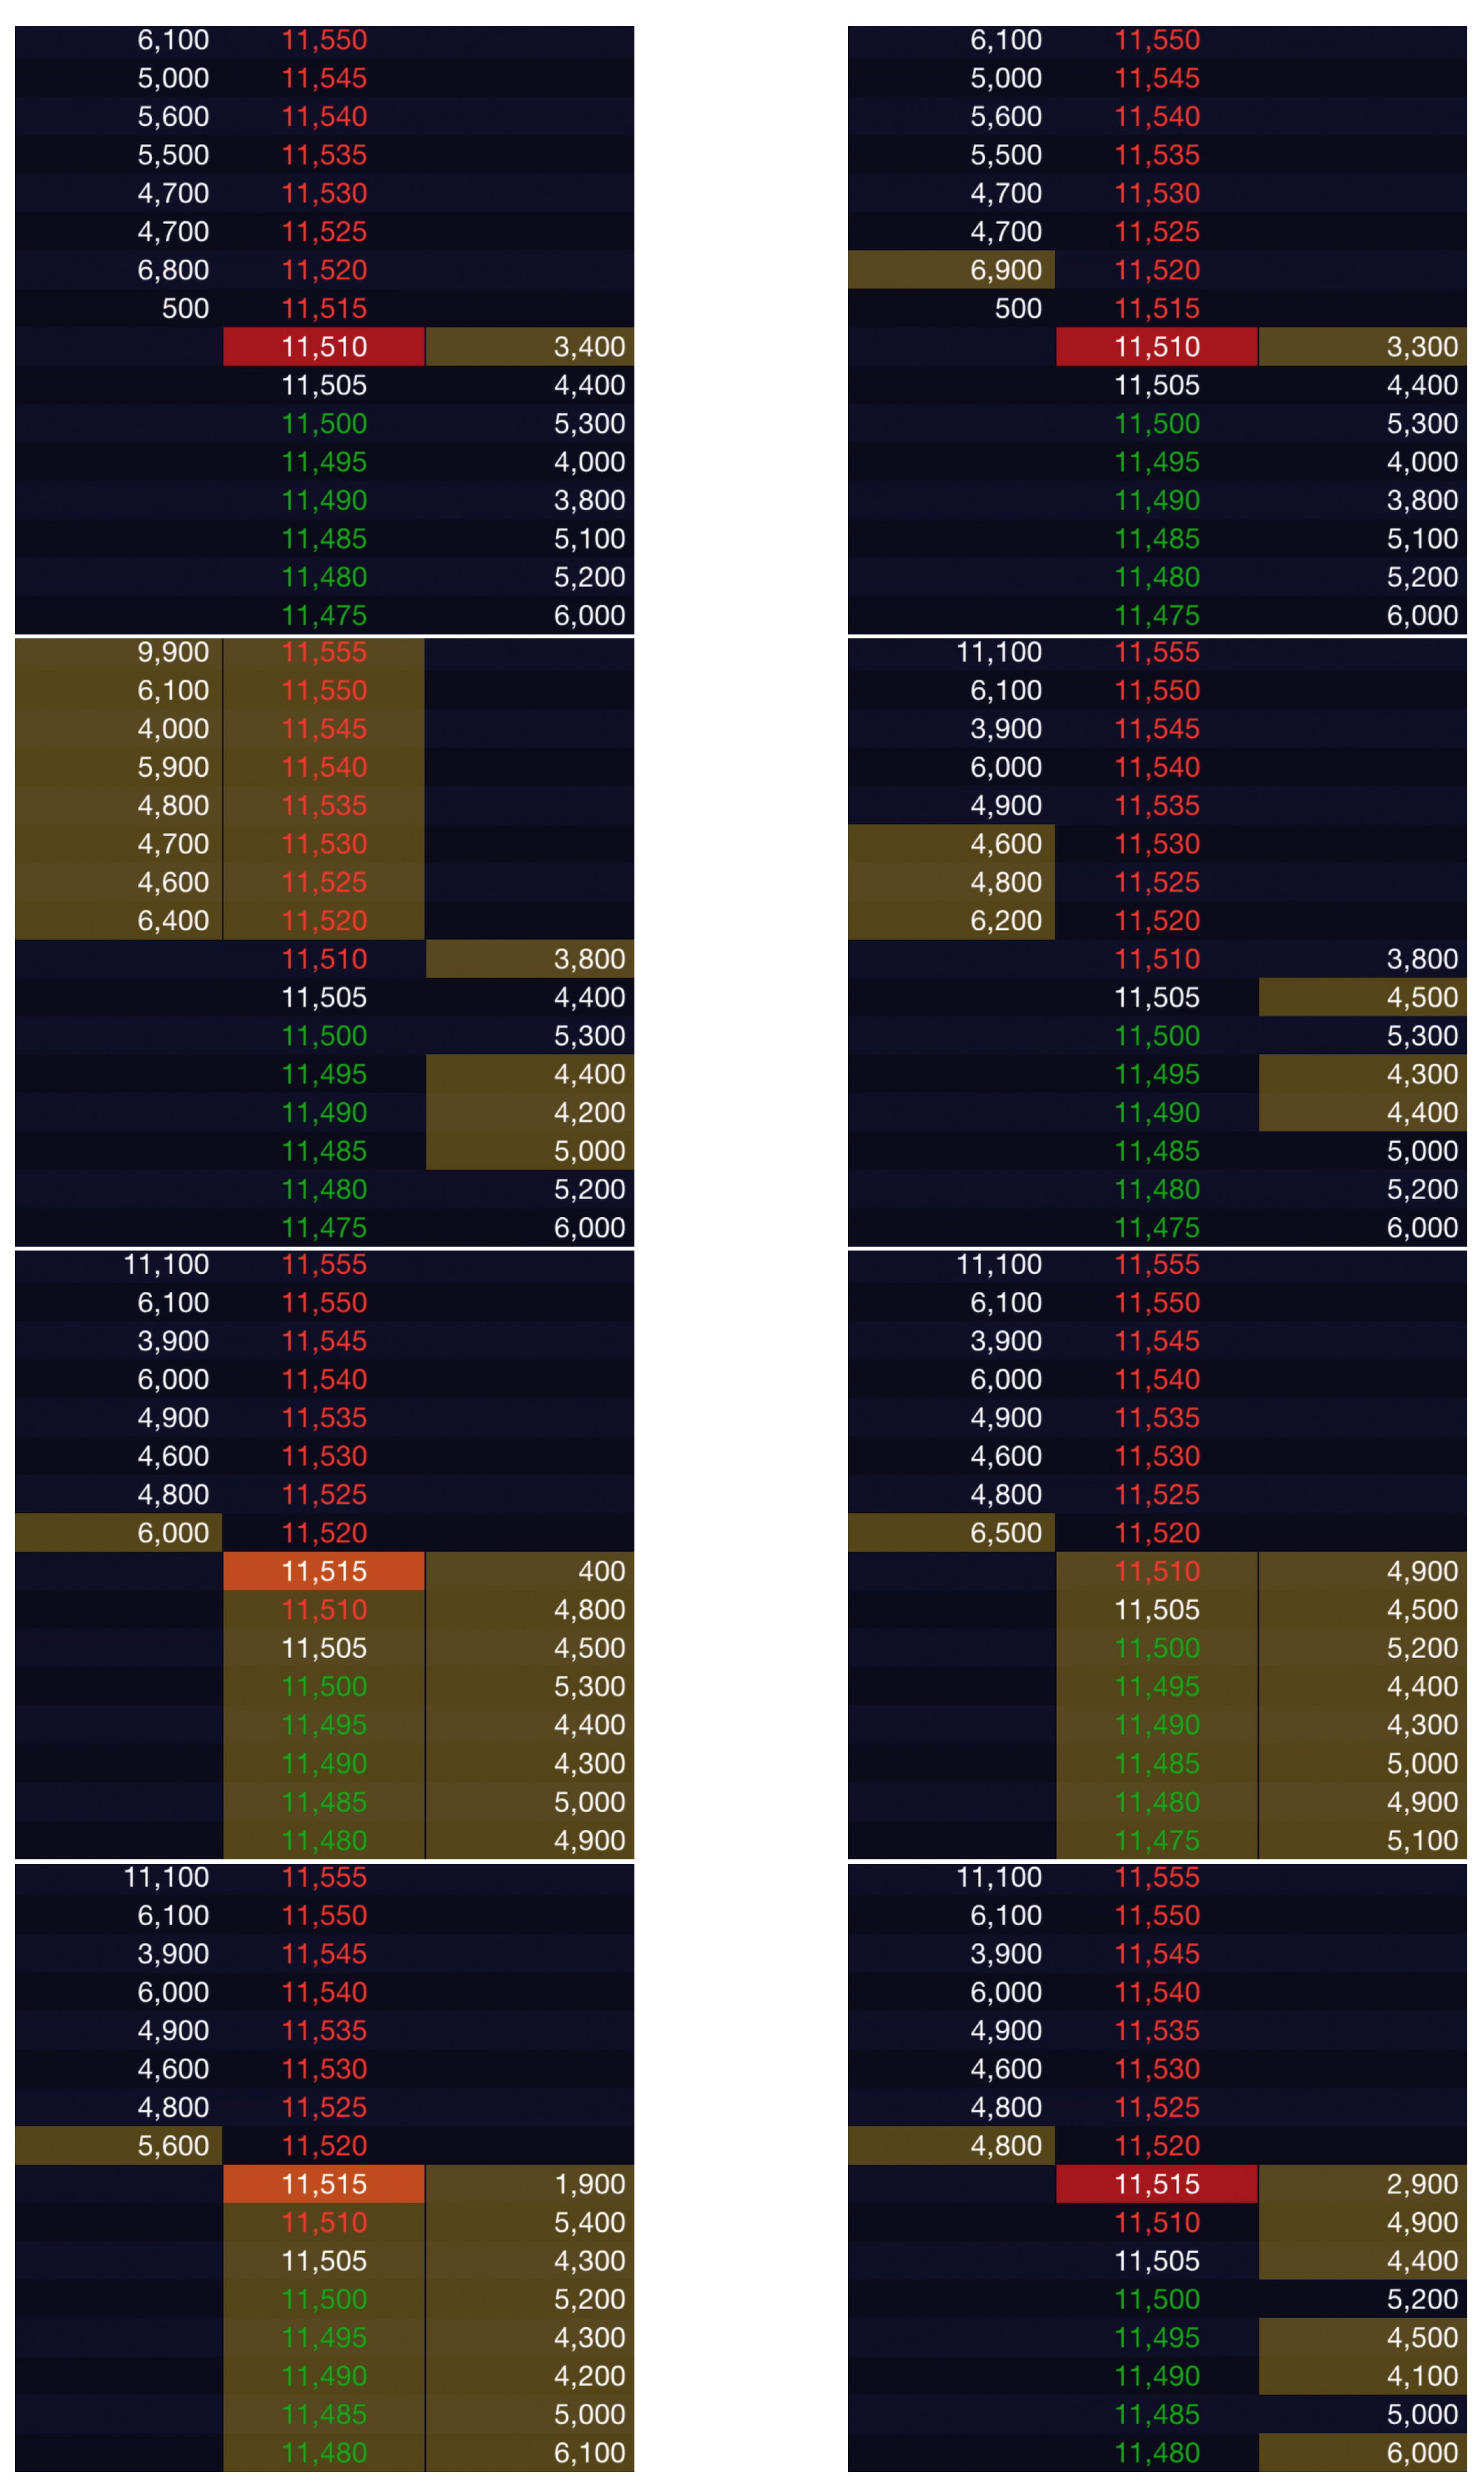
First, as a real-world example, let us look at the trading process of Sony (6758) stock at 9:22 a.m. on 28 June 2022 (
Figure 1). The buyers are on the right and the sellers are on the left. The focused area indicates the occurrence of orders. The transaction started with a trade at JPY 11,510, and the process ended with a trade at JPY 11,515.
This transaction process is common in financial markets, and I will construct a very simple model of the process below. The most important issue here is the question of the decision-making process by which each order is placed. We can assume that all traders, including artificial intelligence, observe this process. In other words, they make their own decisions by observing the behavior of other traders. Economics assumes economic agents making rational decisions independently of each other, but humans are easily influenced by each other’s actions and have a propensity to react automatically.
2.2. The Image of a Real Trading Board
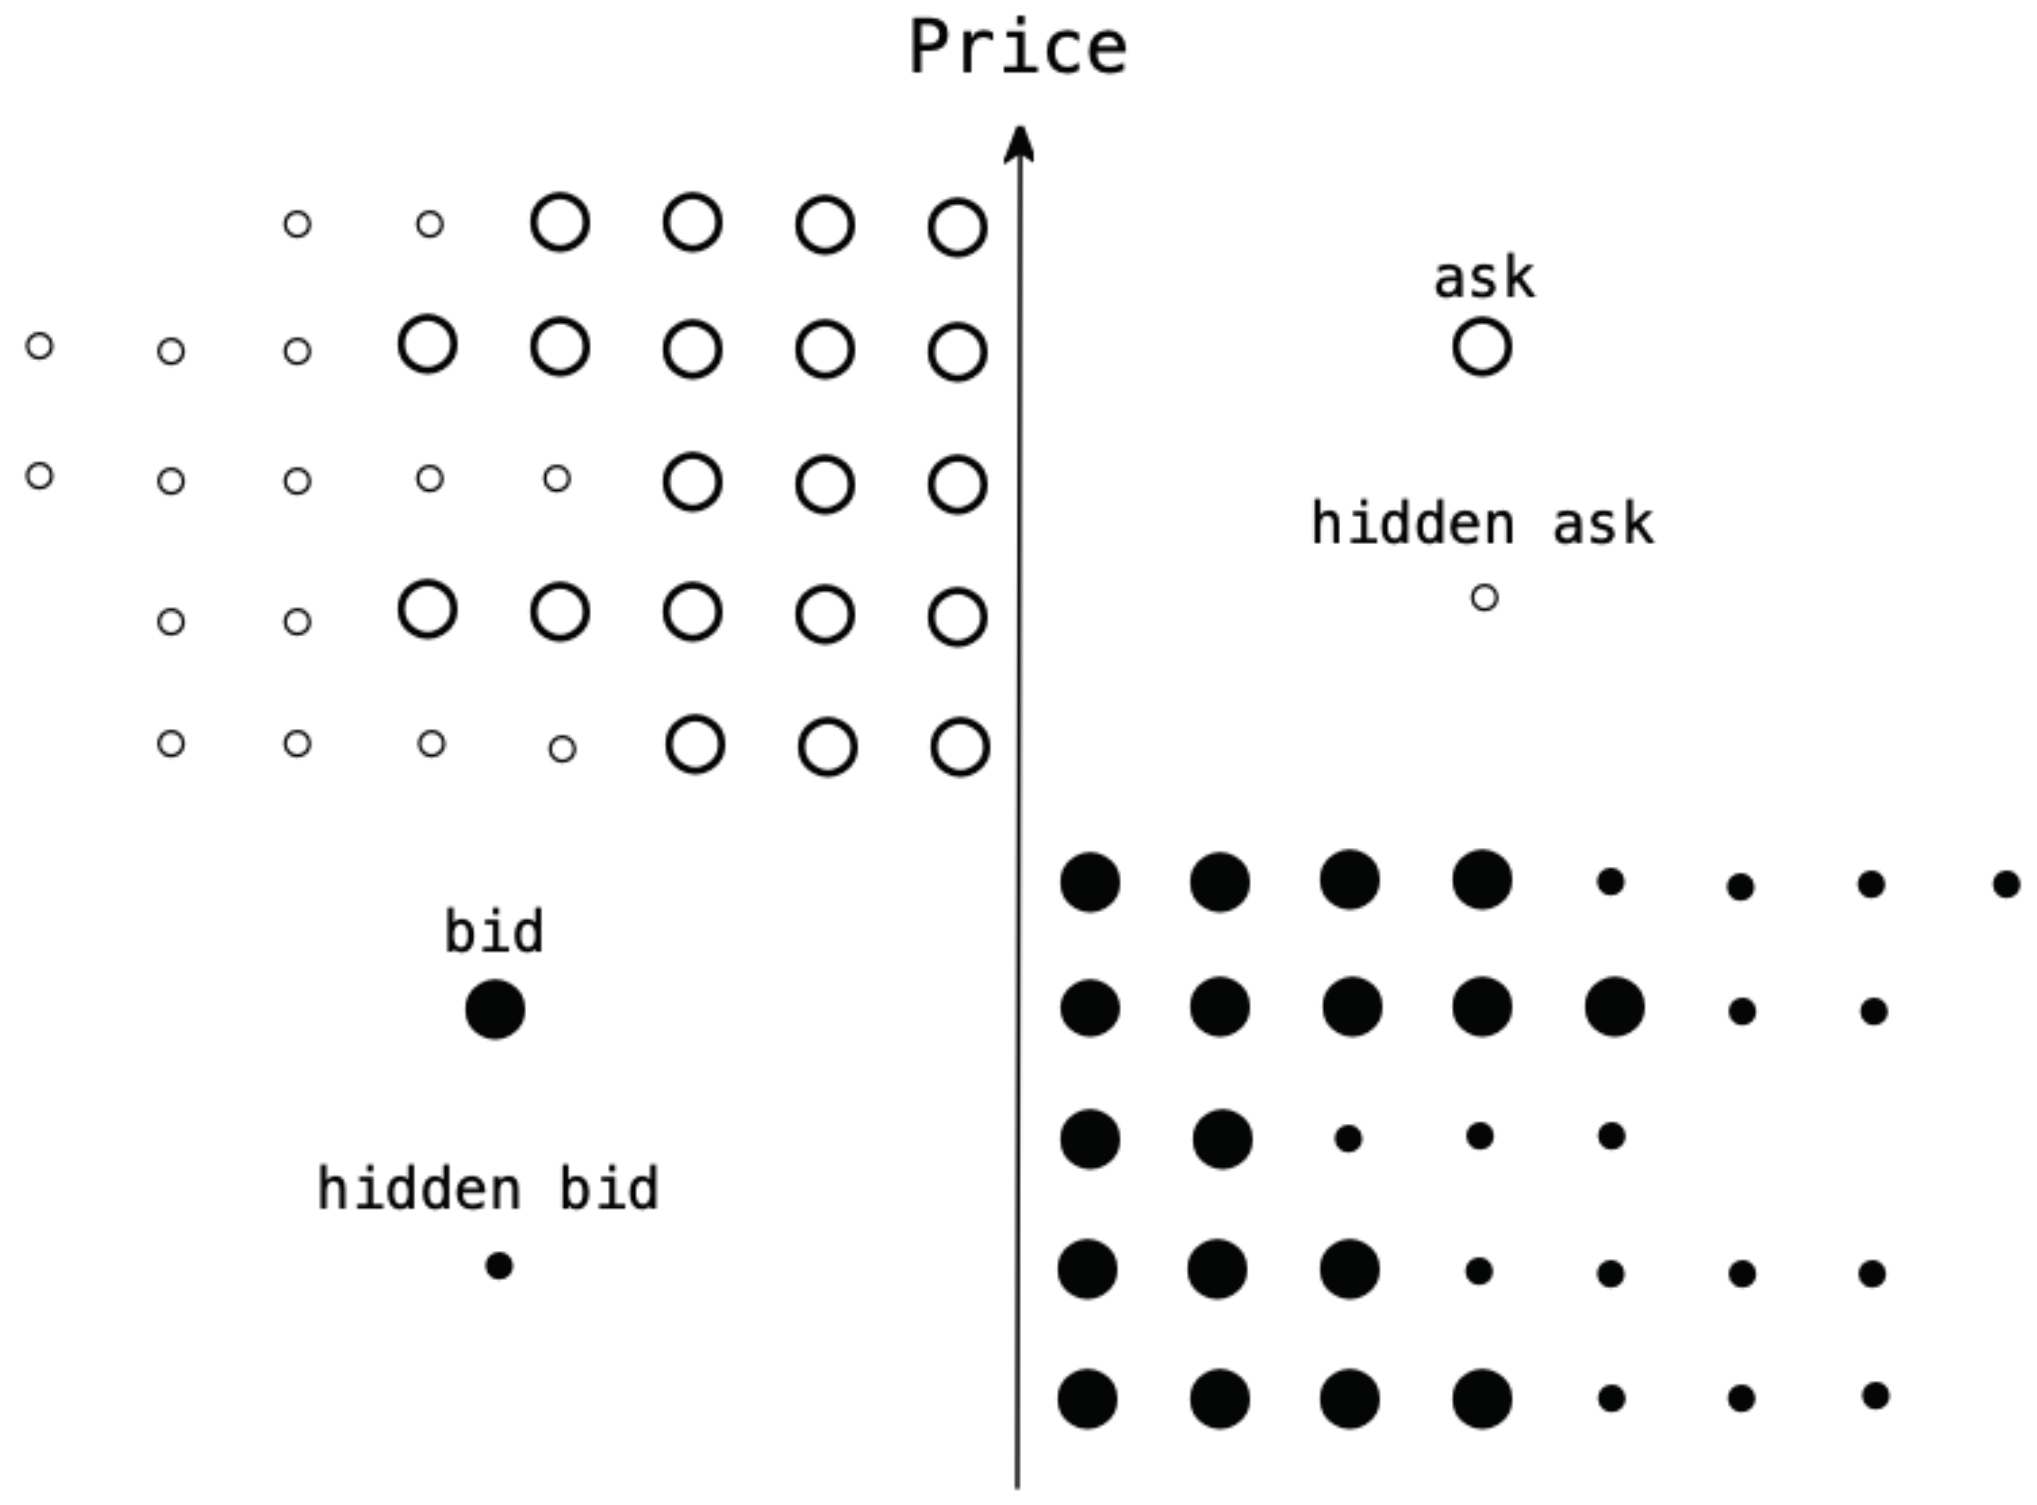
Figure 2 shows an image of a trading board in a state of equilibrium immediately before a share of a security is traded. In addition to displaying supply and demand with the large point limit prices on the board, potential supply and demand is displayed by the small points, and the traders are all in a state of subjective equilibrium. As this market is in a state of equilibrium, as pointed out by Black [
23], if nobody changes the subjective equilibrium for any reason, the market equilibrium is sustained without any trades being made. As considered by Fama [
5], if the security market is efficient in the strong or semi-strong sense, information on securities instantaneously changes the traders’ subjective equilibrium, and the differences in the speed with which they respond to the information decides who are the winners and losers. If the security market is efficient in the weak sense, the market equilibrium trends according to changes in the traders’ subjective equilibrium because of noise. The efficiency of a security market can be summarized as follows.
Information is incorporated correctly into the price.
Information is incorporated rapidly into the price.
Arbitrage deals profit if there are errors or delays.
Countless traders are always looking for arbitrage opportunities.
The arbitrage opportunity is gradually lost, and the market becomes more efficient.
While standard theory draws the story above, the transaction is not settled if there is no noise, and the price will remain distorted if the bias is strong. Furthermore, in the vicinity of subjective equilibrium, the psychological phases of traders are considered to have the opposite character because the value function [
24] is normally concave for gains, commonly convex for losses. This can be the cause of the trader’s phase transition.
2.3. A Simple Security Market Model
Let be a set of natural numbers, be a set of integers, and be a well-defined set of ordinals. Assume a simplified security market in which shares are traded by traders, and each trader can hold only one share. Suppose an initial state of equilibrium in which the N traders holding a share are sellers on the trading board, and other N traders who are not holding a share are buyers. Furthermore, assume traders in each respective group be aligned by quote .
Set the trading rules as follows. For each order, a trader who wishes to sell a share can sell it for the highest buying quote, and a trader who wants to buy a share can buy it for the lowest selling quote. The price expresses the voluntary quote , and when there are simultaneous orders, it is assumed that they are distributed using some method. After an order is executed, all traders who observed it line up again with their respective revised voluntary quotes .
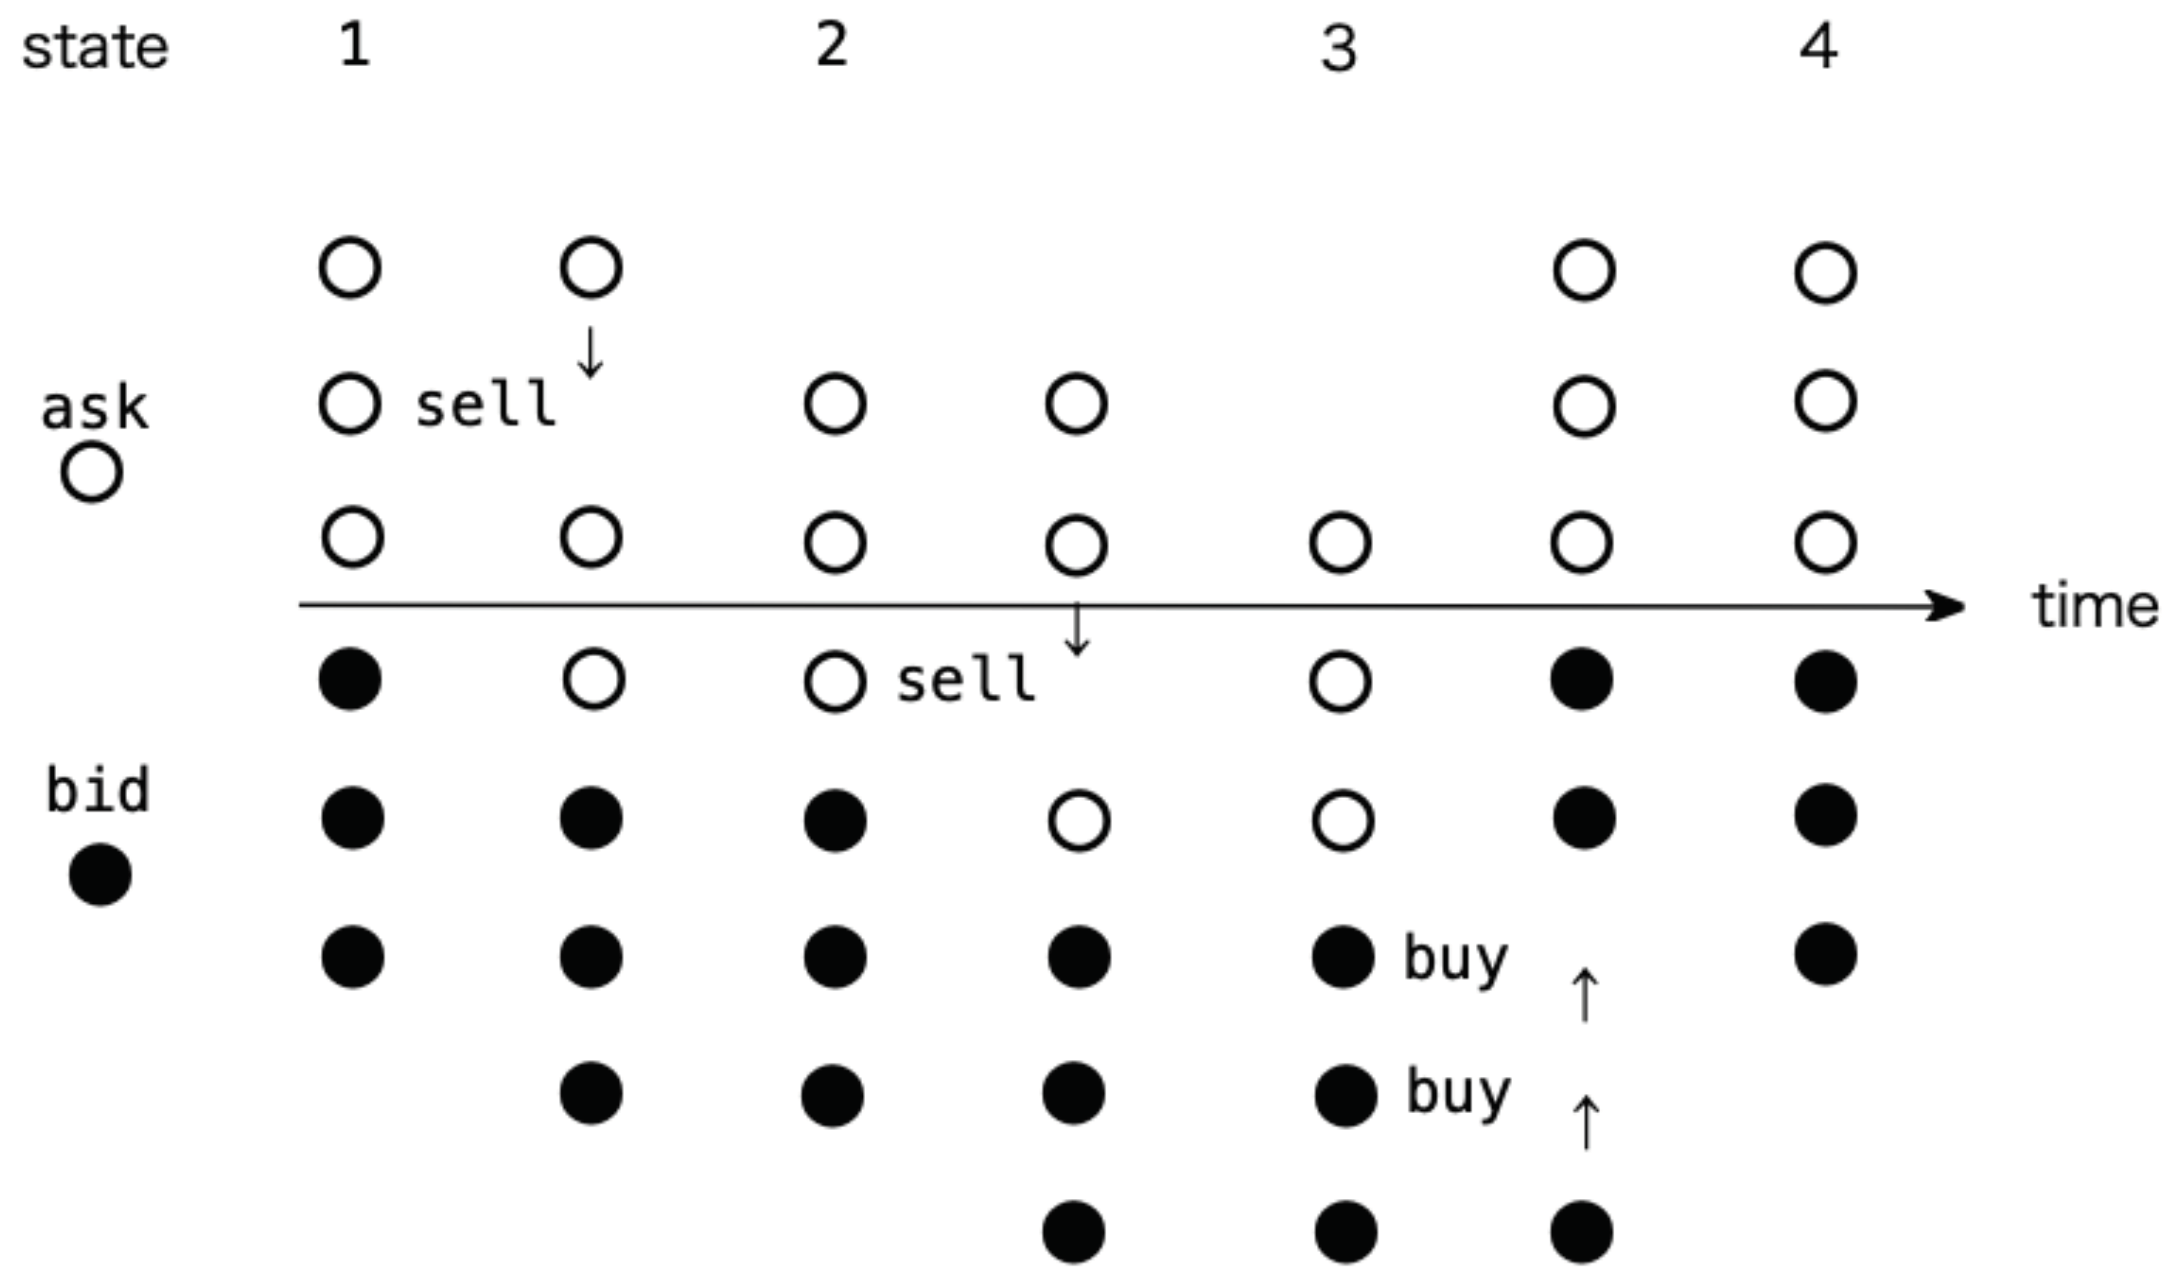
This model is a simplification, but it expresses an important quality of the actual security market; namely, there is a phase transition of traders in a subjective equilibrium where if a share is bought, that agent becomes a seller, and if it is sold, he becomes a buyer. The most important contribution of this study is this image of a simplified security market model. This transaction process in the security market is presented as .
First, in
Figure 3 in Market Equilibrium 1 where trades are not made, the subjective equilibrium of a trader who indicates the second sales quote changes for some reason, and she sells to the trader with the highest bid. The buying trader then changes into a seller, and simultaneously, the selling trader changes into a buyer; then, they line up with their respective voluntary quotes. As the price is voluntary, they are aligned by the order of the quotes, and the subsequent Market Equilibrium 2 is realized. In an actual security market, traders enter and leave. With the passage of time, the quote naturally settles in the vicinity of the market equilibrium. Furthermore, at the same limit price, multiple traders line up with different shares of a security, but the focus in this model is only on the traders’ phase transitions; thus, everything has been simplified. For simplicity, we set the quote
of each trader
and the definitions as follow.
Definition 1. The price of a security at time t is defined by an integer which is the difference of the buying shares and the selling shares with the initial price .
Definition 2. The trading volume of a security at time t is defined by an integer which is the maximum of the buying shares or the selling shares with the initial volume .
2.4. The Kirman Process
The ants’ model is applied to this simple security market model. According to Kirman [
4], it is assumed that the traders independently and identically change to long or neutral positions at the small probability
. Furthermore, when
, it is assumed that
. When the probability that the first person changes from neutral to long is
and the probability that the person returns to neutral is
,
When the first person changes from neutral to long, the probability
that the next person follows and changes to long is as follows:
where
. Moreover, it is assumed that the probability of returning to neutral is symmetrical. When the probability that long increases by one person is
and the probability of long will decrease by one person is
,
where the number of long traders
k does not change when
and
. When the size of the trader group becomes large and
, and
can be approximated by the density function of the symmetrical beta distribution [
3,
4].
3. The Simulation
Let the numbers of buying and selling shares at time t whose transition rates are dependent on (1) independently, then we can obtain the sample path of the price
and the trading volume
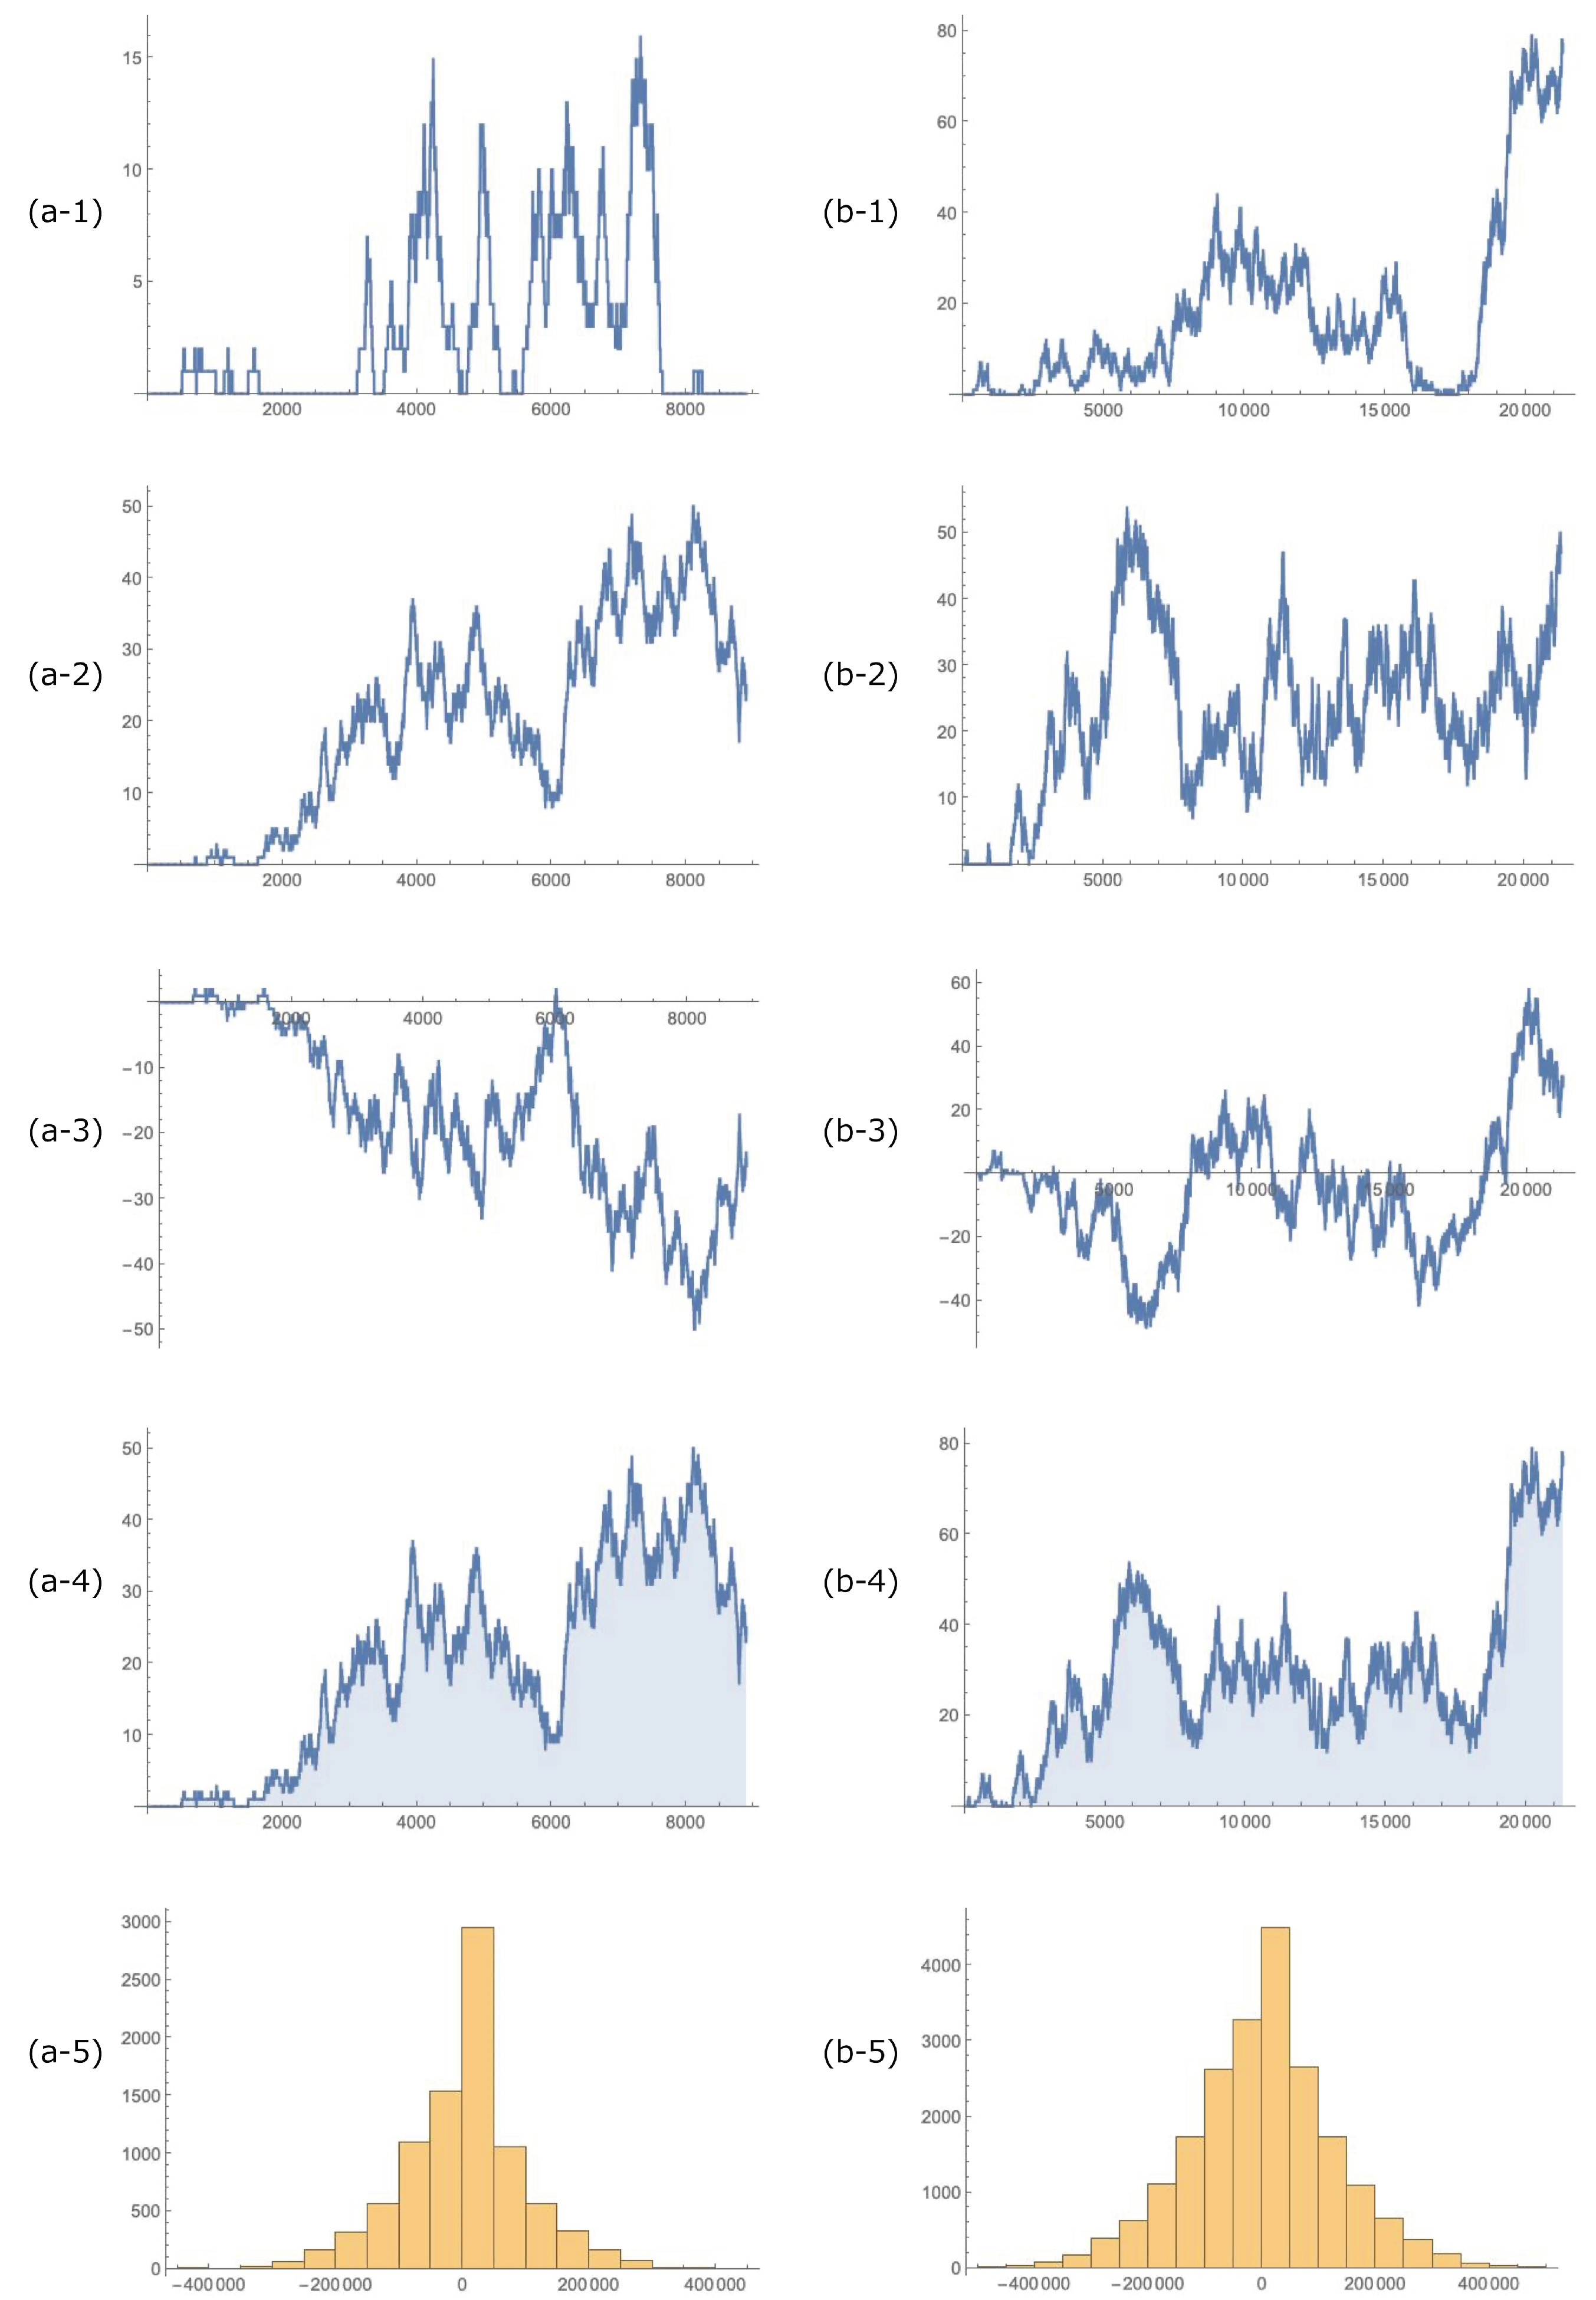
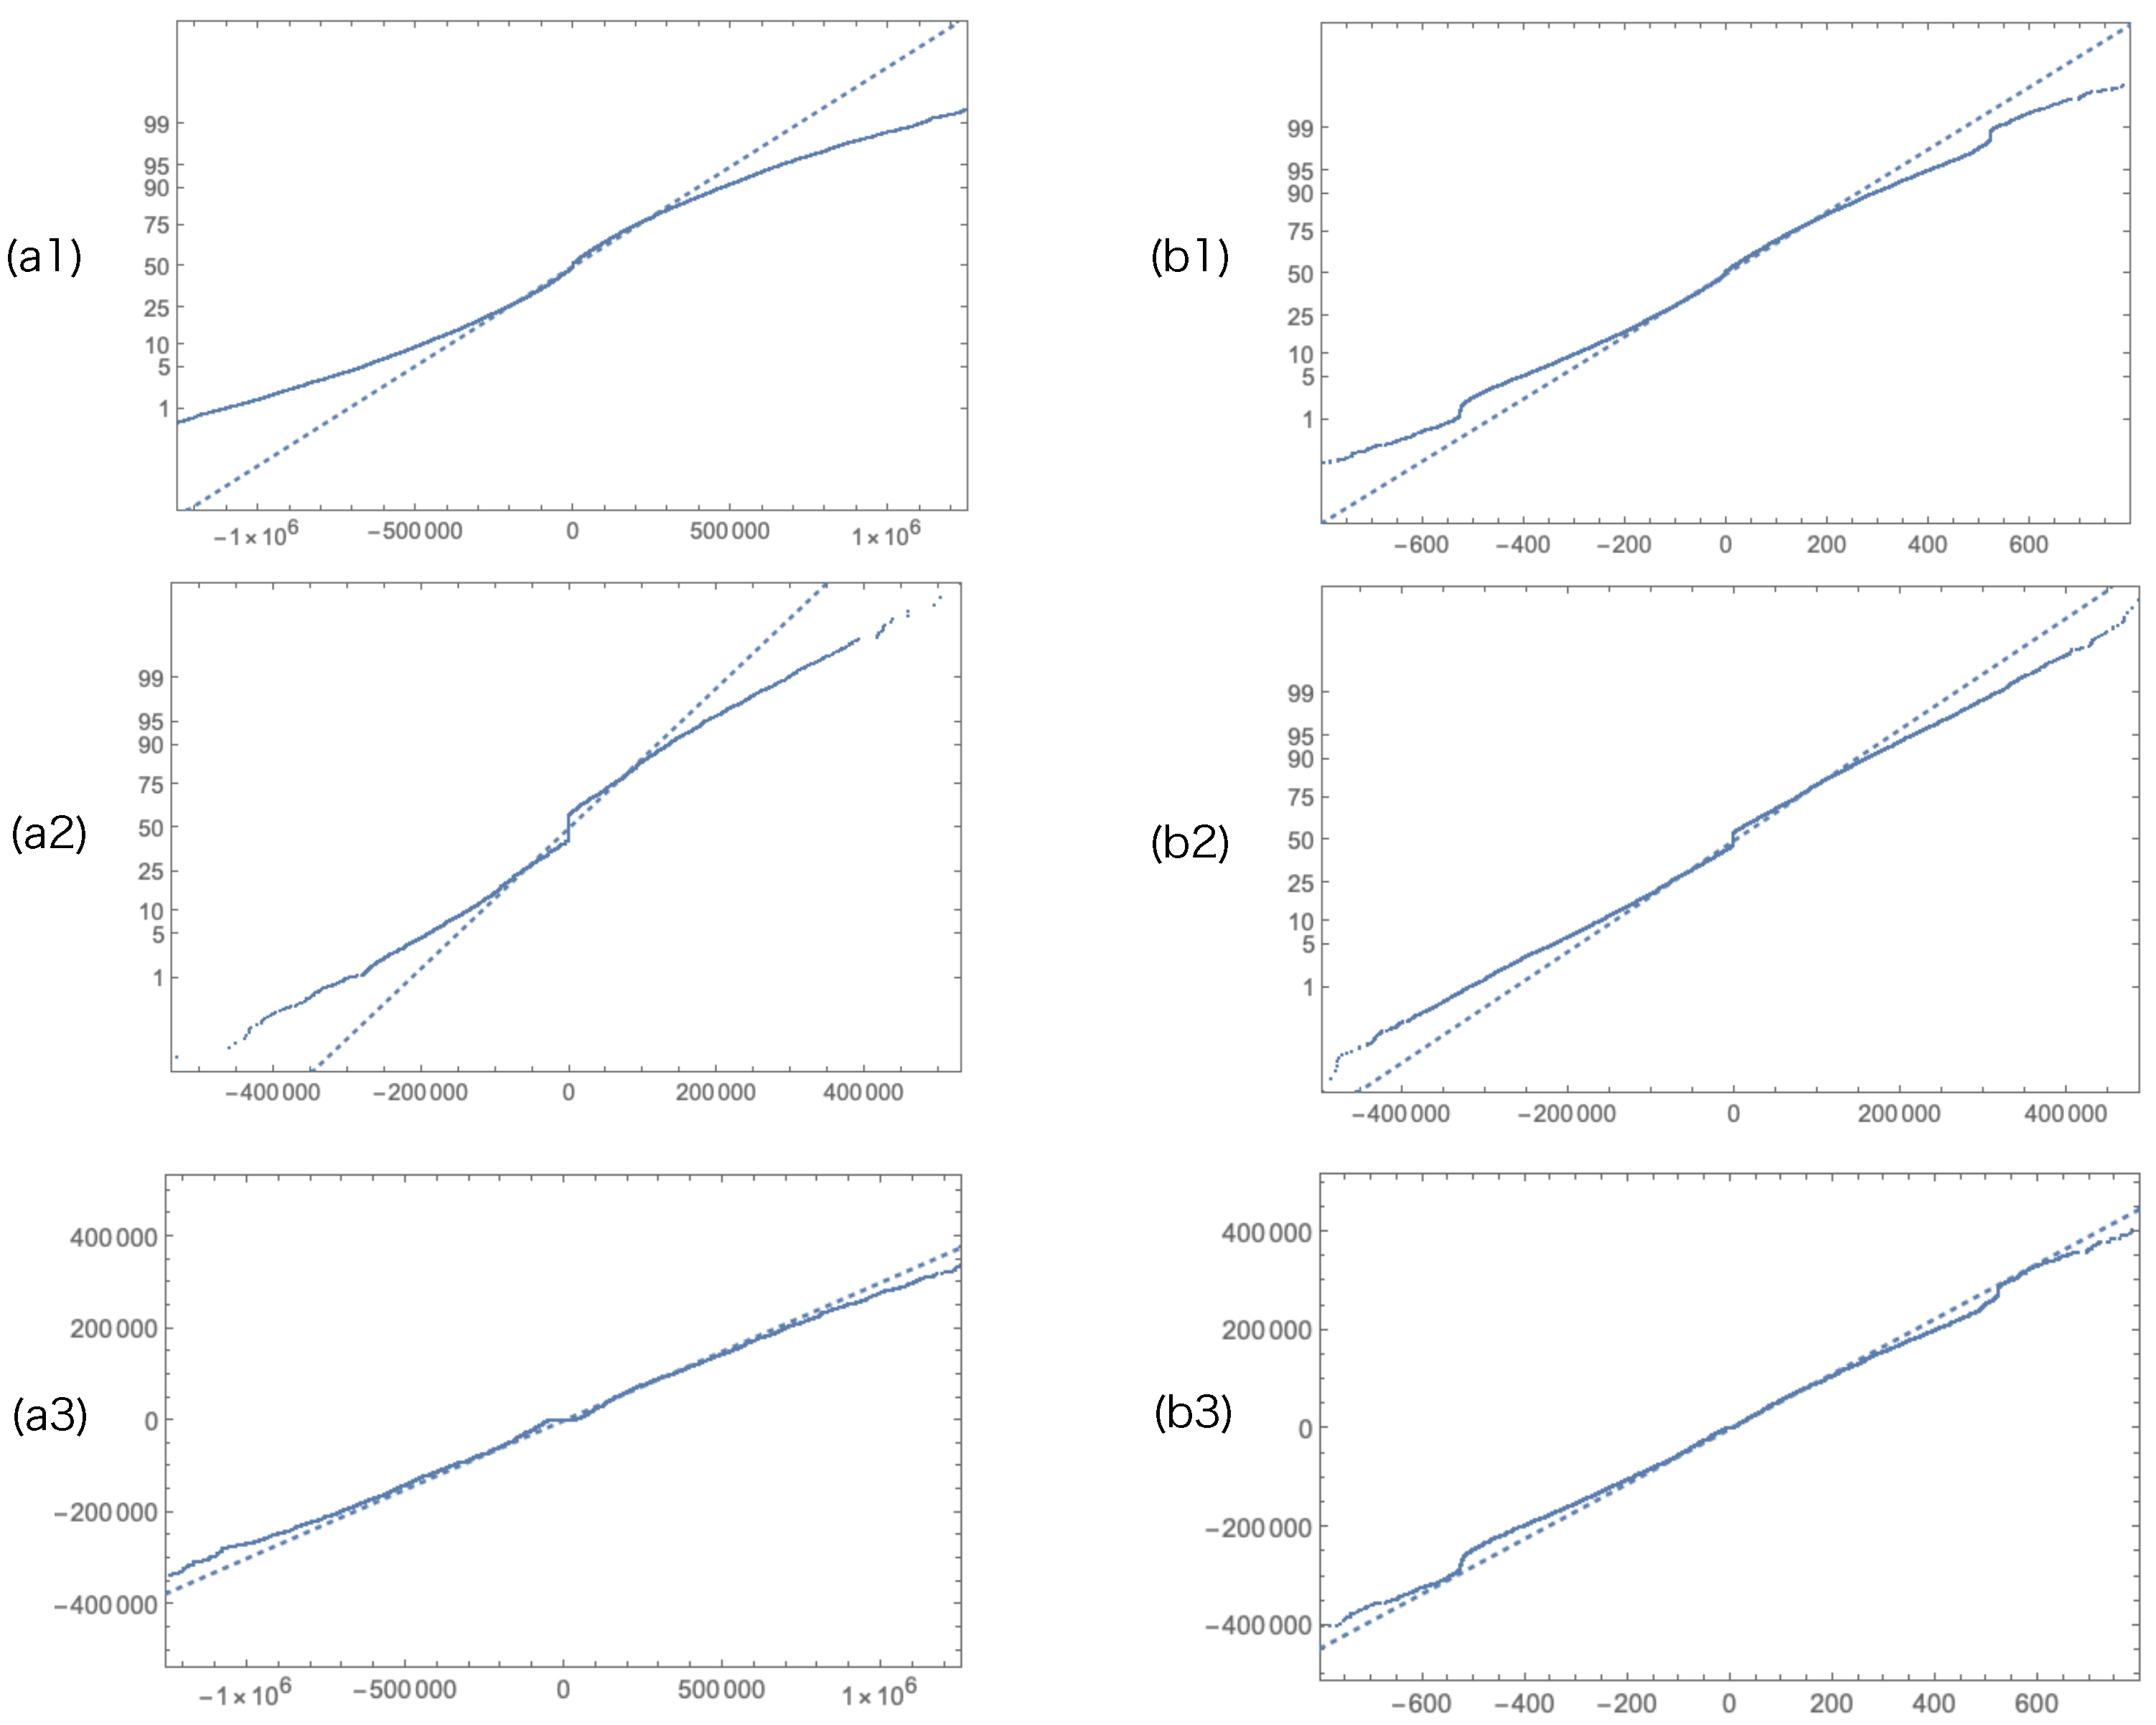
of a security. When this stochastic model is established and the Markov chain simulation is conducted, depending on the setting of the parameters, the fat tail observed for price fluctuations can be reproduced. Using a simulation of 100 shares, 200 traders, and 8897, 21,314 iterations for each trial, price fluctuations for every 20 trades are shown in
Figure 4(a2,b2). Depending on the parameter adjustments, this model can fit a variety of fat tails. For example, when the simulation is carried out with the parameters
for (a2),
for (b2), two results can be obtained that are a fairly good fit with a QQ Plot for TOPIX and the U.S.dollar/Japanese Yen shown in
Figure 4(a3,b3). Results of Markov chain simulations are shown in
Figure 5.
Although these results look good, a characteristic of the model’s simulation is that it is very sensitive to perturbations in the parameters; in addition, it is critical to pay attention to the fact that it is unstable, as coincidences strongly affect the results. The results of the simulation show that a fat tail appears even if the distribution of relative times is uniform; moreover, according to the setting of the parameters, the tail thins very slightly compared to a normal distribution. When the distribution of relative times is concentrated in the center, the price becomes natural white noise, and the tail becomes thicker as the distribution approaches the two extremes. This is also intuitively clear, but the combination of this critical point and the parameters is not analytically understood. See
Appendix A about the simulation codes.
4. Discussion
Trading in the financial markets has changed dramatically with the application of artificial intelligence. However, even if the AI is applied to trading, the nature of financial markets will not change. In fact, the fat-tail phenomenon in financial markets is universal, and its causes remain unexplored. The passive nature of human empathy is the key to solving the problem. Economics assumes economic agents making rational decisions independently of each other, but humans are easily influenced by each other’s actions and have a propensity to react automatically.
In an ideal efficient market where noise and bias have no effect and information is perfectly symmetrical, security prices should accurately reflect only information. However, if traders had perfectly and simultaneously symmetrical knowledge and information, including the asset valuation model, the transaction will not function because the traders’ valuation of the asset would be the same. While Black [
23] treated this “symmetry breaking” as noise, the effect of noise on security price is expected to be symmetrical based on its nature. Noise should be the basis for the Brownian motion of security prices [
25].
In the real world, the presence of a fat-tail distribution in the security market is well known [
5], but its causes are still not fully understood. Realistically, many small price trends that alternate quote spreads repeatedly reduce the mean and the variance of the price fluctuation distribution; as a result, the fat tail appears. However, neither microeconomics nor behavioral economics have provided a sufficient theoretical explanation. The aim of this article is to clarify them by a simple model.
Recent research in neuroscience has shown that noise plays a positive role in systems. The traditional assumption in economics that economic agents mutually and independently make rational decisions is no longer accepted. There are economic models based on social interaction using Bayesian rational decision making. This has been a dominant theme in economic research along with the application of artificial intelligence. In contrast to these studies, the ants’ model, which seemingly comprises only extremely simple noise and interaction, can be applied to the trading process in a security market model where traders undergo a phase transition. In the vicinity of subjective equilibrium, the psychological phases of traders are considered to have the opposite character because the value function [
24] is normally concave for gains, commonly convex for losses. This can be the cause of the trader’s phase transition.
Studies on empathetic systems cover how humans share common emotions with each other and recognize others’ emotional states. Imitation is based on the automatic activation of motor representations by movement observation. These externally triggered motor representations are then used to reproduce the observed behavior. This imitative capacity depends on learned perceptual motor links. The father of economics, Adam Smith, understood as no other that the pursuit of self-interest needs to be tempered by “fellow feeling." However, today’s economics focuses exclusively on the rational behavior of egocentric economic agents and omits consideration of the existence and effects of empathy. Recent studies on empathetic systems support Smith’s idea.
In this article, introducing Kirman’s probability into the simple security market model, it was shown that a cause of the fat tail is the balance between independence and interdependence of the economic agents. Although only TOPIX and USD/JPY returns are simulated, we can apply this simple model simulation to any other price movements. It is important for us to understand the character of noise in the security market. This can be thought of as a natural outgrowth of our capacity for empathy [
22,
26,
27,
28].
However, this model is a limited discrete stochastic model; thus, analytical findings cannot be obtained on the characteristics of the parameters. Moreover, if the asymmetric character of value function [
24] is true, it should be included in this model and simulation.


