
Incorporating New Technologies in EEIO Models


Abstract
:1. Introduction
2. Methodology
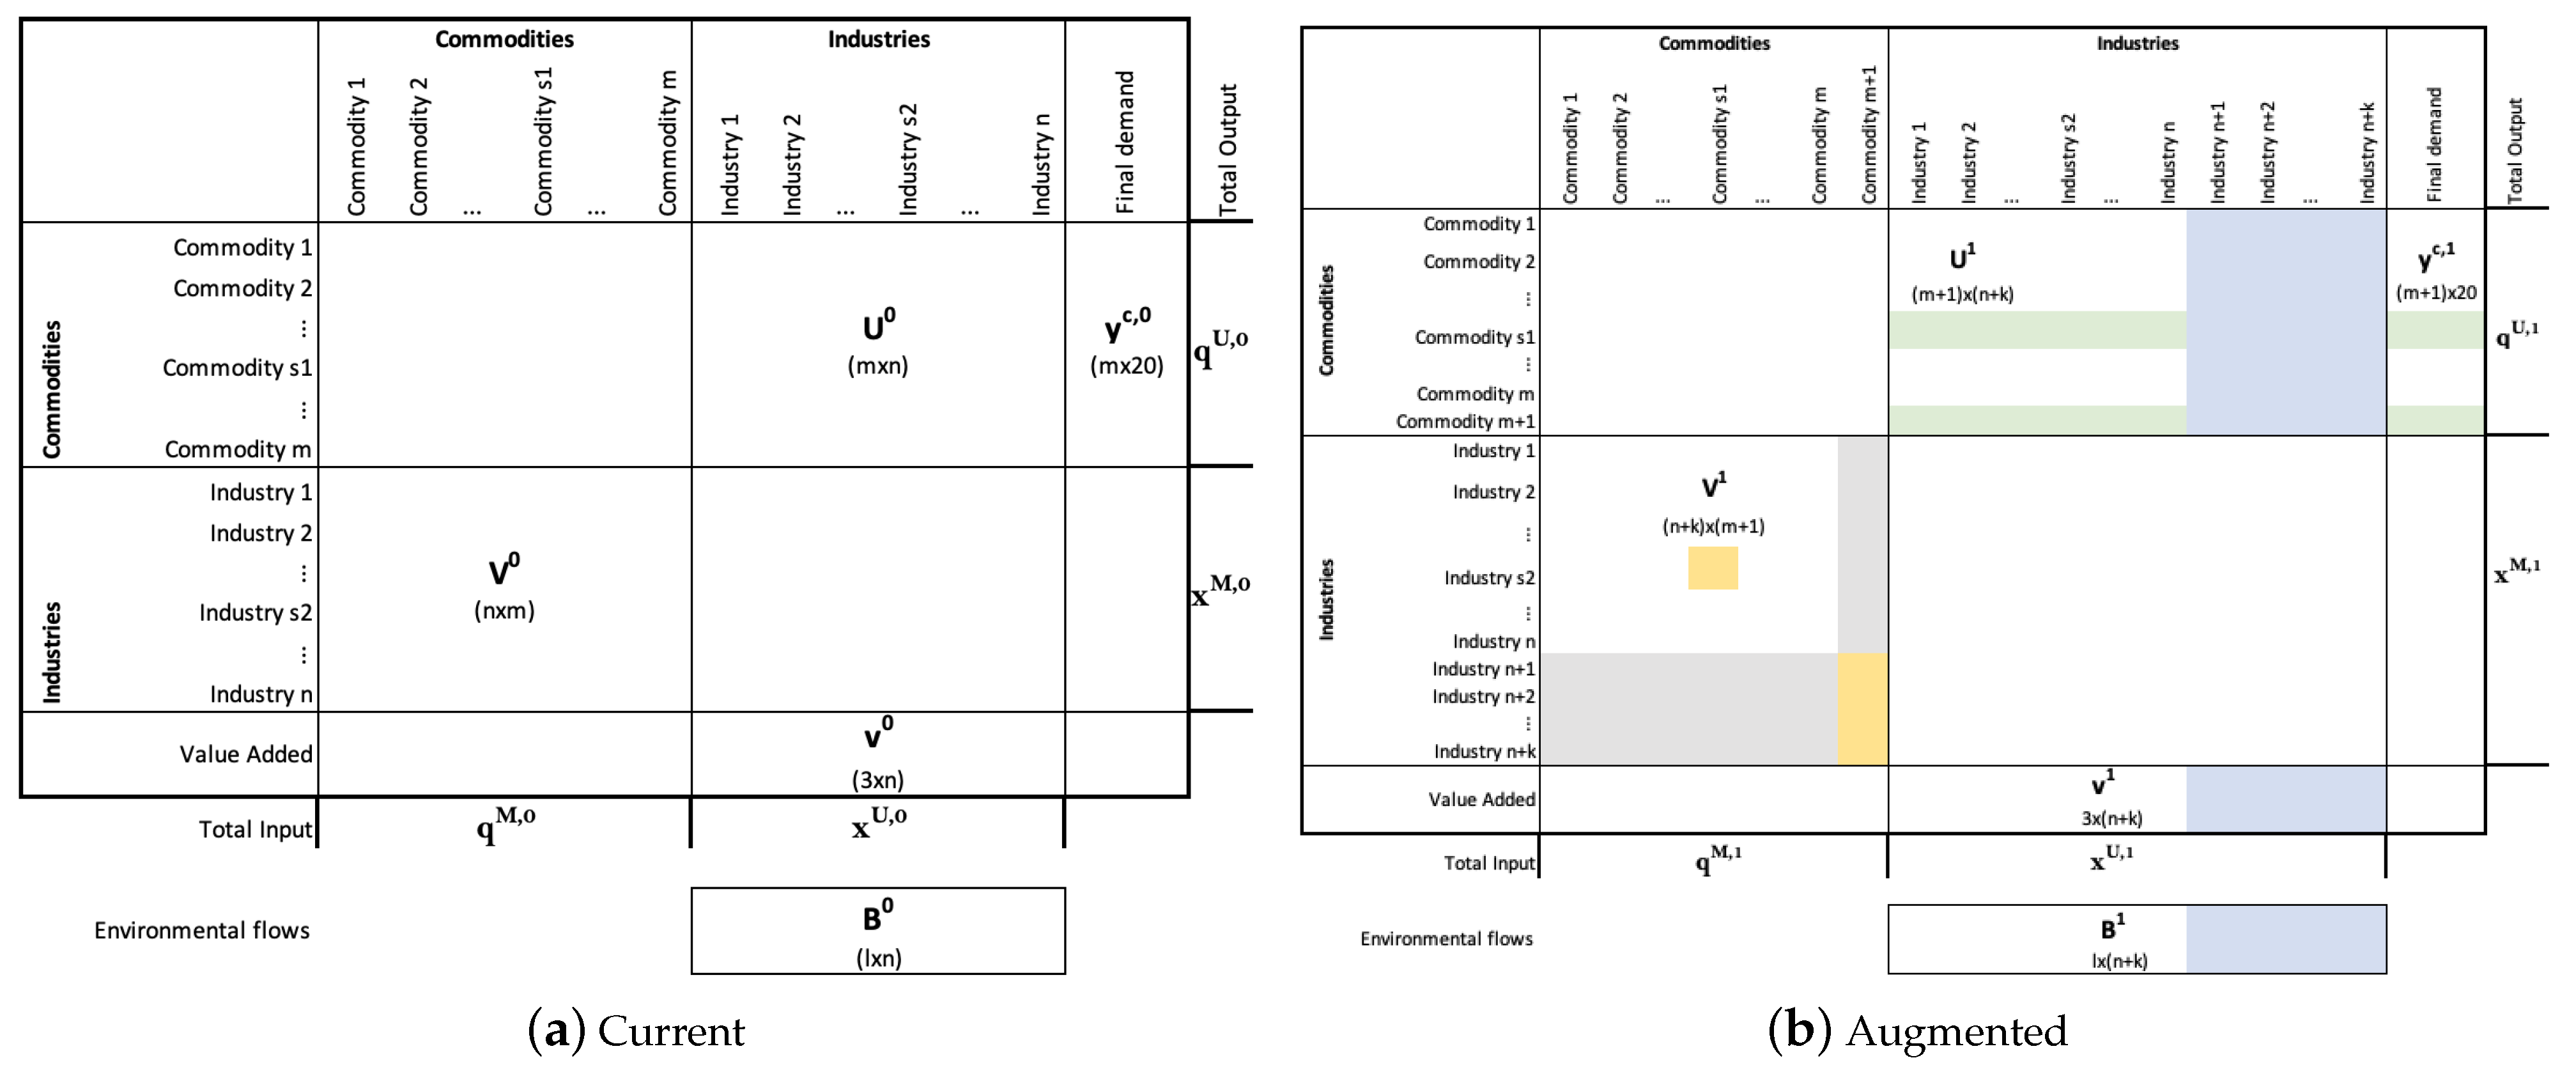
2.1. Augment/Modify Make and Use Tables
2.1.1. Use Table
2.1.2. Make Table
2.2. Rebalance Make and Use Tables
2.3. Augment/Modify Environmental Matrix B
2.4. Recalculate Matrices and Impacts
3. Case Study: Advanced Biofuels in USEEIO
3.1. Description
3.2. Data Sources
3.2.1. Prices
3.2.2. Input Purchases, Value Added and Environmental Flows
4. Results
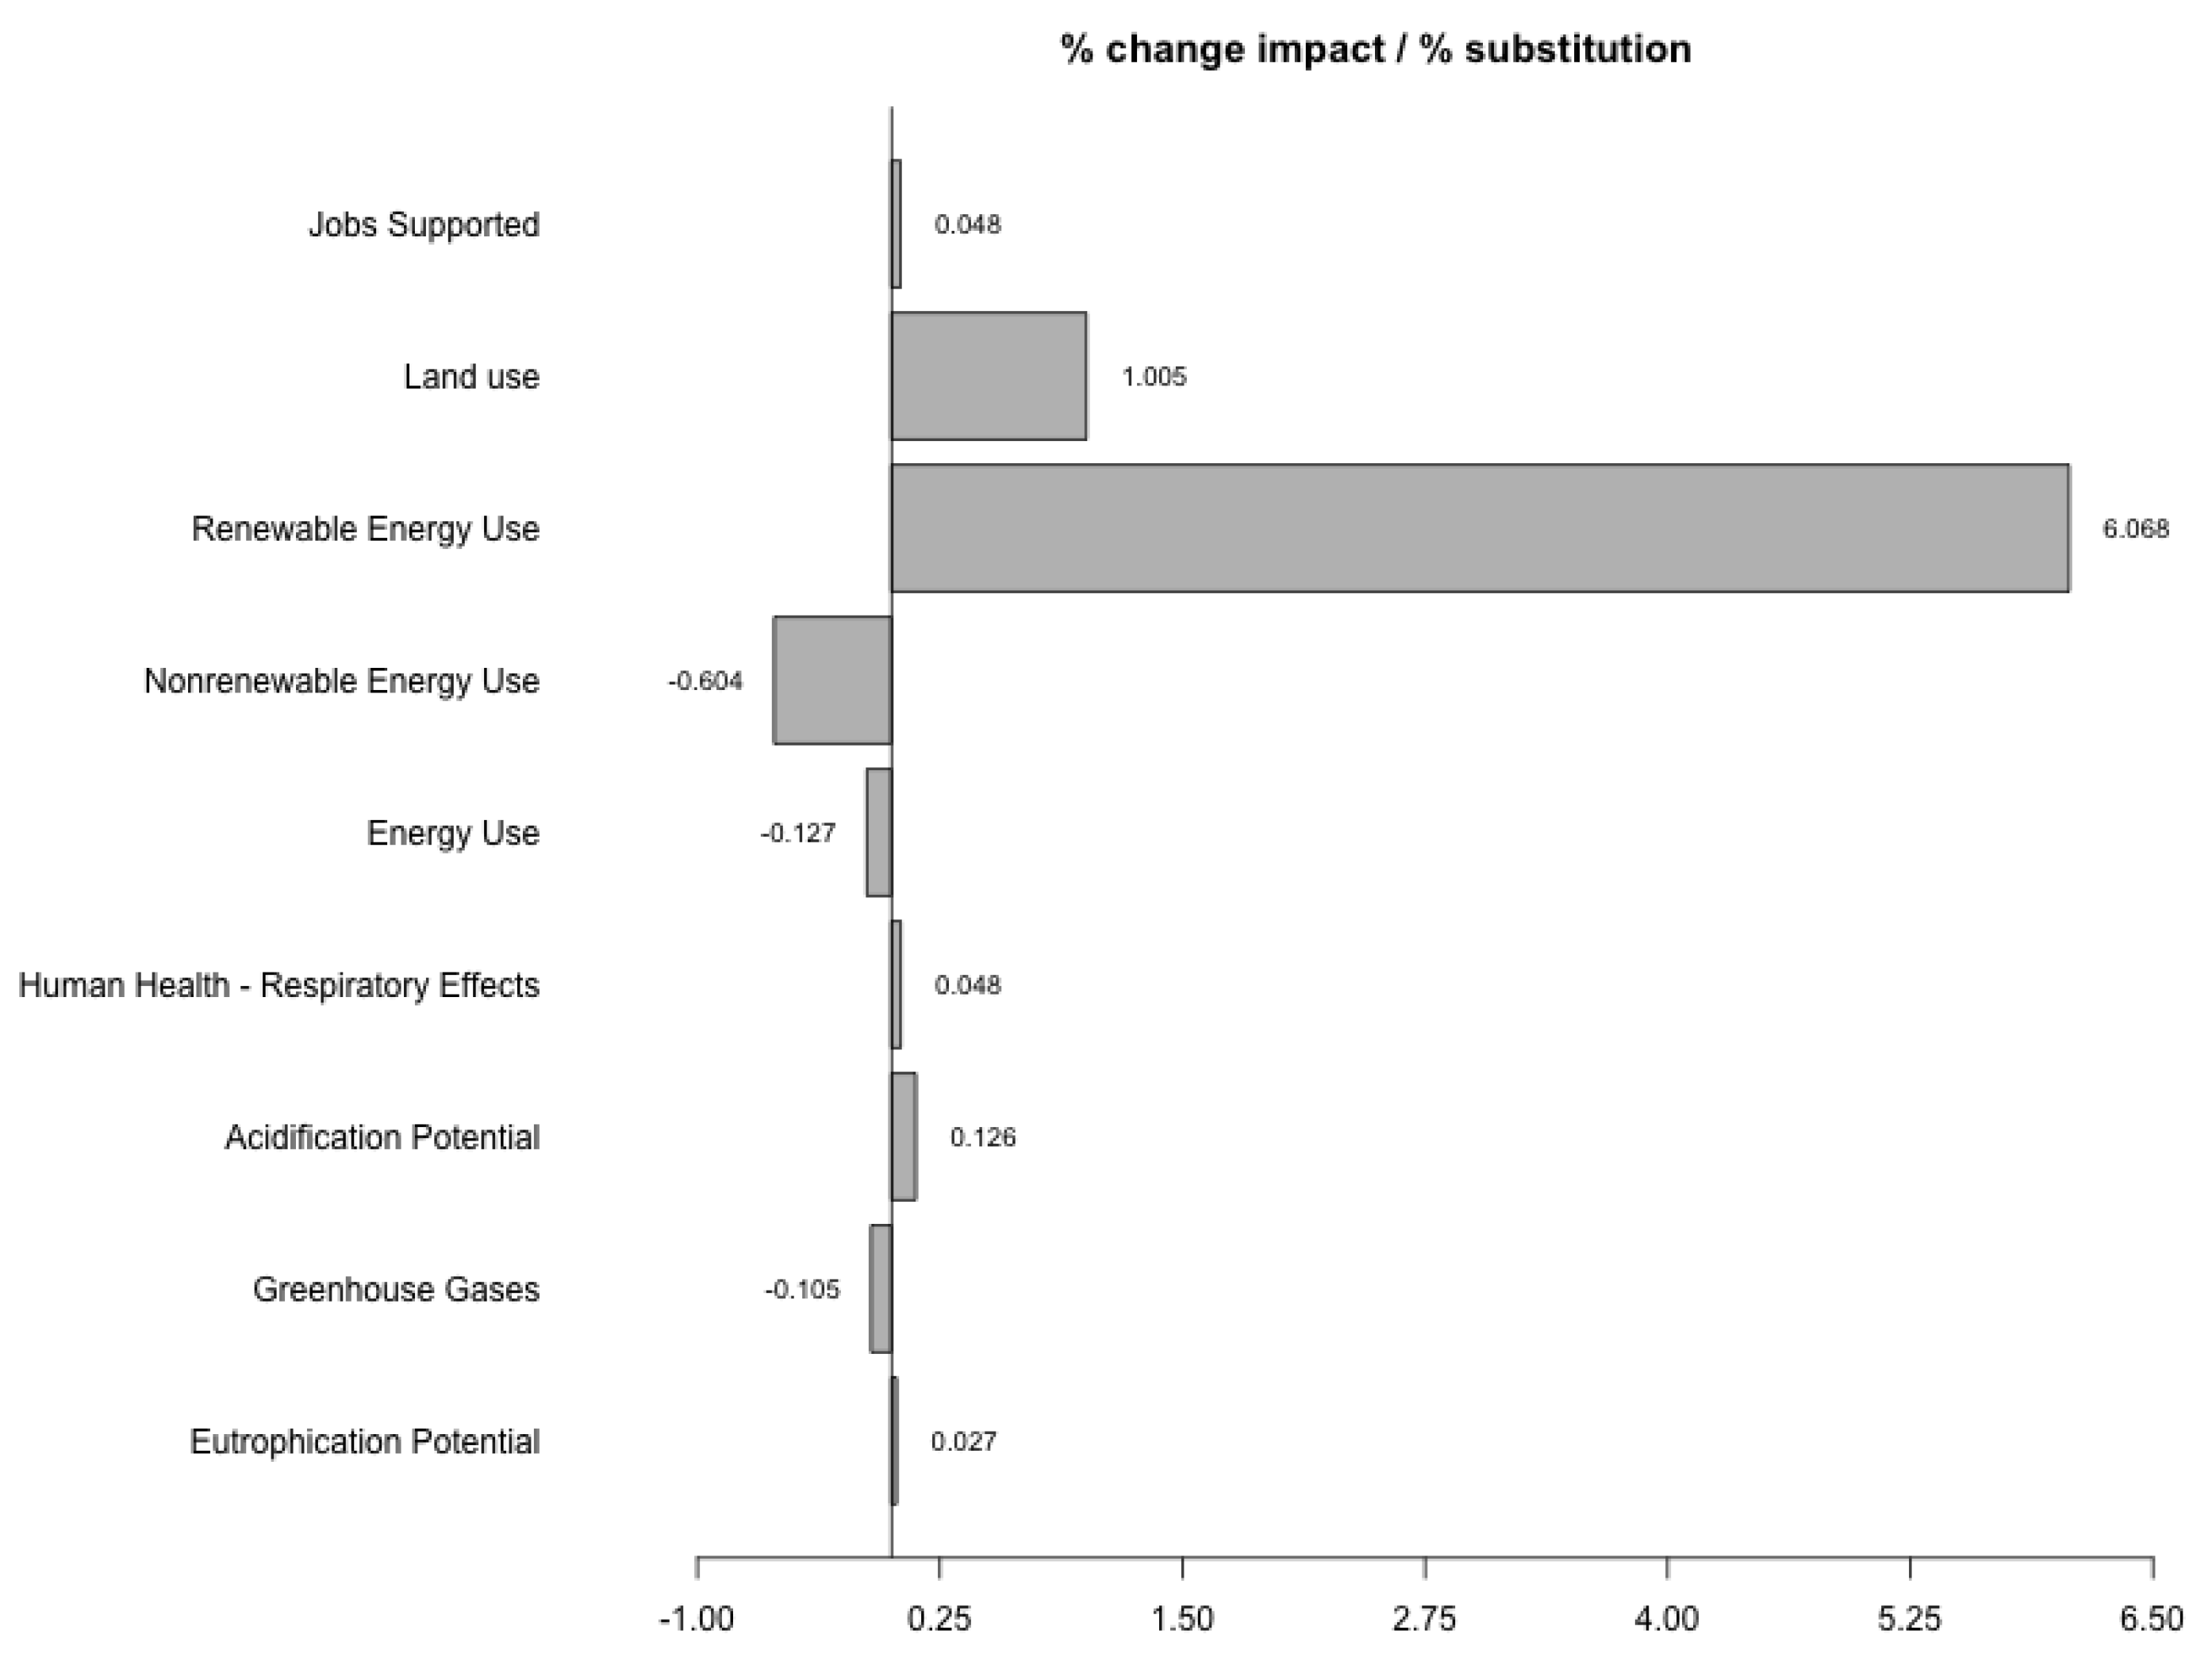
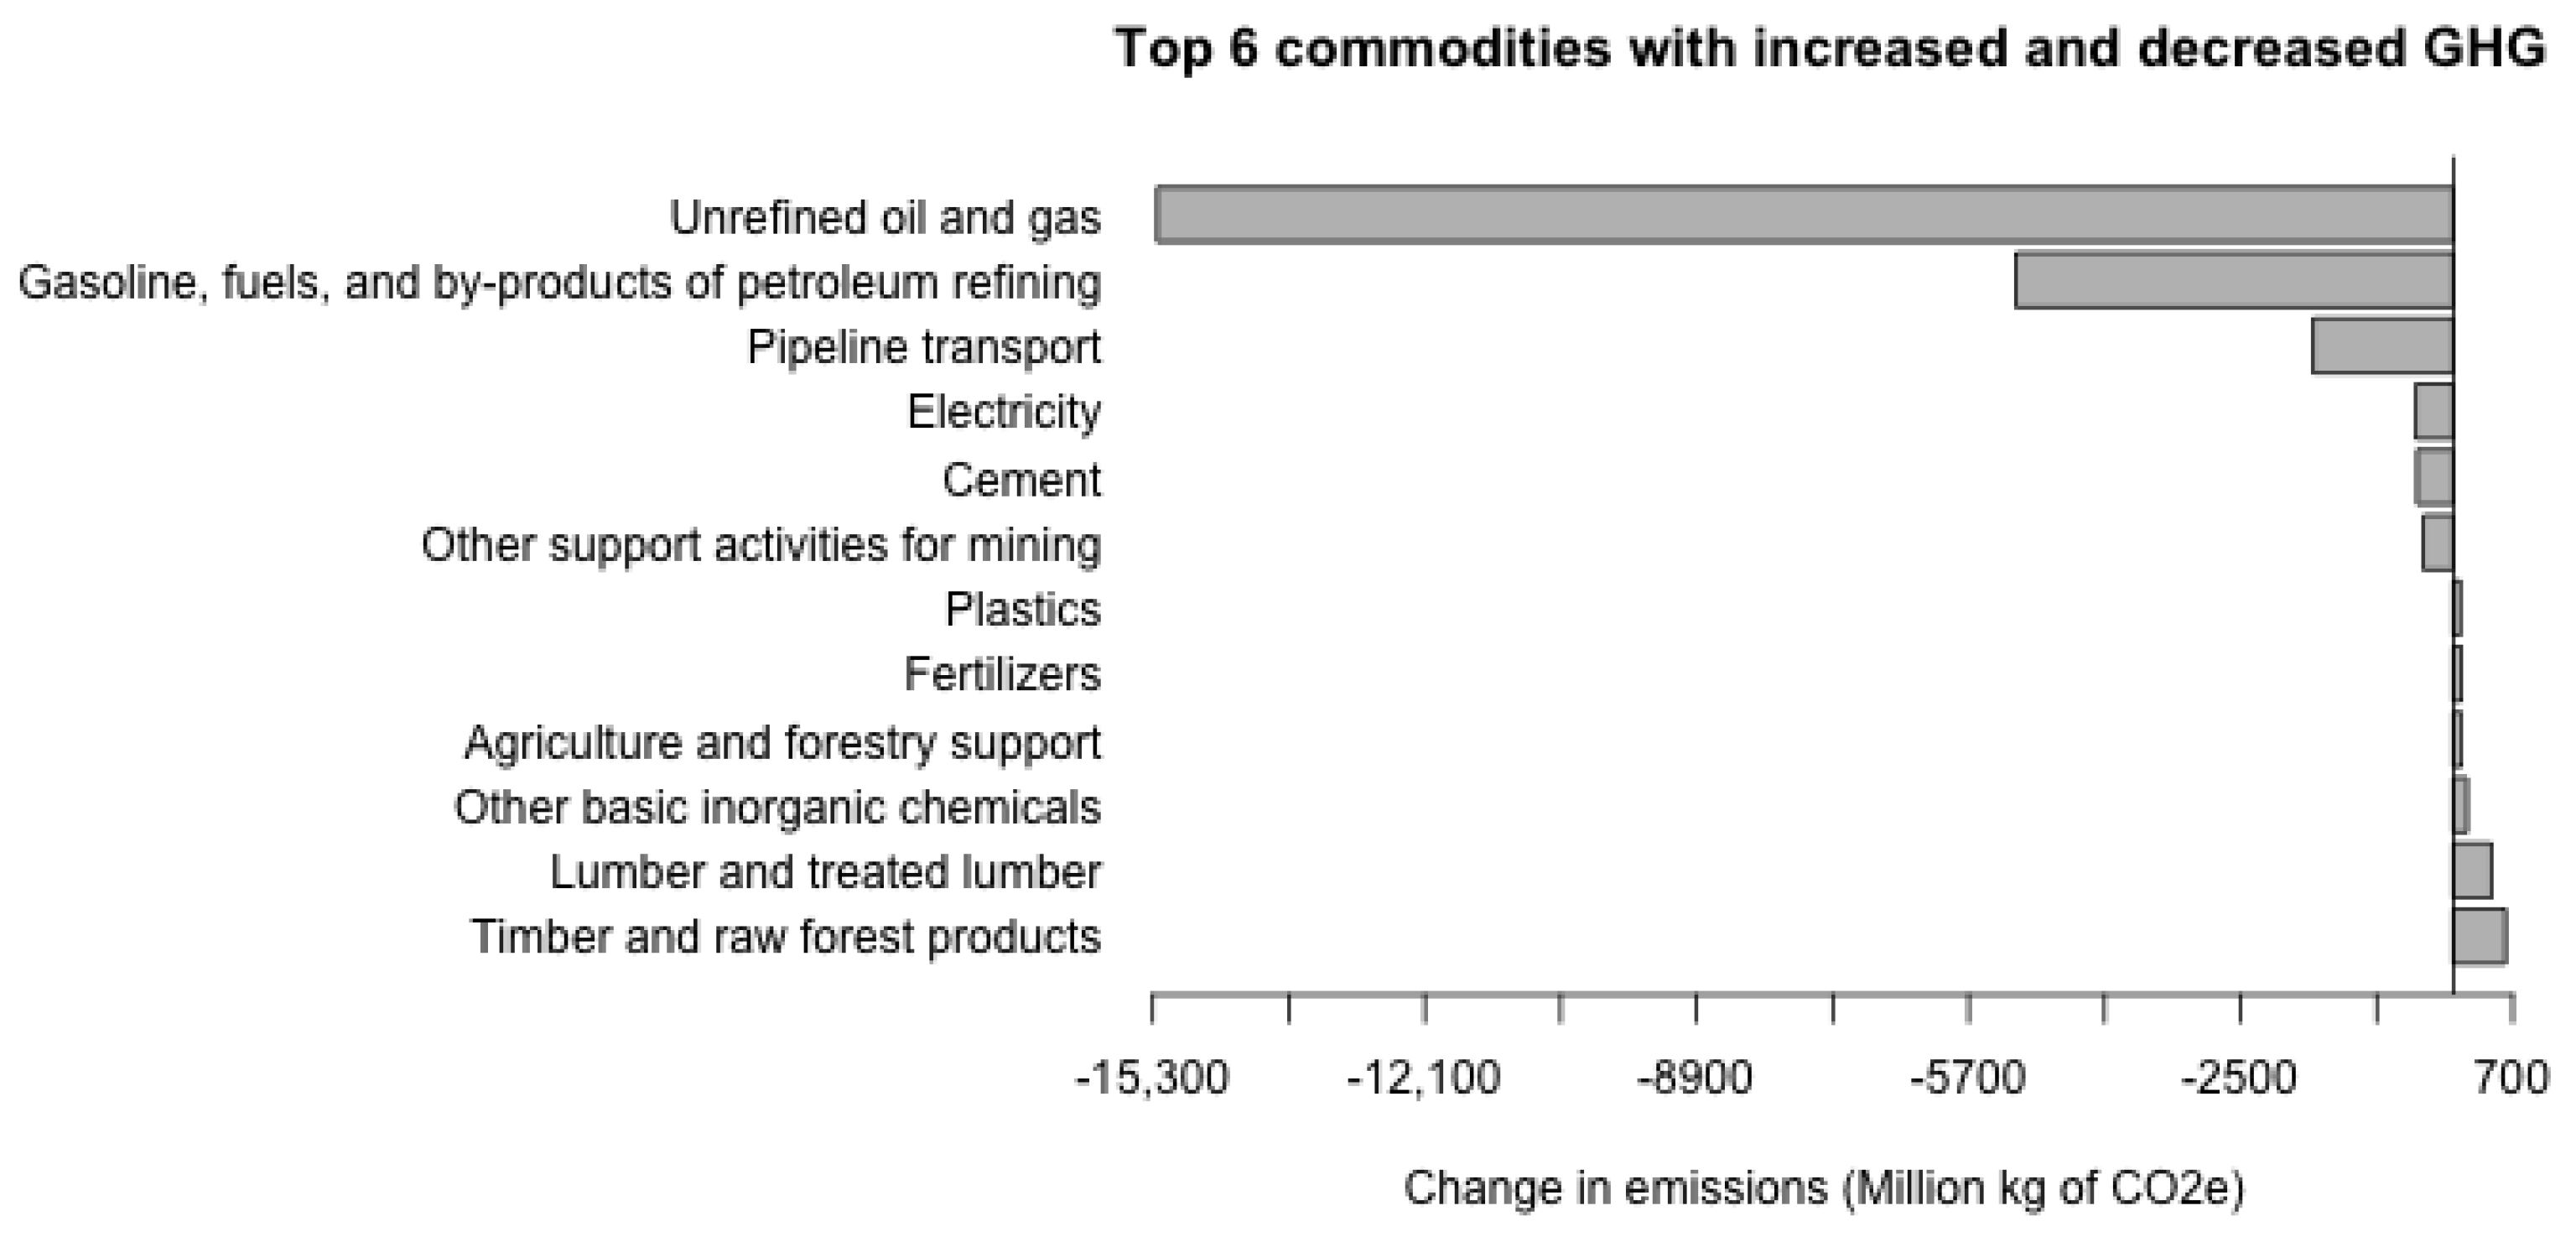
4.1. Economy-Wide Impacts
4.2. Comparative Life Cycle Assessment
5. Conclusions and Discussion
- What if 50% of the plastics currently used are replaced with bio-plastics?
- Which technology generates less environmental impact, including the ripple effects of all inputs?
- Which economic sectors will increase or decrease their emissions due to the addition of new industries?
- What environmental impacts of producing a new product are due to the production of the supply chain inputs?
Author Contributions
Funding
Data Availability Statement
Acknowledgments
Conflicts of Interest
Abbreviations
| LCA | Life Cycle Assessment |
| EEIO | Environmentally Extended Input–Output model |
| USEEIO | US Environmentally Extended Input–Output model |
| USEPA | US Environmental Protection Agency |
| BEA | U.S. Bureau of Economic Analysis |
Appendix A
Appendix A.1. Notation
| Current production of commodity i by industry j, in physical units. , | |
| Future production of commodity i by industry j, in physical units. , | |
| Current use of commodity i by industry j, in physical units. , | |
| Future use of commodity i by industry j, in physical units. , | |
| Current production of commodity i by industry j, in million dollars. , | |
| Future production of commodity i by industry j, in million dollars. , | |
| Current use of commodity i by industry j, in million dollars. , | |
| Future use of commodity i by industry j, in million dollars. , | |
| Current final demand of commodity i by user j, in physical units. , | |
| Future final demand of commodity i by user j, in physical units. , | |
| Current final demand of commodity i by user j, in million dollars. , | |
| Future final demand of commodity i by user j, in million dollars. , | |
| Future total final demand of commodity i, in million dollars. Corresponds to . | |
| Current element i of value added of industry j, in million dollars. , | |
| Future element i of value added of industry j, in million dollars. , | |
| Price of similar commodity, in dollars, per physical unit. | |
| Price of new commodity, in dollars, being produced new technology . | |
| Future production of the new commodity in physical units. | |
| Percentage of future production () of the new commodity being produced by technology . | |
| Expenditures of each commodity required to produce one physical unit of the new commodity, in each of the new industries . In dollars. | |
| Value-added component required to produce one physical unit of the new commodity in each of the new industries . In dollars. |
Appendix A.2. Units Calculations in Current Economy
Appendix B
Appendix B.1. Perfect Substitution Assumption
Appendix B.2. Prices
- Price of similar commodity in ().
- Price of the bio-commodity, in (), when being produced by each of the k new bio-industries .
Appendix C
Data Inputs for Case Study

| Input | Price per g | Price Info | Commodity Code | Commodity Name |
|---|---|---|---|---|
| Feedstock—Wood Chips | $0.00009 | Price: $80.00/dry US ton | 321100 | Sawmills and wood preservation |
| Magnesium Oxide (MgO) | $0.00058 | MgO price: $580/tonne | 424A00 | Other nondurable goods merchant wholesalers |
| Fresh Olivine | $0.00028 | Olivine price: $275/tonne | 2123A0 | Other nonmetallic mineral mining and quarrying |
| Tar Reformer Catalyst | $0.04770 | Price: $47.70/kg based on NREL calculations using metals pricing and costs for manufacturing processes. | 325180 | Other basic inorganic chemical manufacturing |
| 50 wt% Caustic | $0.00553 | $1910 for 650 lb | 424A00 | Other nondurable goods merchant wholesalers |
| Boiler Chemicals | $0.00613 | Boiler feed water chemicals–Price: $6.13/kg | 424A00 | Other nondurable goods merchant wholesalers |
| Cooling Tower Chemicals | $0.00367 | Cooling tower chemicals–Price: $3.67/kg | 424A00 | Other nondurable goods merchant wholesalers |
| Cooling Tower Make-up | $0.00000 | Price: $0.35/tonne | 221300 | Water, sewage and other systems |
| Boiler Feed Water Make-up | $0.00000 | Price: $0.35/tonne | 221300 | Water, sewage and other systems |
| Diesel Fuel | $0.00102 | Price: $22.39/GJ (2012 price projection) | 424700 | Petroleum and petroleum products |
| Hydrogen | $0.00151 | Price: $0.684/lb | 325120 | Industrial gas manufacturing |
| Natural Gas | $0.22487 | Price: $5.10 per 1000 standard cubic feet (EIA, 2011 industrial average) | 221200 | Natural gas distribution |
| Nutrients | $1.52470 | Ammonia price: 607 USD/170 g pack (From Sigma-Aldrich) Triple Superphosphate: $240 USD/metric ton | 424A00 | Other nondurable goods merchant wholesalers |
| Guerbet Catalyst3 | $0.05512 | Price: $25.00/lb | 424A00 | Other nondurable goods merchant wholesalers |
| Dehydration Catalyst3 | $0.02271 | Price: $10.30/lb | 424A00 | Other nondurable goods merchant wholesalers |
| Oligomerization Catalyst3-1 | $0.03444 | Price: $15.62/lb (Dow Chemicals) | 325211 | Plastics material and resin manufacturing |
| Oligomerization Catalyst3-2 | $0.06790 | Price: $30.80/lb | 325180 | Other basic inorganic chemical manufacturing |
| Dimerization Catalyst3 | $0.02180 | Price: $9.89/lb (Ion Power Inc., New Castle, DE) | 424A00 | Other nondurable goods merchant wholesalers |
| Hydrogenation Catalyst3 | $0.12170 | Price: $55.20/lb (PEP 2014 Yearbook, 0.4% Pd on Al2O3) | 424A00 | Other nondurable goods merchant wholesalers |
| Rhodium Catalyst3 | $1.21695 | Price: $552/lb (PNNL estimate) | 424A00 | Other nondurable goods merchant wholesalers |
| Isobutene Catalyst3 | $0.06614 | Price: $30.00/lb (PNNL estimate) | 325180 | Other basic inorganic chemical manufacturing |
| Hydrotreating Catalyst3 | $0.04409 | Price: $20/lb | 424A00 | Other nondurable goods merchant wholesalers |
| Product Upgrading Catalyst3 | 424A00 | Other nondurable goods merchant wholesalers | ||
| Fischer–Tropsch Catalyst3 | $0.07055 | Price: $32/lb | 325180 | Other basic inorganic chemical manufacturing |
| Tar reformer catalyst disposal | $0.00002 | Price: $18.20/ton (tar reformer catalyst disposal) | 562000 | Waste management and remediation services |
| Sand and ash purge disposal | $0.00006 | Price: $54.00/ton (sand and ash purge) | 562000 | Waste management and remediation services |
| Electricity | Price: $6.89/kWh (EIA, 2011 industrial average) | 221100 | Electric power generation, transmission and distribution | |
| Wastewater | $0.00000 | Price: $0.83/tonne | 562000 | Waste management and remediation services |
| Commodity Code | Commodity Name | Gas Fermentation | Guerbet Reaction | Fischer Tropsch |
|---|---|---|---|---|
| 321100 | Sawmills and wood preservation | $2.17700 | $1.59666 | $1.37998 |
| 325180 | Other basic inorganic chemical manufacturing | $0.04607 | $0.13687 | $0.07351 |
| 2123A0 | Other nonmetallic mineral mining and quarrying | $0.00652 | $0.00458 | $0.00417 |
| 424A00 | Other nondurable goods merchant wholesalers | $0.55356 | $0.06284 | $0.04581 |
| 221300 | Water, sewage and other systems | $0.01326 | $0.00328 | $0.01046 |
| 424700 | Petroleum and petroleum products | $0.00944 | $0.00664 | $0.00539 |
| 325211 | Plastics material and resin manufacturing | $0.05260 | $0.00000 | $0.00000 |
| 484000 | Truck transportation | $0.01305 | $0.01661 | $0.01149 |
| 325120 | Industrial gas manufacturing | $0.00000 | $0.06910 | $0.00000 |
| 562000 | Waste management and remediation services | $0.01865 | $0.01430 | $0.01783 |
| Name | Gas Fermentation | Guerbet Reaction | Fischer Tropsch |
|---|---|---|---|
| Compensation to employees | $0.08 | $0.06 | $0.05 |
| Taxes on production and imports, less subsidies | $0.82 | $0.88 | $0.60 |
| Gross operating surplus | $2.33 | $2.50 | $1.70 |
| Name | Flow Context Level 1 | Units | Gas Fermentation | Guerbet Reaction | Fischer Tropsch |
|---|---|---|---|---|---|
| Water, fresh | Resource | m | 0.00740 | 0.00183 | 0.00584 |
| Phosphorus | Water | kg | 0.00007 | 0.00000 | 0.00000 |
| Ammonia | Water | kg | 0.00027 | 0.00000 | 0.00000 |
| Carbon Dioxide (Non-biogenic) | Air | kg | 0.00000 | 0.00000 | 0.00000 |
| Sulfur dioxide | Air | kg | 0.00258 | 0.00049 | 0.00047 |
| Nitrogen oxides | Air | kg | 0.00238 | 0.00131 | 0.00279 |
| Water, fresh | Air | m | 0.00132 | 0.00130 | 0.00137 |
| Jobs | - | FTE | 0.000008 | 0.000006 | 0.000004 |
| Biomass | Resource | kg | 4.81032 | 3.63620 | 4.29274 |
Appendix D
Appendix D.1. Economy Wide—Comparative Results
| Units | Current | With New Tech | Difference | |
|---|---|---|---|---|
| Economic | — | — | — | — |
| Total Purchases- Petroleum Refineries | billion USD | 875.20 | 842.08 | −33.12 |
| Total commodity output- Petroleum Refineries | billion USD | 754.00 | 725.46 | −28.54 |
| Total Purchases- Biorefineries | billion USD | NA | 32.17 | 32.17 |
| Total commodity output- Biorefineries | billion USD | NA | 27.72 | 27.72 |
| Total production-Whole Economy | billion USD | 58,373.64 | 58,347.21 | −26.43 |
| Environmental | — | — | — | — |
| Acidification Potential | billion kg SO2 eq | 13.61 | 13.67 | 0.0632 |
| Commercial Construction and Demolition Debris | billion kg | 488.09 | 488.00 | −0.0938 |
| Commercial Municipal Solid Waste | billion kg | 199.85 | 199.89 | 0.0372 |
| Commercial RCRA Hazardous Waste | billion kg | 46.57 | 46.41 | −0.167 |
| Energy Use | EJ | 143.79 | 143.12 | −0.671 |
| Eutrophication Potential | billion kg N eq | 7.55 | 7.56 | 0.0075 |
| Freshwater Ecotoxicity Potential | billion CTUe | 4658.57 | 4663.47 | 4.89 |
| Freshwater withdrawals | trillion kg | 304.06 | 304.26 | 0.196 |
| Greenhouse Gases | trillion kg CO2 eq | 5.81 | 5.79 | −0.0225 |
| Hazardous Air Pollutants | million kg | 719.21 | 715.15 | −4.06 |
| Human Health—Cancer | CTUh | 2171.77 | 2154.59 | −17.17 |
| Human Health—Noncancer | CTUh | 58,551.87 | 58,497.94 | −53.93 |
| Human Health—Respiratory Effects | million kg PM2.5 eq | 2947.56 | 2952.81 | 5.25 |
| Human Health Toxicity | CTUh | 60,723.63 | 60,652.53 | −71.10 |
| Jobs Supported | million jobs | 133.20 | 133.43 | 0.234 |
| Land use | trillion m2*yr | 10.20 | 10.58 | 0.377 |
| Minerals and Metals Use | billion kg | 2670.99 | 2674.24 | 3.24 |
| Nonrenewable Energy Use | EJ | 133.50 | 130.53 | −2.97 |
| Ozone Depletion | thousand kg CFC-11 eq | 1109.68 | 1111.44 | 1.76 |
| Pesticides | ten thousand kg | 13,166.81 | 13,174.46 | 7.65 |
| Renewable Energy Use | EJ | 10.29 | 12.59 | 2.30 |
| Smog Formation Potential | kg O3 eq | 1442.19 | 1443.90 | 1.72 |
| Value Added | trillion USD | 17.47 | 17.44 | −0.0312 |
Appendix D.2. Comparative Life Cycle Assessment-All impacts
| Units | All Technologies | Gas Fermentation | Guerbet Reaction | Fischer Tropsch | |
|---|---|---|---|---|---|
| Acidification Potential | g SO2 eq | 3.57 | 5.29 | 2.13 | 3.29 |
| Commercial Construction and Demolition Debris | g | 1.58 | 1.80 | 1.37 | 1.58 |
| Commercial Municipal Solid Waste | g | 5.13 | 5.98 | 4.38 | 5.03 |
| Commercial RCRA Hazardous Waste | g | 4.24 | 3.45 | 5.01 | 4.28 |
| Energy Use | MJ | 80.22 | 90.49 | 69.14 | 81.02 |
| Eutrophication Potential | g N eq | 0.622 | 1.21 | 0.251 | 0.416 |
| Freshwater Ecotoxicity Potential | CTUe | 0.217 | 0.244 | 0.188 | 0.219 |
| Freshwater withdrawals | kg | 17.70 | 21.25 | 13.13 | 18.69 |
| Greenhouse Gases | kg CO2 eq | 0.215 | 0.229 | 0.21 | 0.207 |
| Hazardous Air Pollutants | g | 0.0946 | 0.101 | 0.0847 | 0.098 |
| Human Health—Cancer | CTUh | 0.198 | 0.207 | 0.182 | 0.204 |
| Human Health—Noncancer | CTUh | 5.17 | 5.18 | 4.95 | 5.38 |
| Human Health—Respiratory Effects | g PM2.5 eq | 0.375 | 0.487 | 0.298 | 0.342 |
| Human Health Toxicity | CTUh | 5.37 | 5.39 | 5.13 | 5.59 |
| Jobs Supported | jobs | 10.24 | 13.05 | 9.82 | 7.91 |
| Land use | m2*yr | 13.06 | 13.85 | 11.59 | 13.73 |
| Minerals and Metals Use | kg | 0.231 | 0.183 | 0.266 | 0.244 |
| Nonrenewable Energy Use | MJ | 2.86 | 3.04 | 2.80 | 2.74 |
| Ozone Depletion | mg CFC-11 eq | 0.146 | 0.11 | 0.234 | 0.096 |
| Pesticides | mg | 4.09 | 4.76 | 3.56 | 3.95 |
| Renewable Energy Use | MJ | 77.37 | 87.45 | 66.34 | 78.28 |
| Smog Formation Potential | g O3 eq | 50.73 | 55.29 | 34.21 | 62.34 |
| Value Added | $ | 1.12 | 1.13 | 1.12 | 1.13 |
References
- Guinée, J.B.; Heijungs, R.; Huppes, G.; Zamagni, A.; Masoni, P.; Buonamici, R.; Ekvall, T.; Rydberg, T. Life Cycle Assessment: Past, Present, and Future. Environ. Sci. Technol. 2011, 45, 90–96. [Google Scholar] [CrossRef]
- Curran, M.A. Life Cycle Assessment: A review of the methodology and its application to sustainability. Curr. Opin. Chem. Eng. 2013, 2, 273–277. [Google Scholar] [CrossRef]
- Bergerson, J.; Cucurachi, S.; Seager, T.P. Bringing a life cycle perspective to emerging technology development. J. Ind. Ecol. 2020, 24, 6–10. [Google Scholar] [CrossRef]
- Moni, S.M.; Mahmud, R.; High, K.; Carbajales-Dale, M. Life cycle assessment of emerging technologies: A review. J. Ind. Ecol. 2020, 24, 52–63. [Google Scholar] [CrossRef]
- Matthews, H.S.; Hendrickson, C.T.; Matthews, D.H. Life Cycle Assessment: Quantitative Approaches for Decisions That Matter; Open access Textbook; 2014; Available online: http://www.lcatextbook.com/ (accessed on 17 July 2019).
- Hendrickson, C.; Horvath, A.; Joshi, S.; Lave, L. Economic Input–Output Models for Environmental Life-Cycle Assessment. Environ. Sci. Technol. 1998, 32, 184A–191A. [Google Scholar] [CrossRef]
- Miller, R.E.; Blair, P.D. Input-Output Analysis: Foundations and Extensions, 3rd ed.; Cambridge University Press: Cambridge, UK, 2022. [Google Scholar]
- Crawford, R.H.; Bontinck, P.A.; Stephan, A.; Wiedmann, T.; Yu, M. Hybrid life cycle inventory methods—A review. J. Clean. Prod. 2018, 172, 1273–1288. [Google Scholar] [CrossRef]
- Luo, Y.; Ierapetritou, M. Comparison between Different Hybrid Life Cycle Assessment Methodologies: A Review and Case Study of Biomass-based p-Xylene Production. Ind. Eng. Chem. Res. 2020, 59, 22313–22329. [Google Scholar] [CrossRef]
- Joshi, S. Product Environmental Life-Cycle Assessment Using Input-Output Techniques. J. Ind. Ecol. 1999, 3, 95–120. [Google Scholar] [CrossRef]
- Wood, R.; Moran, D.; Stadler, K.; Ivanova, D.; Steen-Olsen, K.; Tisserant, A.; Hertwich, E.G. Prioritizing Consumption-Based Carbon Policy Based on the Evaluation of Mitigation Potential Using Input-Output Methods. J. Ind. Ecol. 2018, 22, 540–552. [Google Scholar] [CrossRef] [Green Version]
- Garrett-Peltier, H. Green versus brown: Comparing the employment impacts of energy efficiency, renewable energy, and fossil fuels using an input-output model. Econ. Model. 2017, 61, 439–447. [Google Scholar] [CrossRef]
- Faturay, F.; Vunnava, V.S.G.; Lenzen, M.; Singh, S. Using a new USA multi-region input output (MRIO) model for assessing economic and energy impacts of wind energy expansion in USA. Appl. Energy 2020, 261, 114141. [Google Scholar] [CrossRef]
- Just, J.E. Impacts of new energy technology using generalized input-output analysis. Comput. Oper. Res. 1974, 1, 97–109. [Google Scholar] [CrossRef] [Green Version]
- Bullard, C.W.; Sebald, A.V. A Model for Analyzing Energy Impact of Technological Change; Technical Report 146; Center for Advanced Computation, University of Illinois: Chicago, IL, USA, 1975. [Google Scholar]
- Mukhopadhyay, K.; Chen, X.; Thomassin, P. Economy wide impacts of ethanol and biodiesel policy in Canada: An input–output analysis. Int. J. Green Energy 2016, 14, 400–415. [Google Scholar] [CrossRef]
- Wang, C.; Malik, A.; Wang, Y.; Chang, Y.; Lenzen, M.; Zhou, D.; Pang, M.; Huang, Q. The social, economic, and environmental implications of biomass ethanol production in China: A multi-regional input-output-based hybrid LCA model. J. Clean. Prod. 2020, 249, 119326. [Google Scholar] [CrossRef]
- Malik, A.; Lenzen, M.; Ely, R.N.; Dietzenbacher, E. Simulating the impact of new industries on the economy: The case of biorefining in Australia. Ecol. Econ. 2014, 107, 84–93. [Google Scholar] [CrossRef]
- Lamers, P.; Avelino, A.F.T.; Zhang, Y.; Tan, E.C.D.; Young, B.; Vendries, J.; Chum, H. Potential Socioeconomic and Environmental Effects of an Expanding U.S. Bioeconomy: An Assessment of Near-Commercial Cellulosic Biofuel Pathways. Environ. Sci. Technol. 2021, 55, 5496–5505. [Google Scholar] [CrossRef]
- Tan, E.C.; Snowden-Swan, L.J.; Talmadge, M.; Dutta, A.; Jones, S.; Ramasamy, K.K.; Gray, M.; Dagle, R.; Padmaperuma, A.; Gerber, M.; et al. Comparative techno-economic analysis and process design for indirect liquefaction pathways to distillate-range fuels via biomass-derived oxygenated intermediates upgrading. Biofuels Bioprod. Biorefining 2016, 11, 41–66. [Google Scholar] [CrossRef]
- Bureau of Economic Analysis. Input-Output Accounts Data. 2019. Available online: https://www.bea.gov/industry/input-output-accounts-data (accessed on 13 June 2020).
- Cai, H.; Benavides, T.; Lee, U.; Wang, M.; Tan, E.; Davis, R.; Dutta, A.; Biddy, M.; Clippinger, J.; Grundl, N.; et al. Supply Chain Sustainability Analysis of Renewable Hydrocarbon Fuels via Indirect Liquefaction, Ex Situ Catalytic Fast Pyrolisis, Hydrothermal Liquefaction, Combined Algal Processing, and Biochemical Conversion: Update of the 2018 State-of-Technology Cases and Design Cases; Report; Argonne National Laboratory: Chicago, IL, USA, 2018. [Google Scholar]
- Ingwersen, W.; Li, M.; Young, B.; Vendries, J.; Birney, C. USEEIO v2.0, The US Environmentally-Extended Input-Output Model v2.0 (USEEIOv2.0). Scientific Data 2022, 9, 194. [Google Scholar] [CrossRef]
- Li, M.; Ingwersen, W.; Young, B.; Vendries, J.; Birney, C. Useeior: An Open-Source R Package for Building and Using US Environmentally-Extended Input–Output Models. Appl. Sci. 2022, 12, 4469. [Google Scholar] [CrossRef]
- Tan, E.C.D.; Talmadge, M.; Dutta, A.; Hensley, J.; Snowden-Swan, L.J.; Humbird, D.; Schaidle, J.; Biddy, M. Conceptual process design and economics for the production of high-octane gasoline blendstock via indirect liquefaction of biomass through methanol/dimethyl ether intermediates. Biofuels Bioprod. Biorefining 2016, 10, 17–35. [Google Scholar] [CrossRef]
- Davis, R.; Grundl, N.; Tao, L.; Biddy, M.J.; Tan, E.C.; Beckham, G.T.; Humbird, D.; Thompson, D.N.; Roni, M.S. Process Design and Economics for the Conversion of Lignocellulosic Biomass to Hydrocarbon Fuels and Coproducts: 2018 Biochemical Design Case Update; Report NREL/TP-5100-71949; National Renewable Energy Laboratory: Golden, CO, USA, 2018. [Google Scholar]
- IRS. Publication 946 (2020), How To Depreciate Property—Table A-1. 2020. Available online: https://www.irs.gov/publications/p946#en_US_2019_publink1000107507 (accessed on 1 July 2020).
- Bureau of Economic Analysis. Margins Before Redefinitions 2007–2012 DET. 2018. Available online: https://www.bea.gov/industry/industry-underlying-estimates (accessed on 25 November 2021).
- Trading Economics. Naphtha 2005–2020 Data | 2021–2022 Forecast | Price | Quote | Chart | Historical. 2020. Available online: https://tradingeconomics.com/commodity/naphtha (accessed on 2 August 2020).
- IATA. Jet Fuel Price Monitor. 2020. Available online: https://www.iata.org/en/publications/economics/fuel-monitor/ (accessed on 2 August 2020).
- AAA. Gas Prices. 2020. Available online: https://gasprices.aaa.com/ (accessed on 2 August 2020).
- U.S. Energy Information Administration. Oil and Petroleum Products Explained. 2020. Available online: https://www.eia.gov/energyexplained/oil-and-petroleum-products/refining-crude-oil.php (accessed on 2 August 2020).
- Daniell, J.; Köpke, M.; Simpson, S. Commercial Biomass Syngas Fermentation. Energies 2012, 5, 5372–5417. [Google Scholar] [CrossRef] [Green Version]
- Griffin, D.W.; Schultz, M.A. Fuel and chemical products from biomass syngas: A comparison of gas fermentation to thermochemical conversion routes. Environ. Prog. Sustain. Energy 2012, 31, 219–224. [Google Scholar] [CrossRef]
- Handler, R.M.; Shonnard, D.R.; Griffing, E.M.; Lai, A.; Palou-Rivera, I. Life Cycle Assessments of Ethanol Production via Gas Fermentation: Anticipated Greenhouse Gas Emissions for Cellulosic and Waste Gas Feedstocks. Ind. Eng. Chem. Res. 2015, 55, 3253–3261. [Google Scholar] [CrossRef]
- Kopke, M.; Mihalcea, C.; Bromley, J.C.; Simpson, S.D. Fermentative production of ethanol from carbon monoxide. Curr. Opin. Biotechnol. 2011, 22, 320–325. [Google Scholar] [CrossRef]
- Zhang, Y.; Sahir, A.H.; Tan, E.C.D.; Talmadge, M.S.; Davis, R.; Biddy, M.J.; Tao, L. Economic and environmental potentials for natural gas to enhance biomass-to-liquid fuels technologies. Green Chem. 2018, 20, 5358–5373. [Google Scholar] [CrossRef] [Green Version]
- Sahir, A.H.; Zhang, Y.; Tan, E.C.D.; Tao, L. Understanding the role of Fischer–Tropsch reaction kinetics in techno-economic analysis for co-conversion of natural gas and biomass to liquid transportation fuels. Biofuels Bioprod. Biorefining 2019, 13, 1306–1320. [Google Scholar] [CrossRef]
- Cornwall, W. The burning question. Science 2017, 355, 18–21. [Google Scholar] [CrossRef]
- Johnson, E. Goodbye to carbon neutral: Getting biomass footprints right. Environ. Impact Assess. Rev. 2009, 29, 165–168. [Google Scholar] [CrossRef]
- Horowitz, K.J.; Planting, M.A. Concepts and Methods of the U.S Input-Output Accounts; Technical Report; Bureau of Economic Analysis (BEA), U.S. Department of Commerce: Washington, DC, USA, 2009. [Google Scholar]
- Steubing, B.; de Koning, A.; Merciai, S.; Tukker, A. How do carbon footprints from LCA and EEIOA databases compare?: A comparison of ecoinvent and EXIOBASE. J. Ind. Ecol. 2022, 1–17. [Google Scholar] [CrossRef]
- Perkins, J.; Suh, S. Uncertainty Implications of Hybrid Approach in LCA: Precision versus Accuracy. Environ. Sci. Technol. 2019, 53, 3681–3688. [Google Scholar] [CrossRef] [Green Version]
- Agez, M.; Wood, R.; Margni, M.; Strømman, A.H.; Samson, R.; Majeau-Bettez, G. Hybridization of complete PLCA and MRIO databases for a comprehensive product system coverage. J. Ind. Ecol. 2020, 24, 774–790. [Google Scholar] [CrossRef]


| Current | With New Tech | Difference | |
|---|---|---|---|
| Total Purchases- Petroleum Refineries | 875.20 | 842.08 | −33.12 |
| Total commodity output- Petroleum Refineries | 754.00 | 725.46 | −28.54 |
| Total Purchases- Biorefineries | NA | 32.17 | 32.17 |
| Total commodity output- Biorefineries | NA | 27.72 | 27.72 |
| Total production-Whole Economy | 58,373.64 | 58,347.21 | −26.43 |
| Units | All Technologies | Gas Fermentation | Guerbet Reaction | Fischer Tropsch | |
|---|---|---|---|---|---|
| Greenhouse Gases | kg CO2 eq | 0.215 | 0.229 | 0.21 | 0.207 |
| Eutrophication Potential | g N eq | 0.622 | 1.21 | 0.251 | 0.416 |
| Acidification Potential | g SO2 eq | 3.57 | 5.29 | 2.13 | 3.29 |
| Human Health—Respiratory Effects | g PM2.5 eq | 0.375 | 0.487 | 0.298 | 0.342 |
| Energy Use | MJ | 80.22 | 90.49 | 69.14 | 81.02 |
| Nonrenewable Energy Use | MJ | 2.86 | 3.04 | 2.80 | 2.74 |
| Renewable Energy Use | MJ | 77.37 | 87.45 | 66.34 | 78.28 |
| Land use | m2*yr | 13.06 | 13.85 | 11.59 | 13.73 |
| Jobs Supported | jobs | 10.24 | 13.05 | 9.82 | 7.91 |
| Freshwater withdrawals | kg | 17.70 | 21.25 | 13.13 | 18.69 |
| Value Added | $ | 1.12 | 1.13 | 1.12 | 1.13 |
Publisher’s Note: MDPI stays neutral with regard to jurisdictional claims in published maps and institutional affiliations. |
© 2022 by the authors. Licensee MDPI, Basel, Switzerland. This article is an open access article distributed under the terms and conditions of the Creative Commons Attribution (CC BY) license (https://creativecommons.org/licenses/by/4.0/).
Share and Cite
Azuero-Pedraza, C.G.; Thomas, V.M.; Ingwersen, W.W. Incorporating New Technologies in EEIO Models. Appl. Sci. 2022, 12, 7016. https://doi.org/10.3390/app12147016
Azuero-Pedraza CG, Thomas VM, Ingwersen WW. Incorporating New Technologies in EEIO Models. Applied Sciences. 2022; 12(14):7016. https://doi.org/10.3390/app12147016
Chicago/Turabian StyleAzuero-Pedraza, Cindy G., Valerie M. Thomas, and Wesley W. Ingwersen. 2022. "Incorporating New Technologies in EEIO Models" Applied Sciences 12, no. 14: 7016. https://doi.org/10.3390/app12147016
APA StyleAzuero-Pedraza, C. G., Thomas, V. M., & Ingwersen, W. W. (2022). Incorporating New Technologies in EEIO Models. Applied Sciences, 12(14), 7016. https://doi.org/10.3390/app12147016