Abstract
A prediction model based on artificial neural networks is adapted to forecast the acoustic performance of airborne sound insulation of various lightweight wooden façade walls. A total of 100 insulation curves were used to develop the prediction model. The data are laboratory measurements of façade walls in one-third-octave bands (50 Hz–5 kHz). For each façade wall, geometric and physical information (material type, dimensions, thicknesses, densities, and more) are used as input parameters. The model shows a satisfactory predictive capability for airborne sound reduction. A higher accuracy is obtained at middle frequencies (250 Hz–1 kHz), while lower and higher frequency ranges often show higher deviations. The weighted airborne sound reduction index () of façades can be estimated with a maximum difference of 3 dB. Sometimes, the model shows high variations within fundamental and critical frequencies that influence the predictive precision. A sensitivity analysis is implemented to investigate the significance of parameters in insulation estimations. The material density (i.e., cross-laminated timber panel, gypsum board), thickness of the insulation materials, thickness and spacing between interior studs and the total density of façades are factors of significant weight on predictions. The results also emphasize the importance of façade thickness and the total density of the clustered exterior layers.
1. Introduction
Timber has been widely and continuously used in construction engineering as it is available in nature and easy to handle [1]. In addition, it has a significantly lower carbon footprint than concrete and provides good thermal performance [2,3]. Wooden buildings have become widely popular in Scandinavia and Australia due to their advantages [4,5]. Moreover, in North America, wood-frame structure systems were the most common in the building construction sector in the 20th century [6]. A few years ago, although cross-laminated timber (CLT) was an innovative product for the North American construction market, the serviceability of CLT as a sustainable material has received much attention from researchers and the wood industry [7].
Despite lightweight wooden structures reducing construction time and cost, one disadvantage in certain types of these constructions is that the quality of subjective sound isolation is considered lower than in concrete or heavy constructions, with the same isolation data [8]. This applies to different lightweight components, such as floors, roofs, internal walls, and façades.
Façade sound insulation is related to the outside noise insulation that is used to control indoor noise. Acoustically inappropriate design of façade walls may produce an undesirable impact on indoor acoustic comfort in buildings. The need to control the acoustic environment in building constructions is highlighted for new and old renovated buildings [9]. Moreover, enhancing indoor acoustic comfort for building occupants is a fundamental issue in development, research, and the construction sector [10].
However, certain façades are designed mostly for purposes such as thermal insulation and fire safety, but acoustic aspects are often not considered or misunderstood [11]. The characterization of acoustic performance of façade structures is derived from standardized measurements, such as ISO and ASTM [12,13,14,15,16,17], but those measurements are demanding for time and cost [18]. In addition, obtained results are specific to certain specimens and cannot be generalized to different structures.
To maintain sufficient indoor acoustic quality, it is essential to use appropriate prediction tools to forecast the acoustic behavior of structural elements to improve the quality of the indoor climate. Some estimation approaches have been developed to forecast the sound transmission through multiple structures using theoretical approaches [19,20,21,22], numerical tools [23,24], and machine-learning applications [25,26]. However, some tools have revealed significant deviations [24,27,28,29,30]. Certain construction details need to be included during the modeling to improve their accuracy [23,30,31,32].
A direct prediction tool is based on theory-based analytical expressions, including stiffness, mass, and damping [17]. This is probably reasonable for a single-leaf element, but it is more complicated for lightweight multi-layered structures. Accurate forecasting of sound isolation performance of multilayer elements is still a challenging task [17]. Specific details, i.e., structural connections between elements, can scarcely be involved in prediction tools, particularly in analytical approaches [33]. In addition, the diversity in building materials makes forecasting even harder. Moreover, the standardized method, which is indicated in ISO 12354 Part 1 [34], is formulated and extracted using insulation data of heavy monolithic elements [31]. This is currently not applicable for lightweight multi-layered structures [31].
Machine-learning algorithms have paved the way for technological achievements in various fields that were challenging a few years ago, such as image recognition, speech recognition, language translation, and building acoustics [25,35,36,37]. It is the science that allows algorithms to learn and predict based on sample data [38]. Big and diverse data are essential to enhance the predictive power of these models, especially artificial neural networks (ANN). The latter are widely used in different acoustic applications, for example, audio engineering, vehicle industry, acoustic material, and environmental acoustics [39,40,41,42].
In building acoustics, a convolutional neural networks model was used to classify inter-floor noise by recording different noise sources for 24 h in a household [43]. Moreover, a developed ANN model was applied on sandwich partition panels to forecast their sound insulation, weighted airborne sound reduction indices and sound transmission class values [26]. The results were reasonable, and the model was able to predict and within dB differences. A similar study was conducted using measurements related to wooden windows to predict using technical parameters [32]. However, the estimations in the two previous studies were only dealing with single-number quantities (SNQ) without estimation of full-spectrum insulation curves.
Taking the estimations of ANN a step further, detailed predictions of airborne insulation in -octave bands were acquired for masonry walls [25]. The data consisted of laboratory measurements performed on 34 brick walls. Despite the estimated values agreed with measured ones, the study focused on one monolithic structure. To bridge this gap, previous research published by the authors [44] used ANN to estimate the sound insulation behavior of different lightweight wooden floors in frequency bands (50 Hz–5 kHz). 67 insulation measurements were used to develop the model by taking only two variables (material thickness and their installation order). The model demonstrated reasonable results regarding SNQ with a maximum difference of 1 dB in estimation of . However, the accuracy decreased with deviations up to 9 dB in prediction of (normalized weighted impact sound pressure level). This study had the sample size limitation, but showed good potential for predicting sound insulation data.
A complementary study was conducted [45] using 252 standardized laboratory measurements performed on lightweight wooden floors with construction parameters, such as material type, material thickness and density, area of the floor structure, etc. When more data are included, a better accuracy in predicting is achieved, within 5 dB variations. However, the variance in forecasting of increases up to 2 dB, but still represents reasonable results. The study then conducted an attribution analysis to find out the important parameters in forecasting sound insulation curves. However, the literature review at the time of this study did not find any study that attempted to develop an ANN model to estimate sound insulation curves of lightweight wooden façades.
The scope of this paper is to develop an ANN model to forecast airborne insulation curves of façade walls. The isolation data comprises laboratory measurements that are implemented on various lightweight wooden façades. This study considers specific structures for external building partitions. The measurements used are relating to complete wall systems without considering the presence of doors, windows, and small openings in the façades. Finally, a sensitivity analysis is conducted to explore the influence and the significance of parameters on the prediction of airborne sound insulation.
2. Materials and Methods
2.1. Definition of Artificial Neural Networks Approach
The ANN approach is a mathematical model which is inspired by human neural system to simulate its biological behavior [46]. The ANN approach is efficient with complex tasks and uses simple operations, such as addition, division, etc. [47,48]. A simple ANN model comprises of input layer, hidden, and output layer(s). In each layer, computation units or artificial neurons are existed to connect adjacent layers by weights [49]. ANN model propagates inputs values from first layer (input layer) to output layer by using weights as interconnections [50]. When propagating input values, also known as training phase, weight and bias values (features of ANN) are evaluated and tuned to reduce errors and achieve the highest possible accuracy. The output of each artificial neuron can be determined by
where y, , , and b are output, weight, input, and bias values, respectively. The calculated output of each neuron is called activation value, which is used as an input to the chosen activation function. The most common activation functions that are with ANN are tangent, sigmoid, and LeakyReLU [51].
2.2. Sensitivity Analysis
ANN models are usually considered to be black-box prediction tools, which makes understanding their mechanism quite cumbersome [52]. To understand the features on which the model depends, quantifying the attribution of forecasting power to input features must be characterized. This issue was formerly considered in different studies [53,54,55].
The attribution techniques are challenging to be analyzed empirically. Additionally, setting apart errors that are made by misbehavior of an attribution method or by misbehavior of a model is a challenging task. This gap could be addressed using an axiomatic approach, known as integrated gradients (IG) [56].
The integrated gradients method is given as . Supposing a function F: represents a network model. Using ∈ as an input and z ∈ as a baseline relative to x. Then a vector ∈ is the attribution of the input x, where is the attribution of of function . To extract the IG values, the gradients across the straight path between the input x and the baseline z should be integrated. Therefore, IG for dimension is donated by [56],
The integrated gradients method highlights the importance of each input parameter by giving a score to each input while approximating the integral of gradients. Thus, can lead to dimensionless diagram values. This it can be compensated and overcome by respecting units of the input values. In this study, all the input numerical values respect the SI units. This way allows the interpretation of the output diagrams of the sensitivity analysis by giving higher output values to the most significant parameters.
2.3. Acoustic Measurements
The developed database contains 100 standardized laboratory measurements received from Lund University in Sweden and The National Research Council (NRC-CNRC) [57] in Canada. The measured data consists of airborne insulation measurements of 100 various façade walls in one-third-octave bands (50 Hz to 5 kHz). They were performed according to ISO 10140-2 (2010) [12] and ASTM E90-09 (2016) [15].
To have a total agreement between insulation data, measurements that are performed in compliance with ASTM standards have been converted to follow ISO 717-1 (2013) [58] descriptor (the weighted airborne sound R). This conversion is essential to unify the acoustic descriptors in the measurements.
Figure 1a,b illustrate the 100 insulation curves of façades and mean with standard deviations, respectively. The database contains curves of airborne sound reduction index in frequency range from 50 Hz to 5 kHz. Hence, for every façade structure there are technical parameters and full-spectrum insulation curve. Table 1 summarizes the division of measurement numbers that are used to develop the network model.
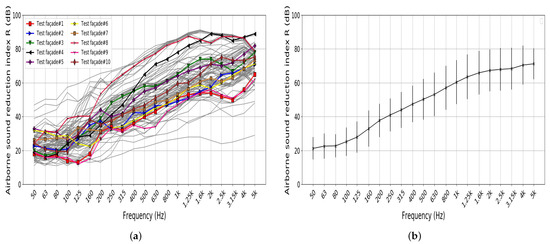
Figure 1.
Standardized laboratory curves for airborne sound reduction index of façade walls. (a) Airborne sound reduction index values. (b) Mean and standard variation of airborne sound insulation curves.

Table 1.
A description summary of measurement numbers used by the prediction model.
10 measurements of different façade walls are used to initiate the features of the ANN model (described in Section 2.1), and another set of 10 curves were selected (randomly) to test the accuracy of the model (Figure A1 in the Appendix A). Measurement curves that are selected for testing are part from the total number of measurements. They include the average tendency of isolation curves and extreme values as well, at all frequencies, as illustrated in test façades #4, #9 and #1 in Figure 1a.
In the database, each façade configuration is clustered in three parts: interior, main and exterior parts, respecting the installation order of each façade component. The dominant component or material is represented by the main part. Therefore, The interior and exterior sections present components clustered and located alongside the main façade material (Figure 2).
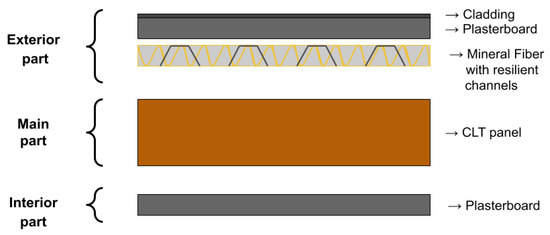
Figure 2.
An explanation schematic presenting how façade components are clustered in the database using an example of the test façade #6.
MySQL software [59] is used to organize the database using 10 variables of structural parameters of each façade wall (Table 2). Those parameters present the input that are used to train the network model. They are arranged considering type of each façade component, their installation position, thickness and density of each layer, depth of studs and spacing between them, area of a façade (S), volume of a receiving room (V), group and total thickness and mass of a structure, resilient metal channel depth and spacing between them. Values of airborne sound reduction index in one-third-octave bands are used as outputs or targets of the ANN model. Despite the fundamental role of certain elastic properties on the sound transmission, such as dynamic stiffeners and the modulus of elasticity of each material, they are not taken into account in the input parameters due to the lake of information in acoustic measurement reports.
Table 2.
Structural variables used to organize the database and employed as inputs for the network model.
2.4. Configuration of the ANN Model
In this study, a multilayer perceptron class of ANN is used. The network comprises two hidden layers, and each layer consists of 40 and 30 artificial neurons, respectively. Cross-validation technique is employed to validate the network model and to prevent overfitting issues [50,60]. As an activation function, LeakyReLU (Leaky Rectified Linear Unit) is chosen for hidden layers. It is usually used to overcome the vanishing gradient issues. This problem could face other activation functions, such as tan or sigmoid [61]. During the training phase, Adam optimizer [62] is employed, which is one of several optimization algorithms used to optimize neural networks [63]. It is based on the gradient descent method to minimize errors that are made by a prediction model during the training phase [64].
Three subsets of the data are used by splitting the entire measurements called: training, validation, and test set. of the total number of measurements is used for training set, while for each validation and testing (Table 1). Data used for training is employed to initiate network patterns or features, such as bias, weights, etc. However, the validation data provides a way to optimize the model’s hyper-parameters, i.e., number of hidden layers and neurons. The term “cost function” is an expression gives indication of the predictive power of the model. Since the predictions are continuous values (insulation curves), the root-mean-square error () function can be used as a cost function,
where n presents the number of observations (measurements) that are used in the training phase. Output (predicted) and input (measured) values are donated by and , respectively. In this study, the developed model illustrates an overall prediction accuracy of 4.44 dB for all predicted and measured curves. However, for a better judgment of the results and considering various frequency bands, each estimated insulation curve is analyzed with comparison to measured one using the function considering values in each one-third-octave band from 50 Hz to 5 kHz.
3. Results and Discussion
3.1. Comparison between Measurements and Predictions
The ANN model is trained and validated with 80 and 10 standardized laboratory measurements, respectively. In addition, 10 measurements are employed for testing the accuracy in prediction of airborne sound reduction curves. The acoustic behavior of each wall (in dB) in -octave frequencies (50 Hz–5 kHz) is used as a dependent variable.
Predicted and measured airborne curves of test façade walls are shown in Figure 3. It is significant that predicted and measured insulation curves are close, with some deviations in certain cases. The deviations between predicted and measured curves increase in some samples in low and/or high frequency bands. The smallest deviation is notable in façade with a value of 2.19 dB, while the largest is 5.73 dB in façade which has slightly complex configuration.
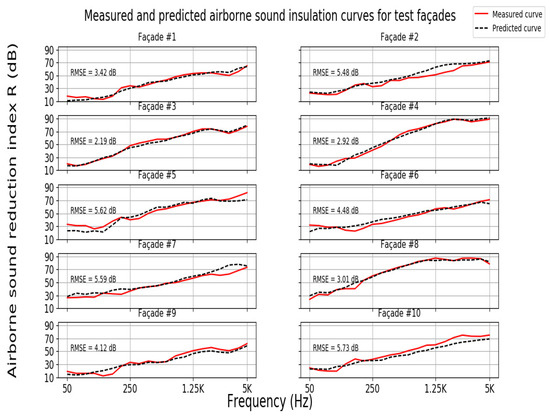
Figure 3.
Predicted and measured airborne sound reduction index curves of test façades.
At high frequencies (1.25–3 kHz), a significant gap is observed in the results. The later frequency range usually includes the critical frequency of lightweight constructions. This frequency is also called coincidence frequency, at which occurs a match between the wavelength of the bending wave in the plate and incident acoustic wavelength which is projected onto the plate [17]. A good coupling or matching means that the structure will efficiently and easily radiate sound at and above this frequency [65].
In addition, similar variations are visible at frequencies lower than 200 Hz, e.g., façades #1, #8 and #9. That can happen due to the effect of first eigenfrequencies or fundamental resonances [17]. It is also observed that the trend of certain estimated curves becomes smoother in bands close to low resonances and/or critical frequencies. This reveals that the main difficulties in estimation of sound reduction values are appeared near those bands. Similar problems with ANN models were also reported in other studies [25,45].
Table 3 represents root-mean-square errors (RMSE) in the prediction of airborne sound reduction curves. It also includes the calculated single-number quantities (SNQ), and , that corresponds to each curve. The highest error is up to 3 dB (façade #7), while the model can predict the same weighted values for façade #3 and #6. In addition, the calculated and predicted correlation terms and , which are presented in Table 3, show a maximum difference of 4 dB in façade #5.
Table 3.
Predicted and measured weighted sound reduction indices of test façades.
Figure 4 depicts normalized error deviation values (in interval [−1, 1]). The highest error variations are located at high frequencies (1.25–5 kHz) (e.g., façade #2, #7 and #10). In low frequency bands (50–200 Hz), the model shows certain gaps between measured and predicted curves, such as façade #5 and #9. Moreover, Figure 4 illustrates that errors appear to be distributed alike at low and high frequencies, while a better accuracy can be achieved in the middle frequencies (250 Hz–1 kHz).
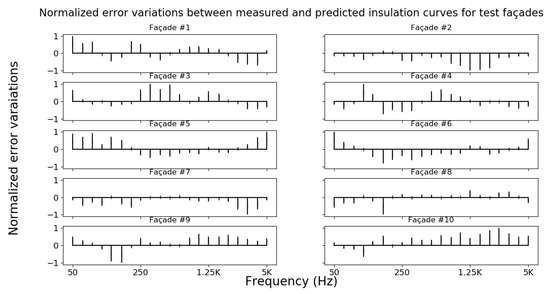
Figure 4.
Normalized error distributions of estimated airborne reduction curves for tested walls.
Figure 5 shows a probability density function of error distributions in the estimation of isolation curves across all frequencies. It is noticeable that the highest error density is in the (−5, 5) dB range. The graph shows a peak around 0 dB that reveals the goodness of the model at predicting airborne sound insulation curves with convenient results.
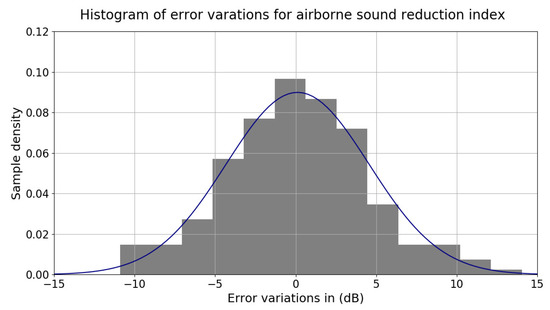
Figure 5.
Probability density function of errors in prediction of airborne reduction curves for test façades in frequency range (50 Hz–5 kHz).
3.2. Sensitivity Analysis of Façade Parameters
A sensitivity analysis is used to reveal the influence of each structural parameter on sound insulation forecast. This technique also provides information concerning the contribution of input variables in each frequency band. Frequent building materials used in façade constructional components are selected to explore their influence on the network model (Figure 6). Additionally, physical parameters have been included in the attribution analysis, such as façade tested area, receiving room volume, thickness and density of interior, main, and exterior parts of façades (Figure 7 and Figure 8). A reader can use those type of graphs and figure out the relationship between input variables and prediction values depending on the magnitude of y-axis as an indication to quantify the attribution of each input variable. Values close to zero indicate a weak effect size of structural parameters on the estimations. In contrast, higher values suggest a strong relationship. Often, the integrated gradient analysis gives signed values. This is sometimes difficult to explain, depending on the application used [52]. Since the target of this analysis is to shed light the importance of input parameters, using the absolute values may help to better interpret the results.
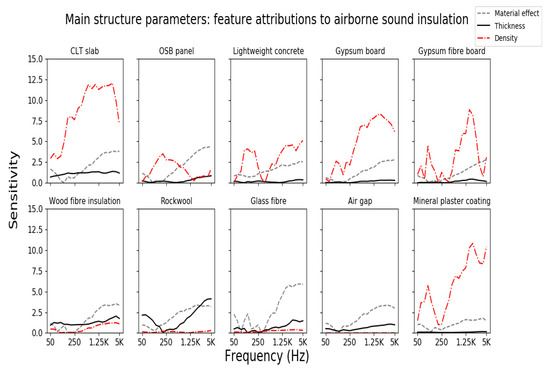
Figure 6.
Attribution analysis of structural components to the prediction of airborne insulation curves.
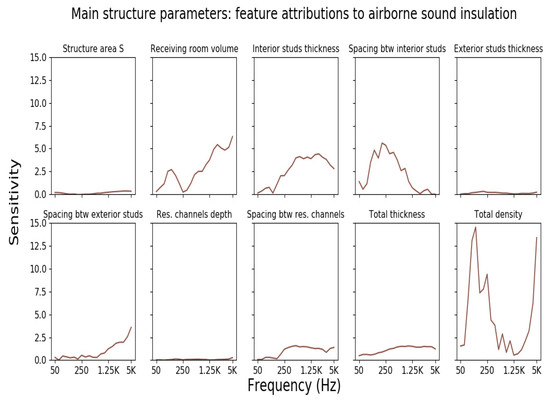
Figure 7.
Attributions analysis of additional variables to the prediction of airborne insulation curves.
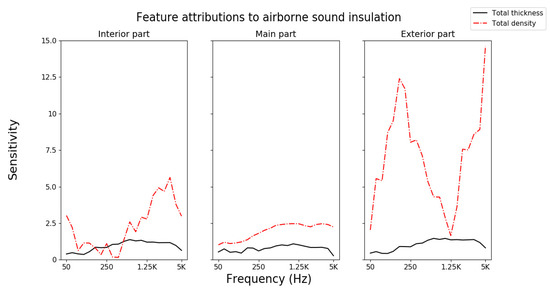
Figure 8.
Feature attributions of interior, main and exterior parts façade structures to predictions of airborne sound insulation.
Another classification is carried out on the database to explore the influence of the thickness and the density of exterior, main and interior parts of façade structures on prediction of airborne sound insulation curves.
Attributions Analysis to Airborne Sound Insulation
Figure 6 describes feature attributions of the chosen building materials to the prediction of sound isolation. It shows the effect size of thickness and density of building materials and the importance of their presence. At low frequencies, results highlight the density effects of the CLT (cross-laminated timber) panel, OSB (oriented strand board) and lightweight concrete panels on the predictions. However, the sensitivity effect of the latter increases in middle and high frequencies, except for the OSB panel. In addition, the density of a gypsum board has an important attribution, the higher the frequency bands. For gypsum fiberboard, the effect of its density increases significantly compared to normal gypsum board, especially in low frequency bands. The latter can be explained due to stiffer material of gypsum fiberboard where the stiffness is dominant at low frequencies. Density of the insulation materials shows a non-negligible attribution across all frequencies, but more pronounced for wood fiber insulation at high frequencies.
A previous study [66] emphasizes the effectiveness of rockwool density in improving the isolation below 1.25 kHz, which is in accordance with findings in Figure 6. Moreover, the density of coating material (mineral plaster) is also essential at low and high frequencies.
Regarding the attribution of material thickness, it is noticeable that thickness of the CLT panel is essential in all frequencies. The same observation was also found for the thickness of insulation materials, air gap and coating material. However, the attribution of some materials’ thickness tends to increase at middle and high frequency, such as OSB panel and gypsum board, where the mass control region starts to dominate [17]. Furthermore, the existence of certain building components (material effect) has a bigger effect than the densities or thicknesses on airborne sound insulation, such as air gap and glass fiber.
Figure 7 shows the attributions of additional parameters to airborne sound estimations. It reveals a small influence of surface area S of a façade structure in very low and high frequencies. The importance of the structure area on prediction of airborne sound in low frequency bands is also reported in [67]. In addition, the receiving room volume V is vital at all frequencies, particularly at higher ranges, where energy of short sound waves can be easily damped out due to relaxation phenomena. This is more evident at high frequencies and/or in larger rooms, where the energy is exchanged between the sound wave and air particles; the particles extract energy from the propagating waves and release it after a delay. This action leads to hysteretic energy losses, which contributes to sound attenuation [17]. The latter agrees with [45] and contrasts with another study [67] that showed the unimportance of V in the low frequency range. Contrary to the thickness of exterior studs in a façade wall, the thickness of interior studs is a factor of higher weight on prediction across all frequencies. Moreover, the spacing between interior studs affects the predictions at low and middle frequencies, while the importance of spacing between exterior studs is only revealed at high frequencies. This finding emphasizes the role of mechanical connections, also known as sound bridges, in creating transmission paths and thus reducing insulation improvements [17,68]. No remarkable attributions have been revealed for the depth of the resilient channels, except at very high frequencies. However, the spacing between the resilient channels has a noticeable effect in middle and high frequency bands. The total thickness of a façade structure influences the predictions at all frequencies, which is also concluded in [67]. Additionally, the total density affects the prediction the most across all frequencies, as also reported in [45]. The attribution spectrum of the total density of a façade reveals a peak near 150 Hz and a dip near 1.25 kHz, which is probably due to effects of fundamental and critical frequencies, respectively. This is likely due to coupling between resonant façade components that allows energy to transfer between elements [65]. The latter happens when elements are physically connected, and they have sufficiently close natural or critical frequencies. This amplifies the radiations from components and affects the isolation negatively [17].
Plots in Figure 8 illustrate the contribution of the thickness and density of interior, main and exterior parts of façade walls to prediction of insulation curves. It can be observed that the density and thickness played an important role on the estimations across all frequencies. The same trends for the attribution of façade total density (Figure 7) is noticed for the total density of the exterior part. Moreover, the effects of fundamental and critical frequencies are also remarkable on the attribution of the total density of interior and main parts, but with lower scale.
Table 4 summarizes error distributions in the prediction of airborne insulation curves considering three frequency ranges: low (50–200 Hz), middle (250 Hz–1 kHz) and high (1.25–5 kHz) frequency. The () function is employed to calculate the errors. The best accuracy achieved is at middle frequencies, with an error of 3.52 dB. However, error deviations increased at low and high frequencies with values of 4.67 and 4.99 dB, respectively. Again, the higher deviations can be presumably described due to presence of resonance and critical frequencies.
Table 4.
Error distributions in the prediction of airborne sound reduction index R considering three frequency regions.
However, one may consider that the ANN model does not treat uncertainties. In other words, the prediction model does not consider the uncertainties in acoustic measurements which may affect the predictive accuracy. Since the measurements are collected from different laboratories (Lund University and NRC-CNRC), this could present a source of uncertainties. The latter is also reported by a part of a European project that conducted acoustic measurements for lightweight partitions using 19 different European laboratories [69]. The results presented by authors emphasize that the measured acoustic performance of structures could depict some differences from one laboratory to another depending on various factors, such as installation details of the partitions, laboratory design, number of diffuses, etc., [69]. In addition, the human factor can also affect the accuracy of acoustic measurements, depending on the person performing the measurements and her/his knowledge and experience [70]. Those factors are not taken into account while developing the ANN, and they somehow have an influence on the predictive capability of the model.
4. Conclusions
This paper reveals the potential of a prediction model using an artificial neural networks approach to forecast airborne insulation curves based on 100 laboratory measurements of different lightweight façades. The developed model shows reliable results with root-mean-square error () within 2.19–5.73 dB for estimating the sound insulation curves of various façades in the frequency bands 50 Hz–5 kHz. When the comparison considers the single-number quantity, the weighted sound reduction index , the prediction accuracy improved with errors of 0–3 dB.
In general, the model demonstrates better estimations at middle frequencies (250 Hz–1 kHz). However, the forecast of around fundamental and critical frequencies in certain tested façades marked variations, underlying the resonance effects on the insulation behavior of façades and inefficiency of the model to predict around those frequency bands.
A sensitivity analysis is implemented to estimate the effects of constructional input parameters on estimation of airborne insulation curves. Density of CLT panels is a significant variable in all frequency bands. Similar findings apply to the thickness of the insulation materials, especially at middle and high frequencies. Moreover, the total thickness and total density of interior, main and exterior parts of façades have significant effects in all frequencies with higher attribution to the total density of the exterior part. The coupling between resonant façade components, resulting from fundamental and critical frequencies of each component, has a significant influence on the prediction.
The prediction of with a maximum error of 3 dB encourages designers to consider the model from the perspective of practical engineering work on sound insulation in buildings. In particular, differences of 1 to 2 dB are less than the noticeable differences for the noise level. Additionally, the present model could provide a predictive tool with which the construction time and cost of acoustic measurements (for a certain type of partitions) could be saved.
Further research would be expected on optimization of certain parameters to control and improve the prediction of sound insulation. This would pave the way to explore the appropriate structural parameters to achieve the desired isolation.
Author Contributions
Writing—original draft; methodology; validation; formal analysis; investigation, M.B.E.; writing—review and editing, M.B.E.; review; supervision; validation, N.-G.V., S.M., D.B.H. and J.-L.K.; project administration; funding acquisition, S.M. All authors have read and agreed to the published version of the manuscript.
Funding
This research was funded by the Natural Sciences and Engineering Research Council (NSERC) of Canada through its IRC and CRD programs (IRCPJ 461745-18 and RDCPJ 524504-18), the Region Nouvelle-Aquitaine (ref. 2017-1R10223) and the industrial partners of the NSERC industrial chair on eco-responsible wood construction (CIRCERB).
Institutional Review Board Statement
Not applicable.
Informed Consent Statement
Not applicable.
Data Availability Statement
Data cannot be provided as they are confidential.
Acknowledgments
The authors are grateful to Lund University and CNRC for providing the acoustic measurement data of sound insulation.
Conflicts of Interest
The authors declare no conflict of interest.
Appendix A
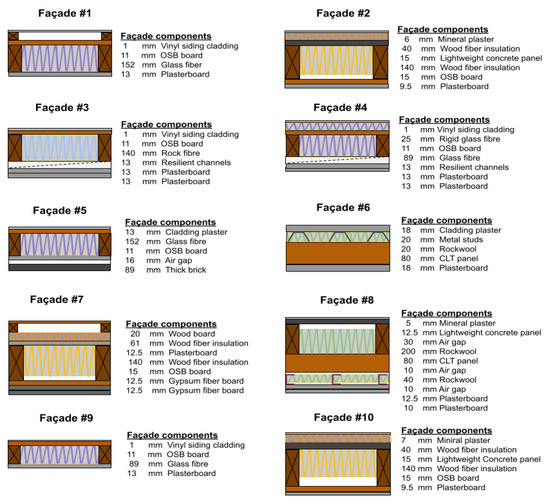
Figure A1.
Structural components of the tested façad walls that have been selected to test the accuracy of the network model in prediction of airborne insulation curves.
References
- Radkau, J. Wood: A History; Polity: Cambridge, UK, 2012. [Google Scholar]
- Ottelin, J.; Amiri, A.; Steubing, B.; Junnila, S. Comparative carbon footprint analysis of residents of wooden and non-wooden houses in Finland. Environ. Res. Lett. 2021, 16, 074006. [Google Scholar] [CrossRef]
- Bettarello, F.; Gasparella, A.; Caniato, M. The Influence of Floor Layering on Airborne Sound Insulation and Impact Noise Reduction: A Study on Cross Laminated Timber (CLT) Structures. Appl. Sci. 2021, 11, 5938. [Google Scholar] [CrossRef]
- Jayalath, A.; Navaratnam, S.; Gunawardena, T.; Mendis, P.; Aye, L. Airborne and impact sound performance of modern lightweight timber buildings in the Australian construction industry. Case Stud. Constr. Mater. 2021, 15, e00632. [Google Scholar] [CrossRef]
- Forssén, J.; Kropp, W.; Brunskog, J.; Ljunggren, S.; Bard, D.; Sandberg, G.; Ljunggren, F.; Ågren, A.; Hallström, O.; Dybro, H.; et al. Acoustics in Wooden Buildings, State of the Art 2008, Vinnova Project 2007-01653; Report 2008:16, SP Trätek; Technical Research Institute of Sweden: Stockholm, Sweden, 2008. [Google Scholar]
- Popovski, M.; Ni, C. Mid-Rise Wood-Frame Construction Handbook; FPInnovations: Vancouver, BC, Canada, 2015. [Google Scholar]
- Pei, S.; Rammer, D.; Popovski, M.; Williamson, T.; Line, P.; van de Lindt, J.W. An overview of CLT research and implementation in North America. In Proceedings of the WCTE 2016, Vienna, Austria, 22–25 August 2016. [Google Scholar]
- Rasmussen, B.; Machimbarrena, M. Building Acoustics throughout Europe Volume 1: Towards a Common Framework in Building Acoustics throughout Europe; DiScript Preimpresion, S.L.: Madrid, Spain, 2014. [Google Scholar]
- Hassan, O.A. Building Acoustics and Vibration: Theory and Practice; World Scientific Publishing Company: Singapore, 2009. [Google Scholar]
- Vardaxis, N.G.; Bard, D.; Persson Waye, K. Review of acoustic comfort evaluation in dwellings—part I: Associations of acoustic field data to subjective responses from building surveys. Build. Acoust. 2018, 25, 151–170. [Google Scholar] [CrossRef] [Green Version]
- Secchi, S.; Cellai, G.; Fausti, P.; Santoni, A.; Martello, N.Z. Sound transmission between rooms with curtain wall façades: A case study. Build. Acoust. 2015, 22, 193–207. [Google Scholar] [CrossRef]
- ISO.140-2; Acoustics–Laboratory Measurement of Sound Insulation of Building Elements—Part 2: Measurement of Airborne Sound Insulation. International Organization for Standardization: Geneva, Switzerland, 2010.
- ISO.16283-1; Acoustics–Field Measurement of Sound Insulation in Buildings and of Building Elements–Part 1: Airborne Sound Insulation. International Organization for Standardization: Geneva, Switzerland, 2014.
- ISO.16283-3; Acoustics–Field Measurement of Sound Insulation in Buildings and of Building Elements—Part 3: Façade Sound Insulation. International Organization for Standardization: Geneva, Switzerland, 2016.
- ASTM.E90-09; Standard Test Method for Laboratory Measurement of Airborne Sound Transmission Loss of Building Partitions and Elements. ASTM International: West Conshohocken, PA, USA, 2016.
- ASTM.E966-04; Standard Guide for Field Measurements of Airborne Sound Insulation of Building Facades and Facade Elements. ASTM International: West Conshohocken, PA, USA, 2010.
- Vigran, T.E. Building Acoustics; CRC Press: Boca Raton, FL, USA, 2014. [Google Scholar] [CrossRef]
- Clark, D.M. Subjective study of the sound-transmission class system for rating building partitions. J. Acoust. Soc. Am. 1970, 47, 676–682. [Google Scholar] [CrossRef]
- Beranek, L.L.; Work, G.A. Sound transmission through multiple structures containing flexible blankets. J. Acoust. Soc. Am. 1949, 21, 419–428. [Google Scholar] [CrossRef]
- Mulholland, K.; Price, A.; Parbrook, H. Transmission loss of multiple panels in a random incidence field. J. Acoust. Soc. Am. 1968, 43, 1432–1435. [Google Scholar] [CrossRef]
- Kang, H.J.; Ih, J.G.; Kim, J.S.; Kim, H.S. Prediction of sound transmission loss through multilayered panels by using Gaussian distribution of directional incident energy. J. Acoust. Soc. Am. 2000, 107, 1413–1420. [Google Scholar] [CrossRef] [PubMed]
- Davy, J.L. The improvement of a simple theoretical model for the prediction of the sound insulation of double leaf walls. J. Acoust. Soc. Am. 2010, 127, 841–849. [Google Scholar] [CrossRef] [Green Version]
- Van den Wyngaert, J.C.; Schevenels, M.; Reynders, E.P. Predicting the sound insulation of finite double-leaf walls with a flexible frame. Appl. Acoust. 2018, 141, 93–105. [Google Scholar] [CrossRef]
- Caniato, M. Sound insulation of complex façades: A complete study combining different numerical approaches. Appl. Acoust. 2020, 169, 107484. [Google Scholar] [CrossRef]
- Serpilli, F.; Di Nicola, G.; Pierantozzi, M. Airborne sound insulation prediction of masonry walls using artificial neural networks. Build. Acoust. 2021, 28, 391–409. [Google Scholar] [CrossRef]
- Garg, N.; Dhruw, S.; Gandhi, L. Prediction of sound insulation of sandwich partition panels by means of artificial neural networks. Arch. Acoust. 2017, 42, 643–651. [Google Scholar] [CrossRef] [Green Version]
- Craik, R.; Smith, R. Sound transmission through double leaf lightweight partitions part I: Airborne sound. Appl. Acoust. 2000, 61, 223–245. [Google Scholar] [CrossRef]
- Hongisto, V. Airborne Sound Insulation of Wall Structures: Measurement and Prediction Methods; Helsinki University of Technology: Espoo, Finland, 2000. [Google Scholar]
- Legault, J.; Atalla, N. Sound transmission through a double panel structure periodically coupled with vibration insulators. J. Sound Vib. 2010, 329, 3082–3100. [Google Scholar] [CrossRef]
- Santoni, A.; Davy, J.L.; Fausti, P.; Bonfiglio, P. A review of the different approaches to predict the sound transmission loss of building partitions. Build. Acoust. 2020, 27, 253–279. [Google Scholar] [CrossRef]
- Guigou-Carter, C.; Villot, M.; Wetta, R. Prediction method adapted to wood frame lightweight constructions. Build. Acoust. 2018, 13, 173–188. [Google Scholar] [CrossRef]
- Buratti, C.; Barelli, L.; Moretti, E. Wooden windows: Sound insulation evaluation by means of artificial neural networks. Appl. Acoust. 2013, 74, 740–745. [Google Scholar] [CrossRef]
- Vorländer, M. Building acoustics: From prediction models to auralization. In Proceedings of the ACOUSTICS 2006, Christchurch, New Zealand, 20–22 November 2006. [Google Scholar]
- ISO.12354-1; Building Acoustics–Estimation of Acoustic Performance of Buildings from the Performance of Elements—Part 1: Airborne Sound Insulation between Rooms. International Organization for Standardization: Geneva, Switzerland, 2017.
- Thai, L.H.; Hai, T.S.; Thuy, N.T. Image classification using support vector machine and artificial neural network. Int. J. Inf. Technol. Comput. Sci. 2012, 4, 32–38. [Google Scholar] [CrossRef] [Green Version]
- Abdel-Hamid, O.; Deng, L.; Yu, D. Exploring convolutional neural network structures and optimization techniques for speech recognition. In Interspeech; Citeseer: Princeton, NJ, USA, 2013. [Google Scholar]
- Sign-to-speech translation using machine-learning-assisted stretchable sensor arrays. Nat. Electron. 2020, 3, 571–578. [CrossRef]
- Dangeti, P. Statistics for Machine Learning; Packt Publishing Ltd.: Birmingham, UK, 2014. [Google Scholar]
- Nagaya, K.; Li, L. Control of sound noise radiated from a plate using dynamic absorbers under the optimization by neural network. J. Sound Vib. 1997, 208, 289–298. [Google Scholar] [CrossRef]
- Ma, C.; Chen, C.; Liu, Q.; Gao, H.; Li, Q.; Gao, H.; Shen, Y. Sound quality evaluation of the interior noise of pure electric vehicle based on neural network model. IEEE Trans. Ind. Electron. 2017, 64, 9442–9450. [Google Scholar] [CrossRef]
- Ciaburro, G.; Iannace, G.; Passaro, J.; Bifulco, A.; Marano, D.; Guida, M.; Marulo, F.; Branda, F. Artificial neural network-based models for predicting the sound absorption coefficient of electrospun poly (vinyl pyrrolidone)/silica composite. Appl. Acoust. 2020, 169, 107472. [Google Scholar] [CrossRef]
- Iannace, G.; Trematerra, A.; Ciaburro, G. Case study: Automated recognition of wind farm sound using artificial neural networks. Noise Control Eng. J. 2020, 68, 157–167. [Google Scholar] [CrossRef]
- Shin, H.K.; Park, S.H.; Kim, K.W. Inter-floor noise classification using convolutional neural network. PLoS ONE 2020, 15, e0243758. [Google Scholar] [CrossRef] [PubMed]
- Bader Eddin, M.; Menard, S.; Bard, D.; Kouyoumji, J.L.; Vardaxis, N.G. A Sound Insulation Prediction Model for Floor Structures in Wooden Buildings Using Neural Networks Approach. In Proceedings of the INTER-NOISE and NOISE-CON Congress and Conference Proceedings, Washington, DC, USA, 1–5 August 2021; Institute of Noise Control Engineering: Reston, VA, USA, 2021. [Google Scholar] [CrossRef]
- Bader Eddin, M.; Ménard, S.; Bard Hagberg, D.; Kouyoumji, J.-L.; Vardaxis, N.-G. Prediction of Sound Insulation Using Artificial Neural Networks—Part I: Lightweight Wooden Floor Structures. Acoustics 2022, 4, 203–226. [Google Scholar] [CrossRef]
- Svozil, D.; Kvasnicka, V.; Pospichal, J. Introduction to multi-layer feed-forward neural networks. Chemom. Intell. Lab. Syst. 1997, 39, 43–62. [Google Scholar] [CrossRef]
- Graupe, D. Principles of Artificial Neural Networks; World Scientific: Singapore, 2013. [Google Scholar]
- Goodfelow, I.; Bengio, Y.; Courville, A. Deep Learning (Adaptive Computation and Machine Learning Series); MIT Press: Cambridge, MA, USA, 2016. [Google Scholar]
- Schmidhuber, J. Deep learning. Scholarpedia 2015, 10, 32832. [Google Scholar] [CrossRef] [Green Version]
- Nielsen, M.A. Neural Networks and Deep Learning; Determination Press: San Francisco, CA, USA, 2015. [Google Scholar] [CrossRef] [Green Version]
- Sharma, S.; Sharma, S.; Athaiya, A. Activation functions in neural networks. Towards Data Sci. 2017, 6, 310–316. [Google Scholar] [CrossRef]
- Smilkov, D.; Thorat, N.; Kim, B.; Viégas, F.; Wattenberg, M. Smoothgrad: Removing noise by adding noise. arXiv 2017, arXiv:1706.03825. [Google Scholar] [CrossRef]
- Baehrens, D.; Schroeter, T.; Harmeling, S.; Kawanabe, M.; Hansen, K.; Müller, K.R. How to explain individual classification decisions. arXiv 2009, arXiv:0912.1128. [Google Scholar] [CrossRef]
- Shrikumar, A.; Greenside, P.; Shcherbina, A.; Kundaje, A. Not just a black box: Learning important features through propagating activation differences. arXiv 2016, arXiv:1605.01713. [Google Scholar] [CrossRef]
- Simonyan, K.; Vedaldi, A.; Zisserman, A. Deep inside convolutional networks: Visualising image classification models and saliency maps. arXiv 2013, arXiv:1312.6034. [Google Scholar] [CrossRef]
- Sundararajan, M.; Taly, A.; Yan, Q. Axiomatic attribution for deep networks. In Proceedings of the International Conference on Machine Learning, PMLR, Sydney, Australia, 6–11 August 2017; pp. 3319–3328. [Google Scholar]
- Bradley, J.S.; Birta, J.A. Laboratory Measurements of the Sound Insulation of Building Facade Elements; Institute for Research in Construction, National Research Council Canada: Ottawa, ON, Canada, 2000. [Google Scholar]
- ISO.717-1; Acoustics—Rating of Sound Insulation in Buildings and of Buildings Elements—Part 1: Airborne Sound Insulation. International Organization for Standardization: Geneva, Switzerland, 2013.
- Widenius, M.; Axmark, D.; Arno, K. MySQL Reference Manual: Documentation from the Source; O’Reilly Media, Inc.: Newton, MA, USA, 2002. [Google Scholar]
- Géron, A. Hands-on Machine Learning with Scikit-Learn, Keras, and TensorFlow: Concepts, Tools, and Techniques to Build Intelligent Systems; O’Reilly Media, Inc.: Newton, MA, USA, 2019. [Google Scholar]
- Xu, J.; Li, Z.; Du, B.; Zhang, M.; Liu, J. Reluplex made more practical: Leaky ReLU. In Proceedings of the 2020 IEEE Symposium on Computers and Communications (ISCC), Rennes, France, 7–10 July 2020; IEEE: Piscataway, NJ, USA, 2020. [Google Scholar] [CrossRef]
- Kingma, D.P.; Ba, J. Adam: A method for stochastic optimization. arXiv 2014, arXiv:1412.6980. [Google Scholar] [CrossRef]
- Ruder, S. An overview of gradient descent optimization algorithms. arXiv 2016, arXiv:1609.04747. [Google Scholar] [CrossRef]
- Tato, A.; Nkambou, R. Improving Adam Optimizer. 2018. Available online: https://openreview.net/pdf?id=HJfpZq1DM (accessed on 9 November 2021).
- Rindel, J.H. Sound Insulation in Buildings; CRC Press: Boca Raton, FL, USA, 2017. [Google Scholar] [CrossRef]
- Uris, A.; Llopis, A.; Llinares, J. Effect of the rockwool bulk density on the airborne sound insulation of lightweight double walls. Appl. Acoust. 1999, 58, 327–331. [Google Scholar] [CrossRef]
- Fora-Moncada, A.; Gibbs, B. Prediction of sound insulation at low frequencies using artificial neural networks. Build. Acoust. 2002, 9, 49–71. [Google Scholar] [CrossRef]
- Dijckmans, A.; De Geetere, L.; Wuyts, D.; Ingelaere, B. The effect of mechanical connectors on the sound insulation of structural insulating panels. In Proceedings of the InINTER-NOISE and NOISE-CON Congress and Conference Proceedings, Chicago, IL, USA, 26–29 August 2018; Volume 9, pp. 1261–1272. [Google Scholar]
- Demanet, C.; De Rozas, M.J.; Chene, J.B.; Foret, R. European Round Robin Test for sound insulation measurements of lightweight partition. In Proceedings of the InterNoise, Osaka, Japan, 4–7 September 2011. [Google Scholar]
- Wszołek, G.; Engel, Z. Investigations of uncertainty of acoustical measuring instruments applied to noise control. Arch. Acoust. 2004, 29, 283–295. [Google Scholar]
Publisher’s Note: MDPI stays neutral with regard to jurisdictional claims in published maps and institutional affiliations. |
© 2022 by the authors. Licensee MDPI, Basel, Switzerland. This article is an open access article distributed under the terms and conditions of the Creative Commons Attribution (CC BY) license (https://creativecommons.org/licenses/by/4.0/).