Article

Weak Signal Processing Methods Based on Improved HHT and Filtering Techniques for Steel Wire Rope

1
College of Engineering, Huazhong Agricultural University, Wuhan 430070, China
2
School of Mechanical Science and Engineering, Huazhong University of Science and Technology, Wuhan 430074, China
*
Author to whom correspondence should be addressed.
Appl. Sci. 2022, 12(14), 6969; https://doi.org/10.3390/app12146969
Submission received: 24 May 2022 / Revised: 1 July 2022 / Accepted: 6 July 2022 / Published: 9 July 2022
(This article belongs to the Special Issue Advanced Digital Non-Destructive Testing Technology)

Abstract

:
As one of the most important processes in steel wire rope inspection, defect signal processing is of great significance in guaranteeing safety and precision measurement. Aiming at the weak signal detection of steel wire rope with mixed strands and noise, a combined signal processing method based on magnetic flux leakage testing and multi-step filtering techniques are proposed in this paper. The experiments are first introduced and performed on three typical types of steel wire rope with diameters of 28 mm, 32 mm, 45 mm, and different wire broken defects detected under liftoff distances of 13 mm and 20 mm; the acquired signals are then analyzed both in time and frequency domain. According to the weak signal characterizations, the principle of the proposed methods and algorithm are given concretely. Afterwards, comparison of signal processing results between the traditional lowpass filtering, wavelet denoising, median filtering, and the proposed method are presented. Finally, the influence factors of smoothing types and moving average span of the proposed methods are investigated. The processing results of the proposed methods are shown through short-time Fourier transform and signal-to-noise ratio analysis, which not only demonstrates the validity and feasibility of the combined methods with the highest signal to noise ratio of 90.37 dB, but also exhibits a great potential of precision defect detection and practical application in steel wire rope inspection.

1. Introduction

Steel wire rope is widely used in practical applications as loading and stretching with high strength and toughness in complex scenes such as the elevator, mine, and crane, which plays an important role in various engineering machinery [1,2]. However, the failure of wire rope such as becoming broken [3], corrosion [4], and wear and fatigue [5] has caused huge losses to the economy and human lives. Therefore, many nondestructive testing methods [6,7] have appeared in wire rope defect inspection, for instance, the widely used magnetic flux leakage testing method [8], metal magnetic memory, [9] and ultrasonic guided wave detection method [10]. The defect is tinny in most cases, while the detection signals are very weak and mixed with strand signals as a result of the spiral wire rope structures and environmental noises [11,12], which makes the wire rope defect identification and signal processing full of difficulty and challenges.
Generally, two main types of wire rope defects were investigated, namely, the local fault (LF) and loss of metallic sectional area (LMA). When the wire rope was scanned and the defect was sensed or captured by the sensor such as the inductive coil, the hall element and magnetic resistance sensor, and different inspection signal components could be acquired. As a consequence, a mass of signal denoising methods were proposed on account of the complex detection and interference environment. Ju-Won Kim et al. [13] proposed a Hilbert transform-based enveloping and quantification magnetic flux leakage (MFL) signal processing method for wire rope damage detection. Tian Jie et al. [14] applied a morphological non-sampling and wavelet reconstruction-based wire rope signal processing method in a coal mine, which filtered the noises effectively by increasing the signal-to-noise ratio (SNR) and decreasing the elapsed time. Zhang Ou et al. [15] proposed a multilevel wavelet and median filtering combined wire rope denoising algorithm, which not only increased the SNR, but also enhanced the signal quality. Donglai Zhang et al. [16] presented a new coil winding structure sensor with iron core inside, which improved the SNR almost six times compared with traditional inductive coil, and eliminated the influence of coil cross sectional area and liftoff effect to some extent. Other wire rope denoising methods such as the notch filtering [17], wavelet energy [18], tone-burst wavelet [19], adaptive filtering [20], and empirical mode decomposition-based [21] techniques were also reported, which were frequently applied and discussed in coal mines and elevators. According to the difference of wire rope inspection and defect sensing methods, other physical field characterizations as well as the wire rope structures were also utilized in wire rope signal processing. Humberto Henao et al. [22] observed the fleet angle effect in the bird caging defect detection in a hoist winch system by indirectly analyzing the signals of stator current and load torque of a three-phase induction machine, which was experimentally demonstrated as a new noninvasive method in wire rope signal processing and defect inspection. Esther-Sabrina Wacker et al. [23] obtained a surface anomaly detecting accuracy of 95% by making use of the wire rope structure and appearance, combining with image synthesis techniques and automatic visual inspection by the pattern recognition. Dalvir Kaur et al. [24] proposed LF and LMA characterizations and an MFL image signal processing method by the axially and circumferentially hall testing signals processing using feature extraction of gray level co-occurrence matrix and back propagation (BP) network. Zuopu Zhou et al. [25] solved the strand noise problems under a strong shaking detecting environment by using the principle of multi-channel signal fusion and median filtering techniques for MFL images of steel wire rope. Edmundas Kazimieras Zavadskas et al. [26] applied a multi-criteria analysis method for wire rope inspection data by experiments of wire rope vibration in different range of frequencies. As the artificial intelligent techniques of machine learning deeply develops, many related studies have been reported regarding to the wire rope signal processing and quantitative defect inspection. For instance, Li-jun Li et al. [27] proposed a discrimination method-based multi-array weak signal processing for wire rope, which not only improved the defect detection dimension and accuracy through binarizing local gray value of MFL data, but also realized the quantitative analysis of defect size. Gongbo Zhou et al. [28] proposed a convolutional neural network-based hoisting wire rope inspection method, which could detect various faults such as the broken strand and twisted ropes automatically in real-time, and compared with k-nearest neighbor and an artificial neural network with back propagation. Moreover, other intelligent processing methods may also include the artificial neural network [29], support vector machine [30], AdaBoost classifier [31], and deep learning algorithms [32], which all improved the defect detection accuracy for steel wire rope.
However, most of the signal denoising and processing methods such as the time domain filtering and frequency analysis only aim at the single environment, and some of the testing results were obtained even in the laboratory condition. As the long range or distance testing requirements are desperately needed, weak signal with low SNR processing is full of challenges and difficulty for all the signals are mixed with defect characterizations and strong noise features; worse still, some of their frequency bands are usually overlapped, which all make the common signal filtering methods invalid and unavailable in wire rope signal processing and defect recognition.
To solve the above-mentioned challenges, a combined weak signal processing method based on improved Hilbert transform, signal differentiating, and filtering techniques are proposed. Starting with the experimental introduction and implementation, different wire rope signals with weak defect characterizations are analyzed and compared. Finally, the validity and feasibility, as well as the influence of the proposed methods, are demonstrated and studied in the perspective of time domain and short-time Fourier transform (STFT), which suggests that the proposed methods are full of potential in practical application for wire rope signal processing and defect inspection, especially in complex scenes.

2. Experiments

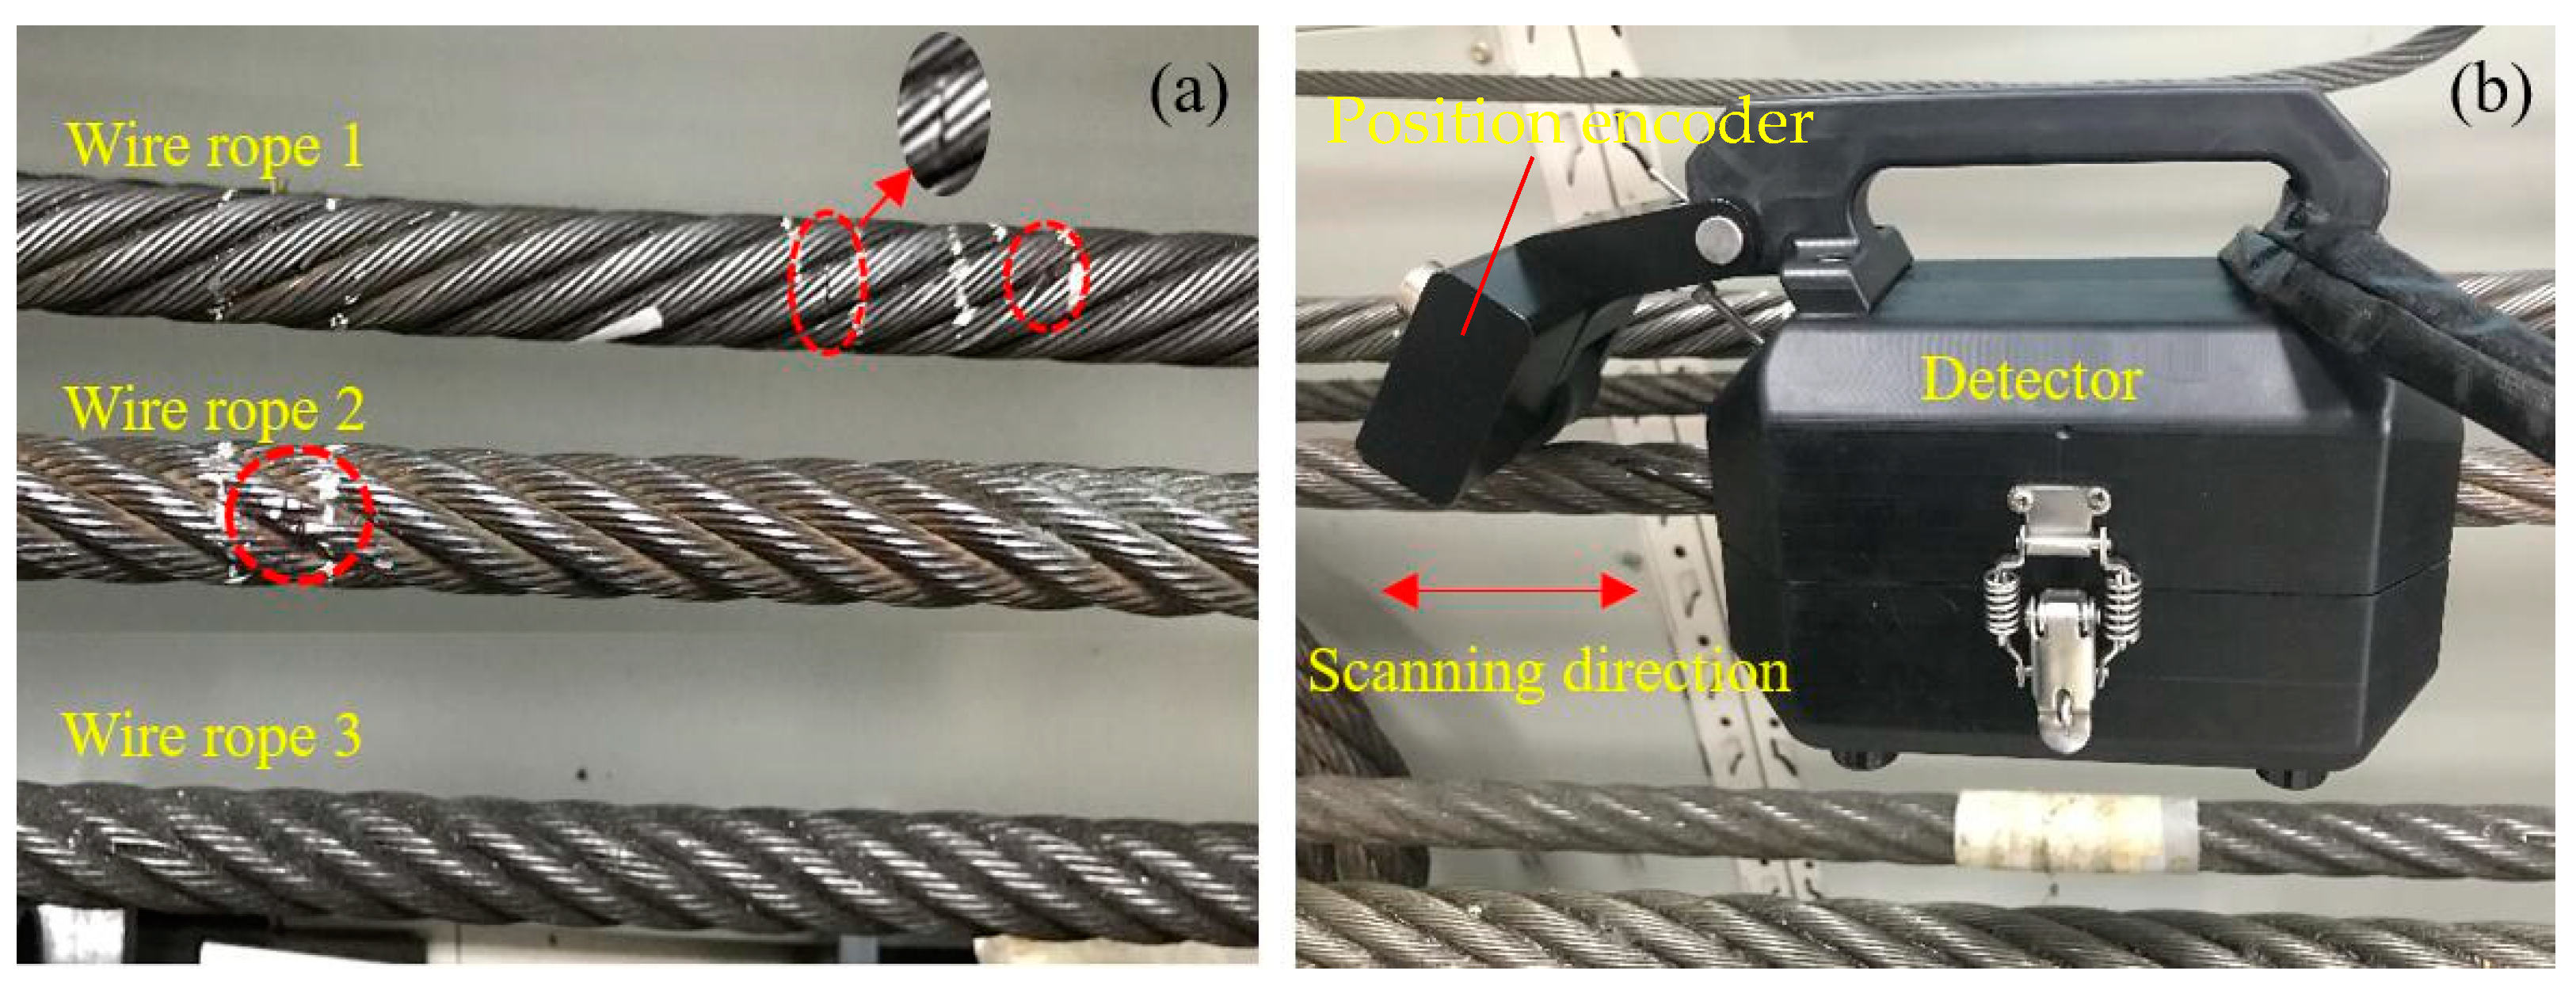
2.1. Experimental Apparatus and Samples

Owing to the difference of wire rope structures and diameters as well as the sophisticated detection environments, steel wire rope inspection signals are often mixed with various interference features and sources. To obtain the weak signals detected from different sensors, liftoff distances, and broken wire sizes, three steel wire rope samples were mainly applied and tested through an MFL testing apparatus, as illustrated in Figure 1. Primarily, there are two types of surface defects in wire rope 1, where a one-wire broken and a three-wire broken defect were made. Similarly, a mixed surface defect with broken and wear characterizations was inspected on the wire rope 2, and an inner defect artificially made in wire rope 3 was also tested, which are indicated in Figure 1a, and the diameters of these steel wire rope samples are 28 mm, 32 mm, and 45 mm, respectively. Further, the MFL based detector is shown in Figure 1b, where the liftoff distance and position of the sensor element could be adjusted according to the feed-through wearing ring, and a position encoder in the detector head can guarantee the exact location of the defect. If any defects were scanned and encountered by the circumferentially installed magnetic sensitive sensors inside the detector, the leaked magnetic flux would be captured by the sensor and transformed to voltage signals. After data acquisition and signal pre-amplification by the circuit modules, different experimental signals are displayed on the computer and further processed in the next step.

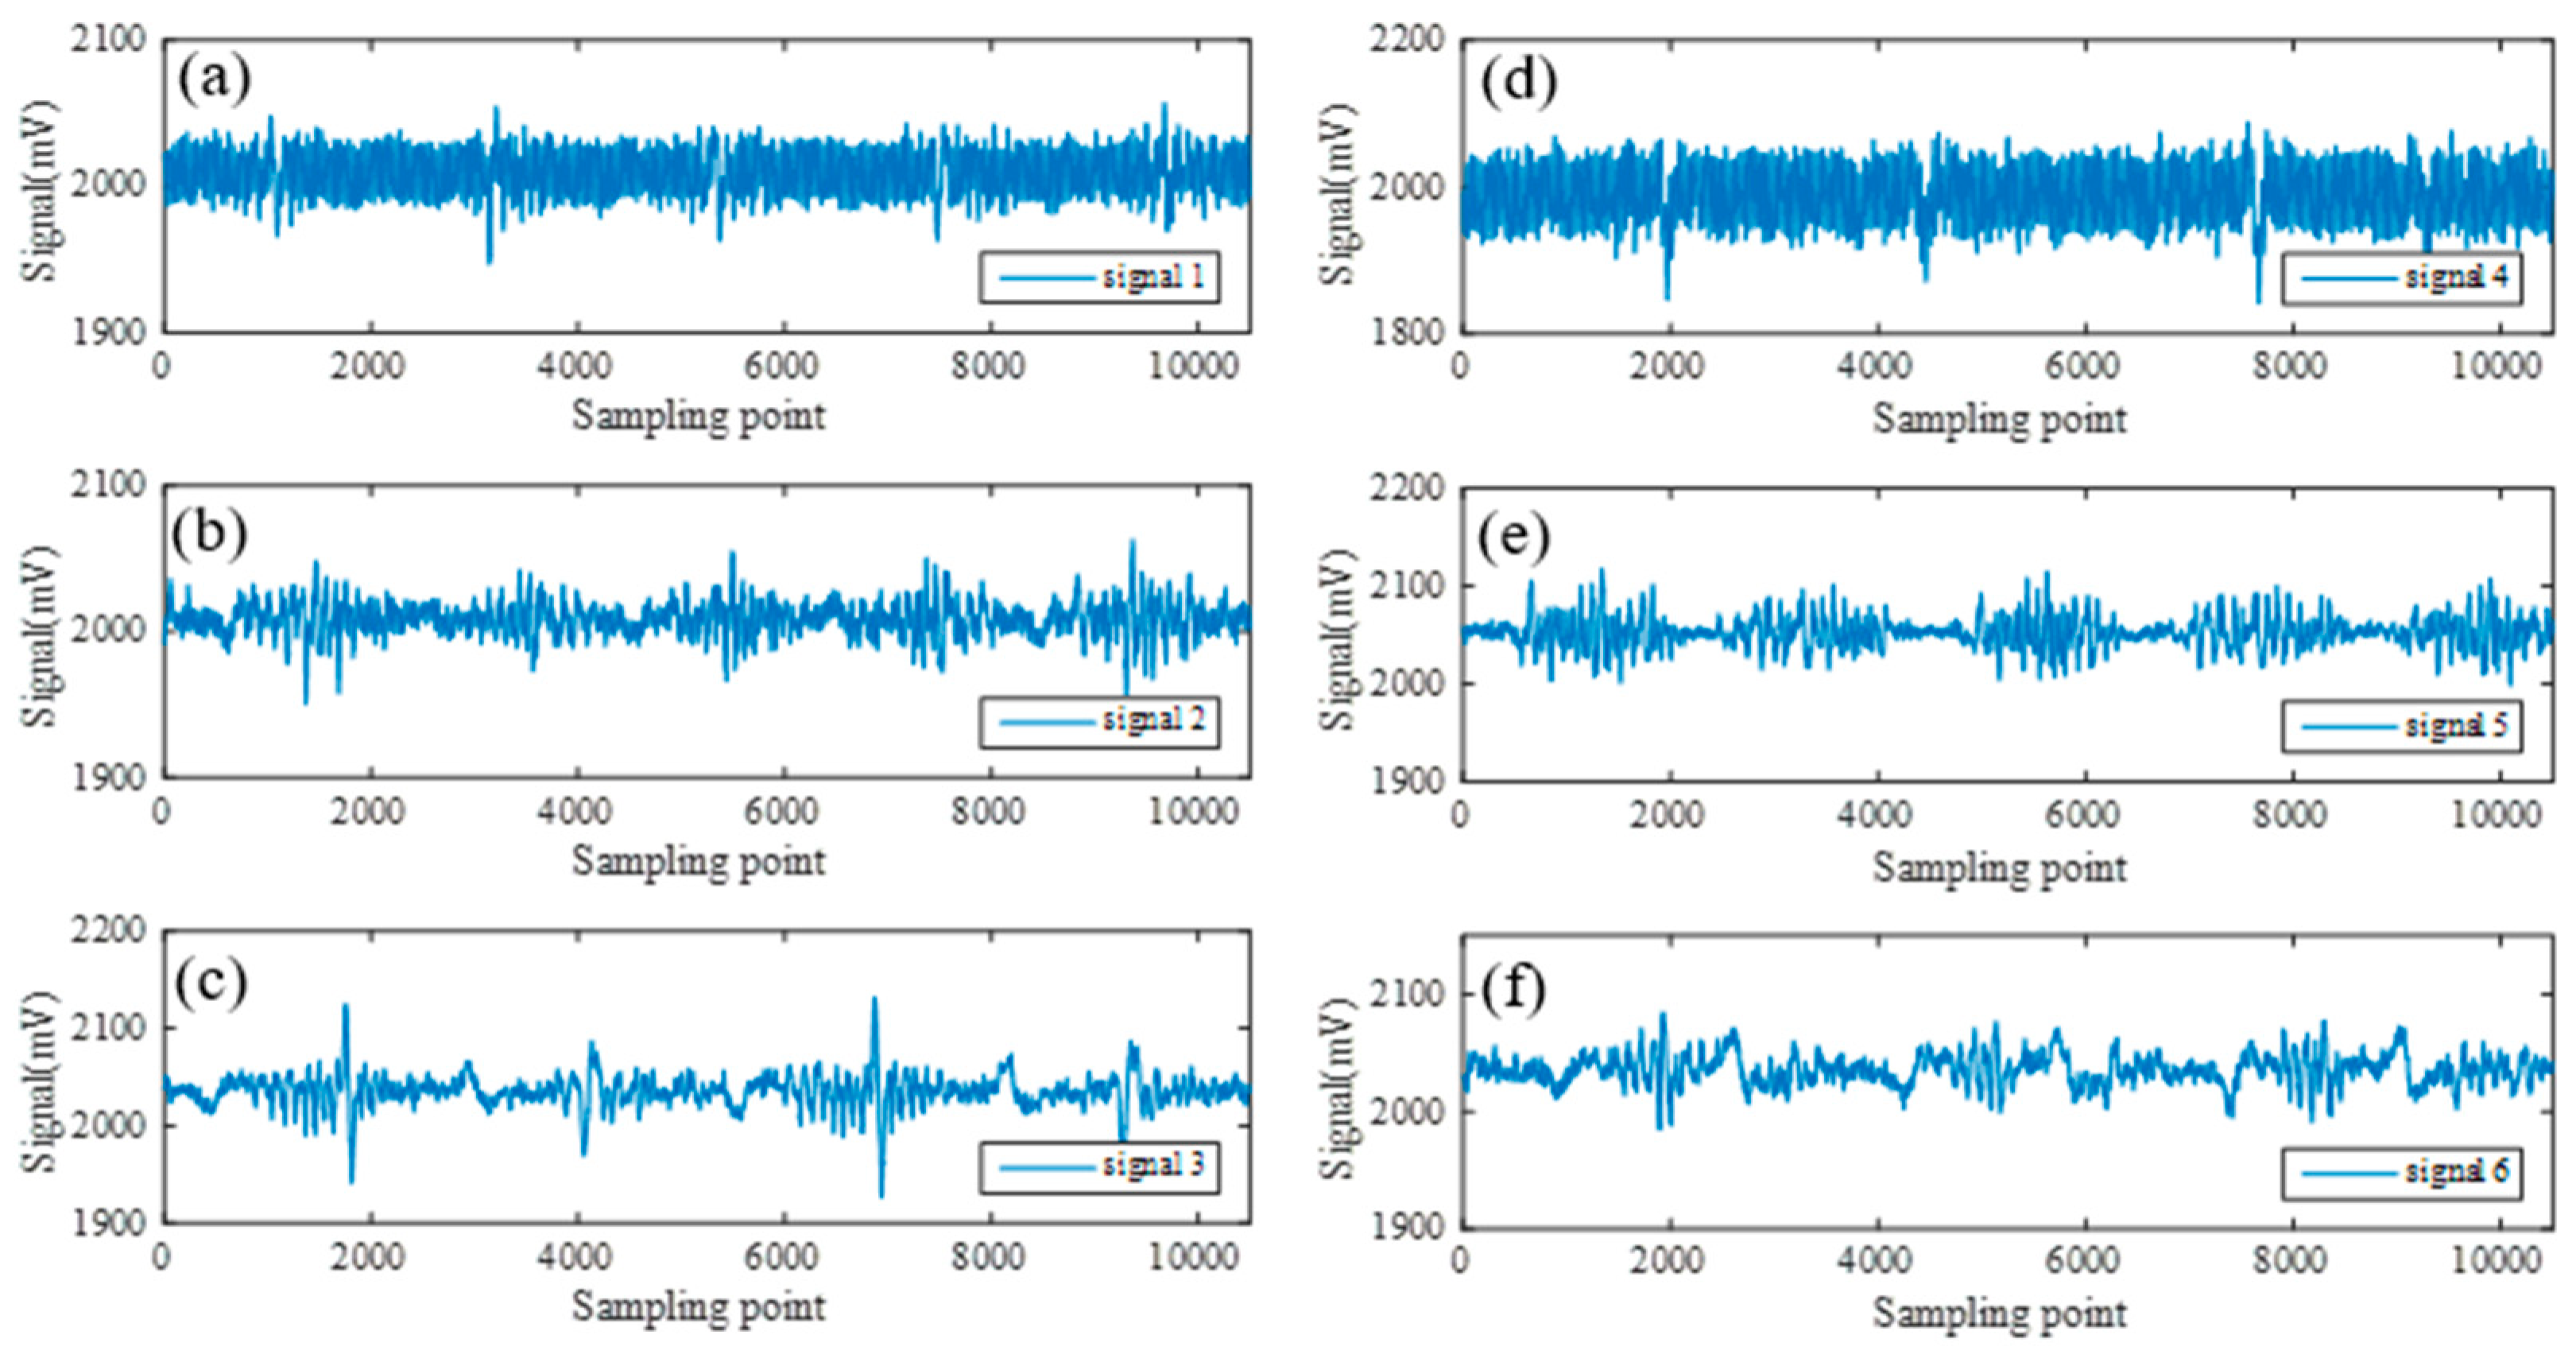
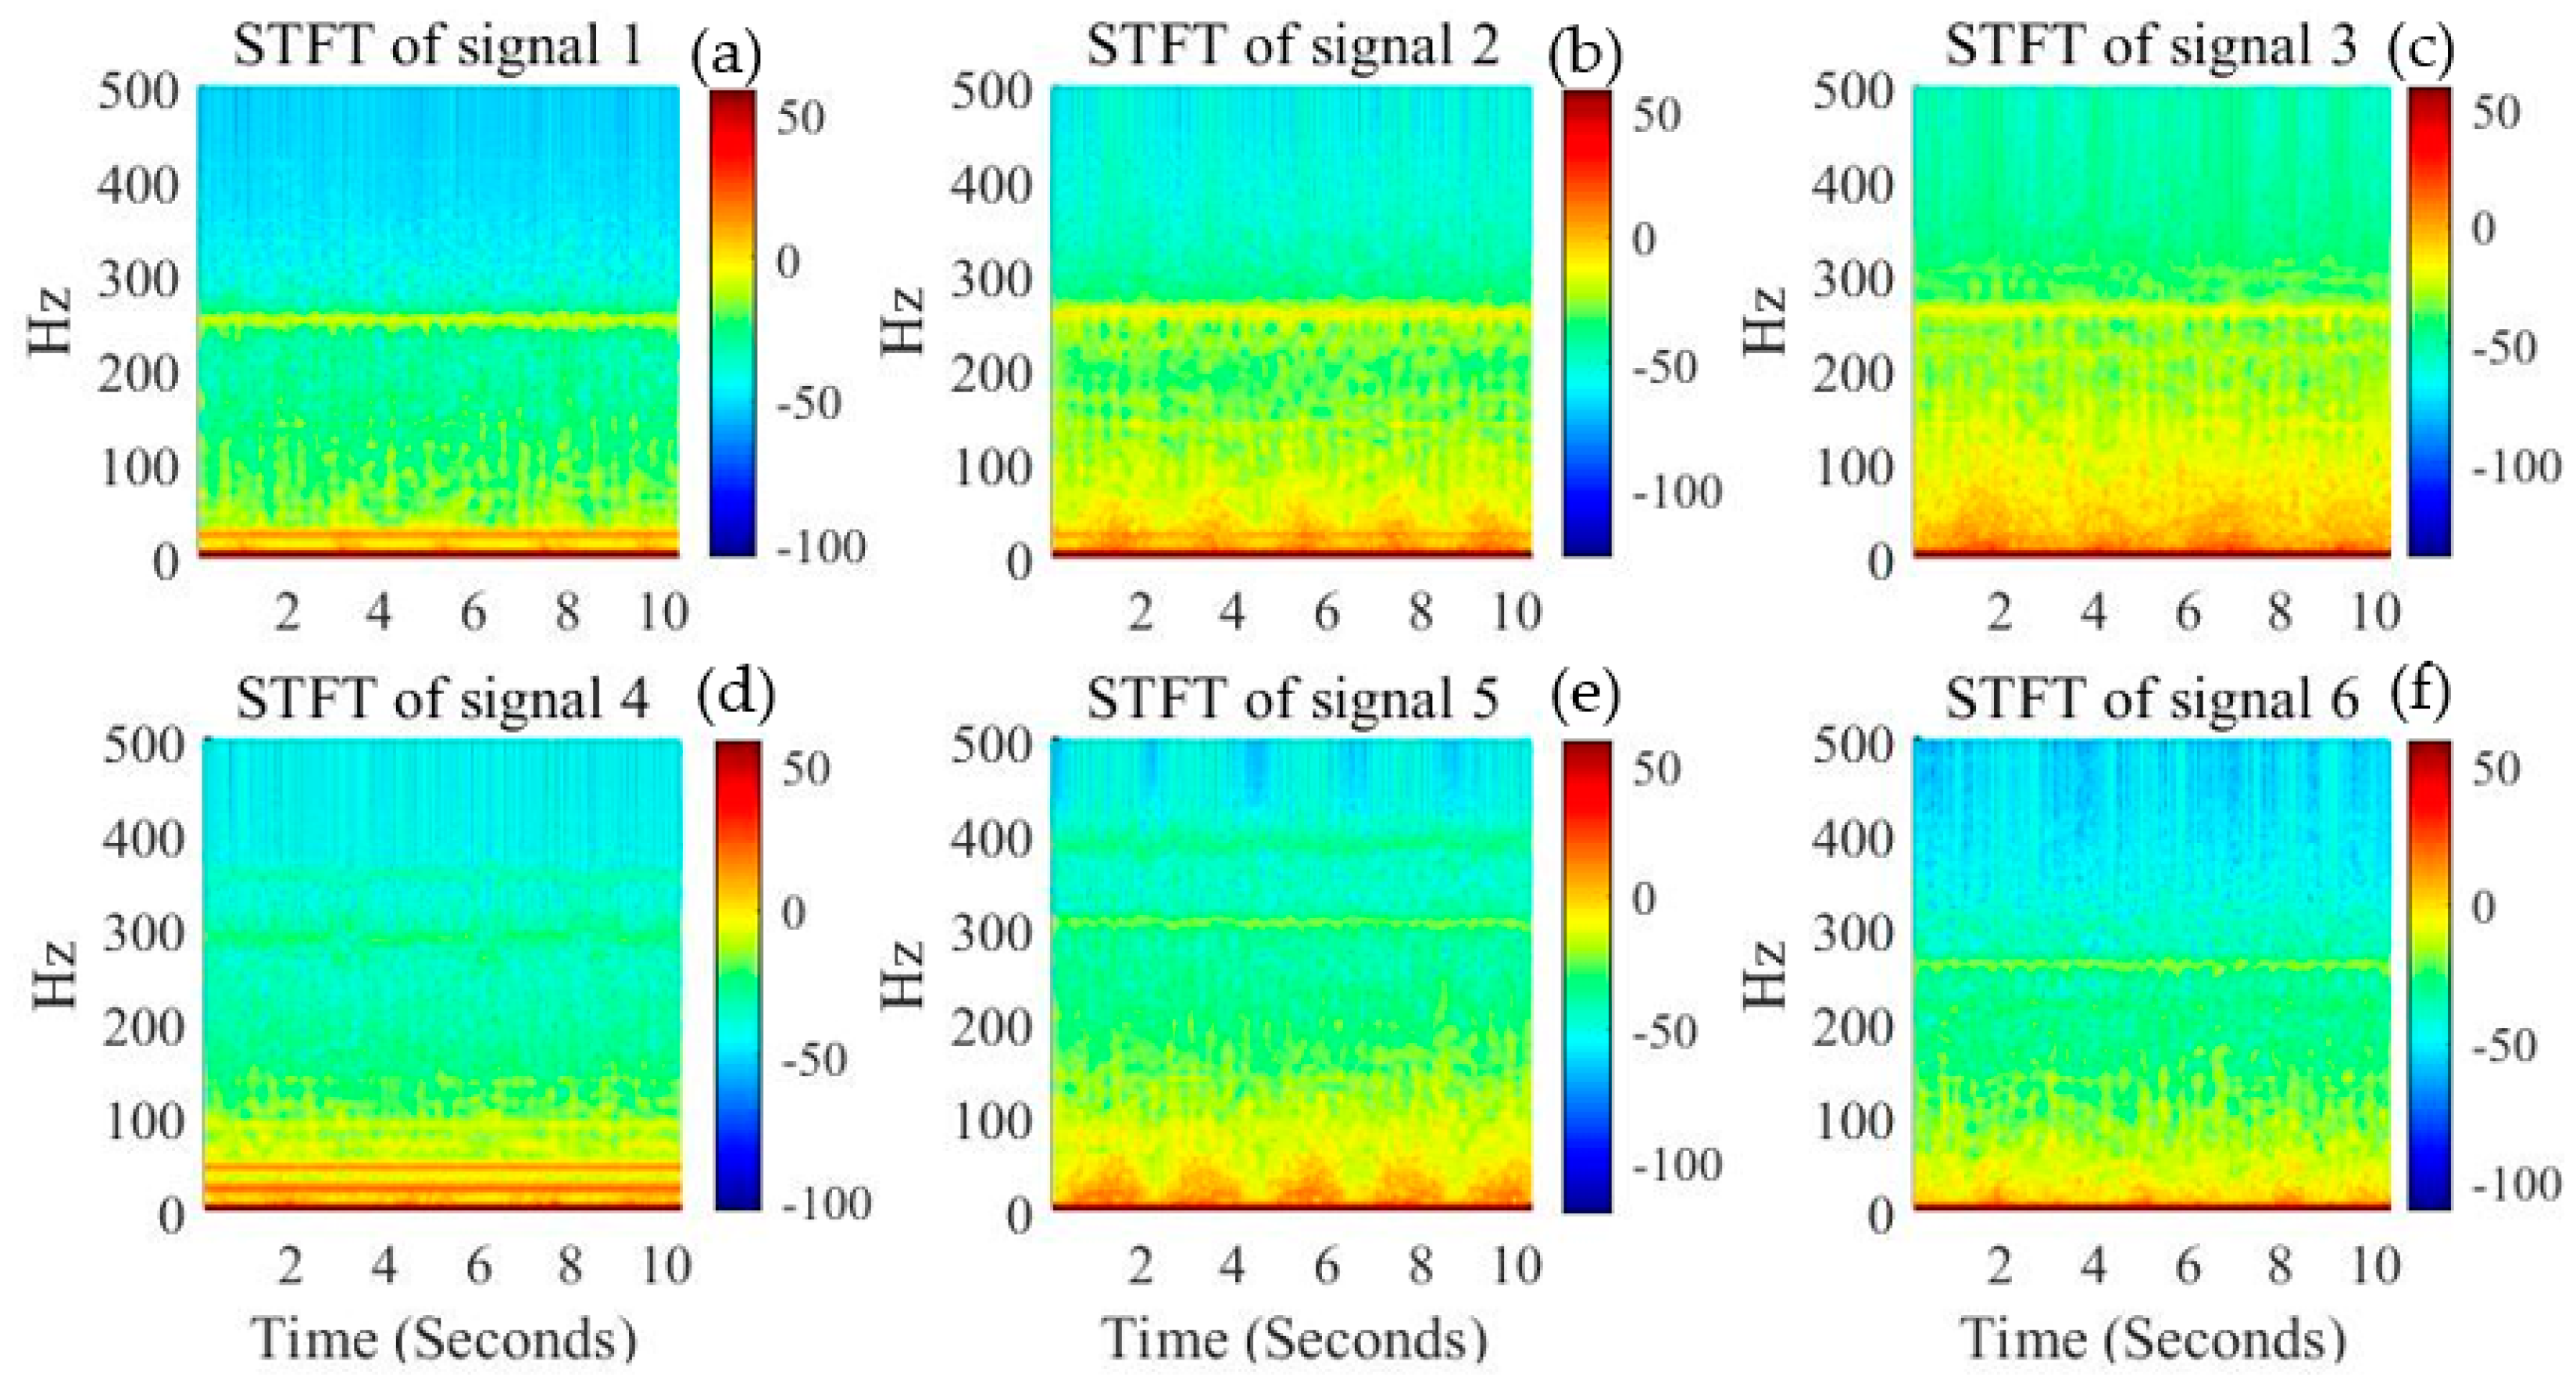
2.2. Time and Frequency Analysis

According to the aforementioned experiments conducted, six main original weak signals were acquired and are presented in Figure 2. Explanatorily, signal 1 and signal 2 from Figure 2a,b were obtained from the testing sample of wire rope 1 indicated in Figure 1a with different wire broken numbers of 1 and 3 through inductive transducer, and the sensor liftoff distance was set as 13 mm. Signal 3 and signal 6 shown in Figure 2c,f were acquired through the magnetic sensitive element of copper coils with different liftoff distances of 13 mm and 20 mm for wire rope sample 2. While signal 4 and signal 5 expressed in Figure 2d,e represent the weak original signals obtained from the inner defect of wire rope 3 with the surface liftoff distances of 13 mm and 20 mm by the sensor of inductive transducer. From the perspective of geometric structures, a broken wire defect features sudden loss of the metal cross-section, which leads to the change of wire rope permeability and the magnetized field leak from the body of the tested wire rope, while almost no abnormal magnetic flux leaks from the wire rope except for the strand signal. Therefore, the defect signals are usually characterized with an obvious peak or valley, while the non-damaged wire rope is detected with strand and random noise signals, as marked in Figure 2a.
Apparently, under the inspection condition of big liftoff distance and other severe environment, wire rope inspection signals are featured with the weak and low signal-to noise-ratio (SNR). Concretely, the testing signals are shapely attenuated due to the liftoff effect and micro defect, and the defect signals are almost overwhelmed by the wire rope strand and other noise signals, which makes the inspection for wire rope difficult and full of challenges. Furthermore, comparing signal 1 and 3, it can be deduced that the coil sensor has a wider detection range than an inductive transducer for defect signals, and a higher signal amplitude under the same liftoff distance, while the inductive transducer is more sensitive to the magnetic leakage of defect than a coil sensor when considering the defect features of signal 1 and 4. Consequently, judging from the time domain signals, the testing results are susceptible to various factors such as the sensor types and precision, liftoff distance, which also manifests that a suitable weak signal processing technique is of great significance to high precision defect inspection.
Furthermore, the corresponding time and frequency analysis by short-time Fourier transform (STFT) is preliminarily conducted. By moving the hamming window through the non-stationary wire rope testing signals, the instantaneous frequency information could be obtained, and the STFT is described as follows,
X ( ω , τ ) = + x ( t ) g ( t τ ) e j ω t d t
where, t is the time, j is the imaginary unit, τ is the moving center time of the window function, ω is the angular frequency, x(t) is the system input of wire rope testing signals, g(t) represents the hamming window function, and X(ω, τ) are the STFT results in Equation (1). Specifically, the corresponding STFT spectrum of signal 1 to signal 6 shown in Figure 2 are presented in Figure 3, which indicates that these weak signals of wire rope are nearly under the frequency of 250 Hz, and most of the signal components are mixed distributed under the frequency of 50 Hz, while it is difficult to differentiate the specific frequency component of defect signal and the interference components, especially for the signals shown in Figure 3a–c,e,f. Comparing these STFT spectrum and the typical time domain signals, it can be found that the common signal filtering technique are incapable of processing these mixed and weak signals.

3. Principles and Methods

3.1. Principle of HHT

The steel wire rope inspection system could be viewed as a linear time invariant system, and the Hilbert transform of the input signals containing multi-source noise could be described as a convolution operation with the impulse response, namely,
x ^ ( t ) = H [ x ( t ) ] = x ( t ) h ( t ) = 1 π x ( τ ) t τ d τ
where, t is the time, τ is the time shift, x(t) and h(t) represent the input signals of wire rope inspection and the system impulse response, and the * means the convolution operation in Equation (2). In other words, the Hilbert transform could also be regarded as a quadrature filter, which processes the signals mainly in the perspective of phase domain and makes up for the deficiency of time and frequency domain in consideration of the mixed features of multi-source noises and the indistinguishable frequency distribution. The Fourier transform of the system impulse response is defined as,
H ( ω ) = { j ( ω 0 ) + j ( ω < 0 )
where j is the imaginary unit, and ω is the angular frequency in Equation (3). Apparently, according to the Hilbert transform, the phase of the steel wire rope testing signal will move −π/2 and π/2 for these positive and negative frequency signal components in phase domain, separately, while the signal amplitude remains unchanged. Combining the spiral structures of wire rope and the strand signals, the approximate periodic interference of strand signals could be eliminated after further being processed by the differentiating techniques, namely, the output signals could be expressed as,
x o = | x ^ ( t ) | x ( t )
where t is the time in Equation (4). Due to the complexity of the weak signals of steel wire rope in big liftoff distance defect detection, nonlinear and linear signal processing methods such as the median filtering and moving average filtering as well as the wavelet denoising methods are also applied and compared. Although the linear method is effective for additive Gaussian noise and features fast calculating speed, the nonlinear filtering method could overcome its shortcomings of blurring the signal edge.

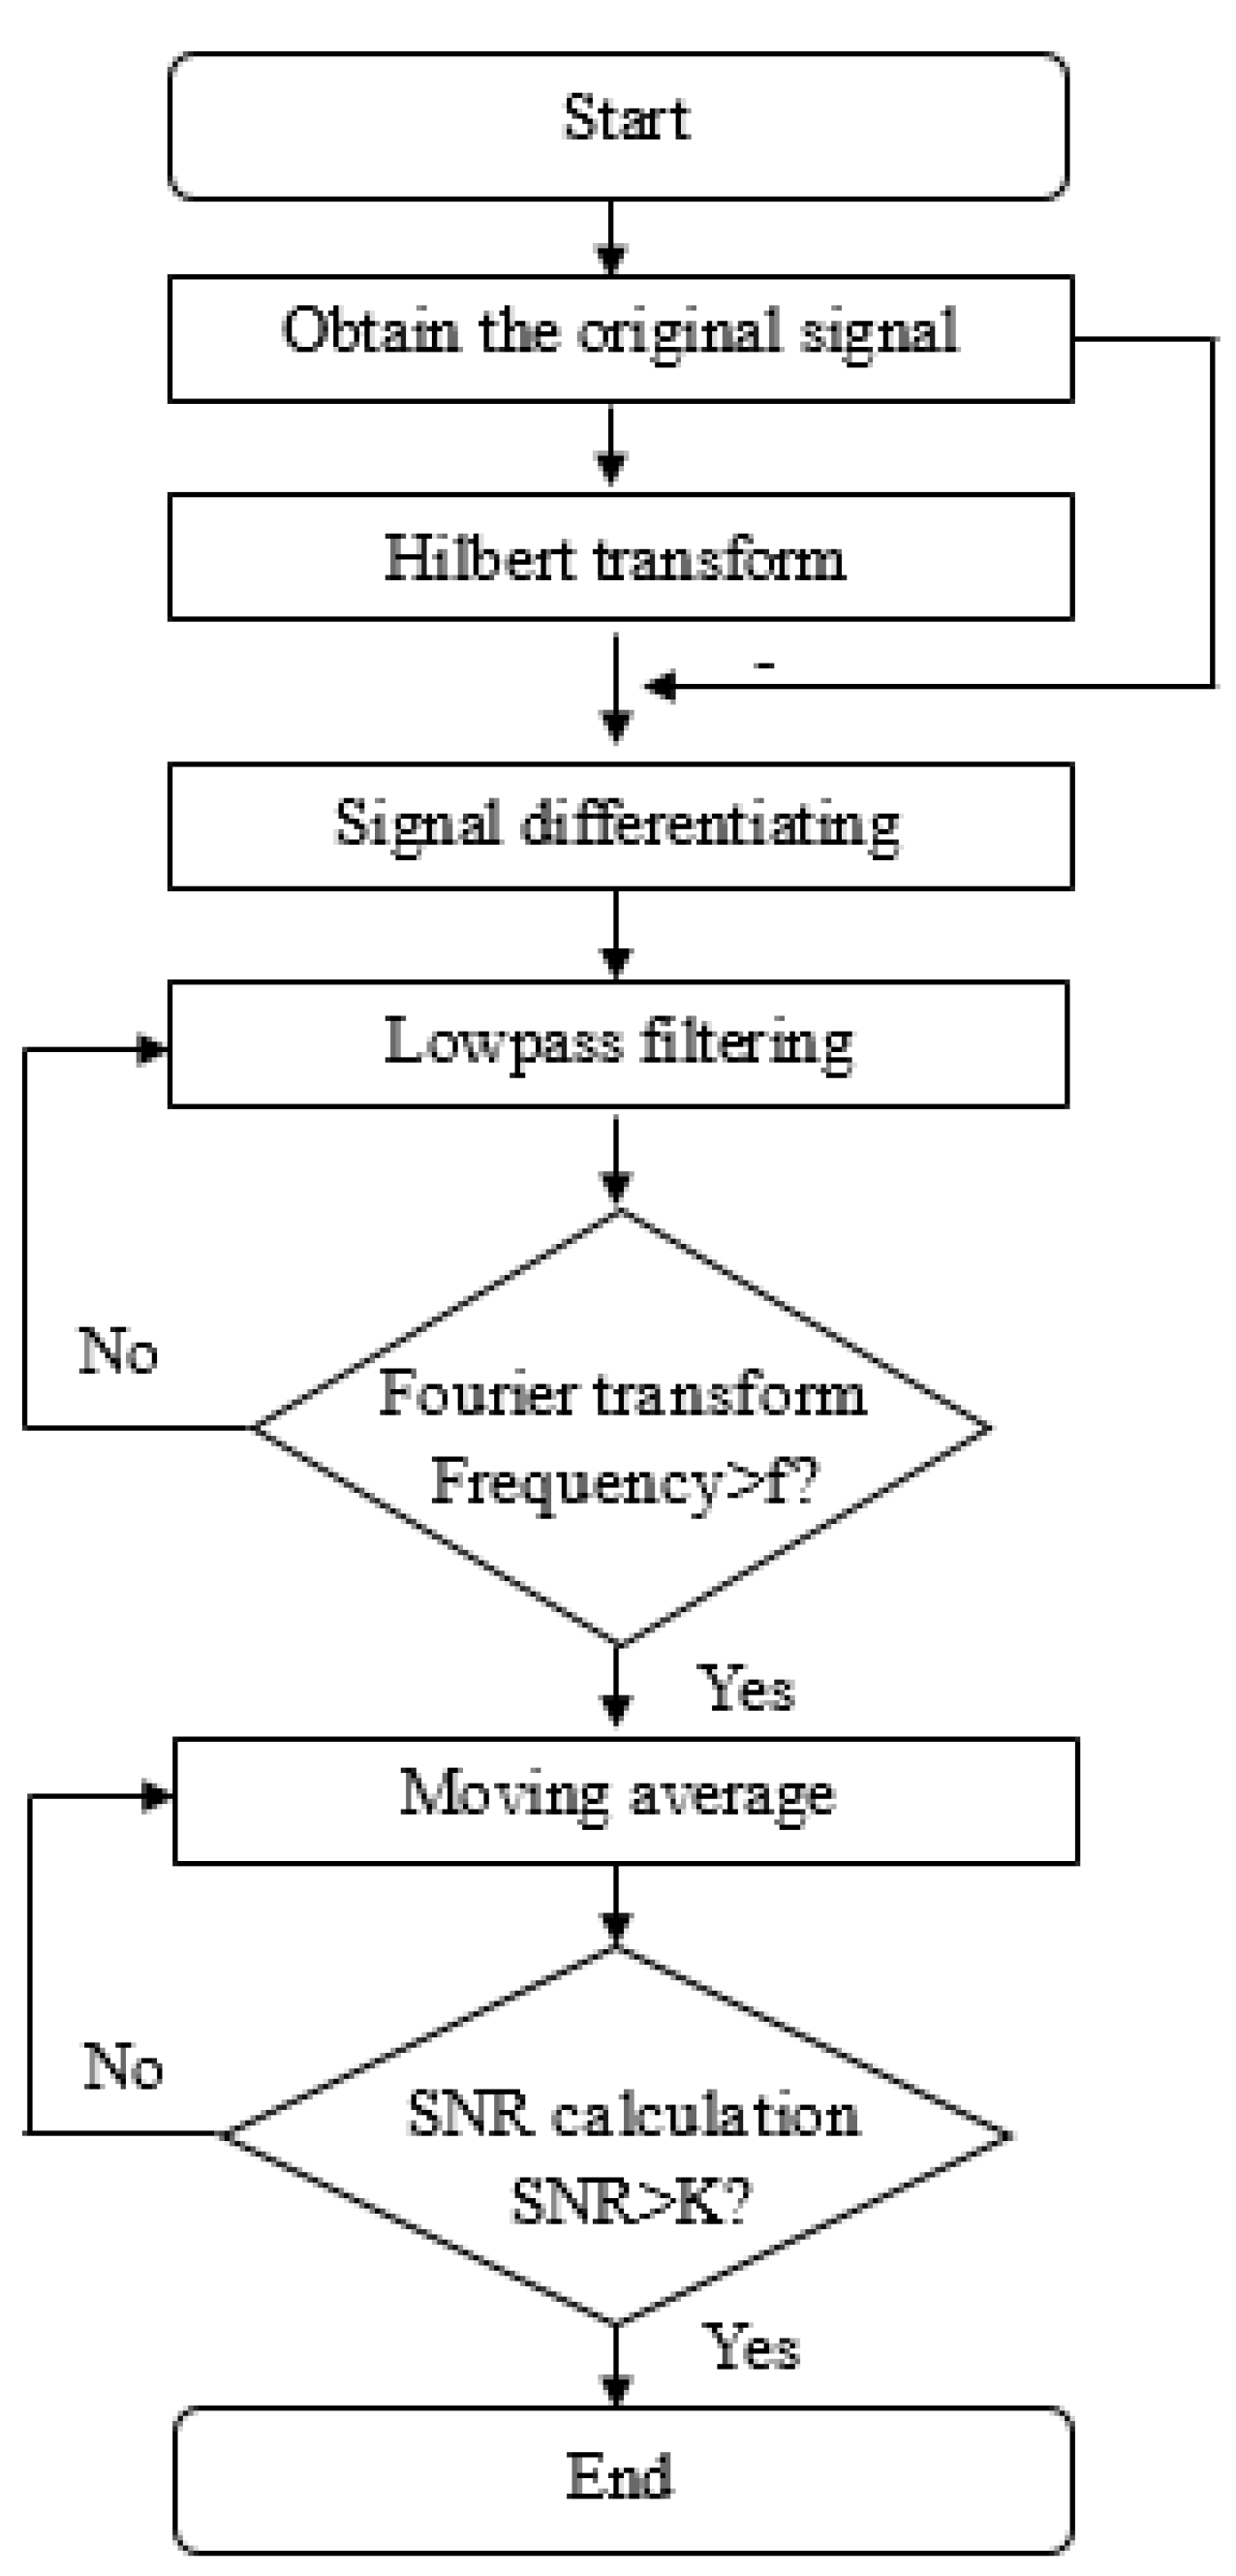
3.2. The Proposed Method

The flow diagram of the proposed method is schematically shown in Figure 4, staring with the data acquisition and pre-amplification for the wire rope testing signals, and the standard Hilbert transform algorithm is applied to obtain a phase changed signal. Then, the signals combining with the original signal are calculated by the differentiating technique. On account of the mixed frequency features of the processed signal, further signal denoising method based on the Fourier transform and lowpass filtering method is applied, aiming at the low frequency and weak defect signal. The lowpass cutoff frequency is mainly determined by the Fast Fourier Transform (FFT) analysis results. Additionally, to obtain a higher SNR of the detection signals, the moving average technique is applied. Generally, many factors would affect the improving of the weak detection signals, such as the averaging method, the moving span, as well as the lowpass cut off frequency. Obviously, different from the traditional single signal denoising method, the proposed weak signal processing methods for steel wire rope is a combination technique which integrates the phase transformation techniques of Hilbert transform and signal filtering methods. Consequently, the weak signals and defect are well distinguished.

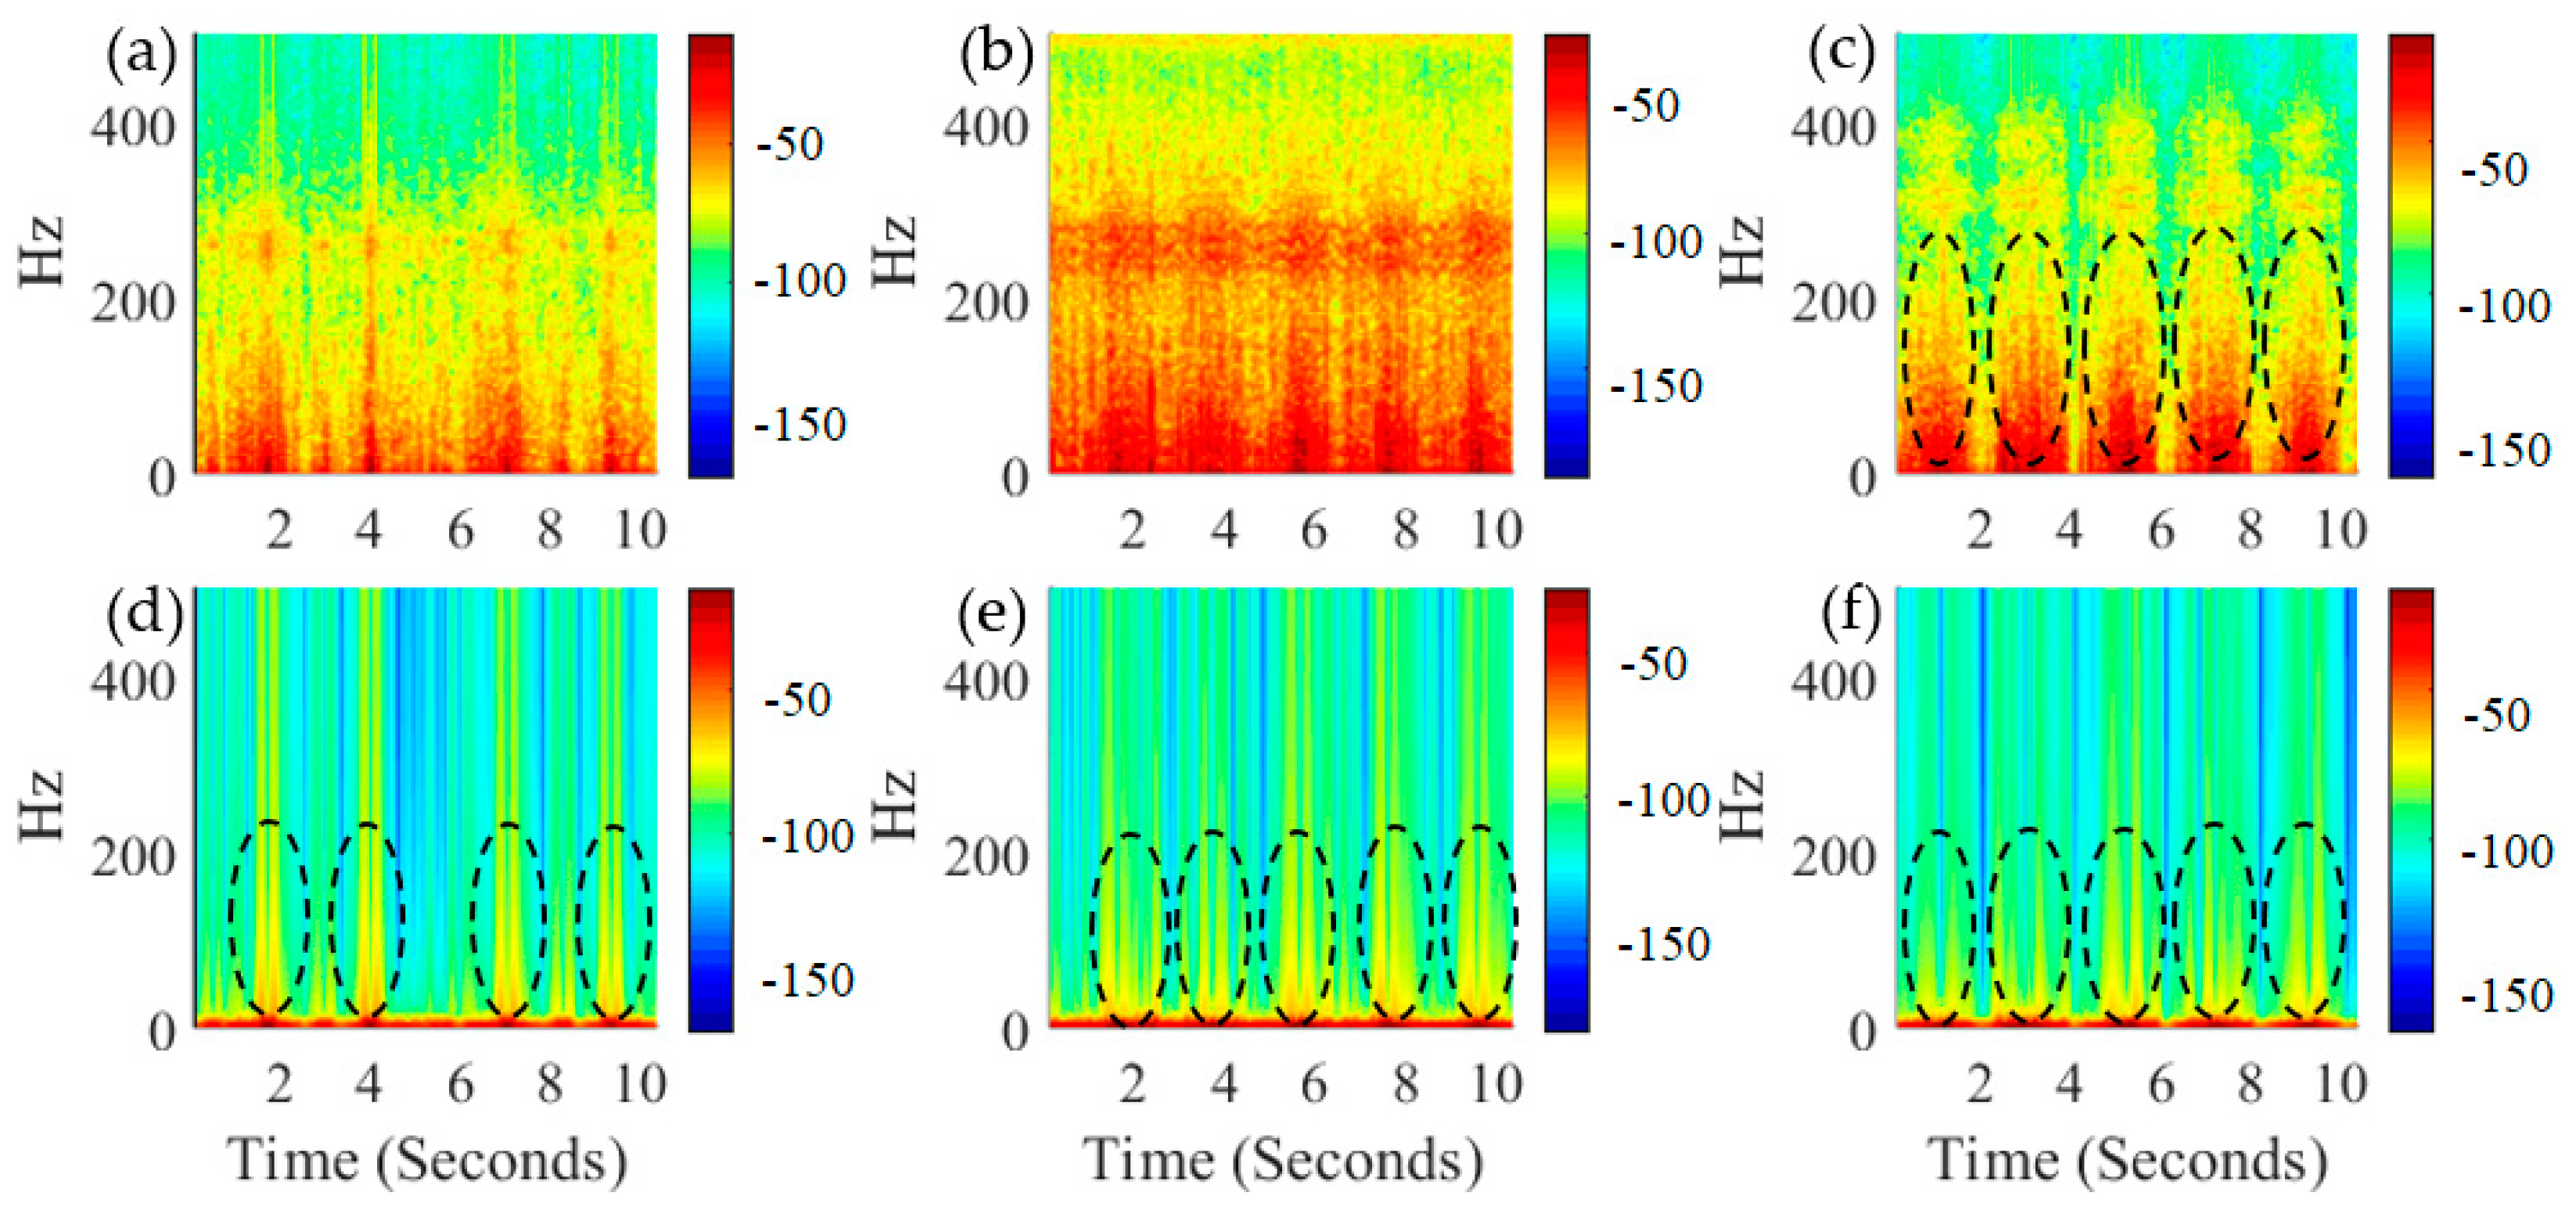
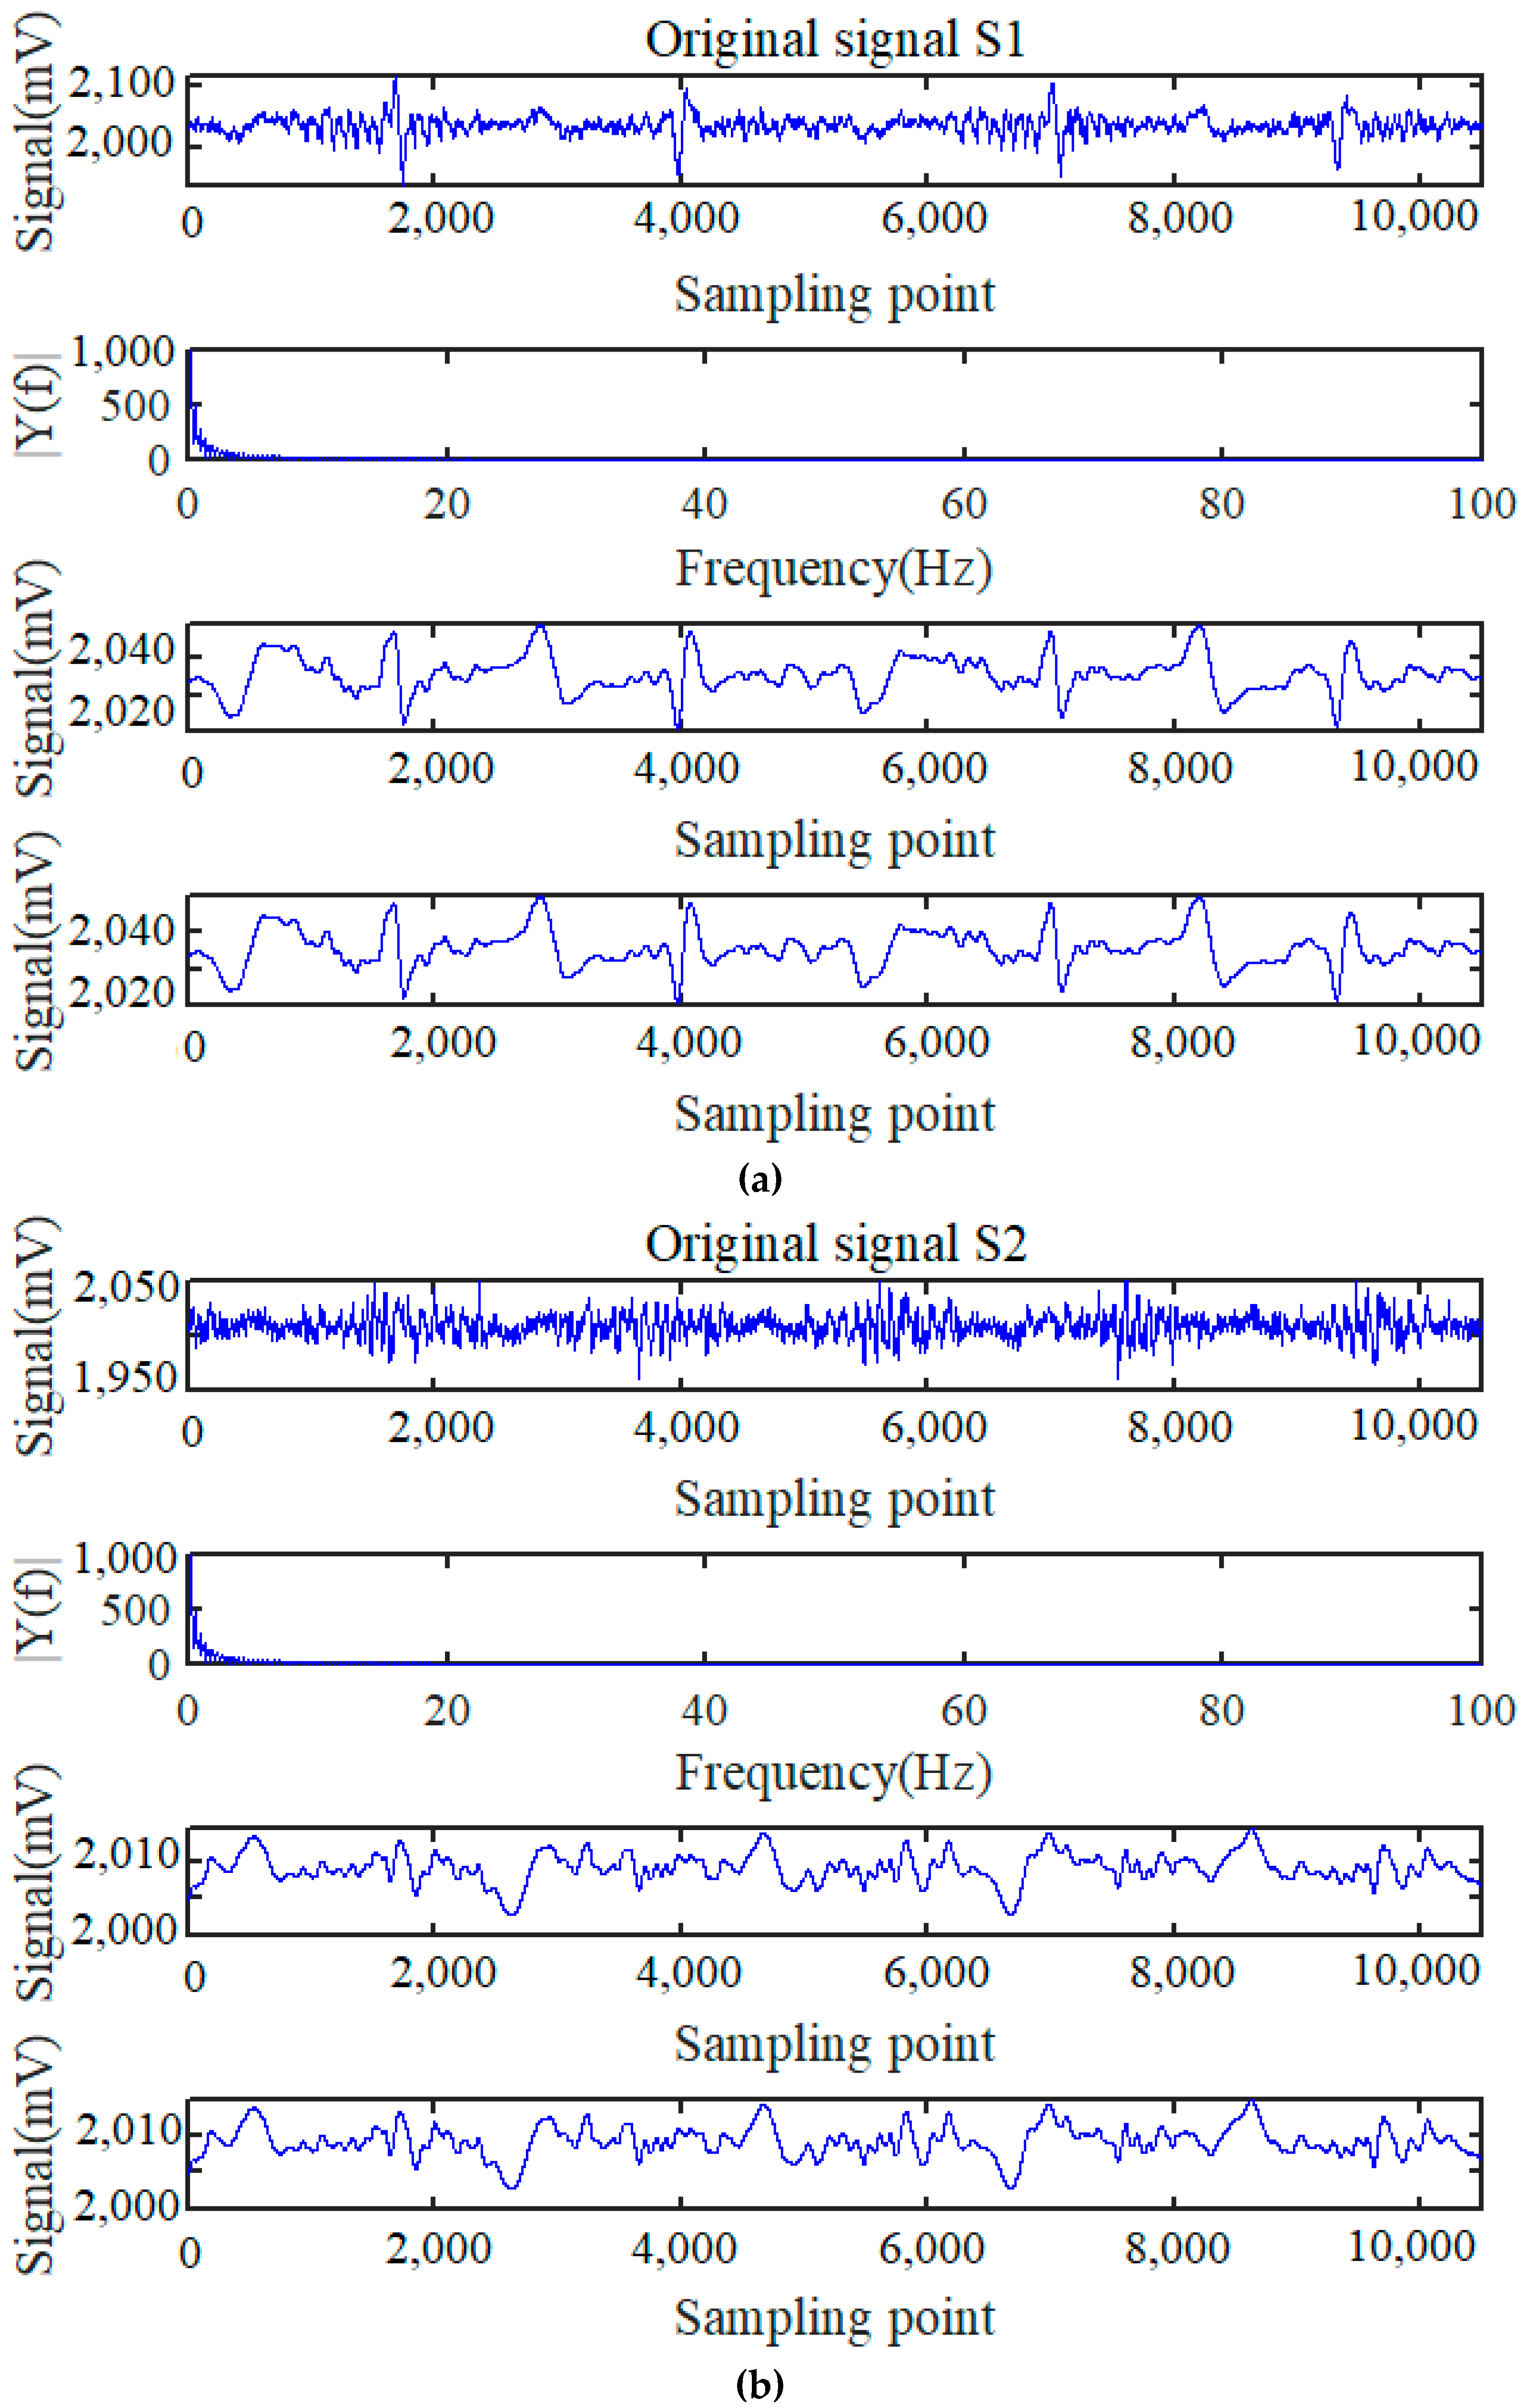
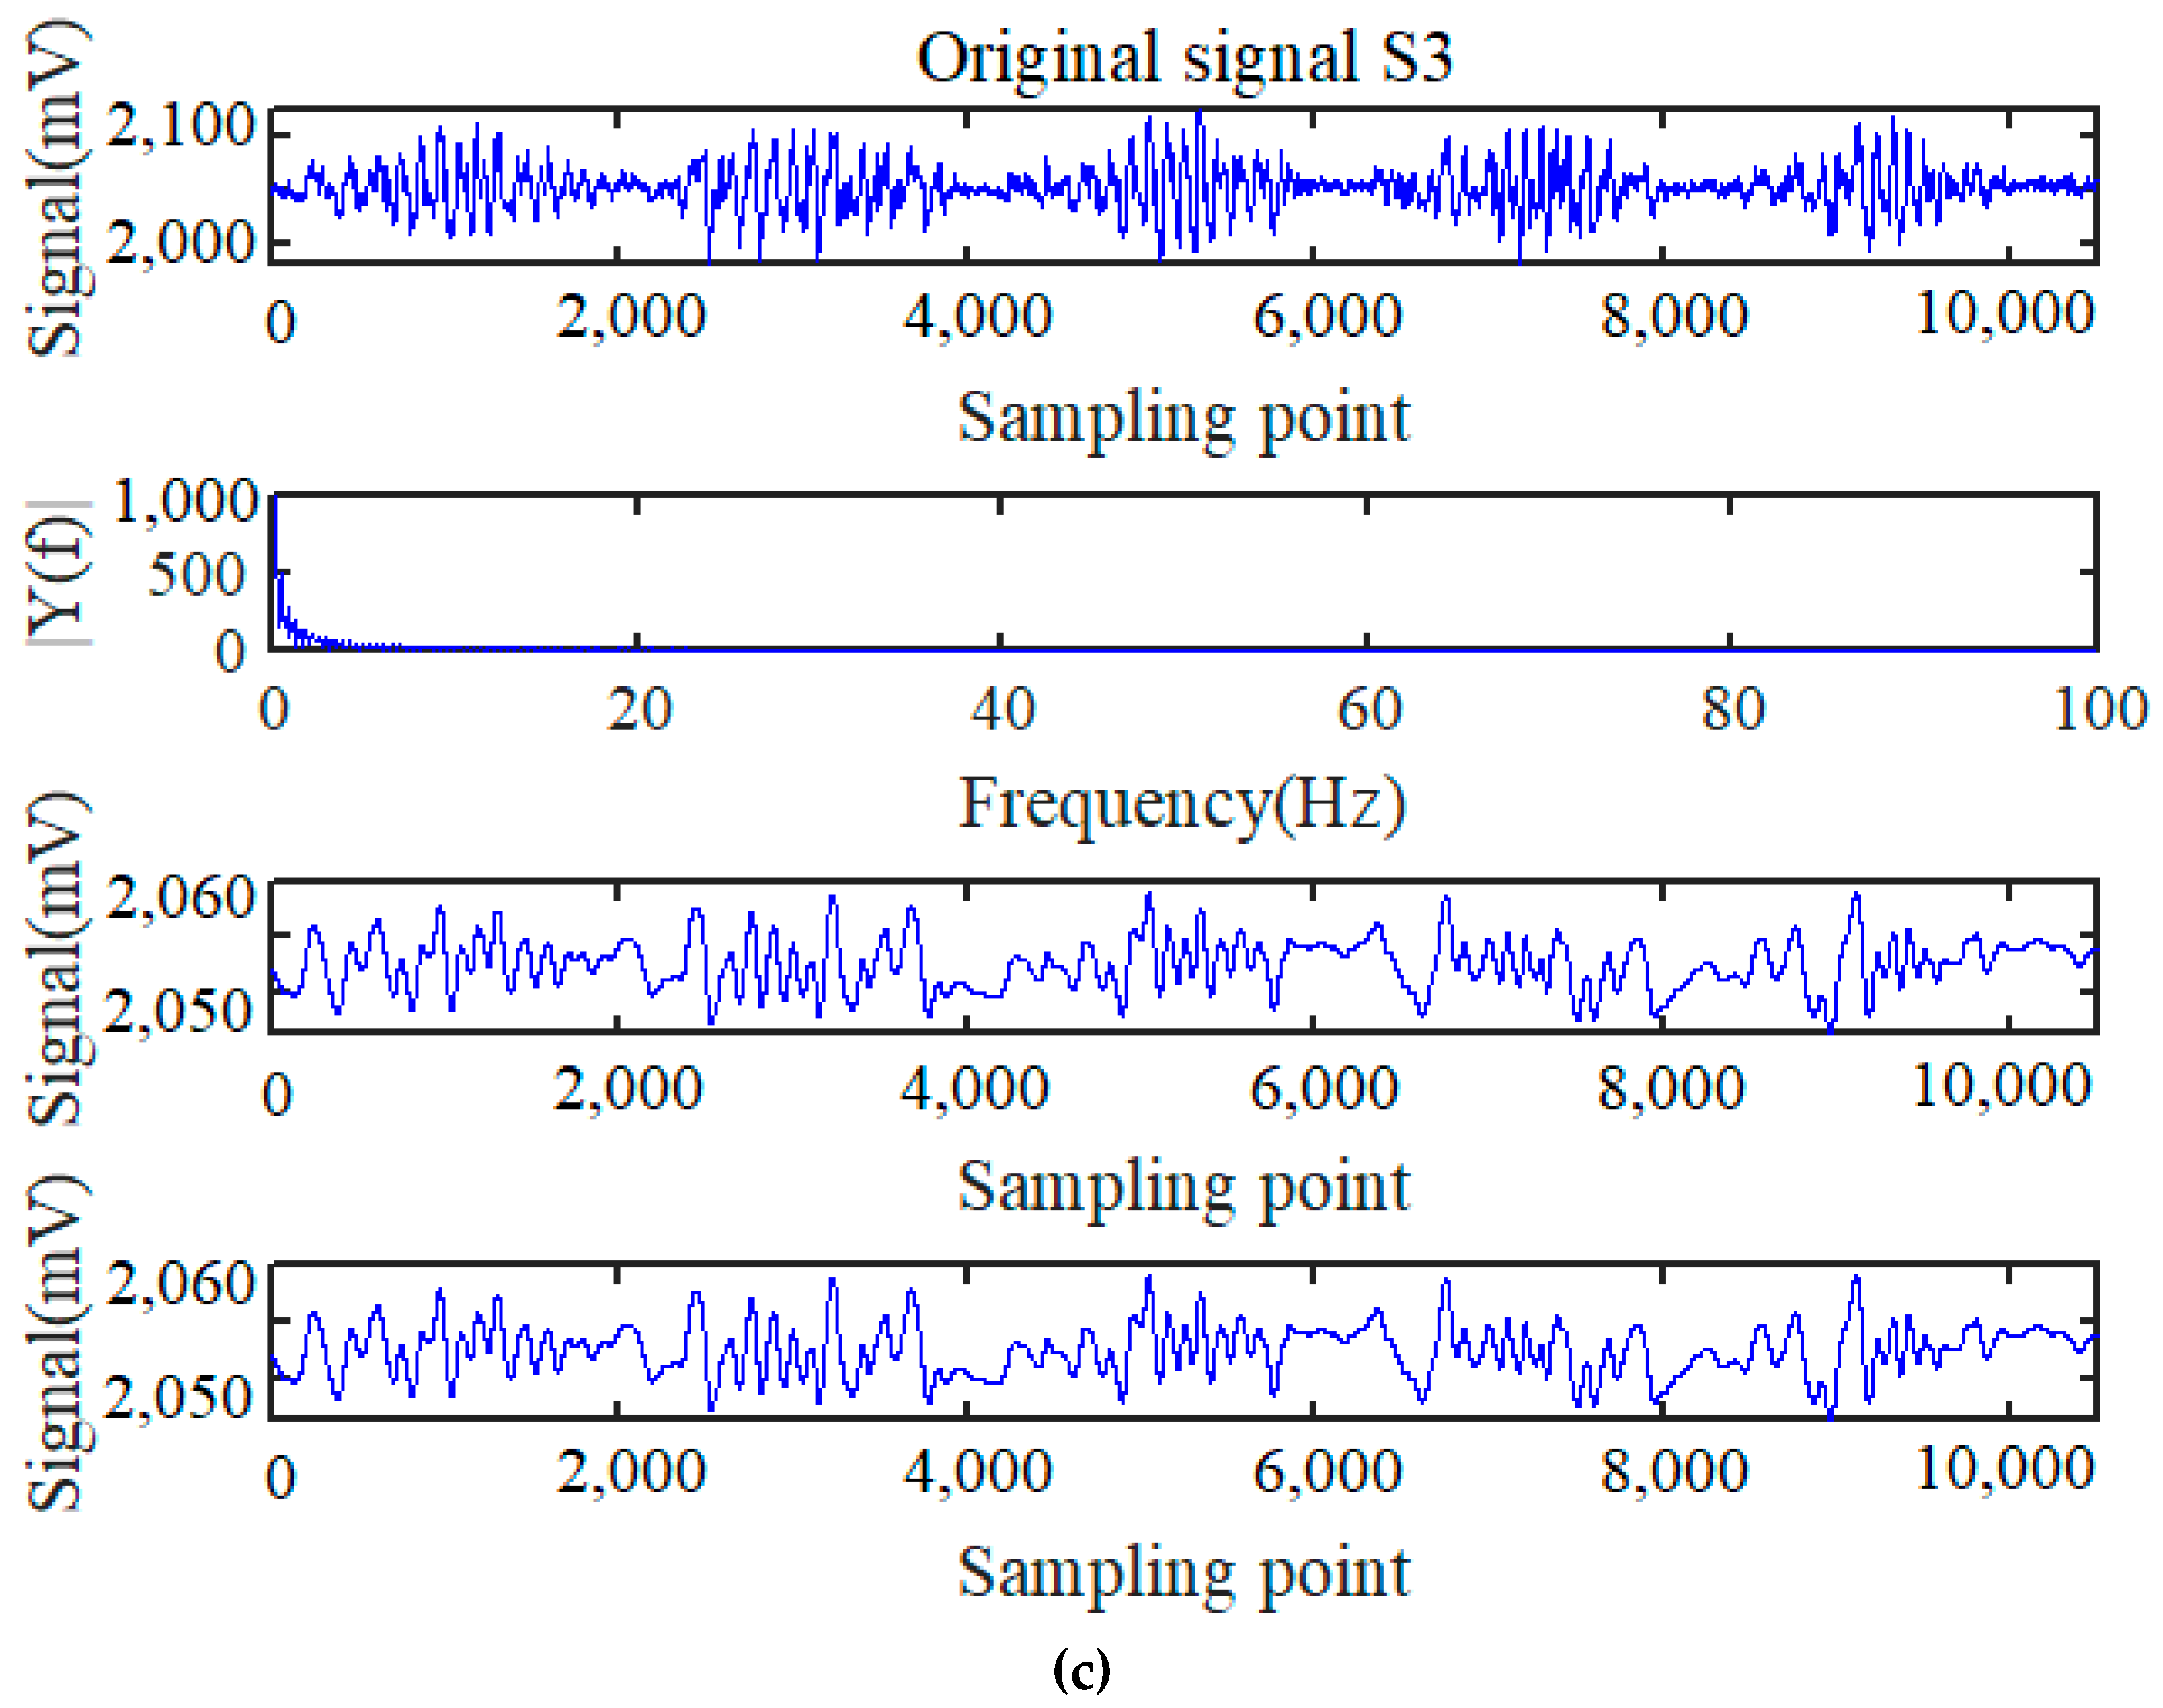
4. Comparison and Results

4.1. Lowpass Filtering and Wavelet Denoising

First, according to the results of the time and frequency analysis aforementioned, most of the defect signals are distributed within the low frequency band. Thus, the lowpass filtering techniques based on Butterworth is presented, and three typical wire rope defect signals with weak characterizations and low SNR are processed and compared. The transfer function of the Butterworth lowpass filter could be expressed as,
| H ( j ω ) | = 1 1 + ω 2 n
where j is the imaginary unit, n is the order of the lowpass filter, ω is the normalized cut off frequency in Equation (5). Besides, to further denoise the original wire rope detection signals, wavelet decomposition and reconstruction techniques were also applied in the signal denoising after the lowpass filtering. The continuous wavelet transform is defined as,
W f ( a , b ) = x ( t ) Ψ ( t a b ) d t
where x(t) is the time series signal, a and b represent the scale parameter and time center parameter in Equation (6), and the mother wavelet function is,
Ψ ( a , τ ) = 1 | a | ψ ( t a τ )
where ψ is a wavelet function and τ is the shifting parameter of the window function in Equation (7). As illustrated in Figure 5, three kinds of typical weak signals were randomly chosen from the experiments. Explanatorily, the S1 signal shown in Figure 5a means that the original signals were obtained from steel wire rope sample 1 with three-wire broken defect under the detection condition of the big liftoff distance of 20 mm by the coil sensor. Similarly, the signals of S2 and S3 expressed in Figure 5b,c represent that the signals were acquired from the one-wire broken defect of wire rope sensed by the inductive transducer under the liftoff distance of 20 mm and 13 mm, respectively. Specifically, S1 to S3 are the expanded part for signals 2, 3, and 5 as mentioned before. The original signals in the first line box of Figure 5a suggest that the weak wire rope inspection signals are mixed with strand signal features, while the FFT spectrum in the second line box implies that the original testing signals are distributed within the low frequency region smaller than 10 Hz, which also validates the time and frequency analysis results mentioned in Figure 3. Consequently, when the lowpass cutoff frequency was set as 5 Hz, the processed signals were shown in the third line box. Obviously, some interference signals were highlighted and became more prominent, while the defect signals were also filtered and abridged. After the further wavelet denoising by the wavelet of db6 (Daubechies 6 function) under the decomposition level of 16, the final processed signals were presented in the last line box. Obviously, the interferences of the noise signals are still prominent and difficult to distinguish from the real defect signals; in other words, the lowpass filtering and wavelet combined denoising methods are incapable of processing the weak wire rope signals to some extent.
Additionally, another two groups of wire rope weak signal processing results presented in Figure 5b,c indicate that both the original defect signals are difficult to identify due to the big liftoff distance and the interference of the strand as well as various noise signals in the environment. However, the weak magnetic flux leakage signals could still be caught by the inductive transducer. We observed by the frequency spectrum expressed in the second line box that the lowpass filtering and wavelet denoising parameters keep consistent with that described for these signals shown in Figure 5a. Namely, the lowpass cutoff frequency was 5 Hz, and db6 wavelet with 16 decomposition level was also chosen. Although the original signals shown in Figure 5c have a stronger amplitude than the signals expressed in Figure 5b on account of the smaller liftoff distance, both the lowpass filtering signals are mixed with strand and noise signal features, especially for the processed signal S3 illustrated in the third line box of Figure 5c. After further denoising by wavelet transform, both the processed signals shown in the third and fourth line box keep nearly unchanged in amplitude and frequency. Comparing the three typical signal processing results by lowpass filtering and wavelet denoising, it could be concluded that the simple lowpass filtering and wavelet transform combined methods are incapable of wire rope weak signal processing.

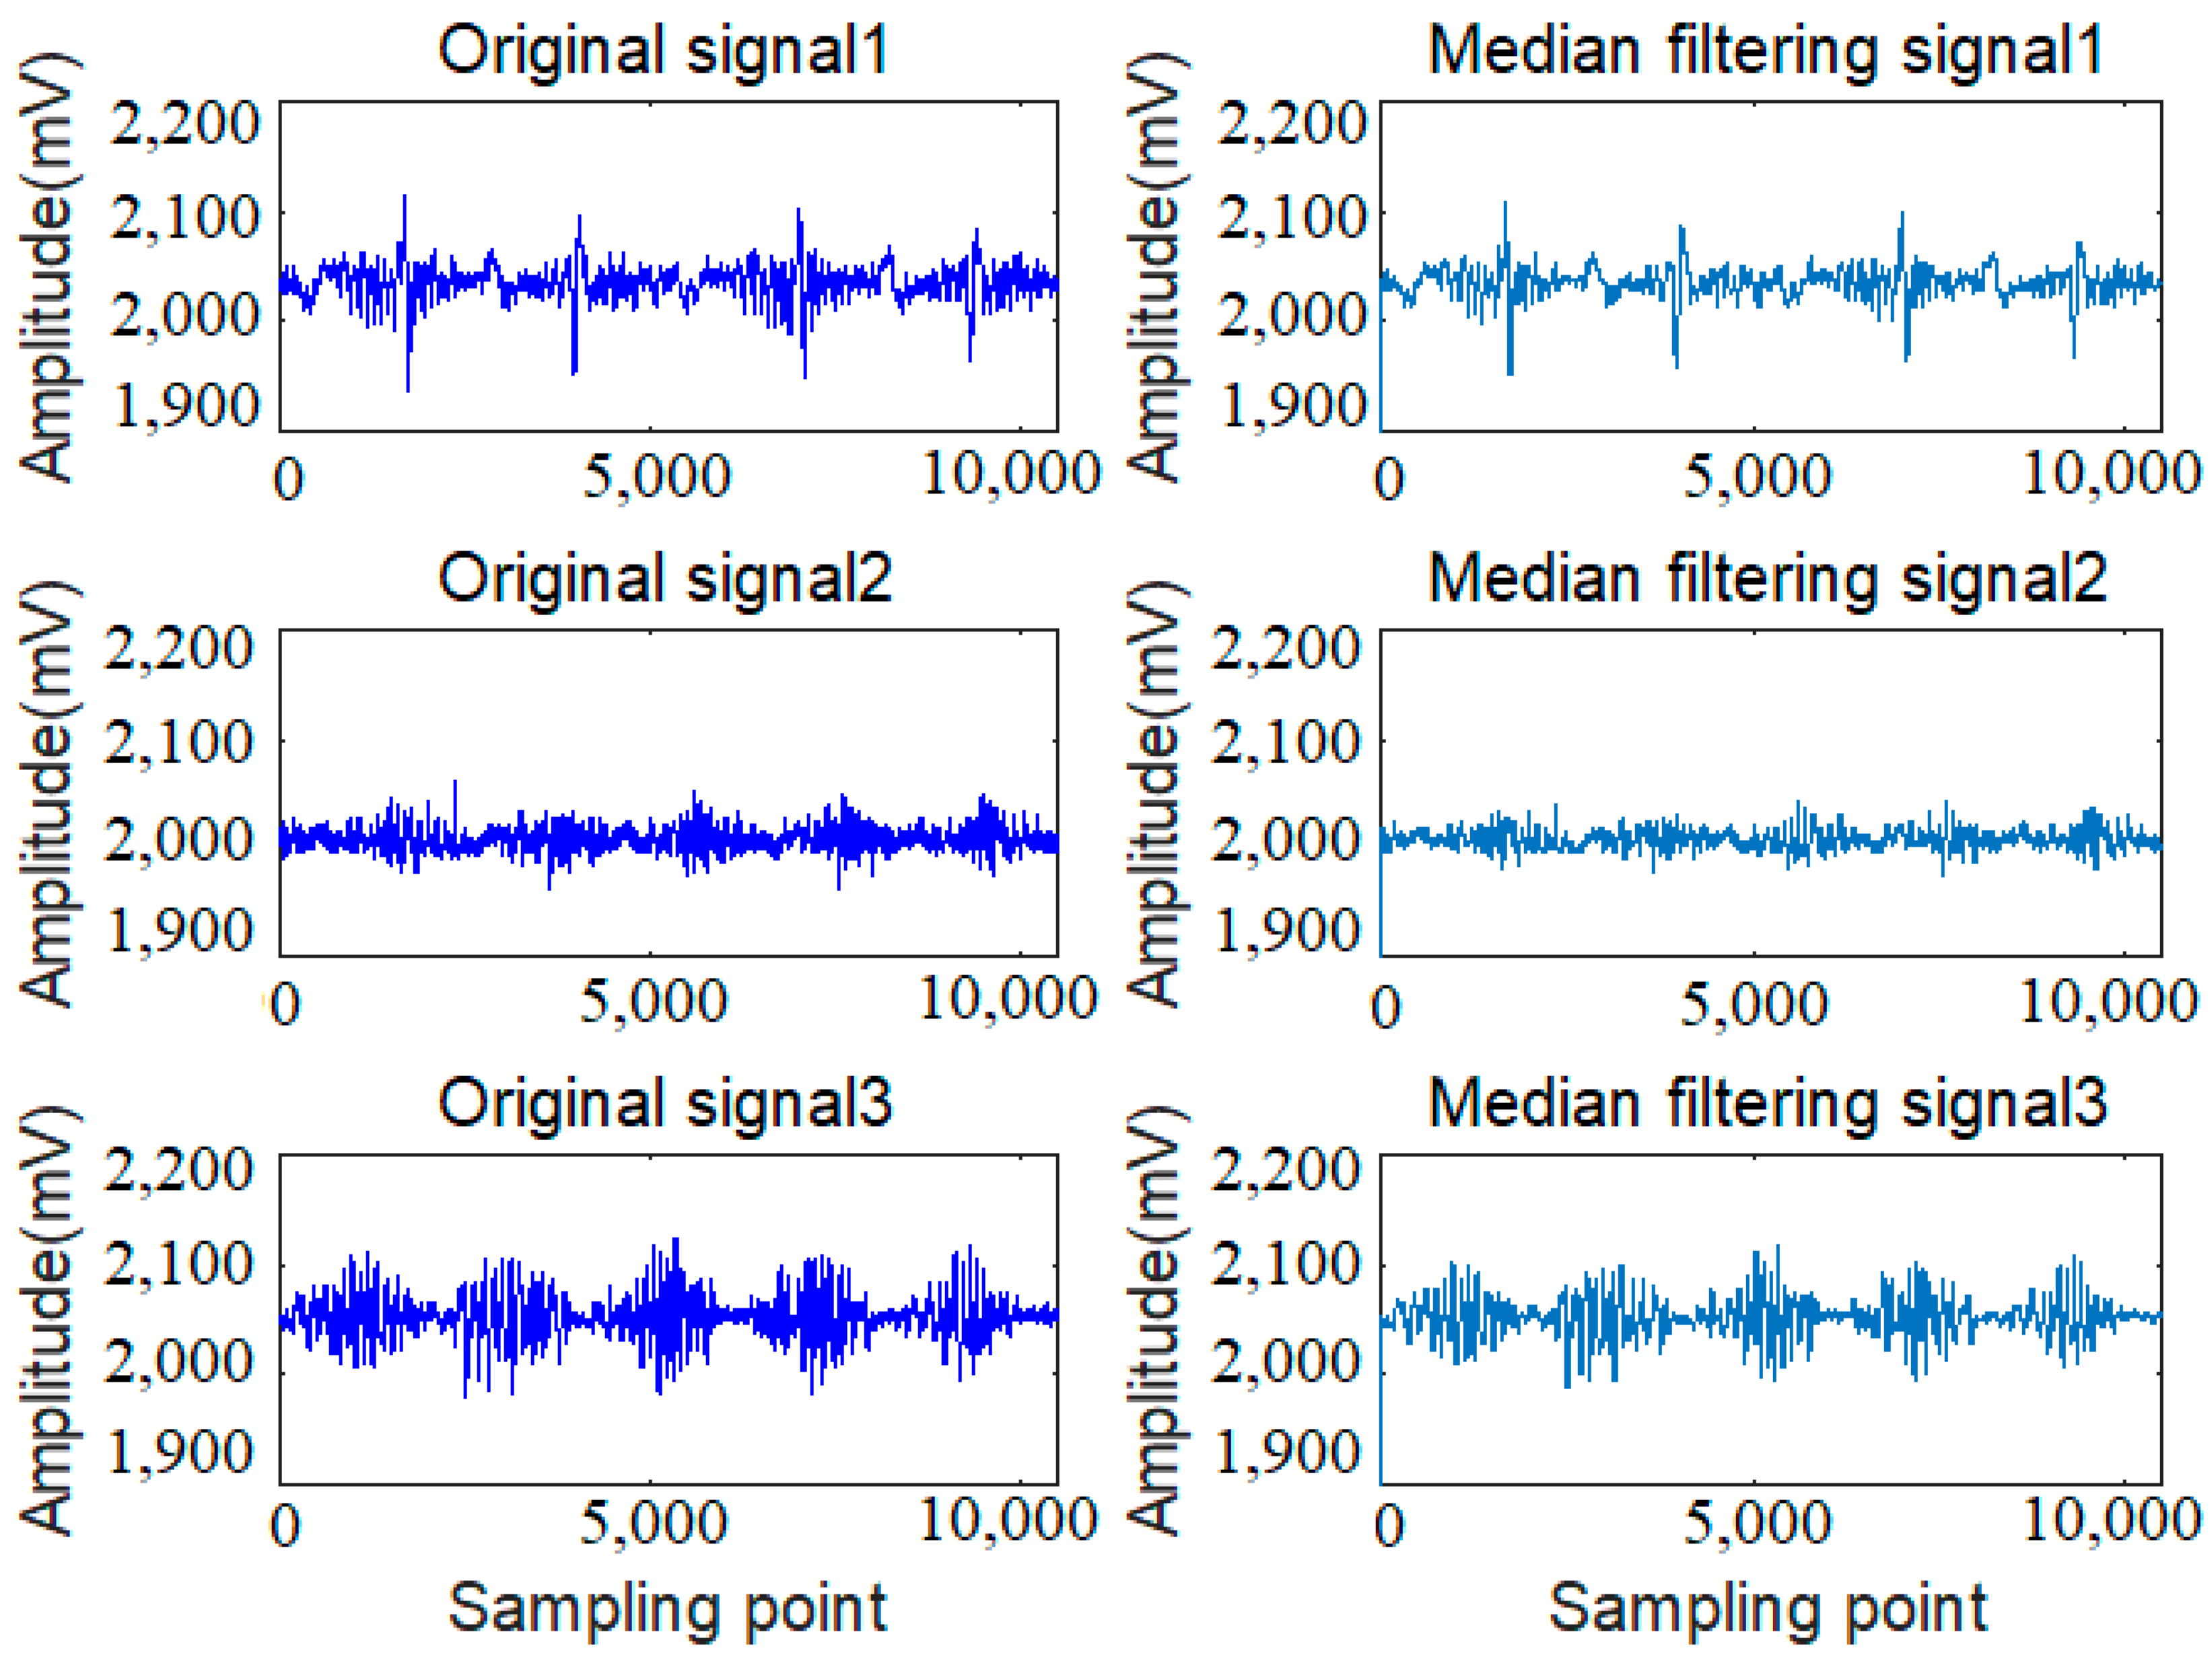
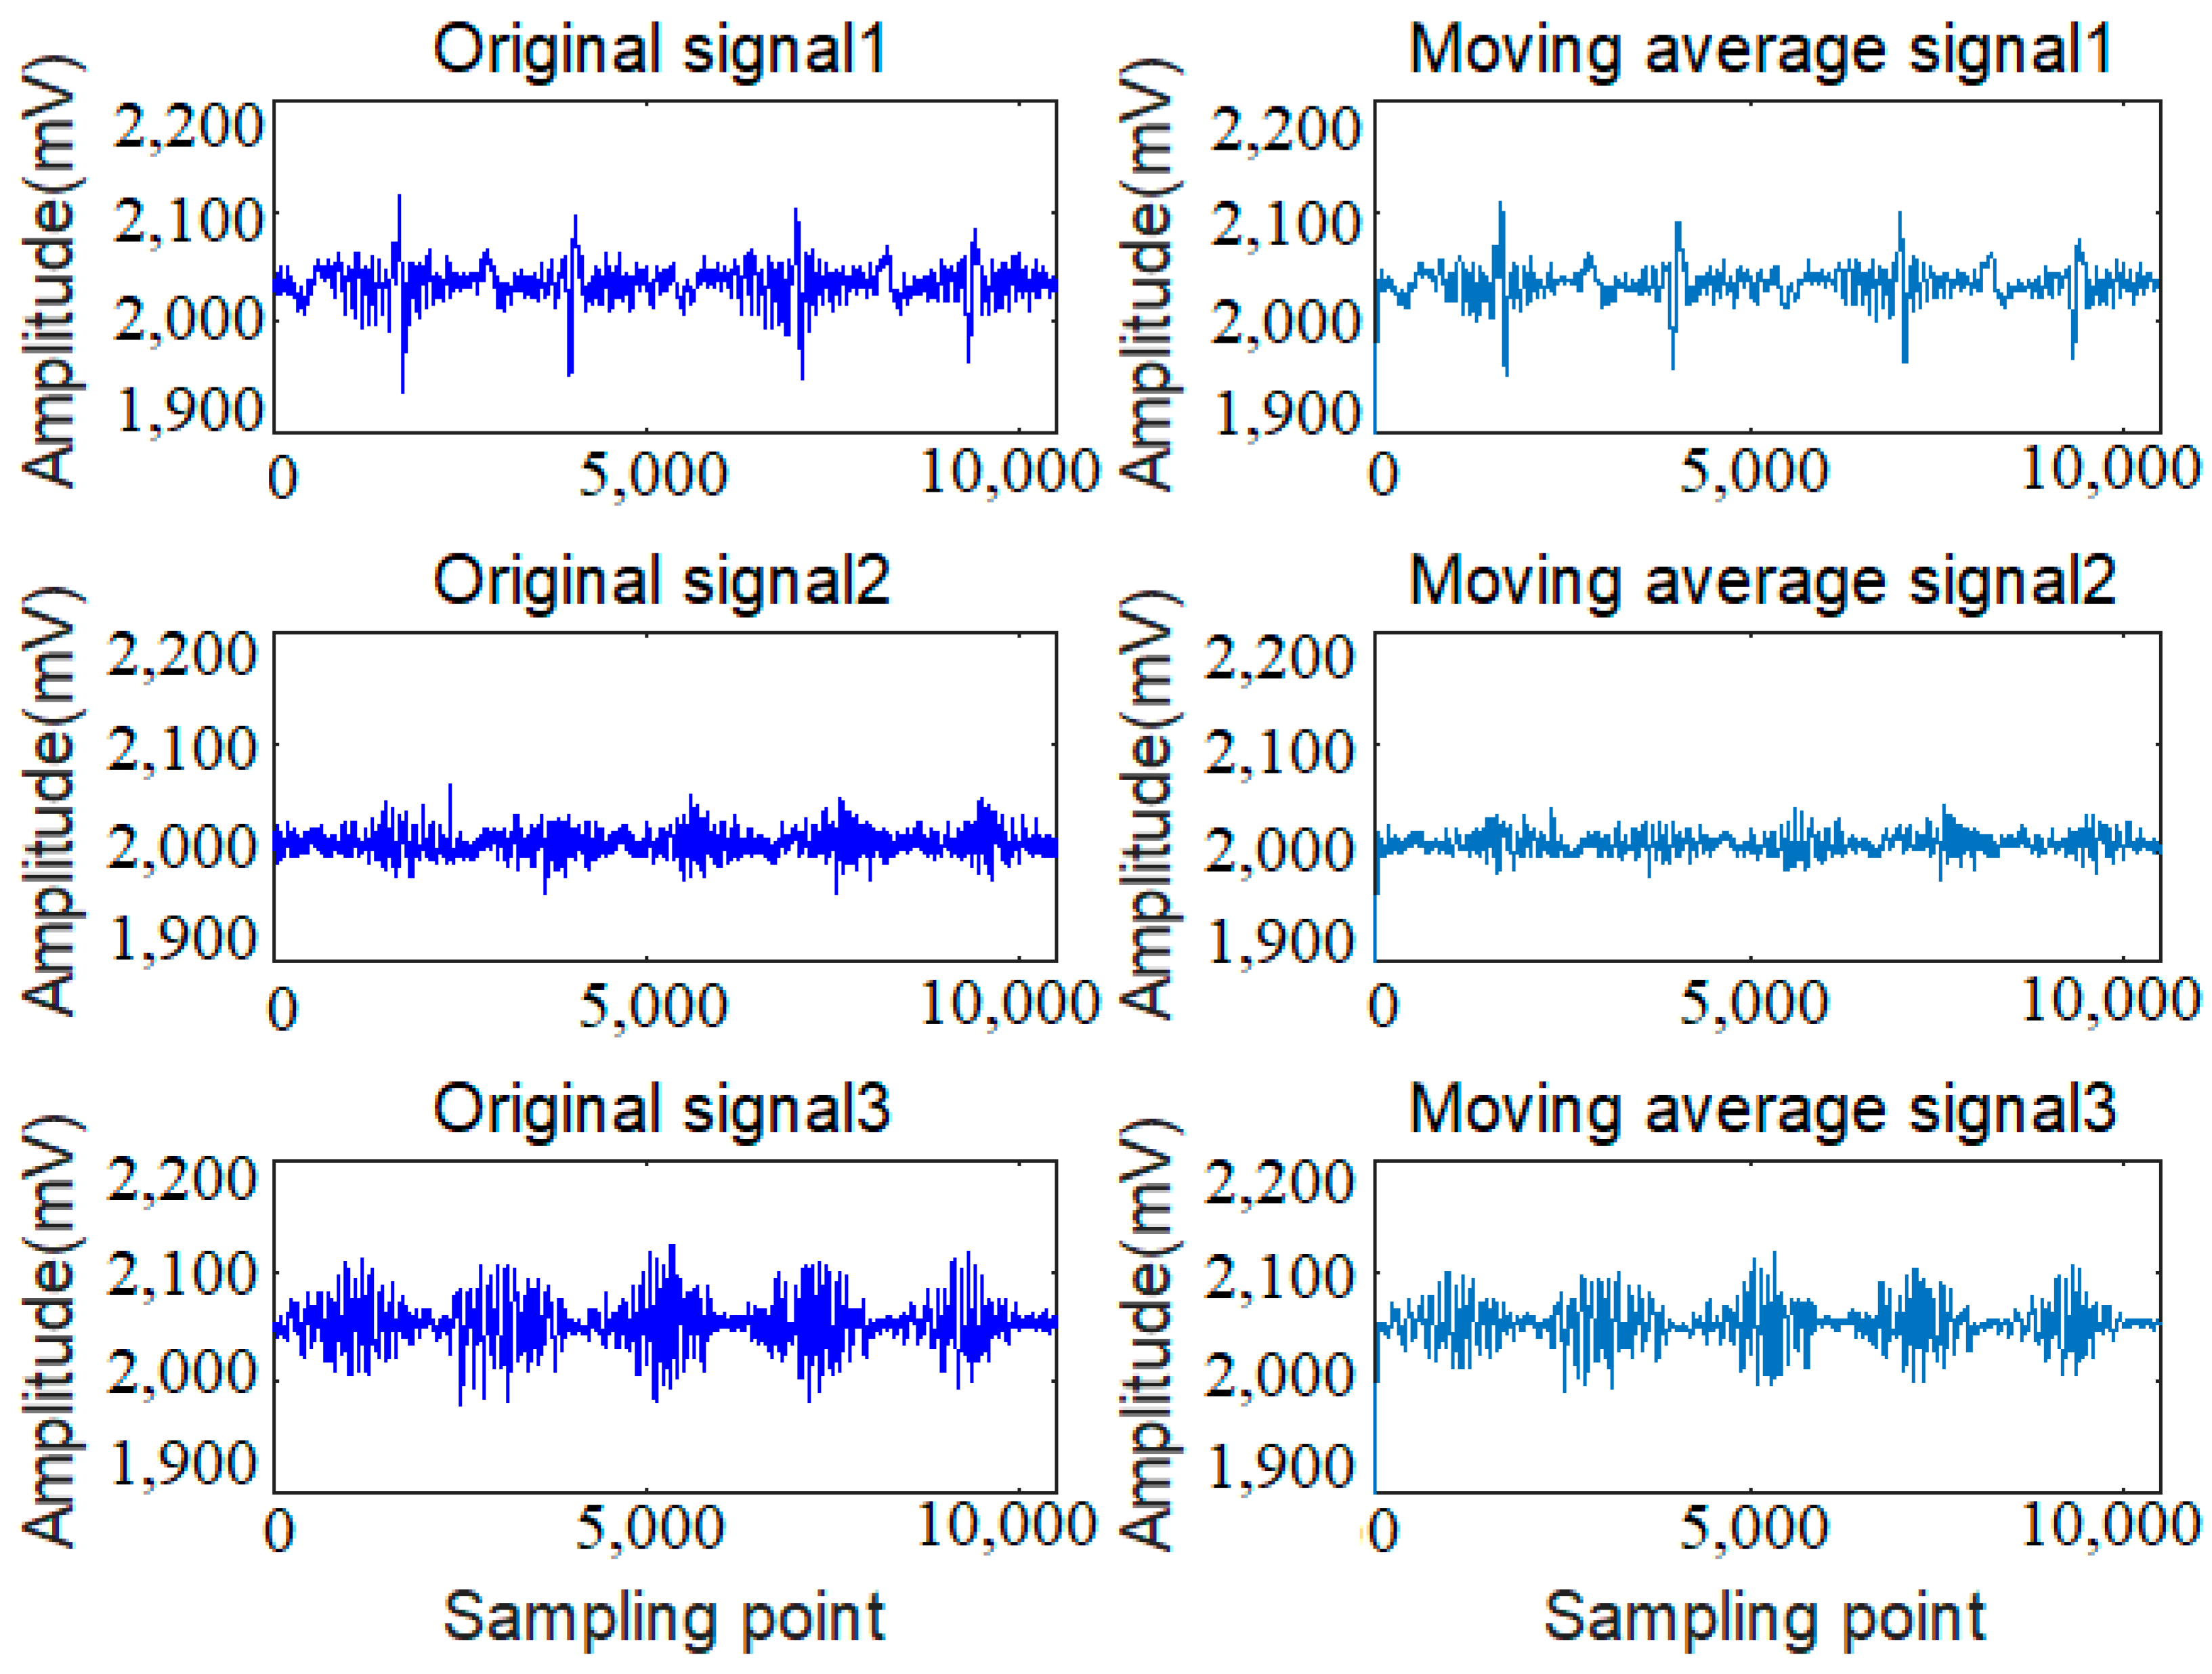
4.2. Median Filtering and Moving Average Method

Aiming at the non-stationary wire rope detection signals with multi-source characterizations, a nonlinear signal processing method based on median filtering and a linear signal processing method of moving average technique were also applied to these three typical weak signals. The median filtering method was first used regarding to the big liftoff weak signals by replacing the signal point with the median of a certain time series. When every 20 signal points was processed through median filter, the preliminary processing results are shown in Figure 6, and the original weak signals of 1 to 3 correspond with the testing signals of S1 to S3 in Figure 5.
Explanatorily, all the original defect signals in the left side are very weak, and the defect features become more and more difficult to recognize from signal 1 to signal 3. Although the processed signals shown in the right side manifest that the burr noise features are abridged and the SNR is improved in some extent, especially for the median filtering signal 1, the weaker signals of 2 and 3 are still difficult to identify judged by the median filtering signal of 2 and 3. Namely, the nonlinear signal processing method of median filter could denoise the wire rope signals to some extent, the defect features of weak wire rope signals are still overwhelmed by multi-source noises. Therefore, the single median filtering method is also incapable of weak wire rope signal denoising as well as the feature identification. Nevertheless, a linear signal processing method based on the moving average technique is presented. When the moving average span is set as 200, the typical three kinds of original signals and the processing results by moving average technique are shown in Figure 7. Similarly, the SNR of these weak signals are improved to some extent, but the defect features still could not be effectively identified, especially for the big liftoff wire rope inspection signals expressed in moving average signal 2 and 3.
Combining the single nonlinear and linear weak signal processing results aforementioned through median filter and moving average technique, three typical weak wire rope detecting signals still could not be well recognized because of the mixed interference features of multi-source noise and wire rope strand signals, which not only demonstrated the incapability of these single weak signal processing methods, but also indicated that the weak wire rope signals’ processing are full of challenges and difficulties.

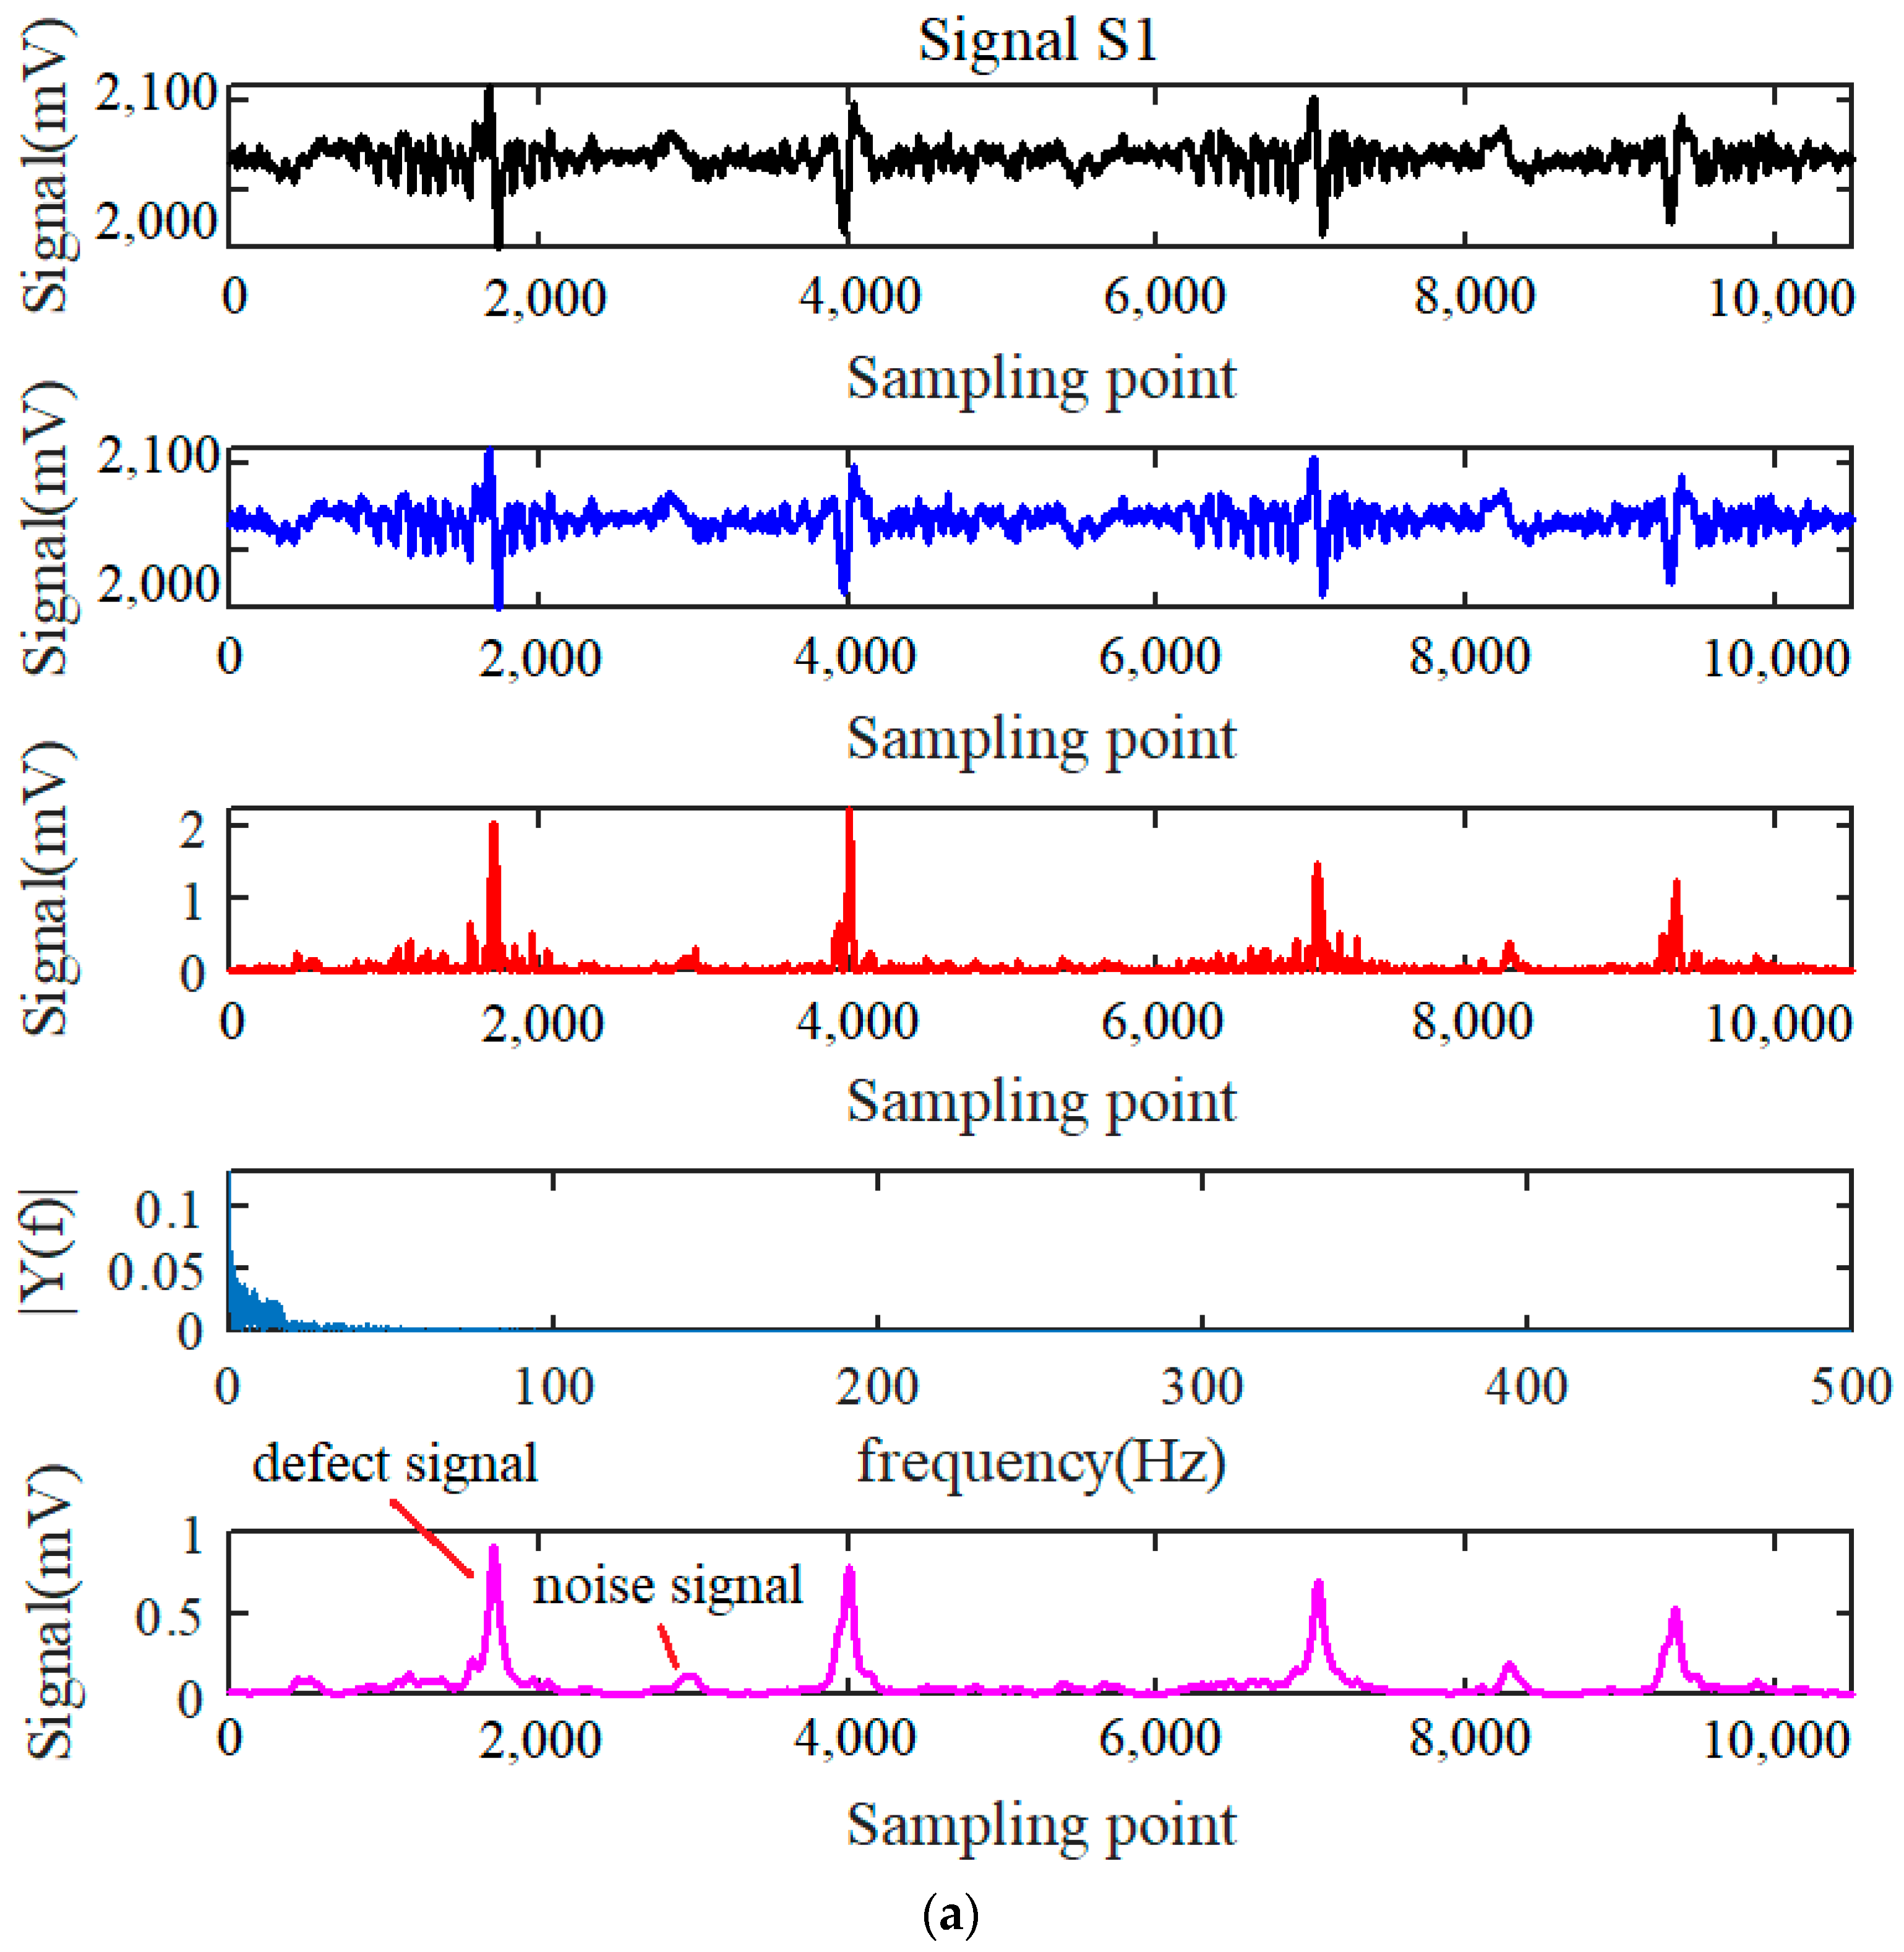
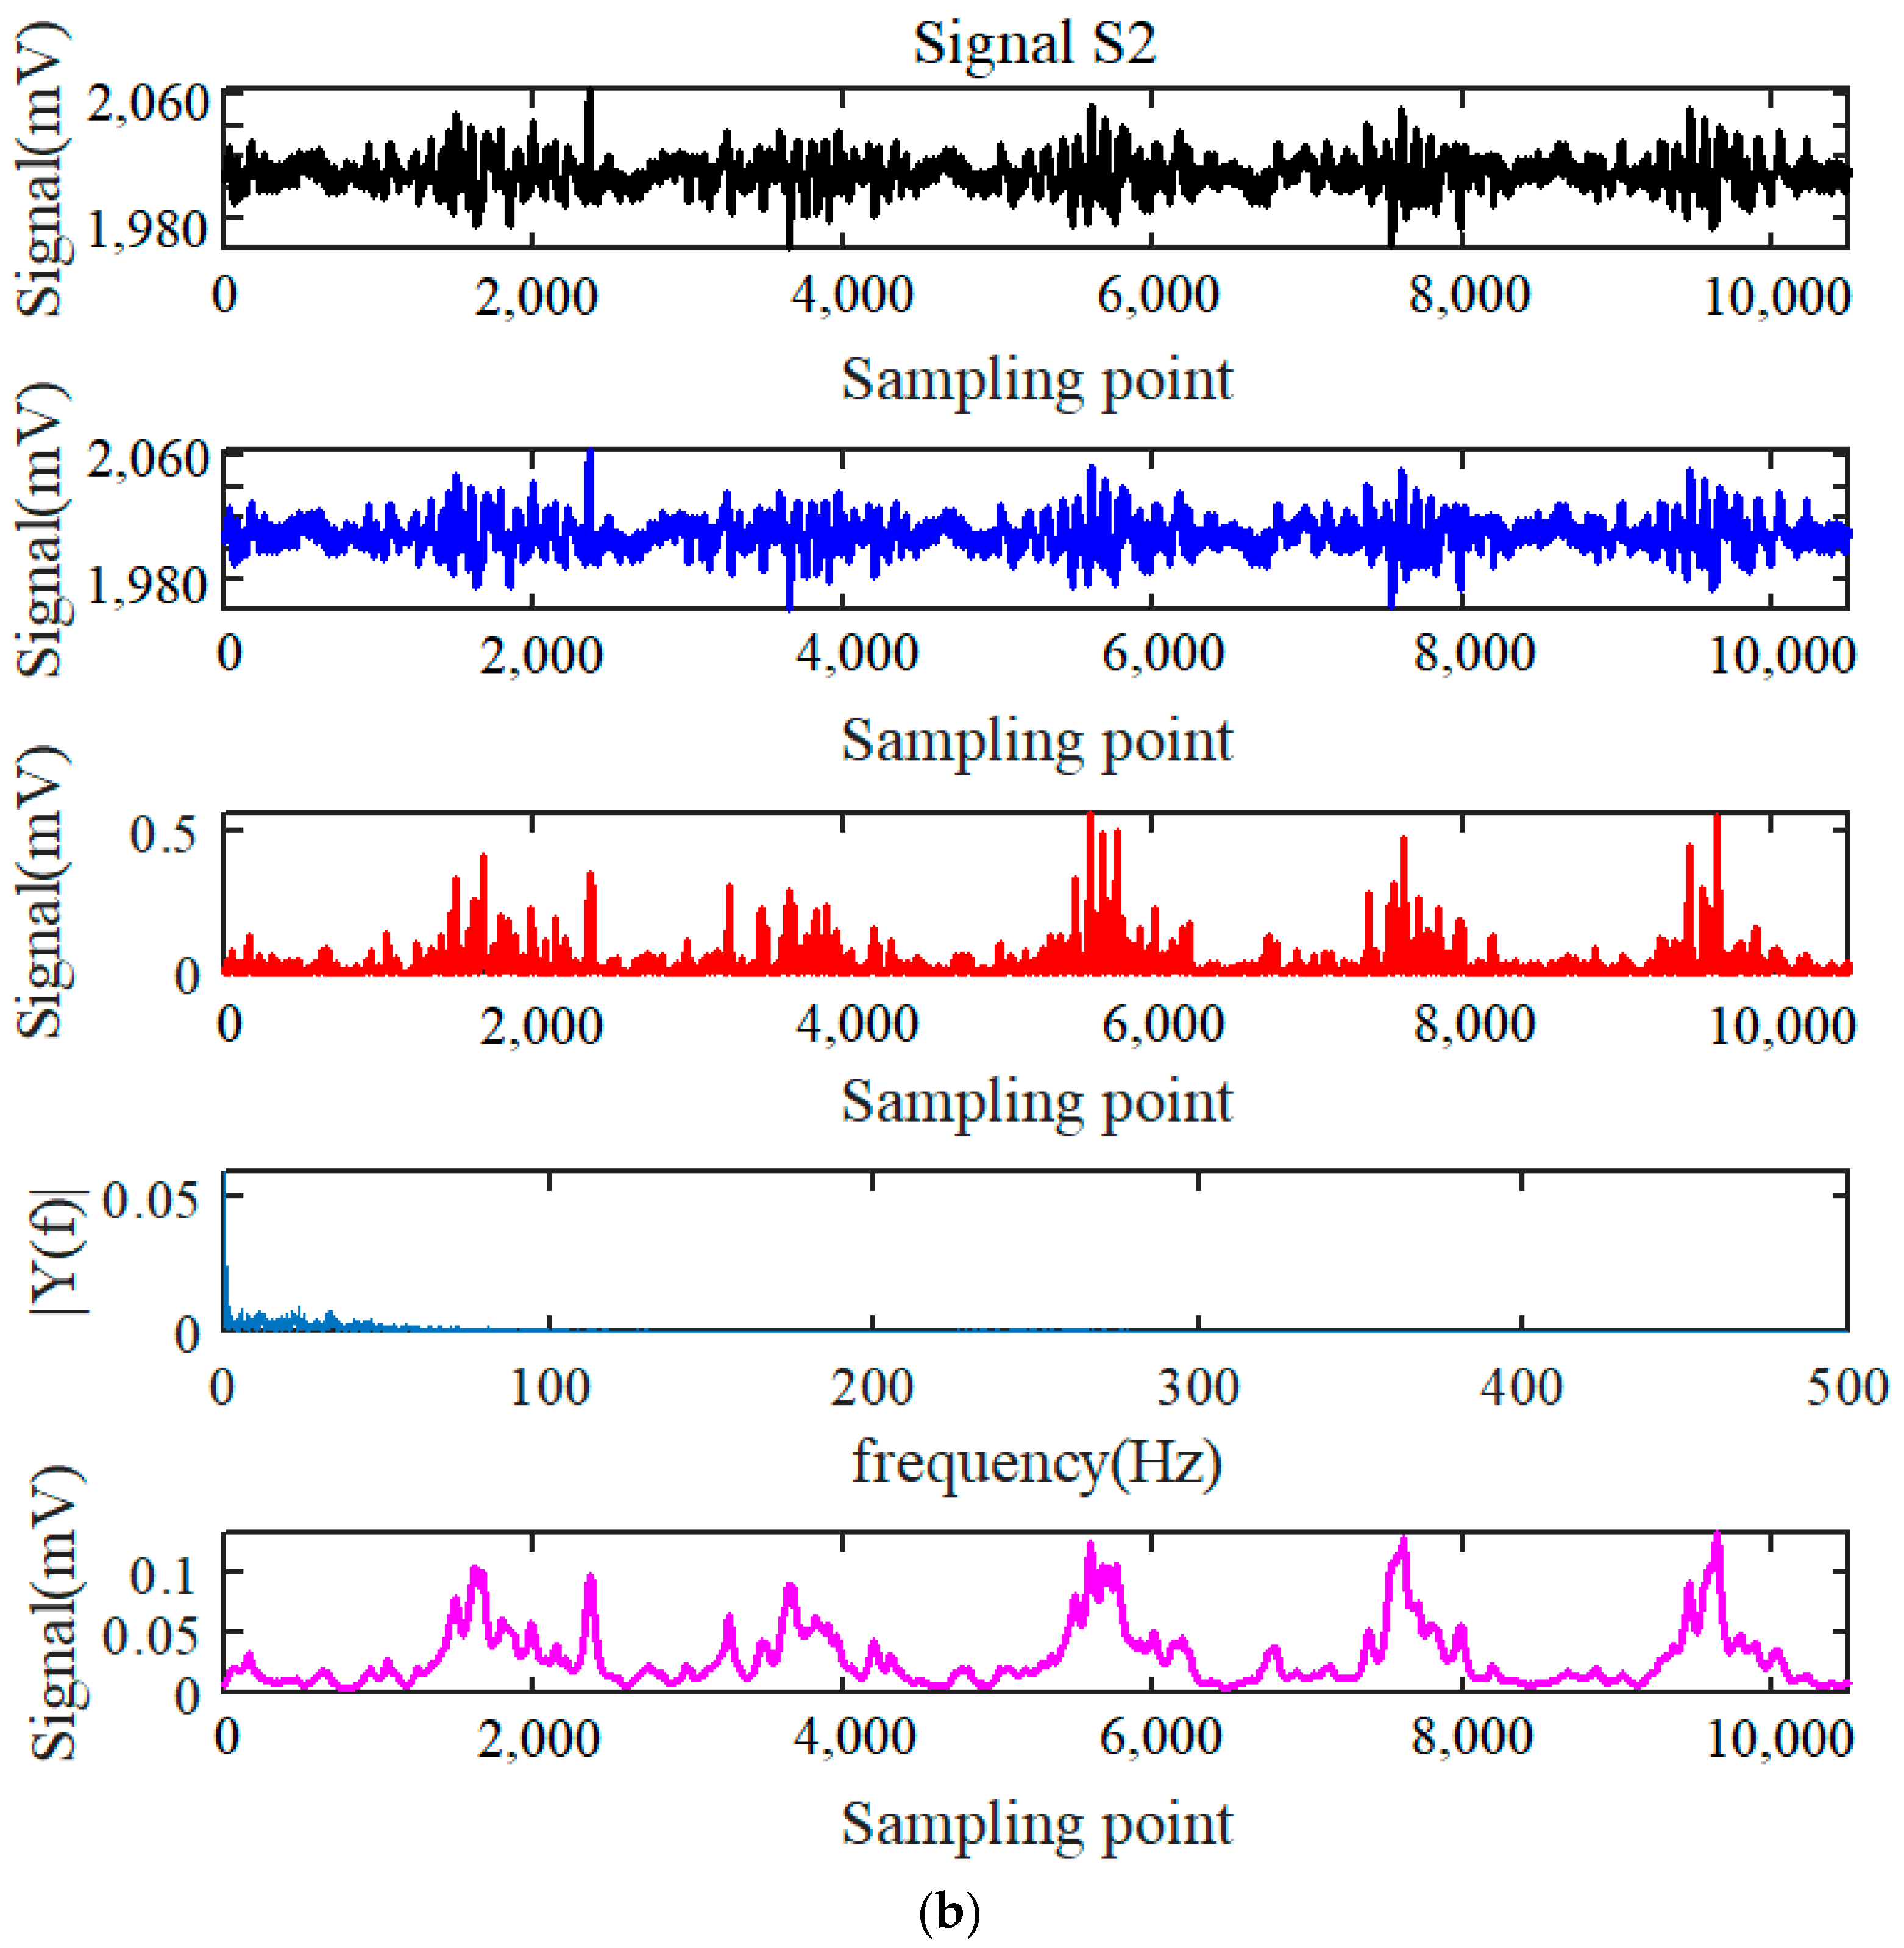
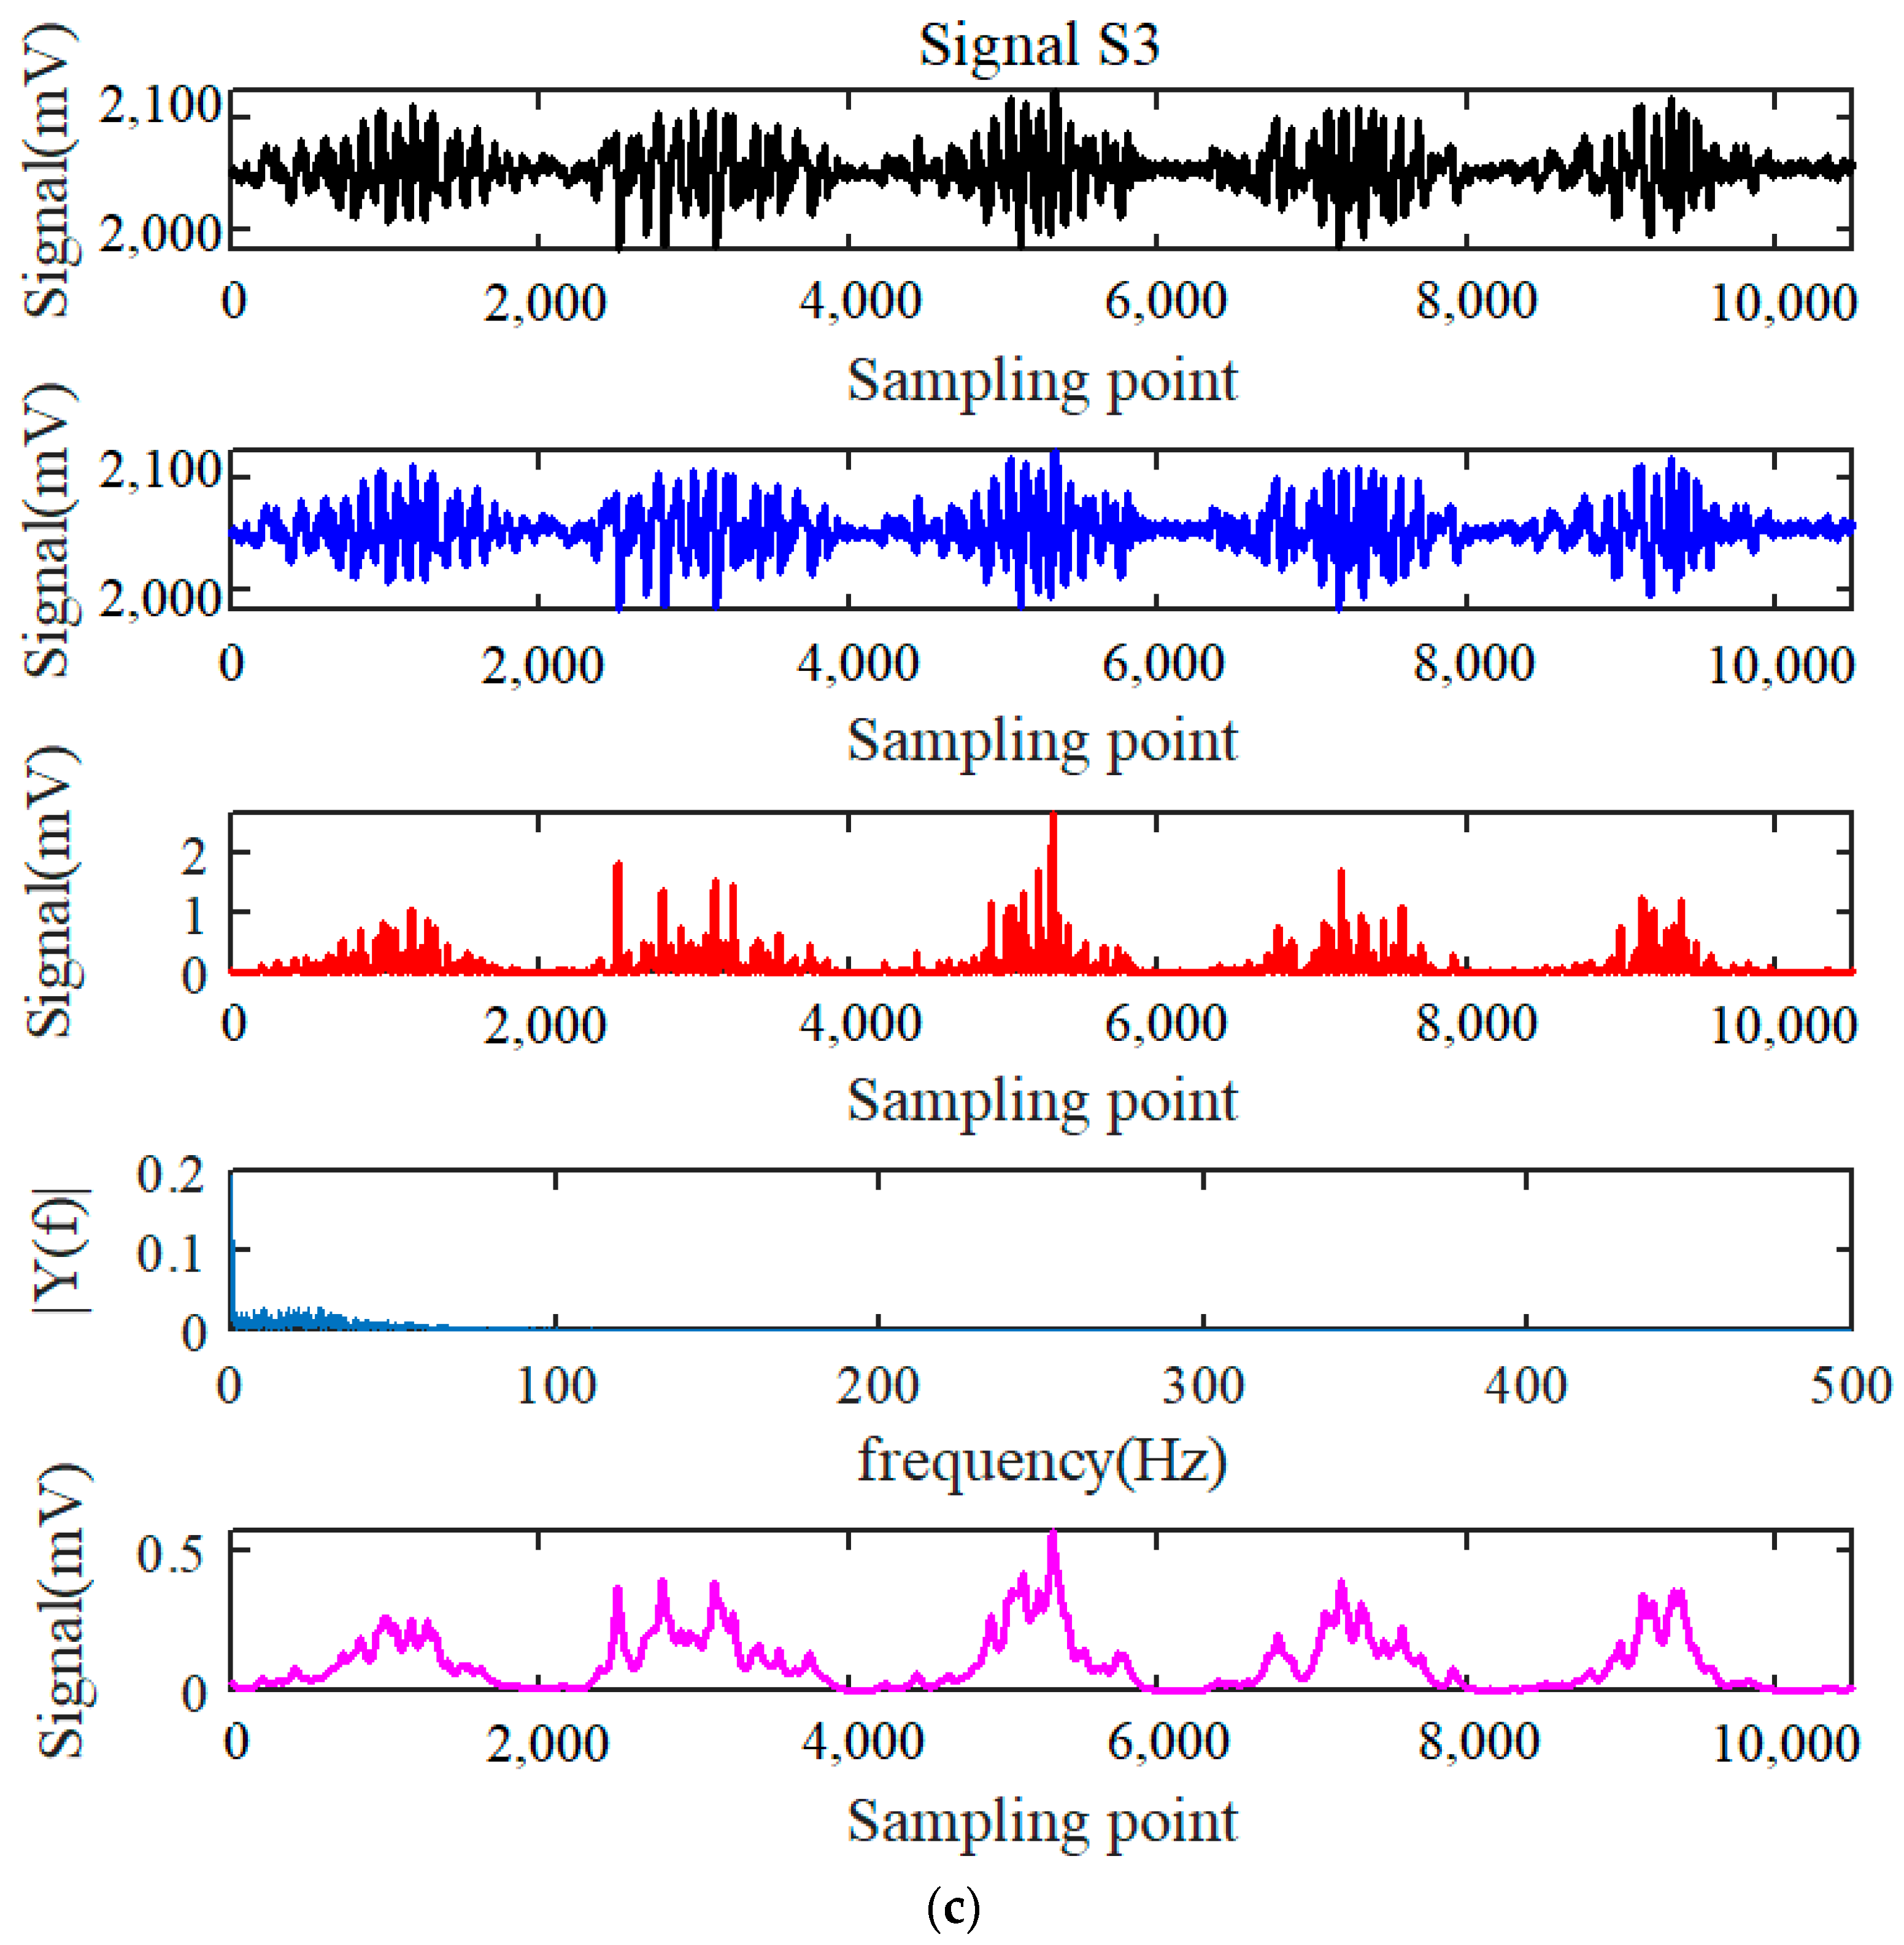
4.3. The New Proposed Method

4.3.1. Hilbert–Huang Transform Combined Lowpass Filter

After further investigation for the weak wire rope inspection signals, it could be found that almost all the defect signals resemble the sinusoidal waveform in shape. Moreover, the defect signals always feature with a prominent amplitude in time domain and are surrounded with continuous strand waveform simultaneously. Simple time and frequency analysis may not be capable of recognizing these weak signals with complicated characterizations. Hence, a phase transform technique based on improved Hilbert–Huang Transform (HHT) and signal filtering methods are considered. According to the principles of the new proposed methods explained in Section 3, the same three typical weak signals processed through the proposed methods are presented in Figure 8.
Specifically, the signals displayed in Figure 8a are the original weak signal S1, the Hilbert transformed signal, the differential signal, frequency spectrum. and the lowpass filtering signal in sequence. After the signal differentiation between the original signal and Hilbert transformed signal, the defect signal features become more remarkable, which could be observed from the third line box, despite that the differential signals being very weak and mixed with some noise. Furthermore, the frequency spectrum in the fourth line box shows that the differential signals are all in a low frequency band, and most of the components fall within the frequency region lower than 50 Hz. Therefore, further signal denoising techniques by Butterworth lowpass filtering method was applied, and when the cutoff frequency was 5 Hz, the processing results were shown in the last line box. Apparently, the defect signals were characterized with four obvious peak waves and the non-damaged signals were featured with a smooth baseline or a slight fluctuation, which manifests that the defect on the wire rope can be well inspected and distinguished. Comparing with the traditional nonlinear and linear denoising methods mentioned above, the proposed method is capable of weak wire rope signal inspection and shows great potential in high precision defect detection.
The other two kinds of defect detection signals are expressed in Figure 8b,c, respectively. Similar to the processing results presented in Figure 8a, although the original signals of S2 and S3 are very weak both in amplitude and SNR, the basic defect features are preliminarily extracted after the signal differentiating, as shown in the third line box. According to the further frequency analysis by FFT, the frequency components and distribution of the differentiating signals presented in the fourth line box manifests that the processed signals are still featuring with low frequencies smaller than 100 Hz, especially for the defect characteristics gathering under 50 Hz. Judged from the lowpass filtering signal expressed in the last line box, five signal peaks with small burr noise could be observed obviously, namely, the weak signals could be distinguished preliminarily both for the original weak signals of S2 and S3. Comparing the signal processing results illustrated in Figure 8a with those expressed in Figure 8b,c, it could be deduced that the bigger the defect is, the higher the SNR and the smaller the signal span are. Consequently, further signal smooth filtering methods are required regarding weaker and bigger liftoff signals.

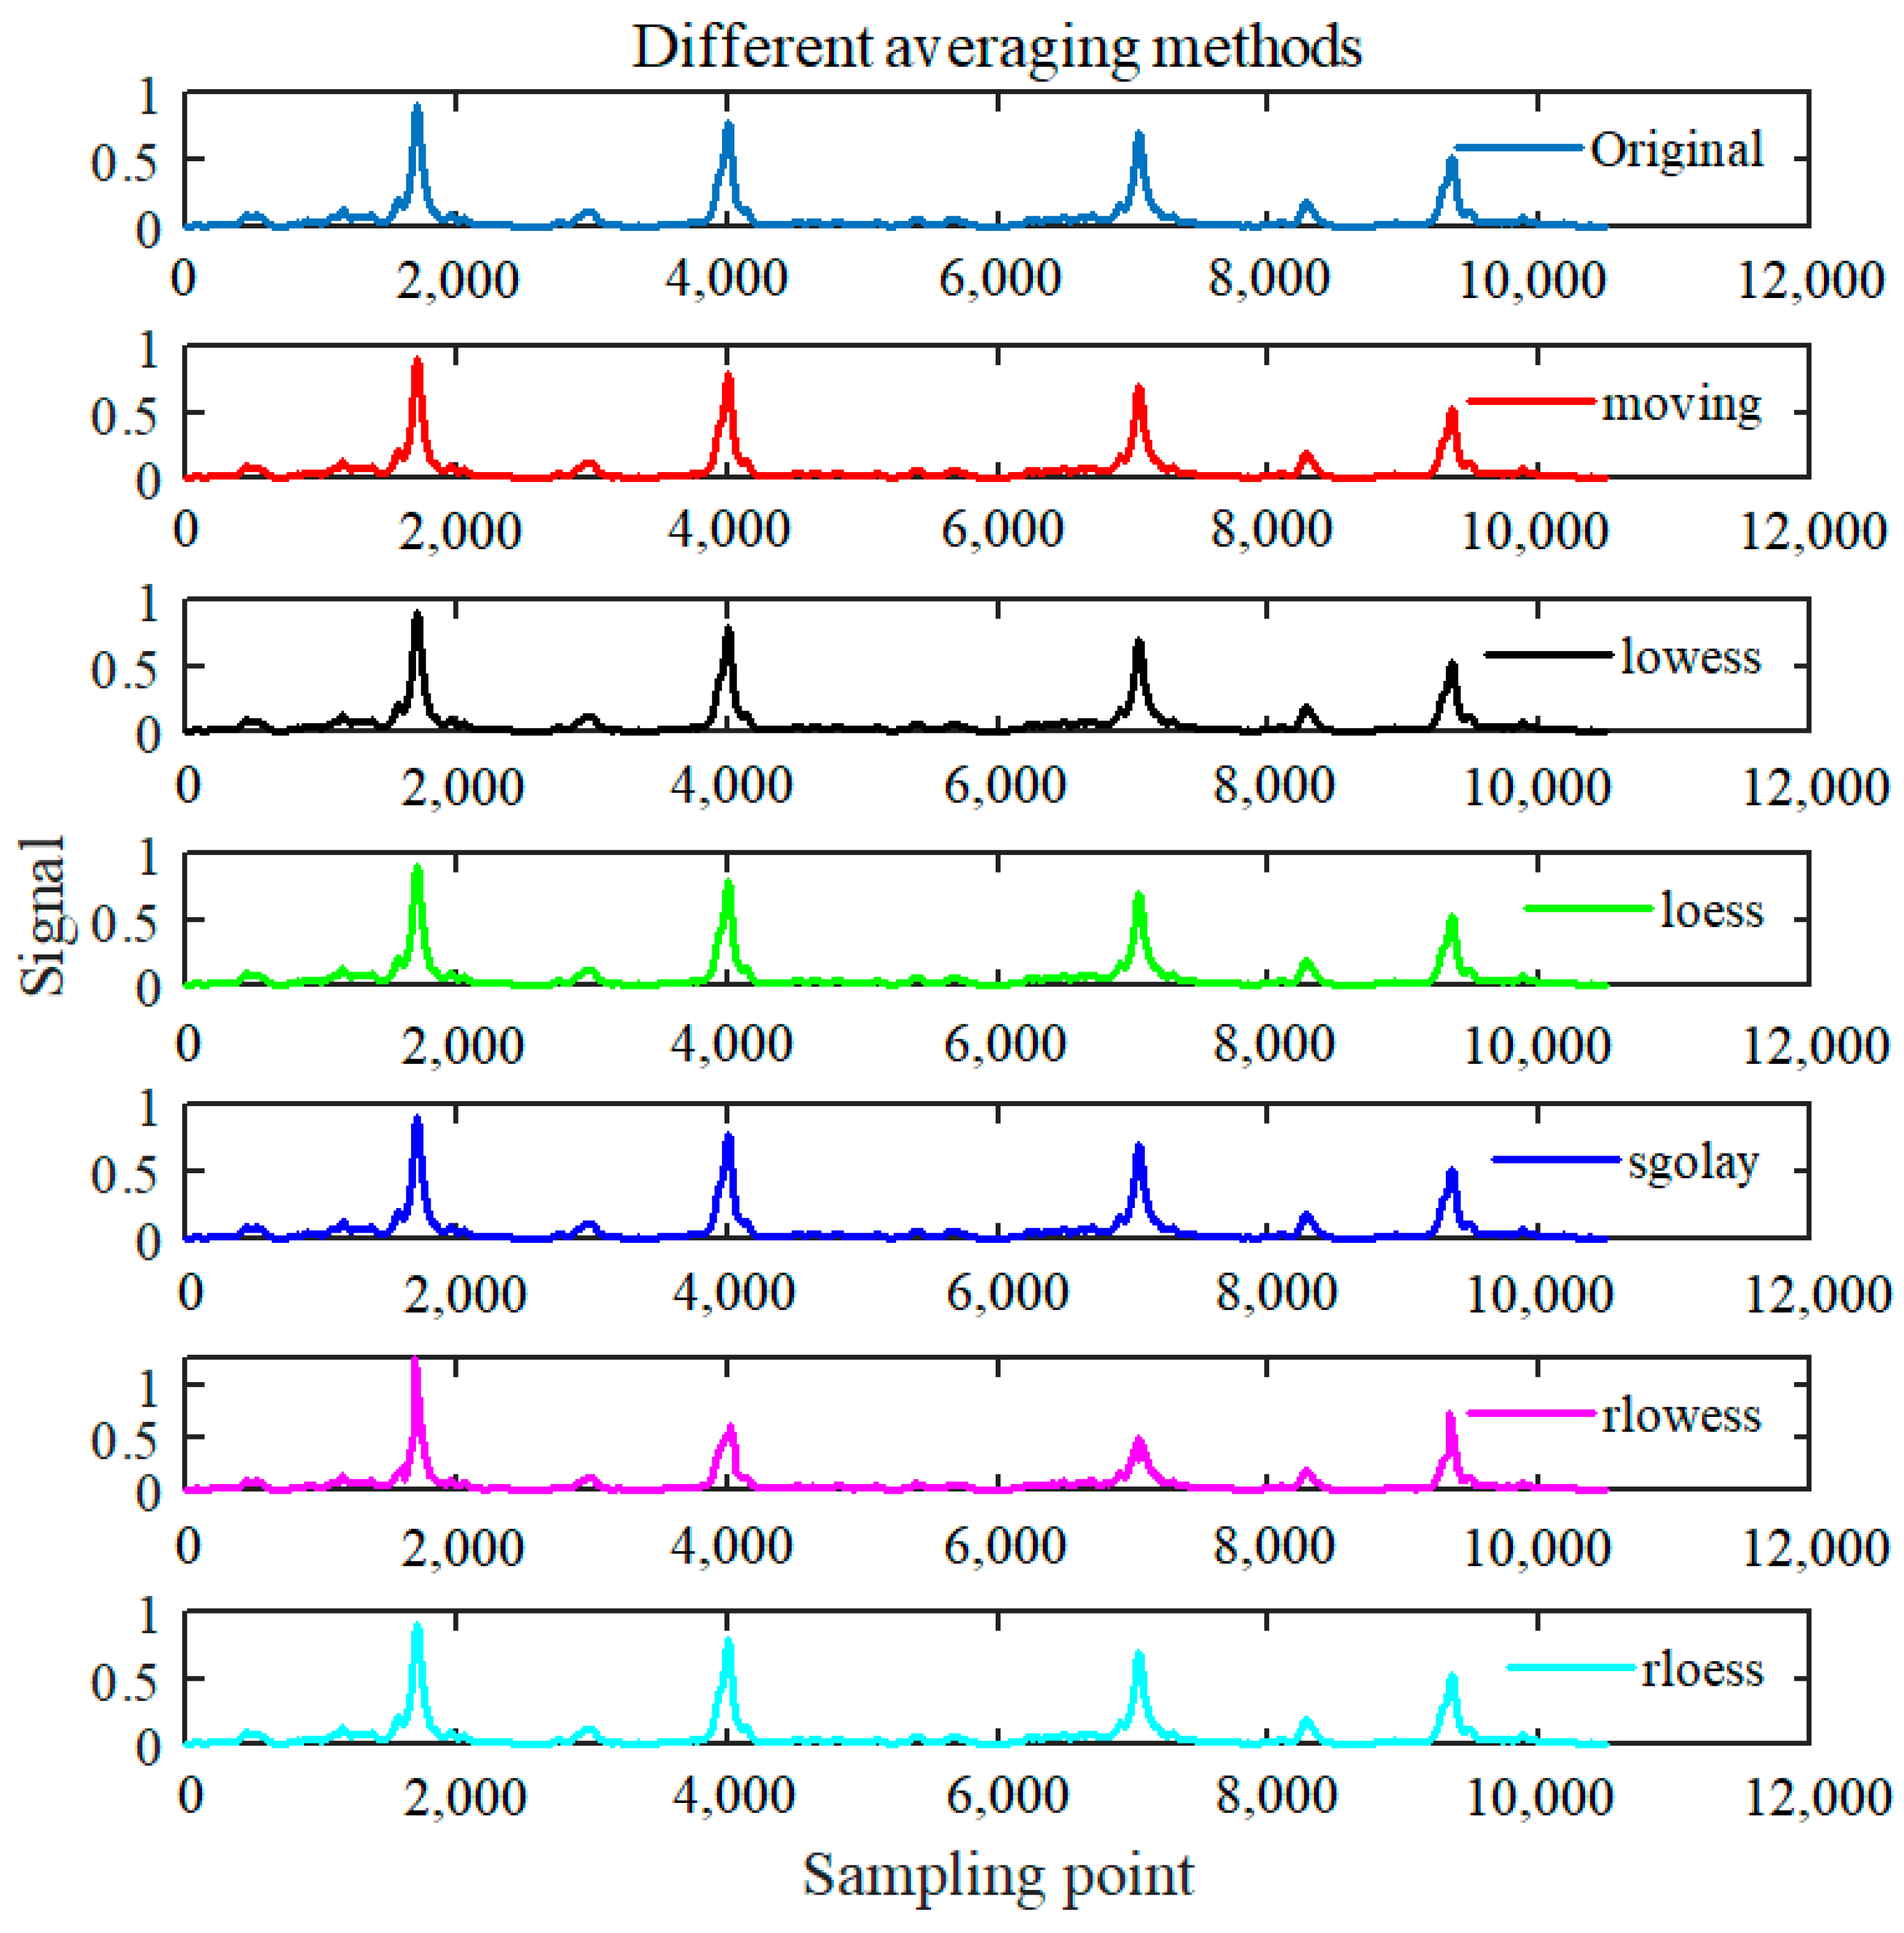
4.3.2. Influence of Smooth Filtering Methods

Accordingly, six types of smooth filtering functions and methods were used and compared regarding to the processed signal of S1, as shown in Figure 9. Explanatorily, the legend of original and moving represent the lowpass filtering signal of S1 which is to be further processed with its smooth filtering processed signals by moving average method. The legend of lowess and loess in the third and fourth line box means that the signals were processed by weighted linear least squares with first-order polynomial model and second-order polynomial model, respectively, while the sgolay means the smoothing signals processed by the Savitzky–Golay filtering method. Similarly, the rlowess and rloess represent the signals processed by robust lowess and loess methods, separately. Obviously, the signals processed by the moving average method become smoother in the amplitude and shape, and the micro fluctuation of the interference signals become smaller, as well as the signals processed by local regression techniques of lowess and loess. However, the signals processed by rlowess methods shown in the penultimate line box indicate that the signal amplitudes become weaker compared with these signal processing results mentioned above. The signals processed by rloess method expressed in the last line box were also featured with high SNR and distinct signal peaks. According to these signal processing results filtered by smoothing techniques, it could be found that almost all the smoothing and averaging methods were available for the original lowpass filtered signals except the rlowess method. Consequently, the typical moving average method was chosen as the smooth filtering technique in the proposed algorithm.

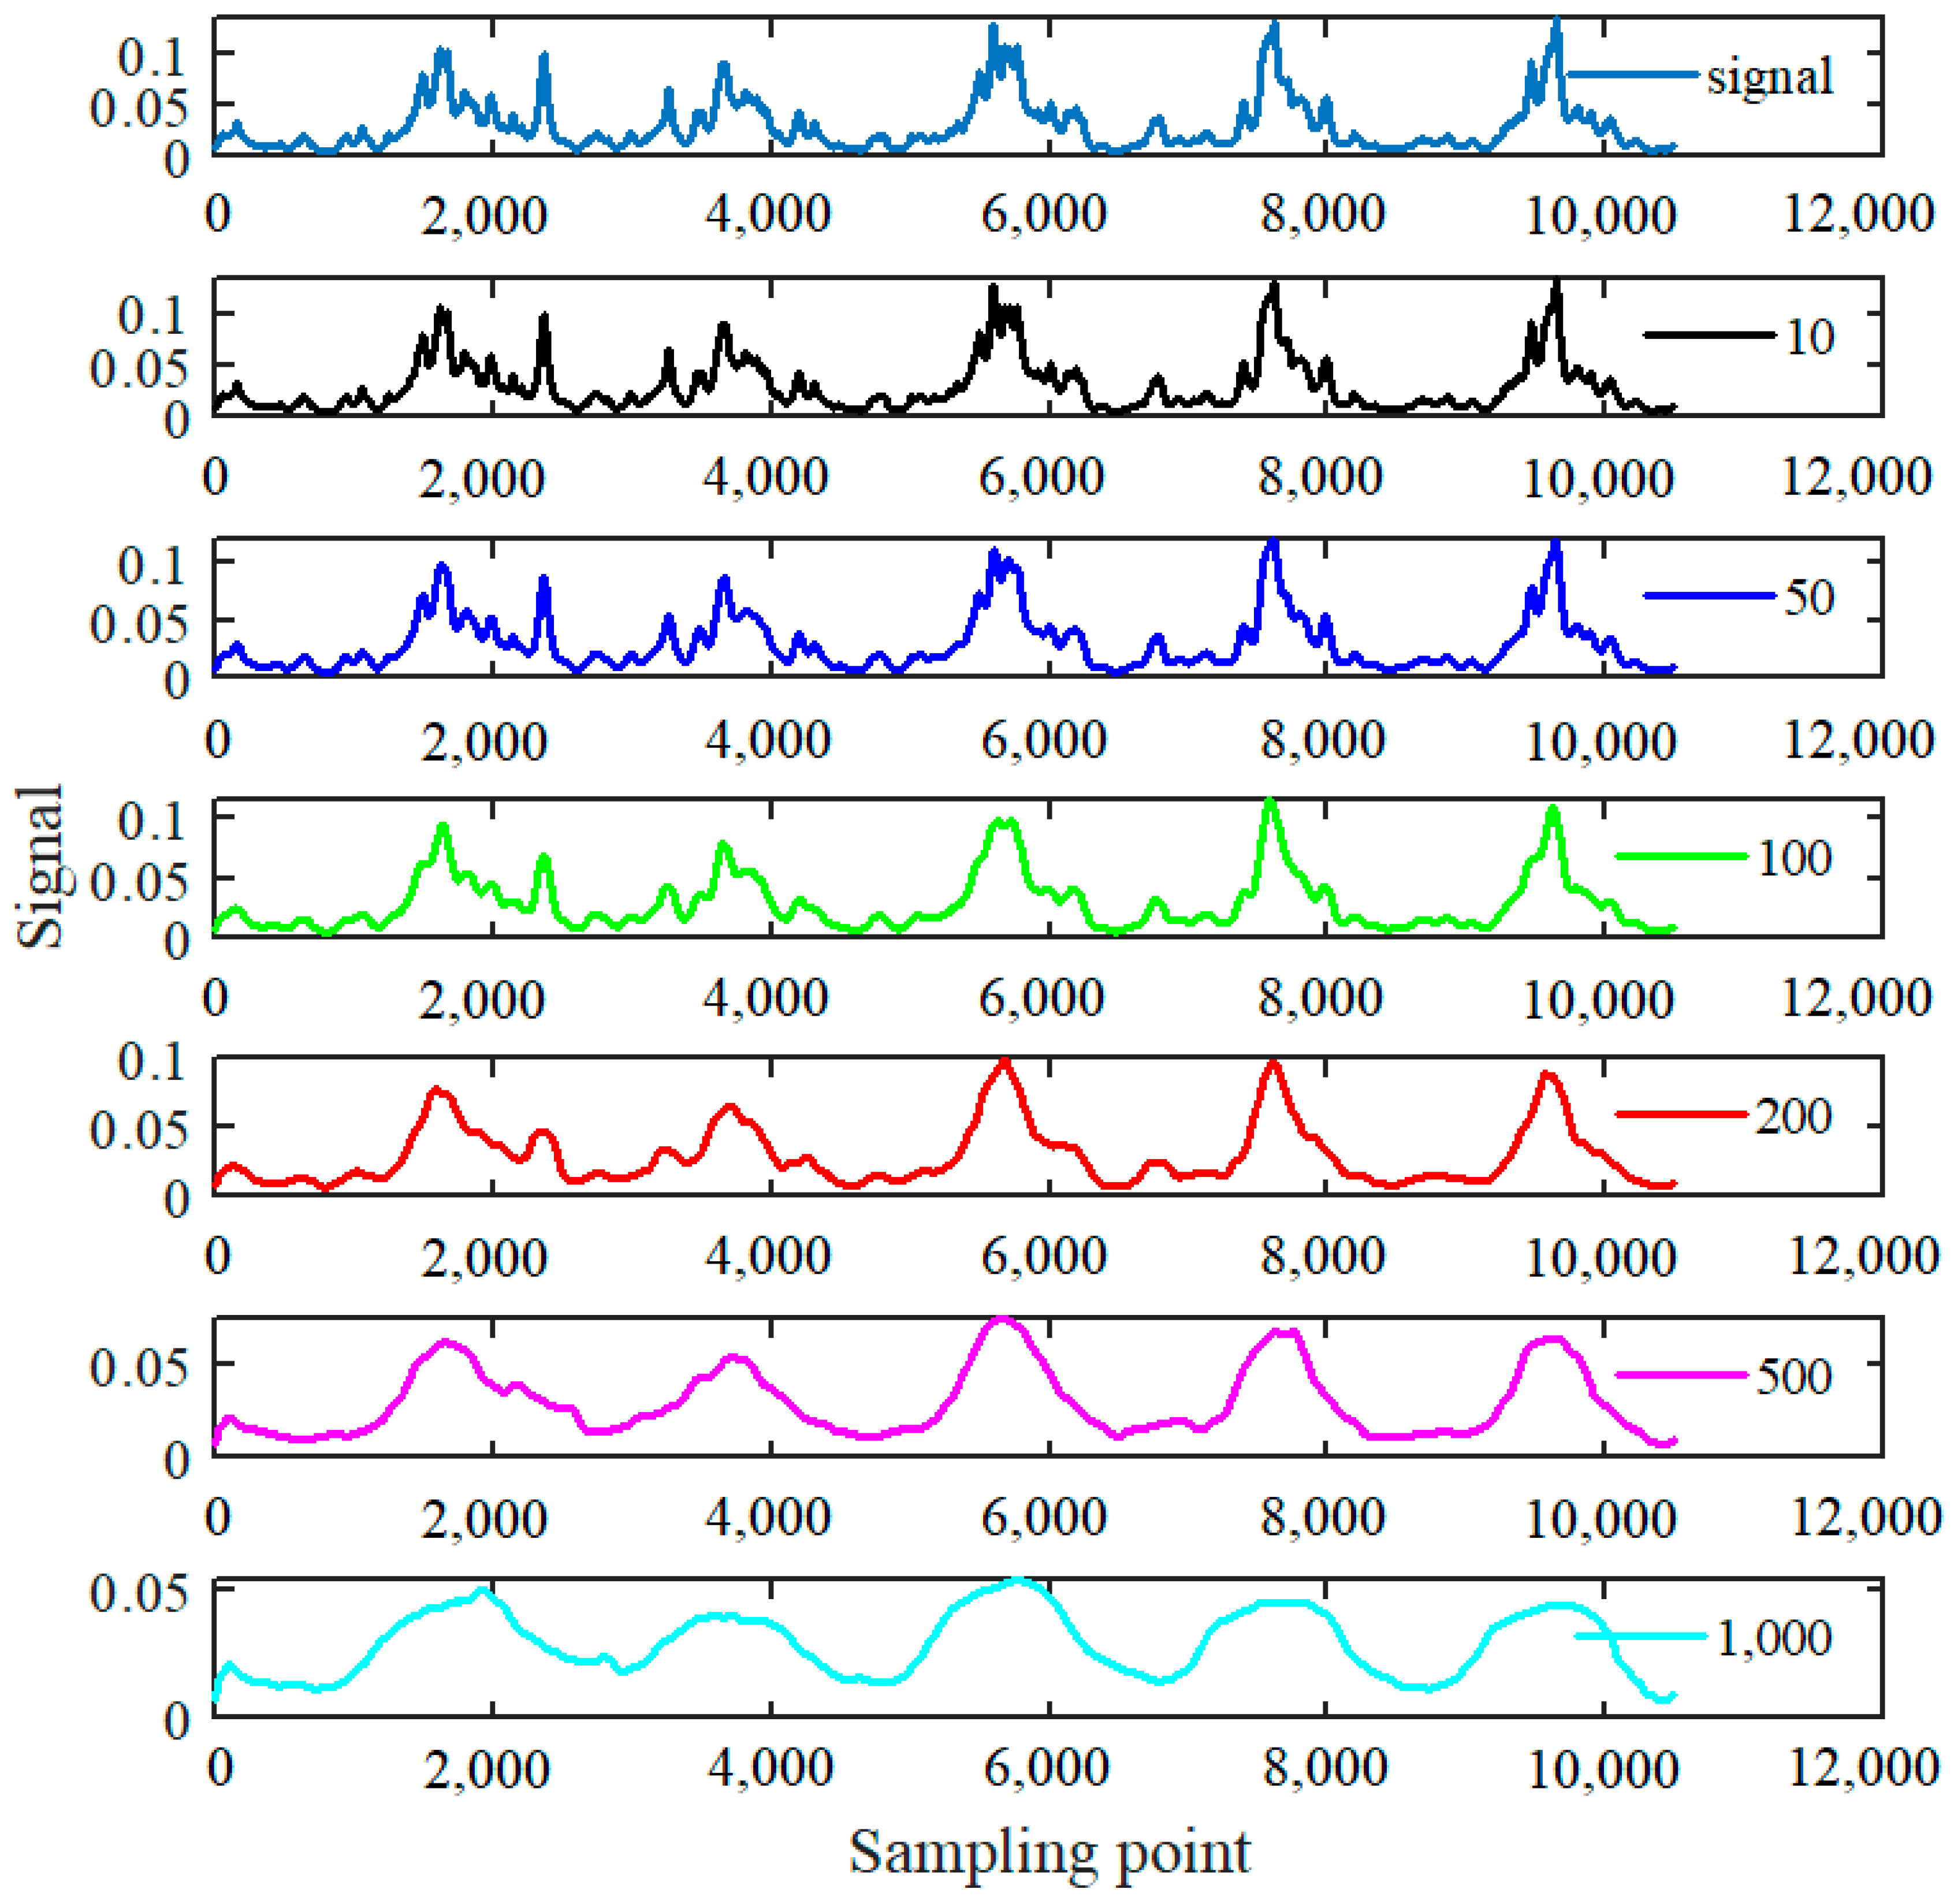
4.3.3. Influence of the Span in the Moving Average Method

As mentioned above, when the moving average method was applied, the parameter of signal span should also be investigated. The influences of different moving average spans on the smooth filtering signals are presented in Figure 10. When the moving spans were set as 10, 50, 100, 200, 500, 1000, the averaging results for the lowpass filtered signal of S2 illustrated in Figure 8b manifested that as the moving average parameter of span increases, the processing signals became smoother, and the micro interferences also became weaker and smaller. Nevertheless, when the signal averaging span was less than 100, the smoothing results shown in the second to the fourth line box indicated that the processed signals were nearly the same with the original signal, namely, little changes could be observed for these signals both in waveform shape and amplitude. When the averaging span was bigger than 500, some of the signal defect characterizations were also eliminated and reduced, especially for the signal amplitudes, and only little signal fluctuations were observed.
Finally, the time-frequency joint analysis by short-time Fourier transform is presented in Figure 11. Specifically, the original signals of S1, S2, and S3 after the processing of HHT and differentiating are shown in Figure 11a–c, while the signals after the final step of smooth filtering are presented in Figure 11d–f, respectively.
Comparing the STFT results of signal S1 expressed in Figure 11a,d, although the defect characterizations are still mixed with signal noises judged by the spectrum illustrated in Figure 11a, the spectrum of the signal defect could be apparently observed in Figure 11d when processed by the proposed methods after the smooth filtering by moving average technique. In other words, there are four signal strength enhancement regions in Figure 11d, which is exactly corresponding to the original defect features and numbers of signal S1 aforementioned in Figure 5a. Similarly, despite the mixed components of defect and interference signals expressed in Figure 11b after the signal processing by HHT and differentiating, the final smooth filtering processed signal S2 expressed in Figure 11e are distinguished with five signal enhancement regions, which is the reflection of the wire rope defects. As for the processing results of the original weak signal S3, both the HHT processed and the final smooth filtered signal spectrum presented in Figure 11c,f are featured with five obvious signal enhancement regions, which not only verified the accuracy of the STFT analysis technique, but also demonstrated the validity and feasibility of the proposed weak defect signal processing method. The final signal-to-noise ratio of these signals were calculated according to the formula as follows,
SNR = 10log10(Ps/Pn)
where Ps and Pn are the power of the defect signal and noise signal, respectively. The detailed SNR results calculated by Equation (8) and comparison by different signal processing methods mentioned in Section 4 are shown in Table 1.
Obviously, although the conventional signal processing methods such as the LP-WA, median filtering, and wiener filtering method could denoise the original steel wire rope signals to some extent, the SNR are the highest when they were processed by the proposed algorithm through the successive techniques such as the HHT, lowpass filtering, and moving average, which also demonstrated the validity and feasibility of the proposed weak signal processing methods for steel wire rope.

5. Discussion

Although a shorter liftoff distance makes a better detection signal, it may cause impact, wear, and abrasion between the tested wire rope surface and inner wall of the detector, especially for online wire rope detection when they are operated under high-speed conditions. Therefore, long length defect detection is urgently needed especially in complicated application scenarios, as well as weak signal detection and compensation methods. Moreover, when the defect signals are not so weak under short liftoff distance testing conditions, higher SNR can still be obtained through our improved HHT and filtering techniques. Further, the new proposed HHT and filtering combined method are also capable of weak signal processing for other ferromagnetic objects including steel pipe, oil tank, steel rail other than wire rope under bigger liftoff distance, and complex application environment. However, the feasibility of this study for other types of wire rope defects such as LMA (including wire rope abrasion and corrosion) is still waiting to be validated. Further work may continue to focus on the weak signal recognition and further improvement of the SNR for more types of wire rope defect detection.

6. Conclusions

Owing to the requirement of wire rope weak signal processing, an improved Hilbert–Huang Transform and filtering techniques combined method was proposed in this work. The complexity of wire rope structure and the interference environment make the electromagnetic nondestructive testing signals of wire rope mix with various components, especially for the strand and noise signals, which are featured with similar and overlapped frequency components. By conducting the magnetic flux leakage testing experiments for three typical kinds of wire rope defects under different big liftoff distances, various weak signals mixed with background interferences and noise were obtained and analyzed in the perspective of time-frequency joint domain, while the results manifested that the common single filtering method is incapable of distinguishing these weak defect signals with the noises. Consequently, the basic principles of the Hilbert transform and filtering combined weak signal processing method was introduced. Further comparison of signal processing techniques between the traditional lowpass filtering, wavelet denoising, median filtering methods, and the proposed new method indicates that the weak signal characterizations are difficult to identify by the former methods, while the later proposed new method showed that it was effective in weak wire rope signal processing and defect identification by the obvious defect characterizations of signal peak in time domain, and the signal strength enhancement region through STFT analysis. All in all, the comparison results demonstrated the feasibility and validity of the proposed method which also has a great potential in practical application of wire rope inspection.

Author Contributions

Conceptualization, S.L. and Y.S.; methodology, S.L.; software, S.L.; validation, S.L. and Y.S.; investigation, S.L. and Y.S.; resources, S.L. and Y.S.; writing—original draft preparation, S.L.; writing—review and editing, S.L. and Y.S.; visualization, S.L.; supervision, L.H. and Y.K.; project administration, S.L. and Y.S.; funding acquisition, S.L. All authors have read and agreed to the published version of the manuscript.

Funding

This research was funded by National Natural Science Foundation of China (NNSFC), grant number 52005203, the Fundamental Research Funds for the Central Universities grant number 2662022GXQD002, and China Postdoctoral Science Foundation, grant number 2019M662600.

Institutional Review Board Statement

Not applicable.

Informed Consent Statement

Not applicable.

Data Availability Statement

The data supporting reported results are contained within this paper.

Acknowledgments

We appreciate the financial support from the National Natural Science Foundation of China, the Fundamental Research Funds for the Central Universities, and China Postdoctoral Science Foundation. We would also like to thank the valuable comments from the reviewers.

Conflicts of Interest

The authors declare no conflict of interest.

References

  1. Laura, P.A.A.; Rossit, C.A. Theory of Wire Rope. Ocean Eng. 2001, 28, 343–344. [Google Scholar] [CrossRef]
  2. Danenko, V.F.; Gurevich, L.M.; Kushkina, E.Y.; Gladskikh, E.B. New applications of compacted steel strands and wire rope. Steel Transl. 2016, 46, 757–763. [Google Scholar] [CrossRef]
  3. Torkar, M.; Arzenšek, B. Failure of crane wire rope. Eng. Fail. Anal. 2002, 9, 227–233. [Google Scholar] [CrossRef]
  4. Tijani, A.; Meknassi, M.; Chaffoui, H.; El Ghorba, M. Corrosion’s impact on wire rope strand response-Comparison with a theoretical predictive model. Frat. Ed. Integrità Strutt. 2019, 13, 141–148. [Google Scholar] [CrossRef] [Green Version]
  5. Zhang, D.; Feng, C.; Chen, K.; Wang, D.; Ni, X. Effect of broken wire on bending fatigue characteristics of wire ropes. Int. J. Fatigue 2017, 103, 456–465. [Google Scholar] [CrossRef]
  6. Weischedel, H.R.; Ramsey, R.P. Electromagnetic Testing, a Reliable Method for the Inspection of Wire Ropes in Service. NDT Int. 1989, 22, 155–161. [Google Scholar]
  7. Peng, P.-C.; Wang, C.-Y. Use of gamma rays in the inspection of steel wire ropes in suspension bridges. NDT E Int. 2015, 75, 80–86. [Google Scholar] [CrossRef]
  8. Park, J.; Kim, J.-W.; Park, S. A study on MFL based wire rope damage detection. SPIE 2017, 10168, 427–431. [Google Scholar]
  9. Ma, X.P.; Su, S.Q.; Wang, W.; Yang, Y.Y.; Yi, S.C.; Zhao, X.R. Damage location and numerical simulation for steel wire under torsion based on magnetic memory method. Int. J. Appl. Electromagn. Mech. 2019, 60, 223–246. [Google Scholar] [CrossRef]
  10. Liu, X.; Wu, B.; Qin, F.; He, C.; Han, Q. Observation of ultrasonic guided wave propagation behaviours in pre-stressed multi-wire structures. Ultrasonics 2017, 73, 196–205. [Google Scholar] [CrossRef]
  11. Raišutis, R.; Kažys, R.; Mažeika, L.; Žukauskas, E.; Samaitis, V.; Jankauskas, A. Ultrasonic guided wave-based testing technique for inspection of multi-wire rope structures. NDT E Int. 2014, 62, 40–49. [Google Scholar] [CrossRef]
  12. Ren, L.; Liu, Z.; Wang, H.; Zhou, J.; Tang, H. Eliminating Shaking Noise for Defect Detection of Steel Wire Ropes Based on Magnetic Flux Leakage Signals. In Proceedings of the 2019 IEEE 4th Advanced Information Technology, Chengdu, China, 20–22 December 2019; Volume 1, pp. 1037–1041. [Google Scholar]
  13. Kim, J.-W.; Park, S. Magnetic flux leakage–based local damage detection and quantification for steel wire rope non-destructive evaluation. J. Intell. Mater. Syst. Struct. 2018, 29, 3396–3410. [Google Scholar] [CrossRef]
  14. Jie, T.; Wang, H.Y.; Bilen, S.; Wu, X.L.; Meng, G.Y. Application of a morphological non-sampling wavelet method to the online detection signal processing of coal mine wire rope. Insight 2019, 61, 521–527. [Google Scholar] [CrossRef]
  15. Zhang, O.; Wei, X. De-noising of Magnetic Flux Leakage Signals Based on Wavelet Filtering Method. Res. Nondestruct. Eval. 2019, 30, 269–286. [Google Scholar] [CrossRef]
  16. Yan, X.; Zhang, D.; Zhao, F. Improve the signal to noise ratio and installation convenience of the inductive coil for wire rope nondestructive testing. NDT E Int. 2017, 92, 221–227. [Google Scholar] [CrossRef]
  17. Liu, S.; Sun, Y.; Ma, W.; Xie, F.; Jiang, X.; He, L.; Kang, Y. A New Signal Processing Method Based on Notch Filtering and Wavelet Denoising in Wire Rope Inspection. J. Nondestruct. Eval. 2019, 38, 39. [Google Scholar] [CrossRef]
  18. Wang, J.; Tan, J.-W.; Zhan, W.-X.; Wang, Q.-S. Signal processing of broken wire damage in steel ropes based on wavelet energy. Qingdao Ligong Daxue Xuebao J. Qingdao Technol. Univ. 2012, 33, 65–69. [Google Scholar]
  19. Rostami, J.; Tse, P.W.; Yuan, M. Detection of broken wires in elevator wire ropes with ultrasonic guided waves and tone-burst wavelet. Struct. Health Monit. 2020, 19, 481–494. [Google Scholar] [CrossRef]
  20. Zhang, J.; Lu, S.; Gao, T. Quantitative Detection of Remanence in Broken Wire Rope Based on Adaptive Filtering and Elman Neural Network. J. Fail. Anal. Prev. 2019, 19, 1264–1274. [Google Scholar] [CrossRef]
  21. Zhang, J.W.; Zheng, P.B.; Tan, X.J. Recognition of Broken Wire Rope Based on Remanence using EEMD and Wavelet Methods. Sensors 2018, 18, 1110. [Google Scholar] [CrossRef] [Green Version]
  22. Henao, H.; Fatemi, S.M.J.R.; Capolino, G.-A.; Sieg-Zieba, S. Wire Rope Fault Detection in a Hoisting Winch System by Motor Torque and Current Signature Analysis. IEEE Trans. Ind. Electron. 2011, 58, 1727–1736. [Google Scholar] [CrossRef]
  23. Wacker, E.-S.; Denzler, J. Enhanced anomaly detection in wire ropes by combining structure and appearance. Pattern Recognit. Lett. 2013, 34, 942–953. [Google Scholar] [CrossRef] [Green Version]
  24. Kaur, D.; Arora, R.; Chhabra, S.; Sharma, S. Characterization of LF and LMA signal of wire rope tester. Int. J. Adv. Res. Comput. Sci. 2017, 8, 1395–1400. [Google Scholar]
  25. Zhou, Z.; Liu, Z. Fault Diagnosis of Steel Wire Ropes Based on Magnetic Flux Leakage Imaging under Strong Shaking and Strand Noises. IEEE Trans. Ind. Electron. 2020, 68, 2543–2553. [Google Scholar] [CrossRef]
  26. Čereška, A.; Zavadskas, E.K.; Bucinskas, V.; Podvezko, V.; Sutinys, E. Analysis of Steel Wire Rope Diagnostic Data Applying Multi-Criteria Methods. Appl. Sci. Basel 2018, 8, 260. [Google Scholar] [CrossRef] [Green Version]
  27. Li, L.-J.; Zhang, X.-G. Discrimination method of wire rope fault signal based on Holzer sensor for multi array weak magnetic detection. Clust. Comput. 2019, 22, 4901–4906. [Google Scholar] [CrossRef]
  28. Zhou, P.; Zhou, G.; Zhu, Z.; Tang, C.; He, Z.; Li, W.; Jiang, F. Health Monitoring for Balancing Tail Ropes of a Hoisting System Using a Convolutional Neural Network. Appl. Sci.-Basel 2018, 8, 1346. [Google Scholar] [CrossRef] [Green Version]
  29. Kim, J.W.; Park, S.; Ju-Won, K.; Seunghee, P. Magnetic Flux Leakage Sensing and Artificial Neural Network Pattern Recognition-Based Automated Damage Detection and Quantification for Wire Rope Non-Destructive Evaluation. Sensors 2018, 18, 109. [Google Scholar] [CrossRef] [Green Version]
  30. Pu, H.; Xie, X.; Jia, S.; Liang, G. Research on Detection for Broken Wires in Non-rotating Rope Base on SVM. In Proceedings of the 2010 International Conference on Electrical and Control Engineering, Wuhan, China, 25–27 June 2010; pp. 1664–1667. [Google Scholar]
  31. Li, J.; Zhang, J. Quantitative Nondestructive Testing of Wire Rope Using Image Super-Resolution Method and AdaBoost Classifier. Shock. Vib. 2019, 2019, 1683494. [Google Scholar] [CrossRef] [Green Version]
  32. Huang, X.; Liu, Z.; Zhang, X.; Kang, J.; Zhang, M.; Guo, Y. Surface damage detection for steel wire ropes using deep learning and computer vision techniques. Measurement 2020, 161, 107843. [Google Scholar] [CrossRef]
Figure 1. Experimental samples and apparatus. (a) Different steel wire ropes; (b) MFL detector.
Applsci 12 06969 g001
Figure 2. Weak signals of steel wire rope with different defects and liftoff distances. (a) Signal 1 of one-wire broken defect from sample 1 with liftoff distance of 13 mm; (b) Signal 2 of three-wire broken defect from sample 1 with liftoff distance of 13 mm; (c) Defect signal 3 from sample 2 with liftoff distance of 13 mm and coil sensor; (d) Defect signal 4 from sample 3 with liftoff distance of 13 mm; (e) Defect signal 5 from sample 3 with liftoff distance of 20 mm; (f) Defect signal 6 from sample 2 with liftoff distance of 20 mm and coil sensor. The signals 1, 2, 4, and 5 are detected with the sensor of the inductive transducer, while signals 3 and 6 are tested with copper coils.
Applsci 12 06969 g002
Figure 3. STFT of different weak signals. (a) STFT of signal 1; (b) STFT of signal 2; (c) STFT of signal 3; (d) STFT of signal 4; (e) STFT of signal 5; (f) STFT of signal 6.
Applsci 12 06969 g003
Figure 4. Flow diagram of the proposed algorithm and procedure. f and K are threshold values of the frequency and SNR.
Applsci 12 06969 g004
Figure 5. Weak signals processed by lowpass filtering and wavelet denoising. (a) Lowpass, FFT spectrum and wavelet denoising of wire rope signal S1. (b) Lowpass, FFT spectrum and wavelet denoising of wire rope signal S2. (c) Lowpass, FFT spectrum and wavelet denoising of wire rope signal S3.
Applsci 12 06969 g005aApplsci 12 06969 g005b
Figure 6. Weak signals processed by median filter. The original weak signals of 1 to 3 correspond with the testing signals of S1 to S3 in Figure 5.
Applsci 12 06969 g006
Figure 7. Weak signals processed by moving average method. The original weak signals of 1 to 3 correspond with the testing signals of S1 to S3 in Figure 5.
Applsci 12 06969 g007
Figure 8. Different weak signals processed by HHT and lowpass filtering method. (a) HHT and lowpass filtering method for wire rope signal S1; (b) HHT and lowpass filtering method for wire rope signal S2; (c) HHT and lowpass filtering method for wire rope signal S3.
Applsci 12 06969 g008aApplsci 12 06969 g008bApplsci 12 06969 g008c
Figure 9. Signals processed by different averaging methods.
Applsci 12 06969 g009
Figure 10. Signals processed by different moving average spans.
Applsci 12 06969 g010
Figure 11. STFT analysis of the different processed signals. (a) STFT of HHT processed signal S1; (b) STFT of HHT processed signal S2; (c) STFT of HHT processed signal S3; (d) STFT of smoothing processed signal S1; (e) STFT of smoothing processed signal S2; (f) STFT of smoothing processed signal S3.
Applsci 12 06969 g011
Table 1. SNR (dB) results by different signal processing techniques.
MethodLP-WAMedianWienerProposed Method
Signal HHTLPMA
S143.774245.904032.18871.825623.626380.6473
S245.994245.944032.16420.841524.478390.3688
S340.850245.655231.96751.199723.908179.1788
Publisher’s Note: MDPI stays neutral with regard to jurisdictional claims in published maps and institutional affiliations.

