1. Introduction
The city of Szczecin, Poland, was chosen for this research. It is a port city that plays an important role as a transport and communication center. It was designed to facilitate, and still serves, the development of a maritime economy.
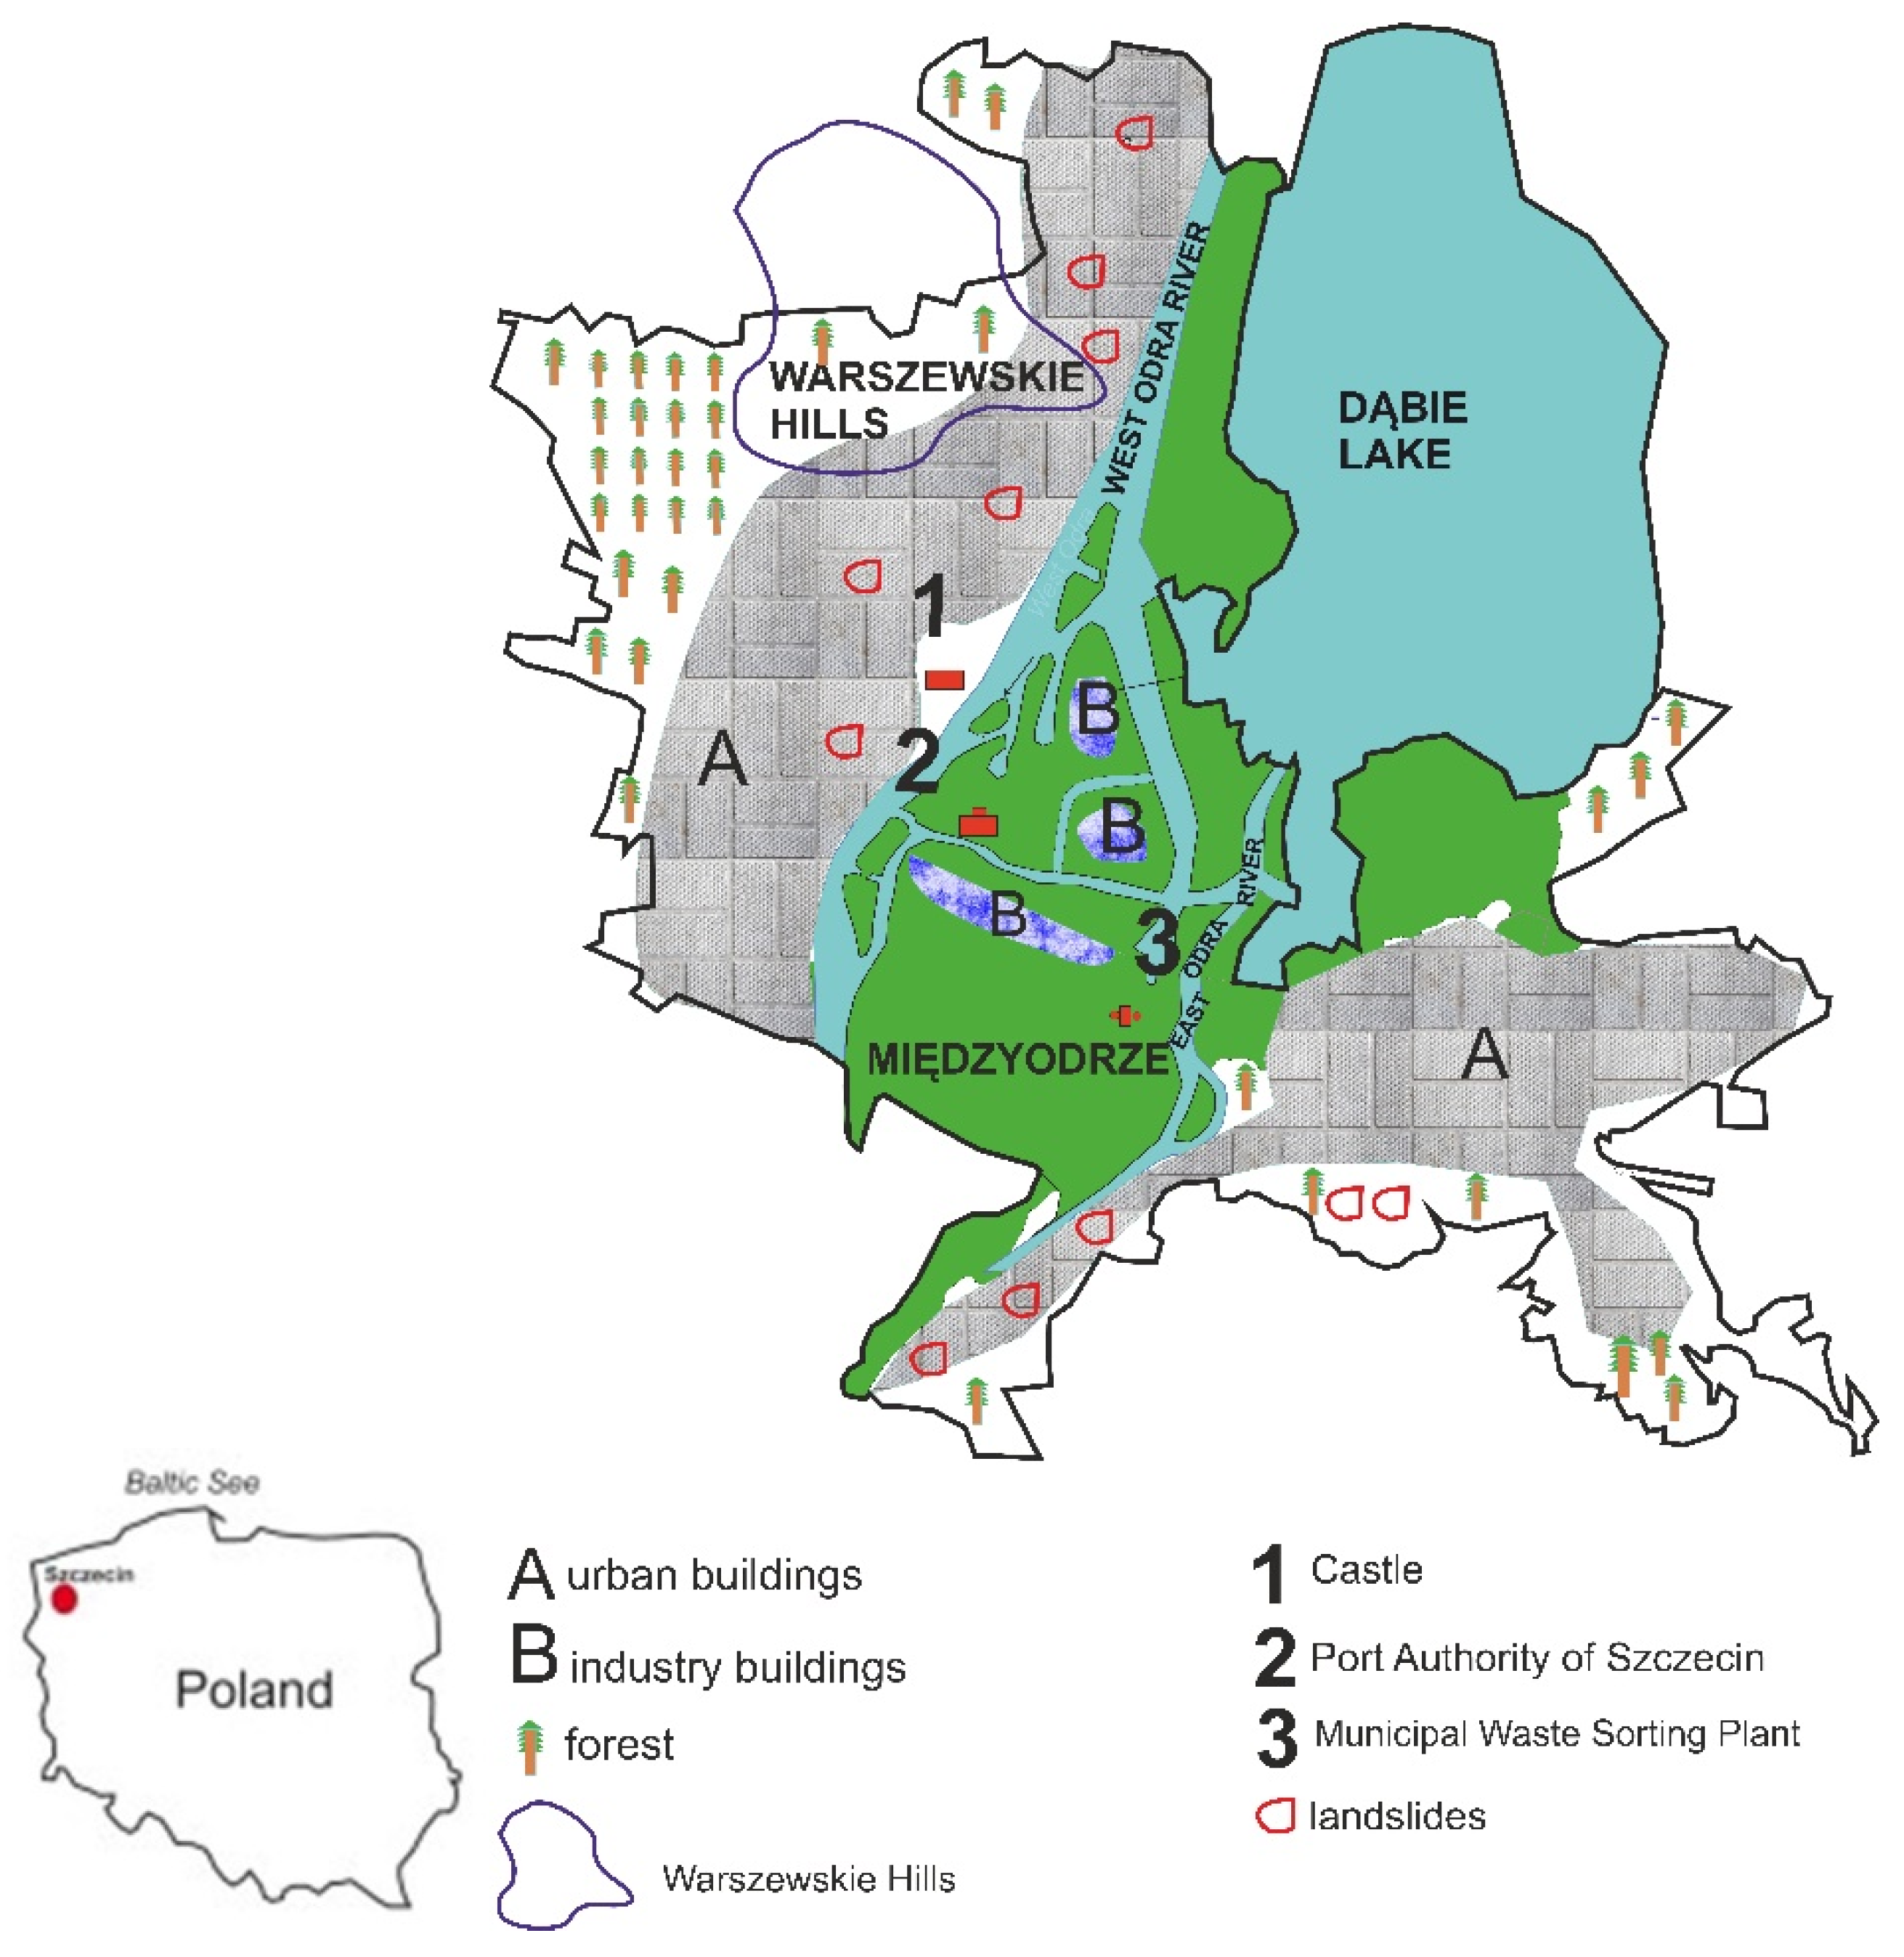
The conditions of the geological land structure are important here. Although the distance from the sea is approximately 60 km, the city serves as a high-ranking seaport. The crossing of waterways and inland roads favors the development of Szczecin as a large industrial center. The main industrial facilities close to the water areas are: shipyards; harbor berths; and harbor loading, storage, and administrative facilities. Examples of individual facilities include the Municipal Waste Sorting Plant and the Port Authority of Szczecin building (see
Figure 1). Most of these constructions are located in the area of the Międzyodrze islands (Łasztownia, Grodzka, Ostrów Grabowski, and Ostrów Mieleński) (
Figure 1 and
Figure 2).
The implementation of an appropriate control and measurement system (
Table 1) has been assumed as necessary for the reliable monitoring of deformation of the existing and planned engineering structures in the Szczecin area.
Similar GNSS-based systems have been successfully implemented in 3D deformation studies of several significant engineering objects and geodynamic polygons [
1,
2,
3]. Other systems used Interferometry Synthetic Aperture Radar (InSAR) [
4,
5] or satellite altimetry to monitor regional vertical motions [
6]. In [
5], it was demonstrated that, through the use of an advanced InSAR technique (the APSIS™ Intermittent Small Baseline Subset technique), the near-complete coverage of ground motion measurements is possible, despite intermittent snow cover. However, the underlying geological structure was not taken into account in these systems, nor was the methodology used, causing the field work involved in an additional levelling survey to be labor-intensive, time-consuming, and expensive, with the final accuracy of measurements degraded.
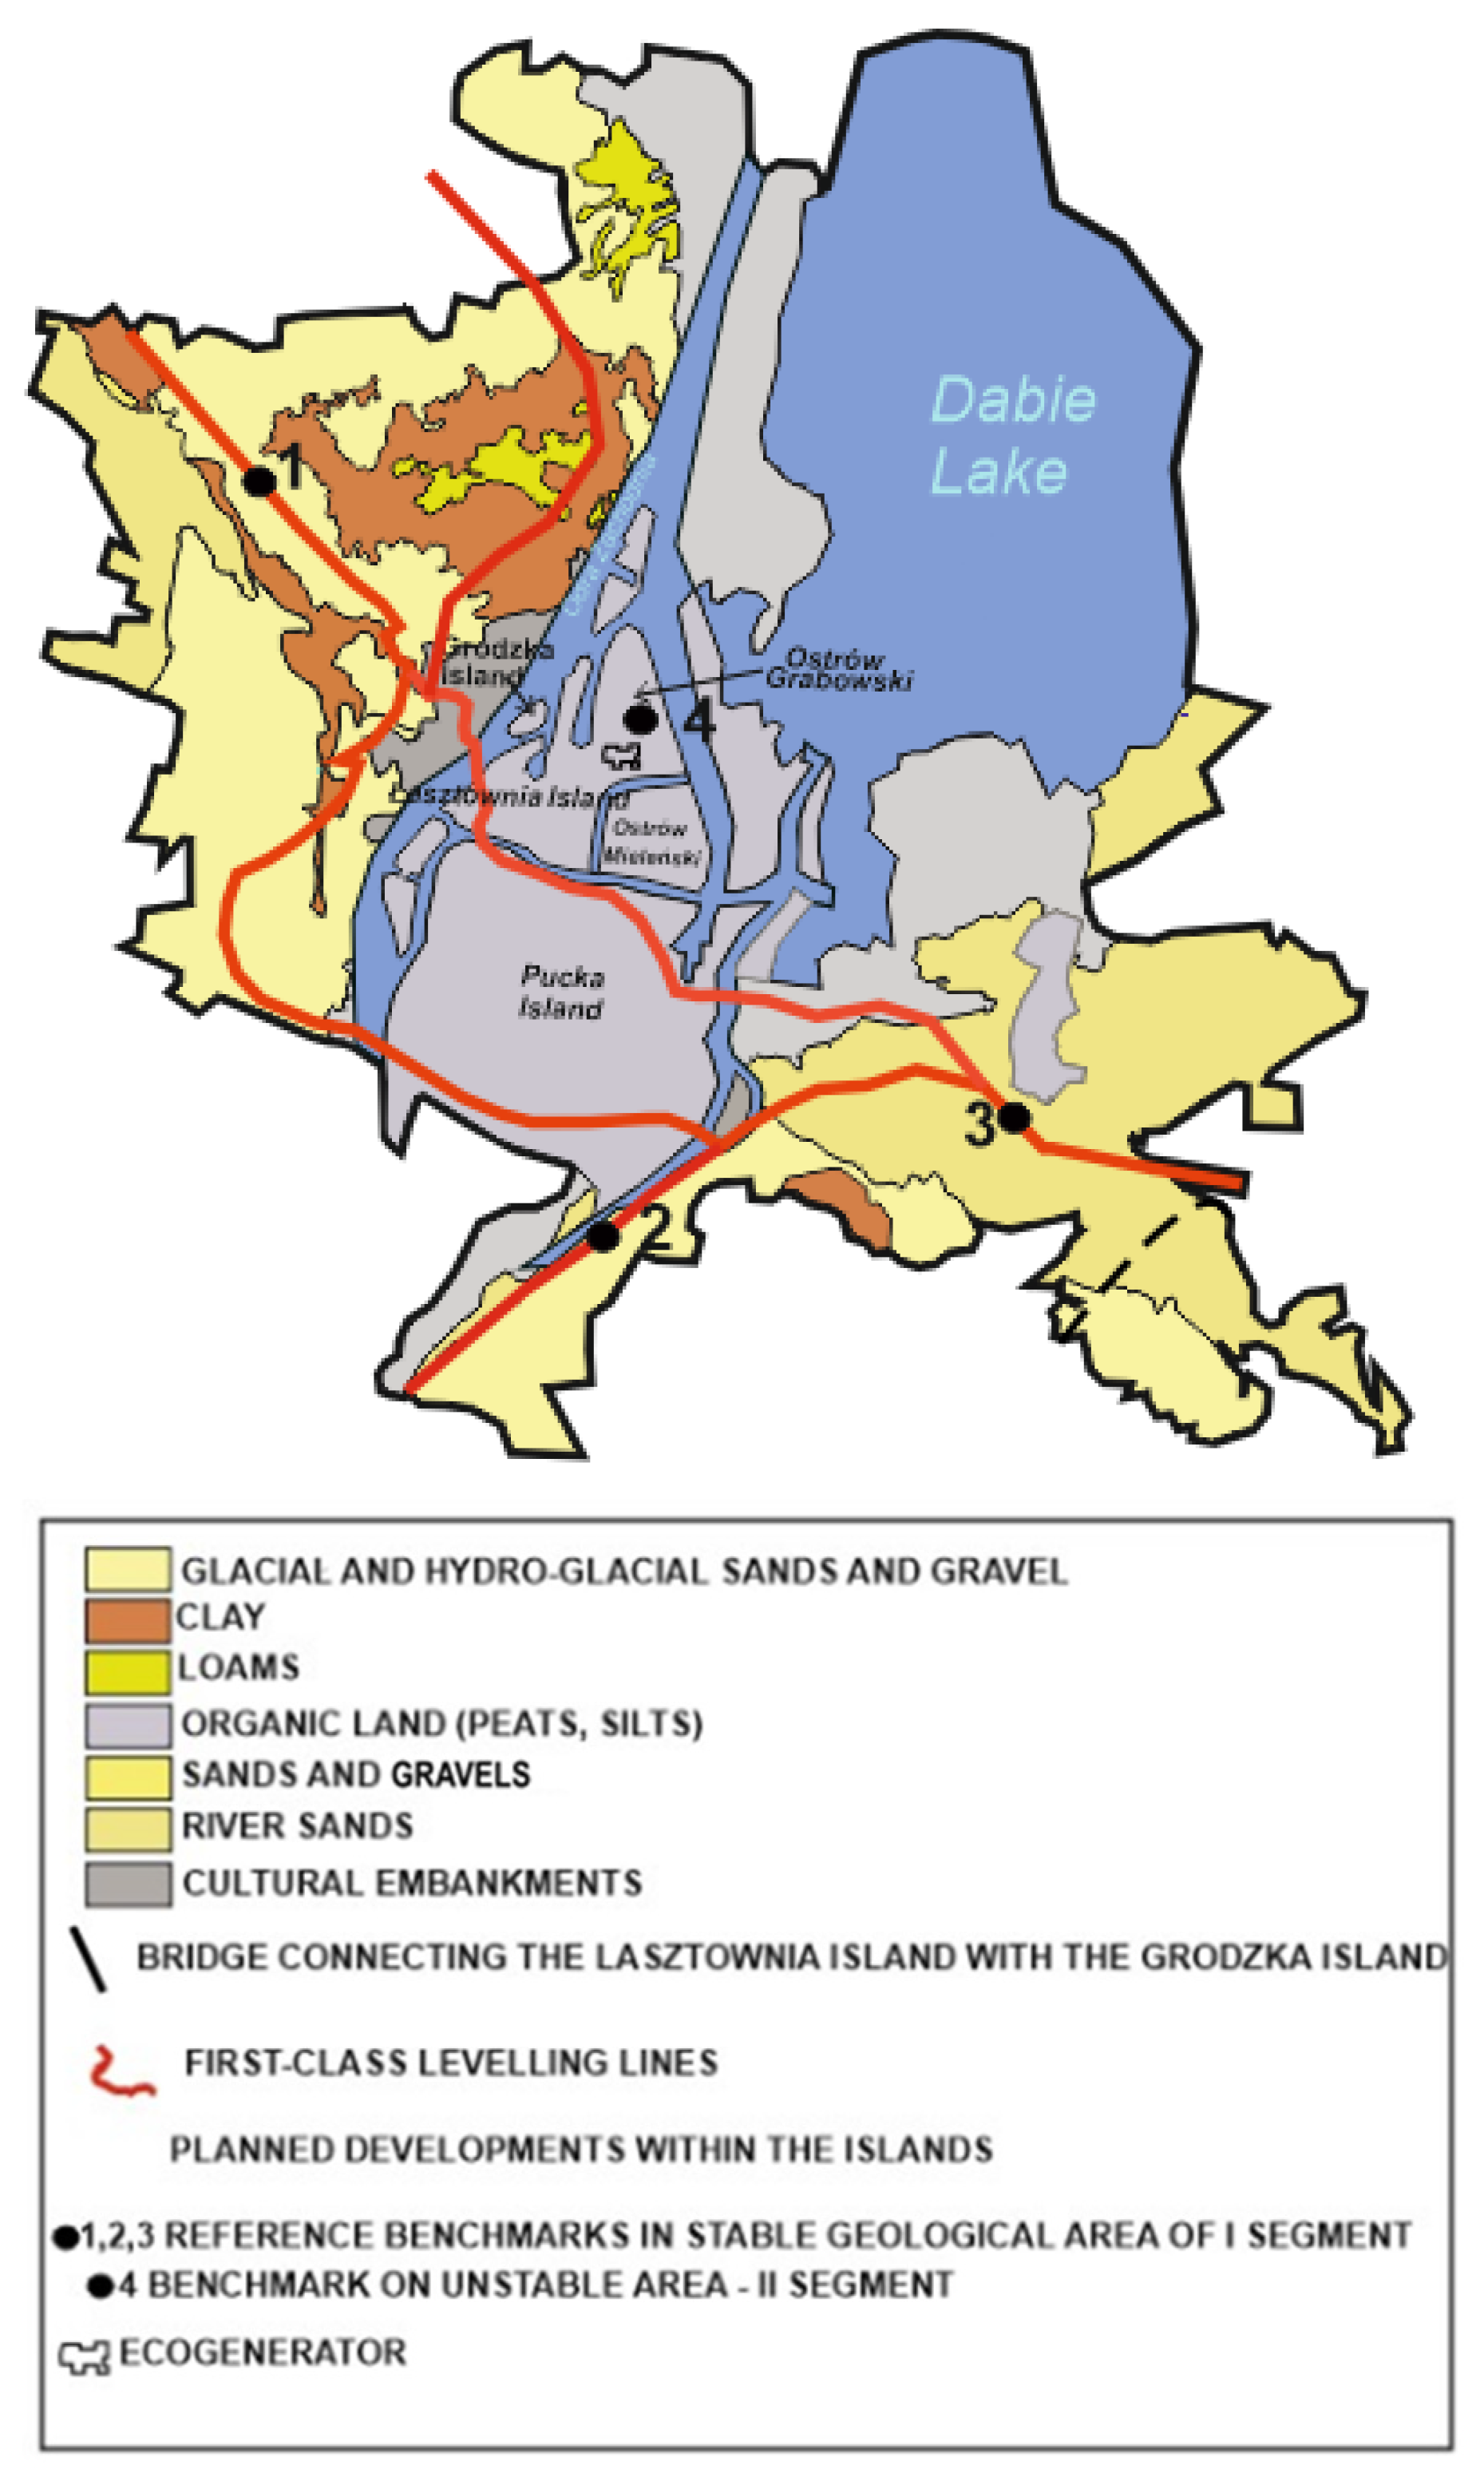
At the beginning of our research, stable reference points (benchmarks situated outside areas of the islands on geologically stable formations, such as sand) were localized in a 3D space as the as the first and second segment of the system (
Figure 2. The analysis of the levelling lines of the 1st and 2nd class geodetic accuracy made it possible to select one more reference point for the 1st segment of the control and measurement system (
Figure 3). This made it possible to carry out observations of the surface movements of organic sediments of the Szczecin islands area in a 3D space [
2] using GNSS satellite observations. Detailed recognition of geological structure [
7] of subsoil in the vicinity of these points was helpful for the precise localization of stable reference benchmarks (1 and 3). Reports on the implementation of these works are included in
Section 4 of this paper. The EcoGenerator was chosen as an example object to install a second segment of the control and measurement system.
The innovation of research consisted of the integration of various observation techniques into one control and measurement system; the selection of the techniques and segments of the system depended on the geological structure of the subsoil in a given region.
2. Characteristics of Geological Structure of Szczecin
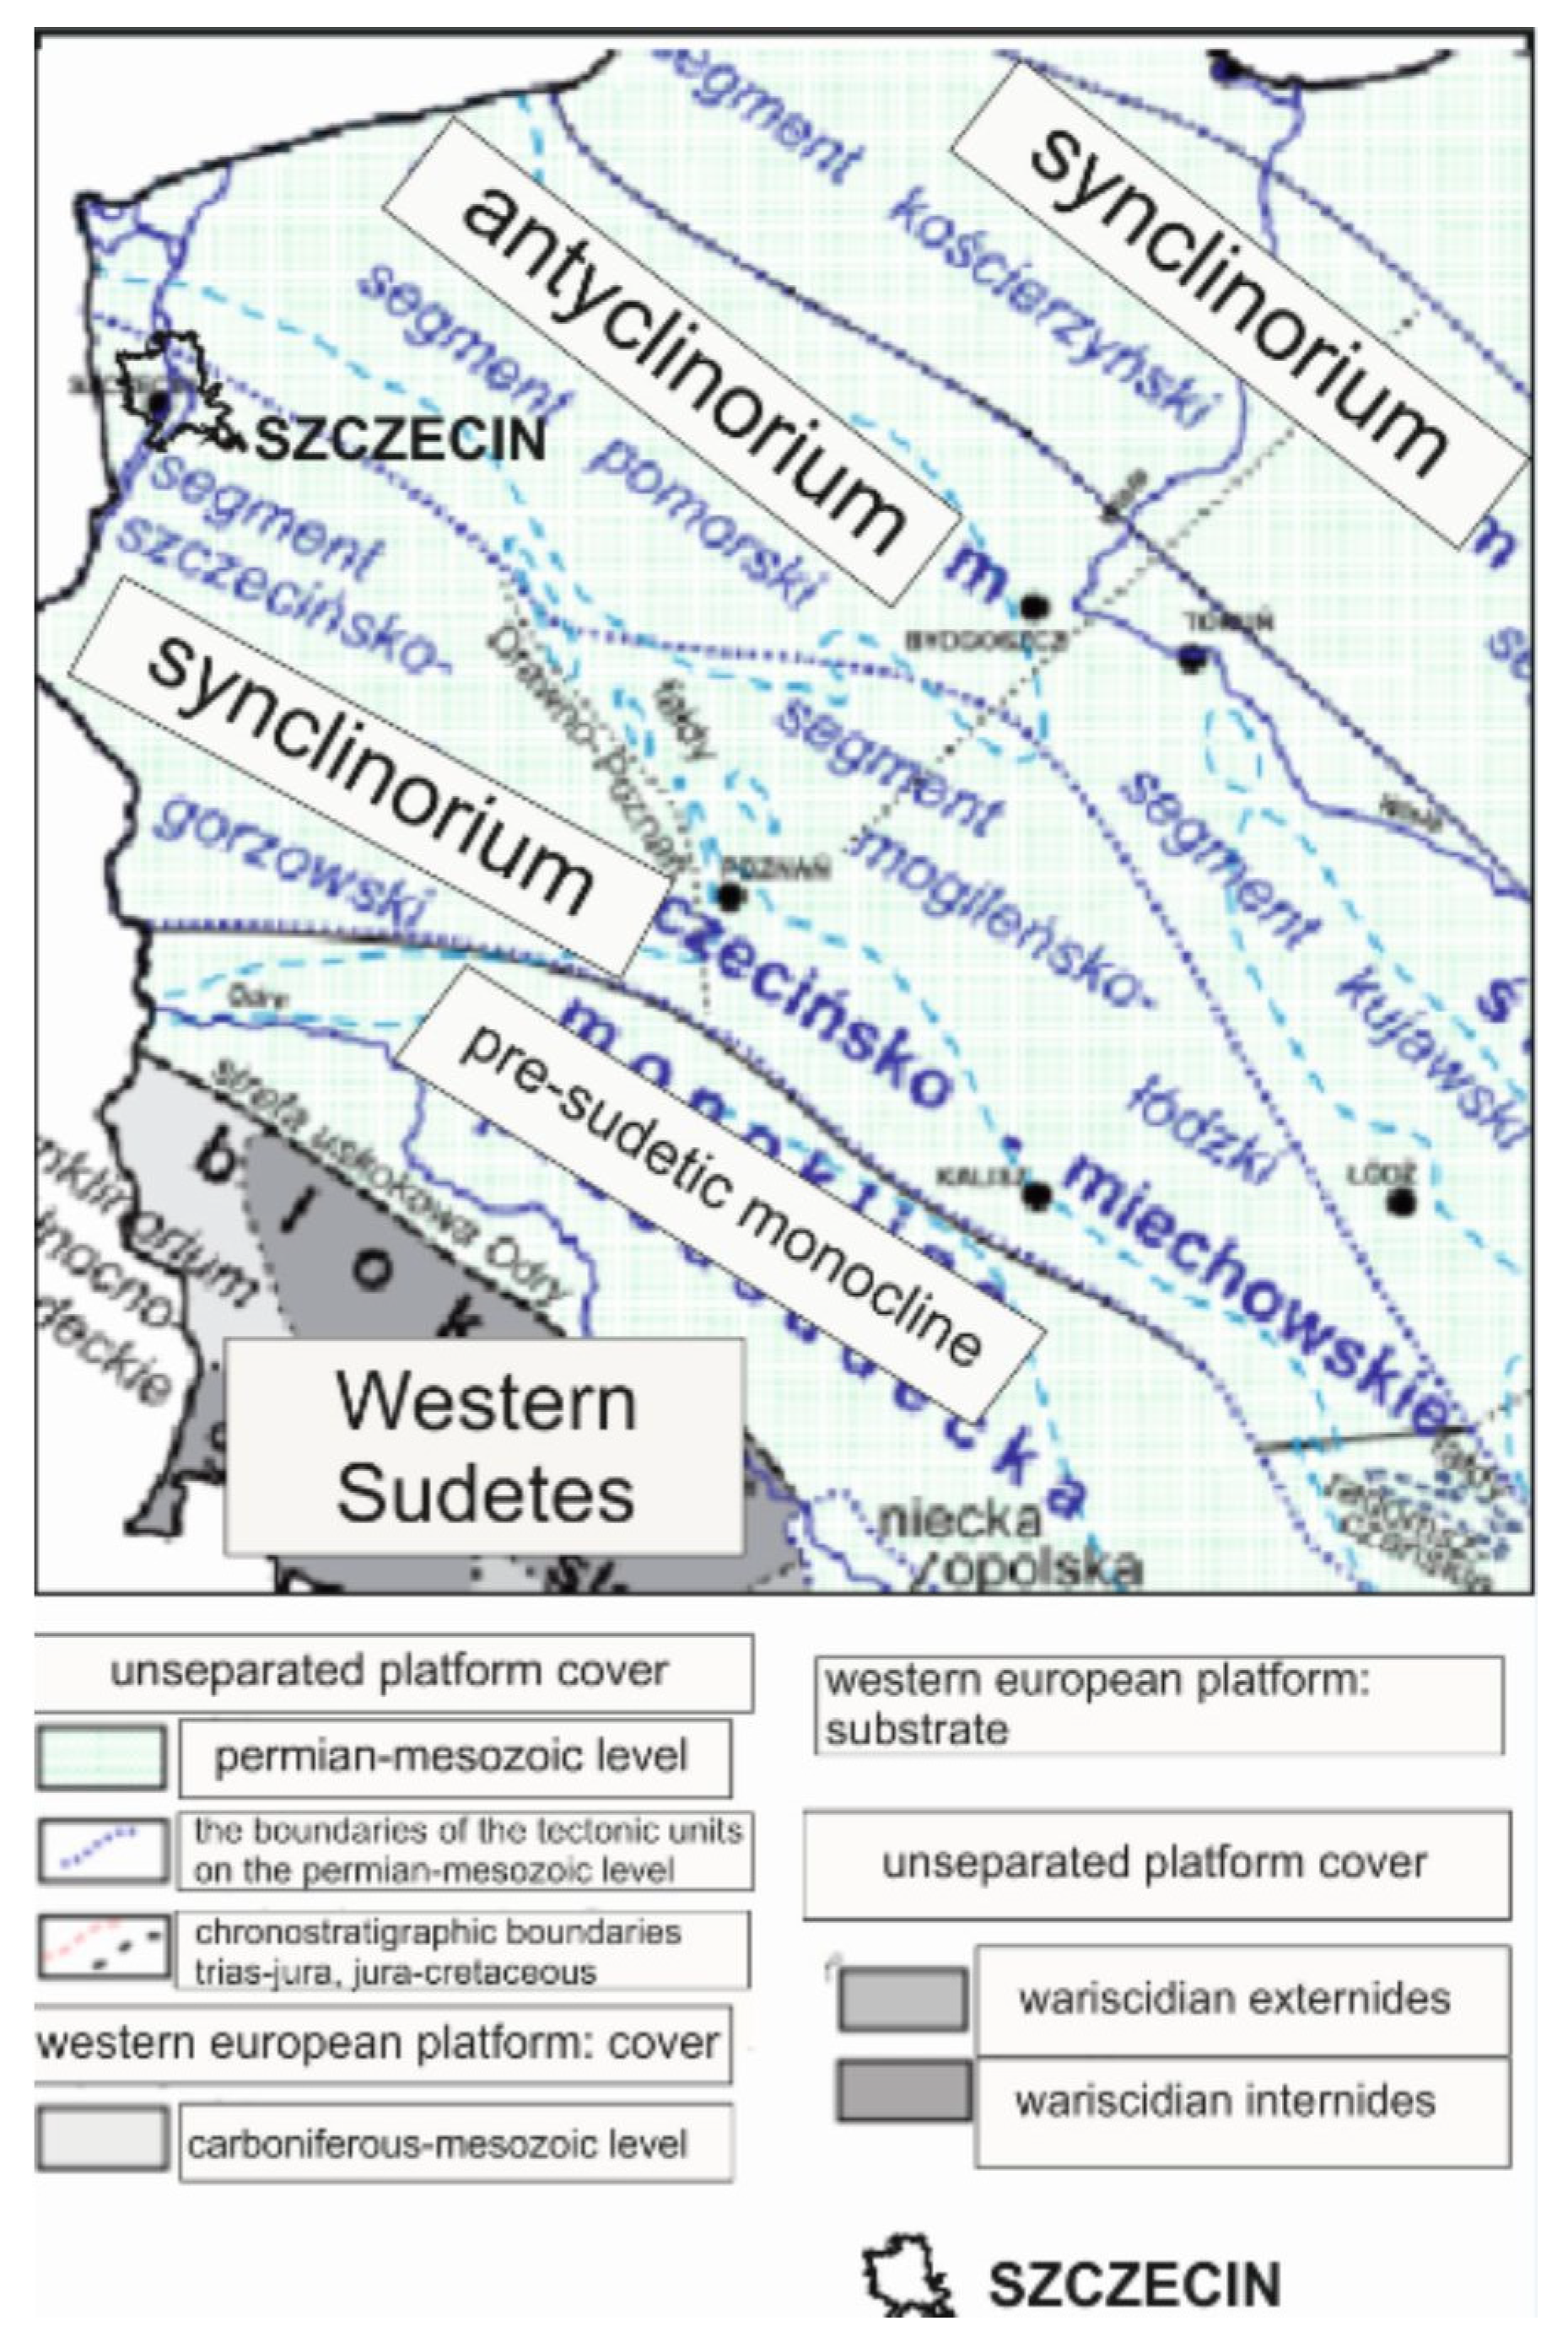
A fragment of the tectonic map of Poland presents an area of Szczecin (
Figure 2), which is located within the Szczecin city synclinorium. From the south, it borders on the pre-sudetic monocline, and from the north it borders on the Central Poland antyclinorium [
7].
The location of Szczecin and its surroundings against the background of the main structural units of Poland is described in [
7]. The geological structure of Szczecin [
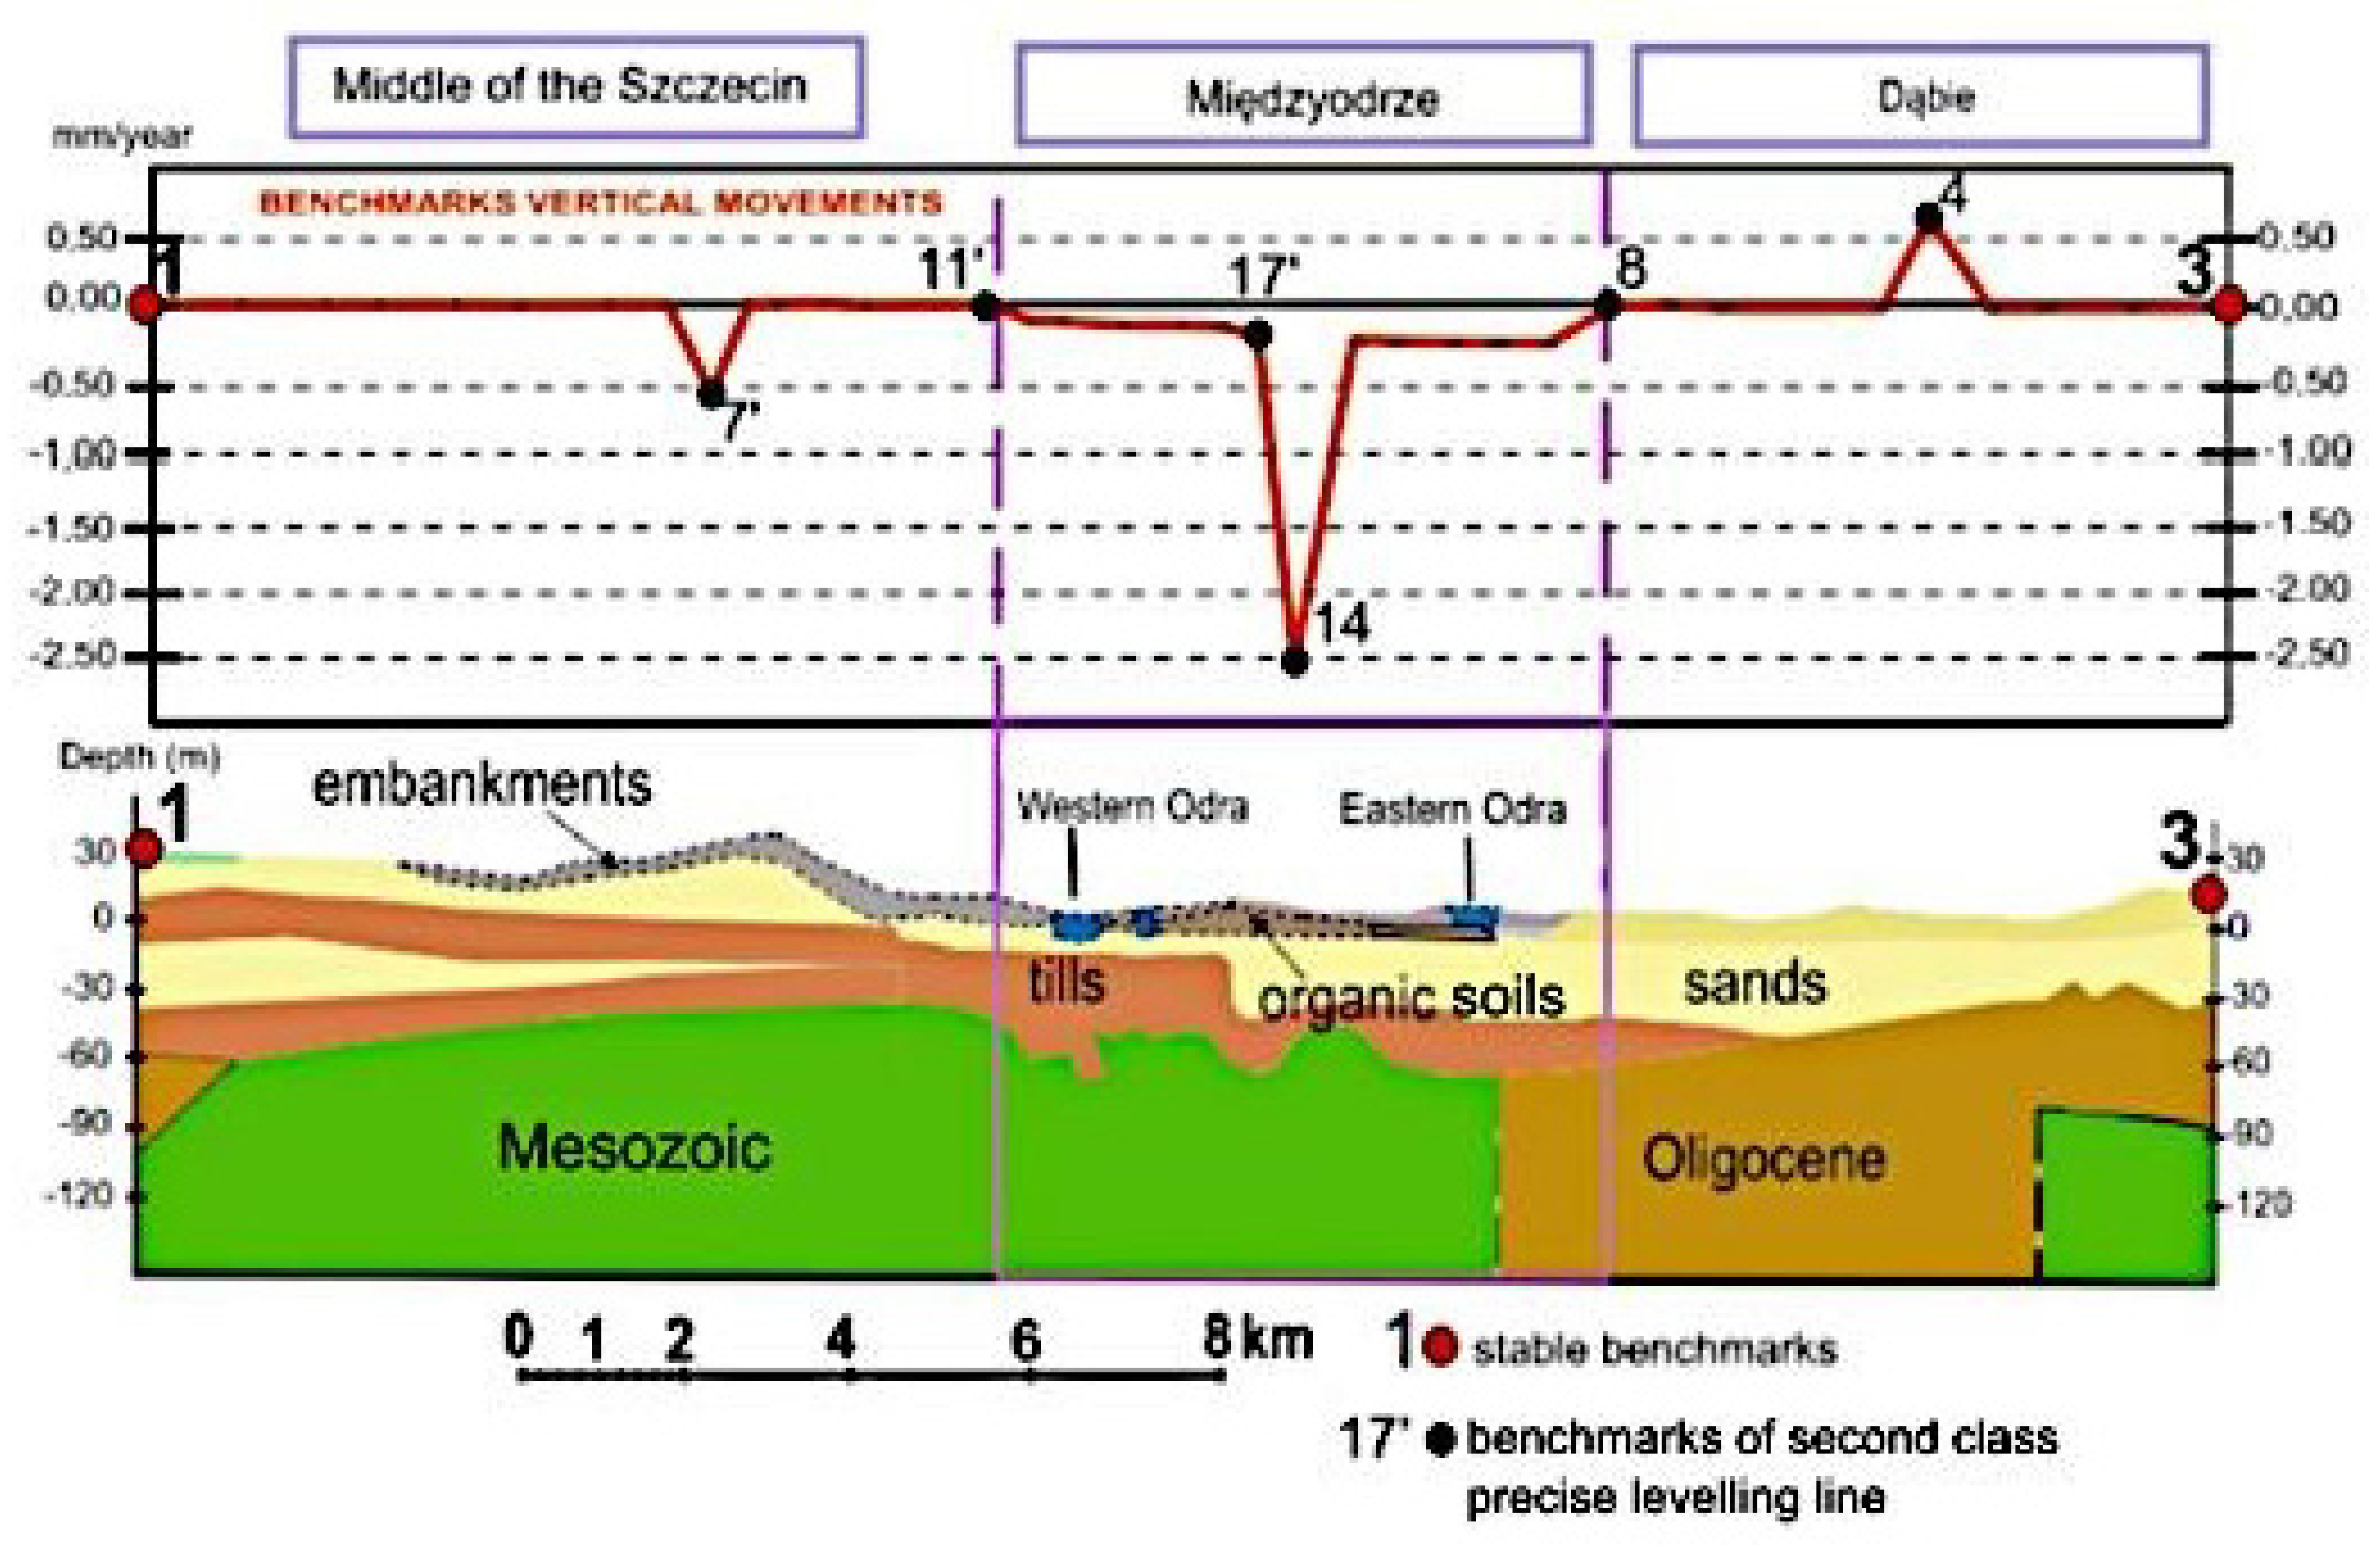
8], together with a cross-section, is shown in
Figure 3.
Salt movements in the deeper Permian and Triassic formations (claystones, siltstones, and limestones) result in the formation of numerous fault-cutting fractures within them. The formations of the Upper Cretaceous lie in the bottom of a depression stretching south from Szczecin. They are formed from clay marls, chalks, opacities, and marly limestones [
8] from Turonian and Cenomanian. Within the Cenozoic, older Oligocene and younger Neogene formations can be distinguished (
Figure 3 and
Figure 4). The Oligocene is developed in the form of septarian clays (
Figure 3 and
Figure 4) [
7]. The thickness of these formations is 12 m, as recognized from numerous boreholes [
7]. The Pleistocene is represented by till. The Holocene is represented by sands and organic soils (peats, silts, and gyttjas) (
Figure 3 and
Figure 4).
The area of Międzyodrze is a narrow strip of the Odra valley, adjacent to the Odra riverbed in the west, comprising among others the Odra River Boulevards, which stretch from the Szczecin Main Railway Station, Kolumba Street, to Sw. Ducha and Podzamcze Streets. These are areas of very dense infrastructure of old buildings, some dating from the Middle Ages. The depth of organic soils in this zone reaches 18 m above sea level. These sediments are under the load of uncontrolled embankments, with a thickness of up to 11.4 m. The embankment consists of sands overlain by silt and humus, along with brick, rubble, wood, and shell fragments. Generally, the ground surface remains 1.5–2 m above sea level. There is intensive heavy traffic on the transportation route, with transportation vibrations, causing the embankment to be in an unsatisfactory technical condition. The bedding sands, which are Holocene sands of fluvial origin, are of medium density.
Ground waters are under pressure both in the embankments themselves, where the pressure is caused by layer of peats, silts, and clays, and by layers of organic soils (peats, and silts) dominating the geological profile. Investigations on the riverbed show that loose soil occurs to considerable depths (15.0–18.5 m). Below, medium-compacted water-glacial sands with gravel admixture occur.
Locally, organic soils vary in type and thickness. The Grodzka Island, the Port Authority area, and the Mining Basin area serve as examples. Grodzka Island is covered by an embankment of variable thickness, ranging from 1.4 m to 3.0 m. Organic soils in the western part consist of 8.8 m thick peats, while in the eastern part 2.0 m thick peats are underlain by 7.0 m thick silts.
The upland area differs in terms of the style of geological structure. The upland in the center of Szczecin has a regular geological structure, unlike the Warszewskie Hills (
Figure 1), which were disturbed by ice sheets.
The upland of Szczecin city center generally has an even surface, rising from 20 to 35 m above sea level. Stable areas of this upland are mainly in the region of the port gate and the castle. The geological profiles of this area are dominated by thick layers of glacial till underneath an overburden of 5.0- to 7.0 m-thick embankments. Only in places with large slopes, such as the northern escarpment of the Pomeranian Dukes’ Castle, are the grounds unstable; embankments build an escarpment with a relative height of 12.0 m. Tree roots act as anchors, reducing the moisture content, which promotes the stability of the escarpment. The recent construction disaster in the northern wing of the Pomeranian Dukes’ Castle (
Figure 1) was probably due to the disturbance of the former infrastructure (old sewage system and shelters) during construction work. West of the discussed stable area, already in close vicinity to the port gate, Zwycięstwa Square, and Turzyn, are areas with a downward tendency. In geological profiles, marshy sediments are locally detectable, and the area is characterized by shallow groundwater occurrence. The encroachment of multi-storey buildings in the area, and the related development of water supply and sewage infrastructure, has resulted in the lowering of ground waters.
The Warszewskie Hills, as mentioned earlier, have a complicated arrangement of layers and a very diversified lithology. The 19th century saw the development of a dense drainage network in the countryside. In recent decades, the intensive urbanization of these areas has contributed to groundwater balance and thus surface stability. Particularly in the edge zones of this upland, downward trends have become evident, which is explained by the revival of slow mass movements. The area between the Downtown Upland and Warszewskie Hills is a meltwater valley running latitudinally, the so-called “Niebuszewo Through”. The outlet of this through towards the Odra valley is the Szczecin Shipyard area. In the geological profile of this area, under thick embankments, there are peats, the bottom of which is 18.0 m below sea level.
3. Materials and Methods
The proposed method consists of the analysis of speed of altitude changes in Class I and II precision levelling sequences from the Szczecin area. It is connected with an analysis of the city’s geological structure. This makes it possible to identify stable and unstable areas. The analysis of the velocity of the change in height of benchmarks (accuracy of 2 mm/km) was used in the design of the 1st segment of the system. A third stable point made it possible to carry out studies of surface deformations in areas built of organic sediments and engineering objects also in the 3D space with the use of GNSS satellite technology [
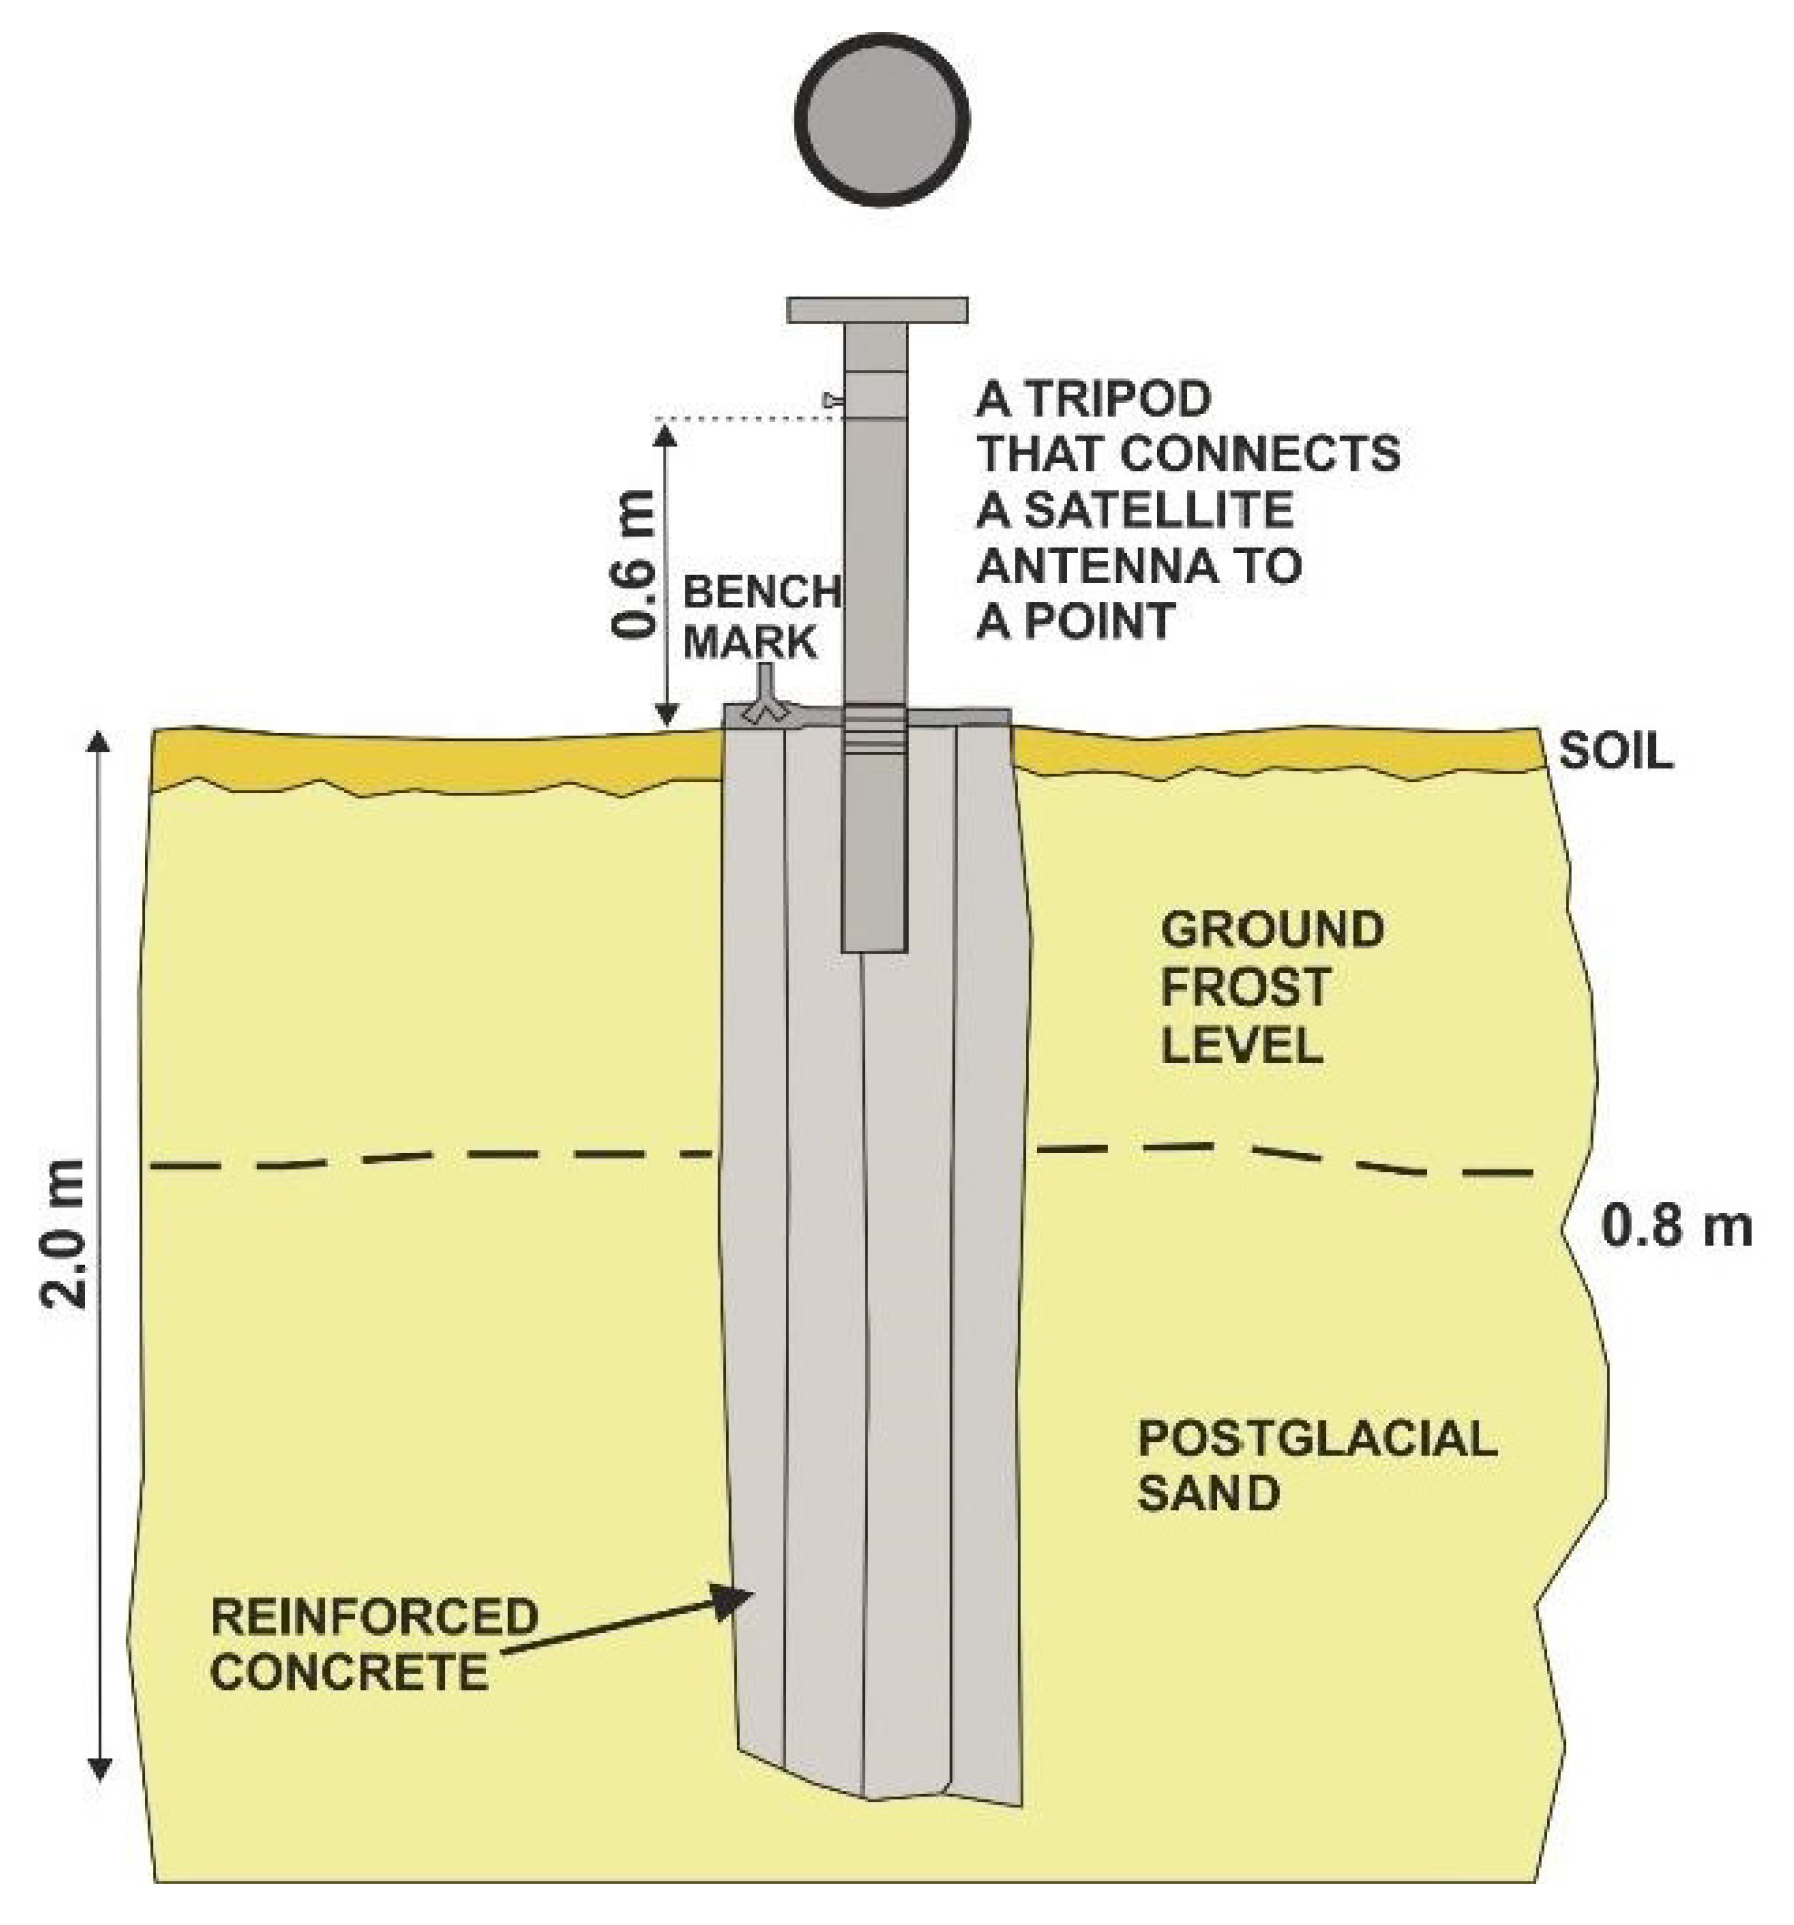
9]. Stands designed for GNSS-GPS satellite observations of the deformation of the EcoGenerator [
10] site area were located in the direct vicinity of stable benchmarks (
Figure 2). These stations consisted of sockets concreted to a depth of 30 cm, next to which benchmarks were located. In order to determine the height of benchmarks at these positions, precise levelling was performed from benchmarks 1, 2, and 3. The appearance of the station’s mounting is presented in
Figure 5.
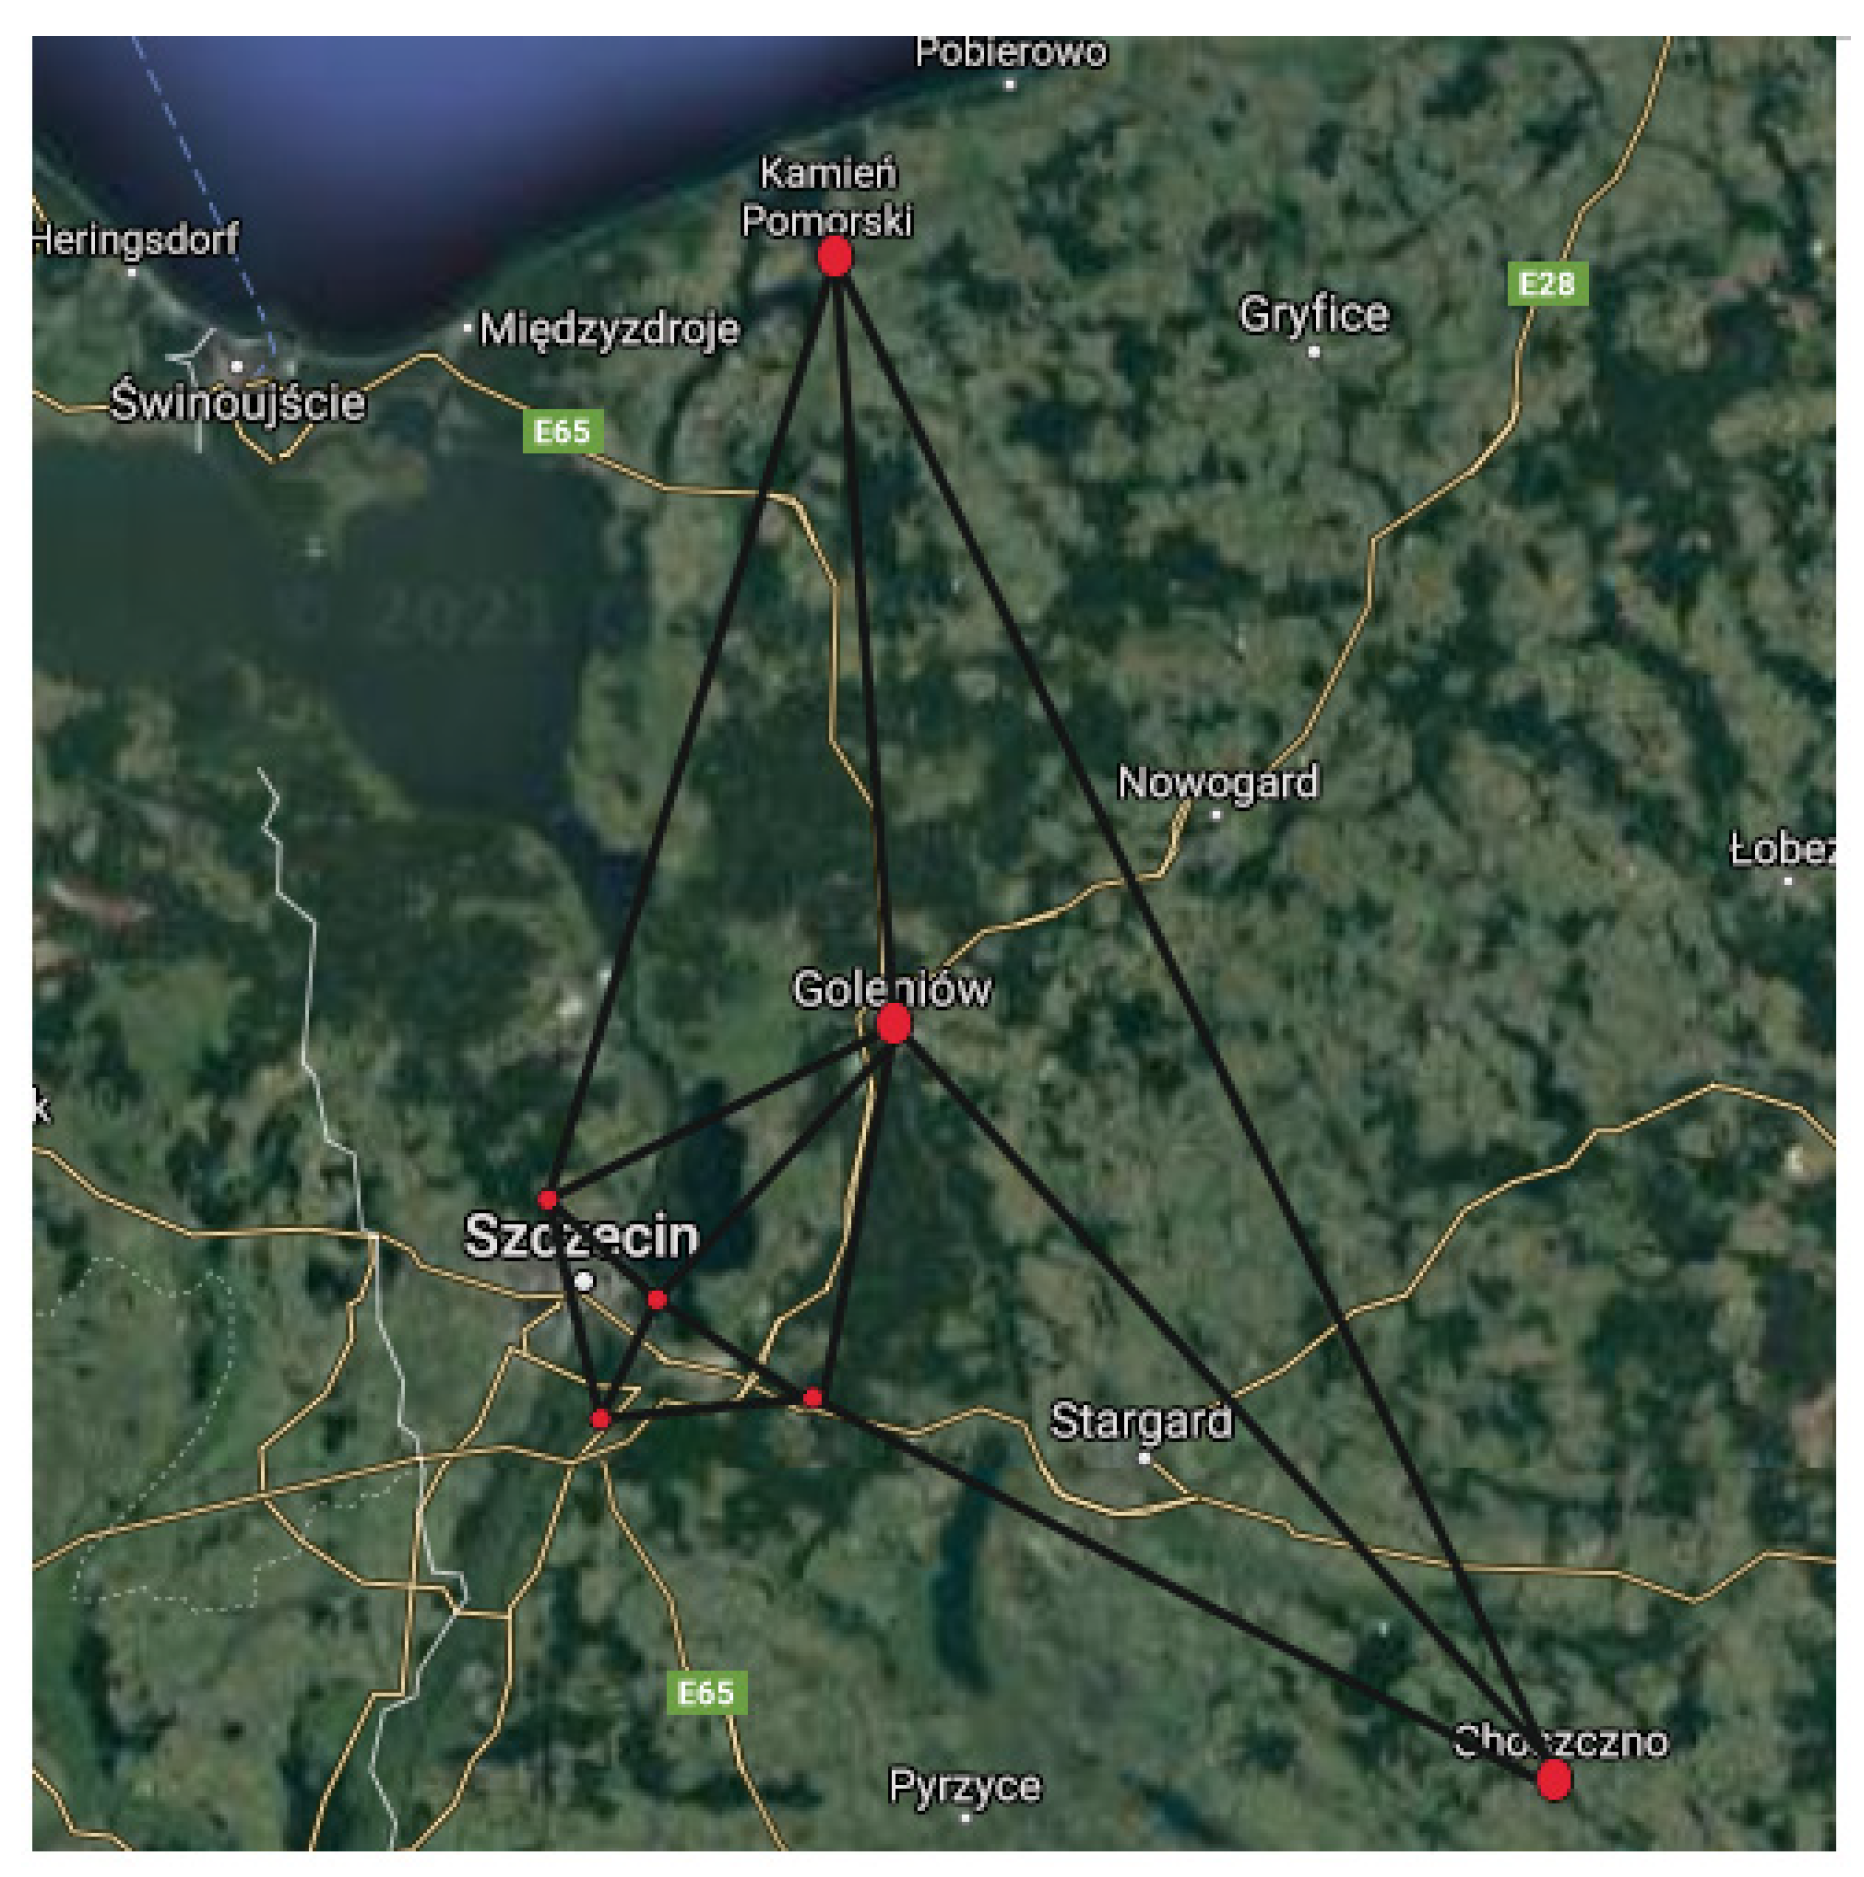
Satellite surveys at these positions were carried out in November 2020. The survey lasted 6 h. Satellite observations were corrected to the 3 nearest reference stations in Goleniów, Choszczno and Kamień Pomorski (
Figure 6).
Comparison of the heights obtained with the use of precise levelling (October 2020) to the heights of stations obtained with the use of satellite levelling was made in order to determine the deviations of 4 points in relation to stable benchmarks (
Table 2). Further analysis of the measurements from satellite observations allowed us to determine whether stable benchmarks can replace reference stations in terms of the accuracy of alignment of measurements at 2, 4, and 6 h intervals.
4. Results
The analysis evaluated the speed of the benchmarks’ height change corresponding to the geological structure of the Szczecin area, as shown in
Figure 5. The analysis was conducted using the formula:
- -
RMSE average variation in excess,
mΔhi—RMSE of the i-th overrun;
mrΔhi—RMSE i-th difference in elevation.
- -
The speed at which the altitude changes,
Vn,n+1—Speed of changes in altitude of benchmarks in the period between n and n + 1;
ΔHn,n+1—The difference in the height of benchmarks between epochs;
Tn—Year of the measurement epoch n;
Tn+1—Year of the measurement epoch n + 1.
- -
RMSE of speed of altitude changes,
m0—RMSE of altitude change over a distance of 1 km;
mVn,n+1—RMSE of speed of altitude changes;
Ri—Distance of the i-th benchmark to the reference benchmark;
Tn—period of the measurement epoch n;
Tn+1—period of the measurement epoch n + 1.
Values of velocities benchmarks height are from −0.13 mm/year to −0.18 mm/year. Benchmark numbered 14 in the
Figure 3 show a significant value (−2.52 mm/year). This is the result of increased ground weight in the area of the extended harbor quay. Lower velocities of changes in the altitude of benchmarks can be noticed in their RMSE limits [
11] (
Figure 3).
The velocity values of changes in the height of benchmarks from the area of Międzyodrze are higher in comparison with those in other parts of the city. This underlines the unstable geological structure of this area. The software Trimble Business Centre [
12] was used to process baselines between the observation stations and the nearest reference stations, as shown in
Figure 6.
The height of benchmarks obtained from the precise levelling and GNSS satellite measurements are summarized in
Table 2. The height of benchmarks located in the immediate vicinity of the measurement positions, obtained using precise levelling, were converted to the EVRF 2007 system [
13,
14]. They are compared with heights from the GNSS measurements.
The stability of the benchmarks was confirmed in the case of stable sites, while in the area of the EcoGenerator site displacements of 1.4 mm per month were visible. Next, GNSS measurement, performed in May 2021, allowed us to verify the results.
Table 3 shows the coordinates aligned to ASG-EUPOS stations from measurements which lasted 6 h.
The 6 h measurement showed the same accuracy of height alignment as the 3 h measurement (
Table 4).
Therefore, it is possible to reduce the measurement time by half in order to obtain reliable data for the assessment of vertical displacements on islands between the Międzyodrze Islands.
A more extensive analysis of vertical and horizontal displacements was also possible, following a second GNSS survey performed in May 2021, during which vertical movements of benchmarks and their errors were calculated (
Table 5).
The alignment was carried out using the method of least squares. As a result of measurements connected to the geodetic network point with known coordinates (station Kamień Pomorski, and Prenzlau) increments (m) between that point and two new points (2 and 3) were obtained, as well as error matrices of increments (mm2) (reports from alignment appendices). The observation equations of triple phase differences were formulated assuming one of the satellites as the baseline. For example, for four available satellites, three equations are formulated (combinations 1–2, 1–3, 1–4) containing three unknown corrections dX, dY, dZ to the approximate coordinates of the mobile receiver XB, YB, ZB. The full observation system contains multiples of these equations for each pair of measurement moments t1, t2. As a result of its solution by the method of least squares, corrections dX, dY, dZ and coordinates of the mobile receiver XB + dX, YB + dY, ZB + dZ were obtained with an average error of 0.05 m. Observation equations of double phase differences were formulated analogously to triple phase differences, assuming one of the satellites as the base.
The average errors of corrected coordinates were of the order of 0.05 m. Corrections dX, dY, dZ to approximate coordinates of the mobile receiver XB, YB, ZB, after assuming known, constant values of the number of cycles determined in the first equalization of double phase differences, were determined by repeated solution of the equations of double phase differences. Mean errors after these corrections should be of the order of 0.005 m.
5. Discussion
Only the integration of the city’s geology, which benchmarks vertical movements in the levelling sequences of the first and second class, will allowed us to identify stable and unstable areas of Szczecin over the course of this century. This will enable the reliable monitoring of these areas in the future.
Reference points for benchmarks showing significant values of vertical displacements in the area of Miedzyodrze are located on geologically stable formations, outside of this area. Their displacement over the last 30 years did not exceed tenths of mm. Therefore, it becomes possible to monitor deformations of engineering objects not only in the effectual aspect, but also in the cause and effect one (monitoring the development of the deformation process during the planning phase, even before construction of the object).
A complexity control and measurement system should be useful while monitoring surface and object deformation in areas built of sediments such as peat [
15]. Economic considerations justified utilization of the measurements by GNSS [
16], which could be corrected to high precision reference over much larger distances [
17]. Potential investors of the planned objects can take these data into account while monitoring deformations [
18,
19]. Different degrees of peat decomposition result in different susceptibility to extrusion (displacement) of loaded layers; peats with medium and high degrees of decomposition according to the von Post scale are particularly susceptible to displacement [
20]. Organic soils with varying physical characteristics, such as moisture content, porosity, liquid limit, and degree of plasticity, are prevailing in the researched area.
While geological aspects are critical, the use of the alternative monitoring system based on InSAR data was not justified in terms of accuracy and precision merit. This is due to the fact that a loose layer of fertilized soil is present over more stiff organic geological structures. InSAR deals with the observation of surface changes of larger areas of terrain; the research carried out concerned displacements of closely adjacent benchmarks over long time intervals.
6. Conclusions
The complex monitoring of vertical land motions corresponding to geological structure of coastal and river areas in Northwestern Poland are presented in this article. In order to locate points (1 and 3), archival catalogues of levelling line measurements made in 1975 and 2000 were used [
21].
The second segment of this system has already been implemented. A point (4) on unstable geological ground was located in the vicinity of the site. Periodic GNSS observations of benchmarks installed close to the EcoGenerator structure were planned [
21]. The first GNSS measurement was carried out in November 2020 and the second in May 2021. The results of the second measurement allowed us to calculate the vertical displacements of the benchmarks and to verify the stability of the reference system (first segment of the system). Comparison of the heights obtained with the use of precise levelling and satellite levelling confirmed the stability of the positions. Benchmarks located in the direct vicinity of the second segment of the monitored infrastructure showed a displacement of 1.4 mm during one month. After the second measurement, the reference points proved to be stable and the point located in the immediate vicinity of the EcoGenerator plant settled 19 mm.
Alignment of benchmarks in relation to both stable points and the nearest reference stations can significantly increase the accuracy of the measurements. The nearest reference stations can also be replaced by stable benchmarks for 3D measurements.
In connection with planned investments on several Odra islands, it is justified to conduct the complexity monitoring of the height of benchmarks in the Międzyodrze islands. In order for the obtained results of these deformations to be interpreted in interdisciplinary areas in terms of cause and effect, not only effect, it is necessary to start the research at the stage of the still-undisturbed rock mass.
A porous structure which, when under pressure, is subject to shrinkage and removal of water from the pores [
20], is the cause of vertical displacement of organic soils.


