Article

Research on Deformation Analysis and Rehabilitation for a Beam–Arch Combination Bridge Suffering an Extreme Temperature Field

1
School of Civil Engineering and Architecture, East China Jiaotong University, Nanchang 330013, China
2
State Key Laboratory of Performance Monitoring Protecting of Rail Transit Infrastructure, East China Jiaotong University, Nanchang 330013, China
3
Anhui Transport Consulting & Design Institute Co., Ltd., Hefei 530021, China
*
Authors to whom correspondence should be addressed.
Appl. Sci. 2022, 12(14), 6909; https://doi.org/10.3390/app12146909
Submission received: 4 May 2022 / Revised: 2 July 2022 / Accepted: 5 July 2022 / Published: 7 July 2022
(This article belongs to the Topic Advances on Structural Engineering)

Abstract

:
In situ monitoring was conducted throughout the construction period to investigate the abnormal deformation of a bridge under construction subjected to sudden cooling by Typhoon Lekima. An FE model considering the temperature field based on measurement data was also established to reveal the exact causes of the bridge’s abnormal deformation and provide theoretical guidance for rehabilitation measures. The FE model simulation and measurement results showed that (1) the exact cause of the abnormal deformation of the bridge was the inconsistency of the temperature field between the top and bottom plates, and the sudden approach of the typhoon aggravated the inconsistency; (2) the abnormal deformation of the construction bridge caused by the typhoon could be addressed with rehabilitation before forming the bridge; (3) an extreme temperature field should be considered in the design of a beam–arch combination bridge. These results can provide a reference for the design and construction of similar bridges.

1. Introduction

A consensus has been reached in the engineering field regarding the influence of temperature variations’ static and dynamic behaviors in bridge structures, especially in places that experience distinct seasons [1]. The mechanical properties of beam–arch combination bridges are quite different from those of conventional arch bridges; thus, the action of temperature is more complex and substantial during construction without deck pavement [2]. Several bridges under serviceability conditions have been damaged because of the nonuniform and time-varying temperature fields caused by annual and daily temperature cycles, such as the web and bottom flange buckling accident of the Fourth Danube Bridge in Vienna [3] and the severe cracking on the Jagst Bridge in Germany [4]. Therefore, many researchers have studied the influence of solar radiation, temperature, and other environmental factors on the temperature field distribution of bridges under serviceability conditions. Previous investigations of the temperature behavior of bridges under serviceability conditions focused on the temperature load, which is correlated with the sectional temperature distribution, thermal stress/strain, and thermal flexure of cable-stayed bridges [5], suspension bridges [6,7,8,9], and long-span tied-arch bridges [10]. Generally, the temperatures of steel structures that directly receive solar radiation are higher than the environmental temperatures, and maximum temperatures may exceed 60 °C [11,12,13].
Using field-measurement data and finite element (FE) analysis, Lee et al. [14] examined the effect of structural changes on the temperature behavior of a long-span bridge pylon and proposed that the temperature behavior of the pylon could be modelled using two characteristic parameters reflecting the influence of the variation in the ambient temperature and the sectional temperature difference. By studying the stability of the longest steel truss deck cable-stayed bridge during construction, Yu et al. [15] found that temperature variations likely alter the stability coefficients during construction regarding the design temperature.
On the other hand, studies of the variation in the sensitivity of the sensors and the changes in structural behavior due to temperature variations have been performed in the fields of health monitoring system design and structural damage detection. In these studies, the temperature variations were considered detrimental and needed to be compensated for or eliminated [16,17,18,19]. Liu et al. [20] calculated the temperature differences of concrete box girders in 34 major cities in China using FE models and long-term temperature field measurements, and proposed an empirical formula and zoning map applicable to concrete box girders with a 100 mm asphalt pavement.
To achieve construction control of bridges without deck pavement during construction, Chen et al. [21] proposed the temperature gradient model of the steel box girder in construction based on measurement data of the temperature field of the bridge and the influence of the temperature field on the construction stage of the bridge. Wang et al. [22] studied the control measures for thermal effects during the placement of span-scale girder segments on continuous steel box girder bridges by the FE model and field-measured temperature data. Han et al. [23] calculated the temperature effect on a composite girder cable-stayed bridge under two key construction stages, the maximum double cantilever, and the maximum single cantilever, using the FE model and a reasonable time for construction control of each component was provided for construction control.
Most previous studies mainly focused on the temperature load and temperature effects on bridges under service in health monitoring system design and structural damage detection. However, not as much research on the effect of conventional temperature has been conducted. The impact of extreme weather on a bridge in the construction stage is accidental and random; the problem of the construction control caused by the temperature due to an abnormal climate in the construction stage has not been thoroughly investigated, especially the issue of a combined structure bridge in construction. Hence, in this paper, on-site measurement data of the temperature field of a bridge were used to investigate the abnormal deformation of the beam–arch combination bridge, which an extreme temperature field might cause after a typhoon. Furthermore, an FE model considering the temperature field based on measurement data was established to further research the causes of the abnormal deformation and the rehabilitation measures.

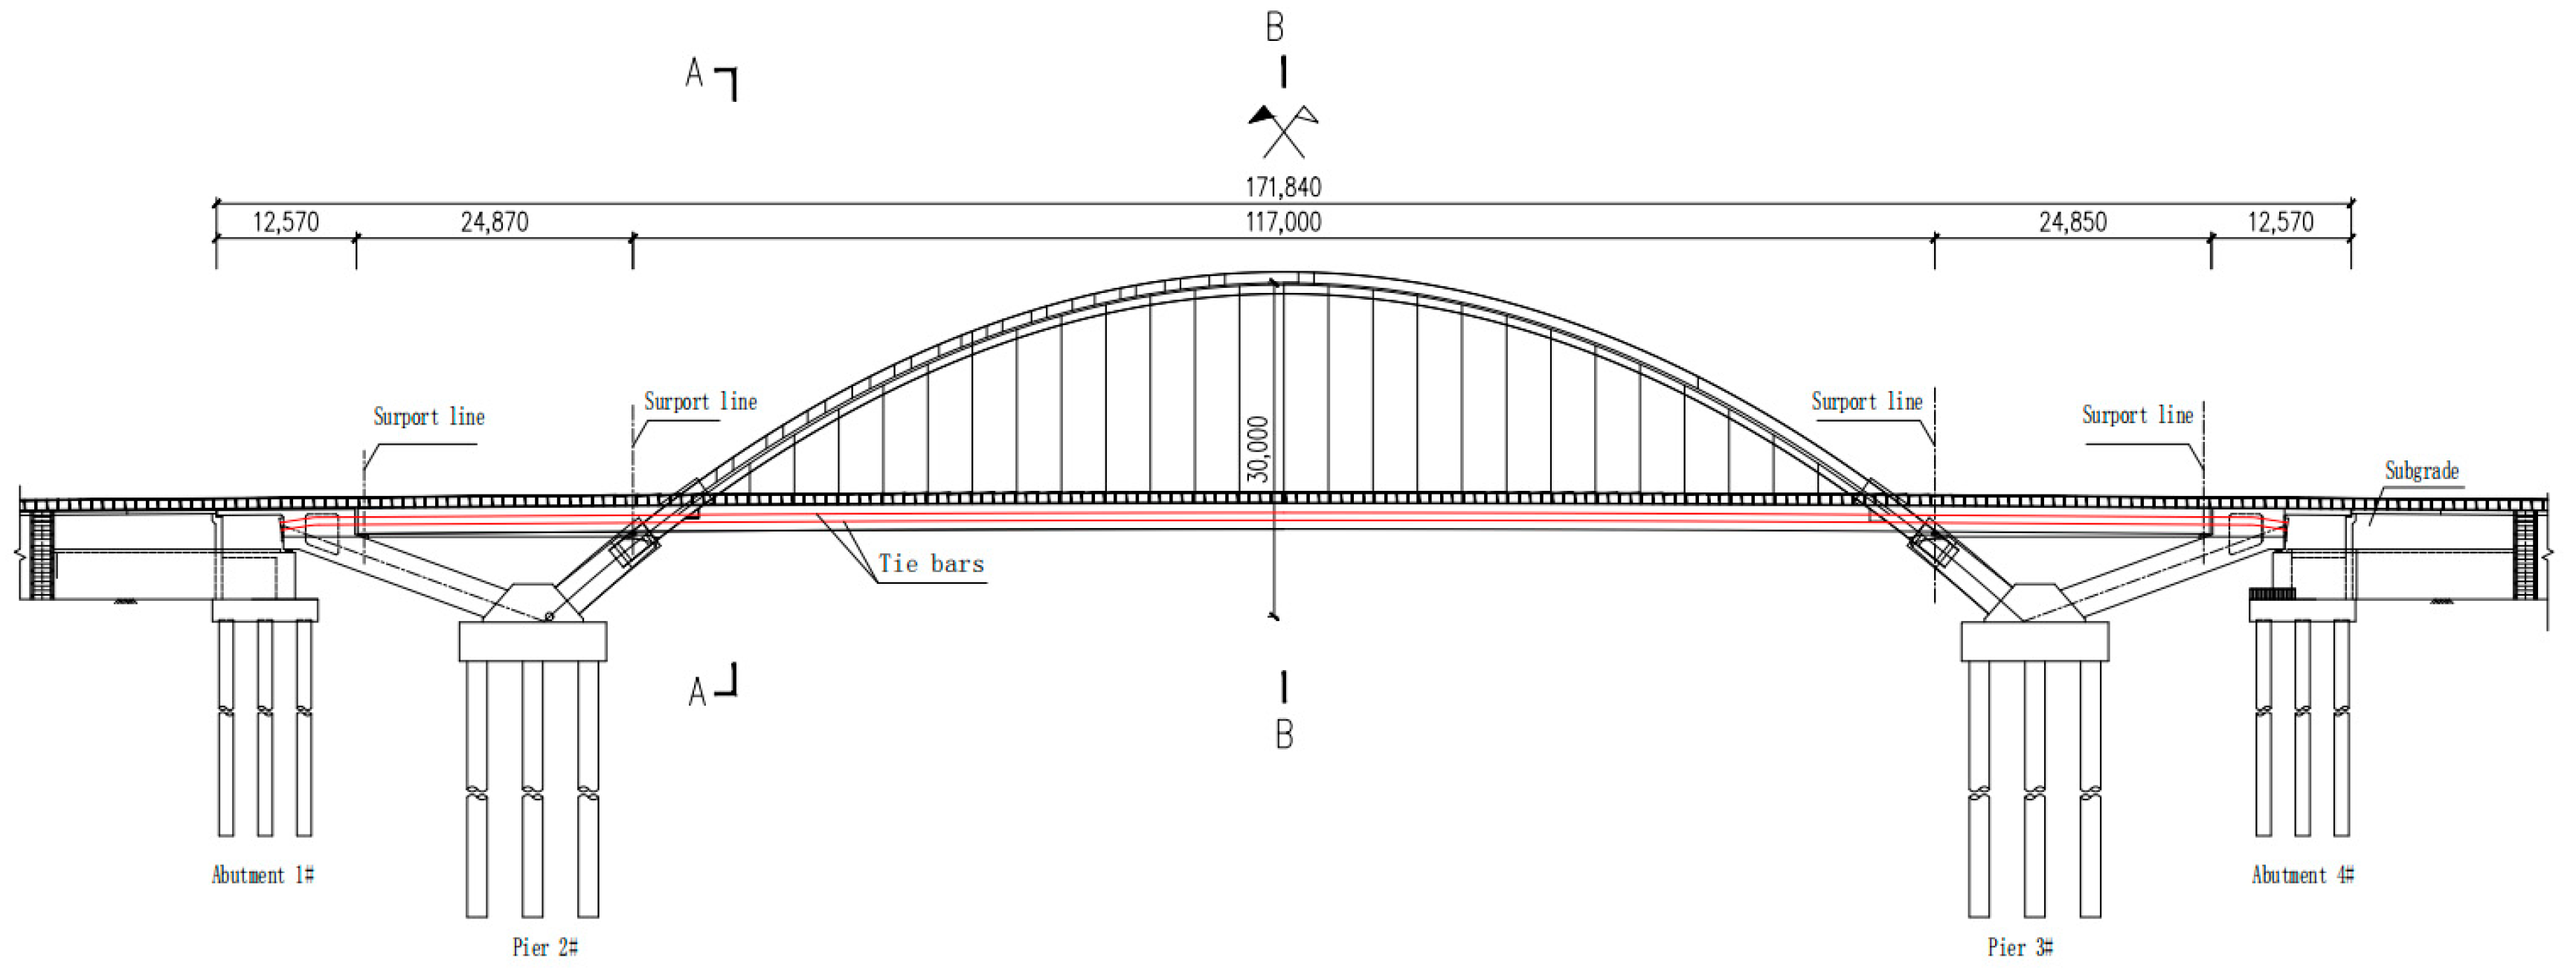
2. The Engineering Background of a Beam–Arch Combination Bridge after a Typhoon

The bridge, which was constructed in 2020, as shown in Figure 1 and Figure 2, is a three-span coupled beam–arch steel bridge system consisting of two main arches and two secondary arches. The calculation span of the main arch is 132.0 m, with a height of 30 m, and the main arch steel box arch is 2.2 × 2.0 m. The calculation span of the secondary arch is 132.0 m, with a height of 30.593 m, and the secondary arch steel box arch is 2.0 × 1.5 m. The main span and side span main girder of the bridge adopt a single box multi-compartment steel box girder. Figure 3 shows the cross-section of the bridge.
To conduct an in depth investigation of the abnormal deformation of the bridge studied herein, the construction process and the construction records of the main construction stage must be described in detail. The overall construction process of the bridge is shown as follows:
(1)
Foundation treatment of the frame scaffolding, October 2018;
(2)
Construction of the arch springing and the crossbeam, January 2019;
(3)
Manufacture of arch ribs and steel box girder components in the factory, October 2018 to January 2019;
(4)
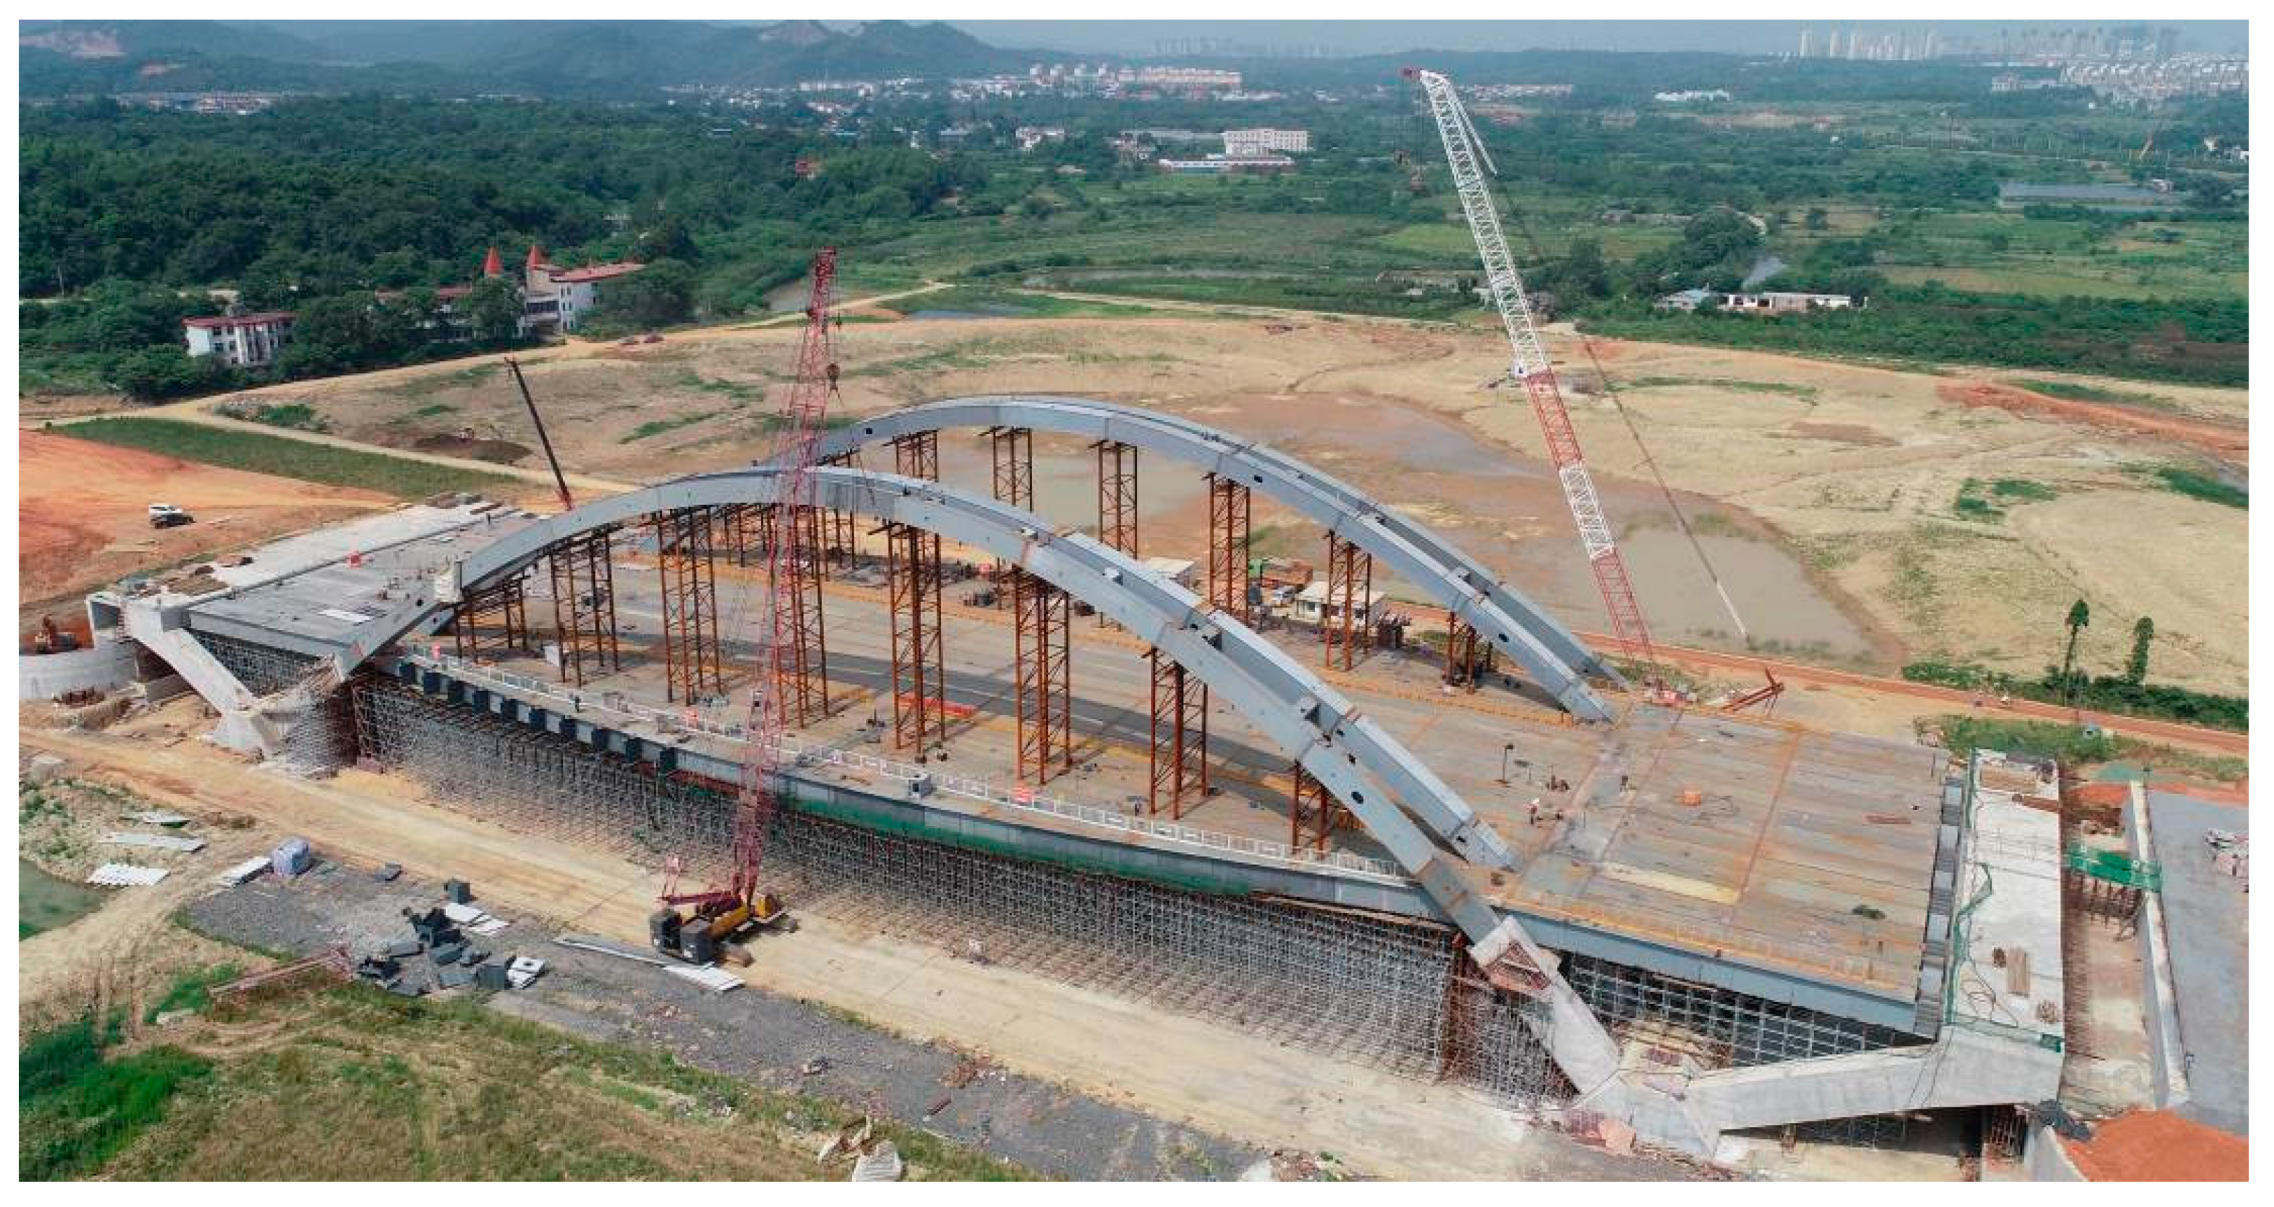
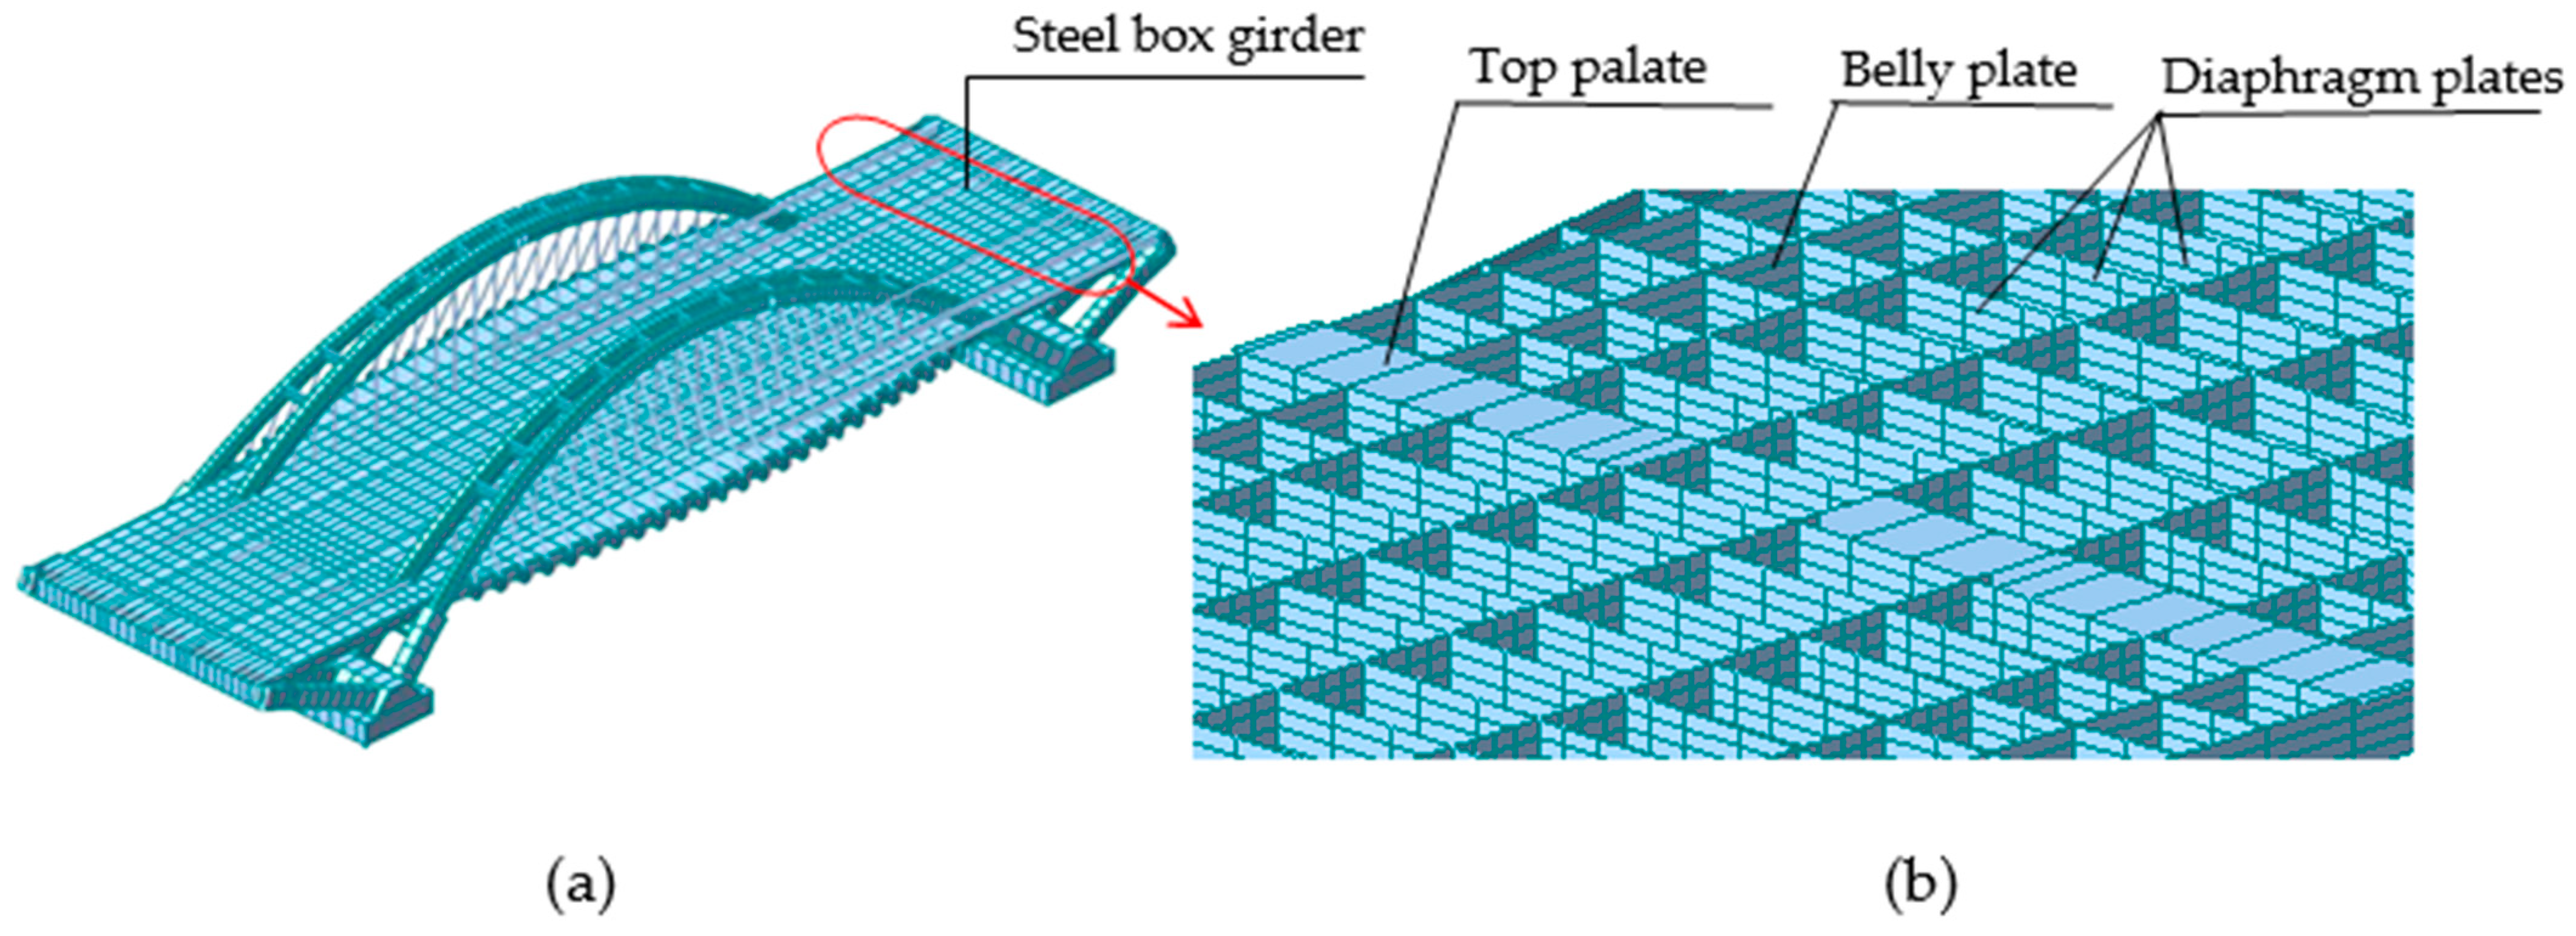
Assembly and welding of the steel box girder on-site in open air conditions (shown in Figure 4), 7 May to 27 June 2019. The construction order was as follows: first the bottom plates of the steel box girder were installed, then the diaphragm plate and the belly plate, and lastly the top plates; the top plates of the steel box girder were closed from 11 June to 27 June 2019, the environment temperature was 30–36 °C in the day time;
(5)
Assembly and welding of the arch ribs in open air conditions, 20 March to 27 June 2019;
(6)
Installation of the tie bars, June 2019;
(7)
Installation of the hanger rods, July 2019;
(8)
Pre-stress of the hanger rods, 5 August to 10 August 2019;
(9)
Demolition of the frame scaffolding of the box girder, 25 August to 29 August 2019; demolition of rest of the frame scaffolding, 17 October 2019.
On 12 August 2019, Typhoon Lekima struck; as a result, the temperature dropped suddenly at night, followed by abnormal twisting deformation of the box girder, and failure of 2% of the top pipes of the frame scaffolding due to shear (shown in Figure 5). The bridge’s bearings separated between the box girder and the pad stones (Figure 6). All these problems prevented the subsequent construction activities. Notably, there is a precedent for separating the support of the steel box girder bridge due to a temperature gradient [24].

3. Cause Analysis of the Abnormal Deformation of the Bridge

Because the bridge is a coupled structure bridge with complex mechanics, the bridge deck is a large plane that is sensitive to the temperature gradient effect due to the easy absorption of solar radiation. According to the preliminary analysis, the sudden temperature decrease during the typhoon might be the main reason for the abnormal deformation of the bridge. The exact cause of the abnormal bridge deformation should be analyzed qualitatively and accurately to solve the subsequent construction problems.

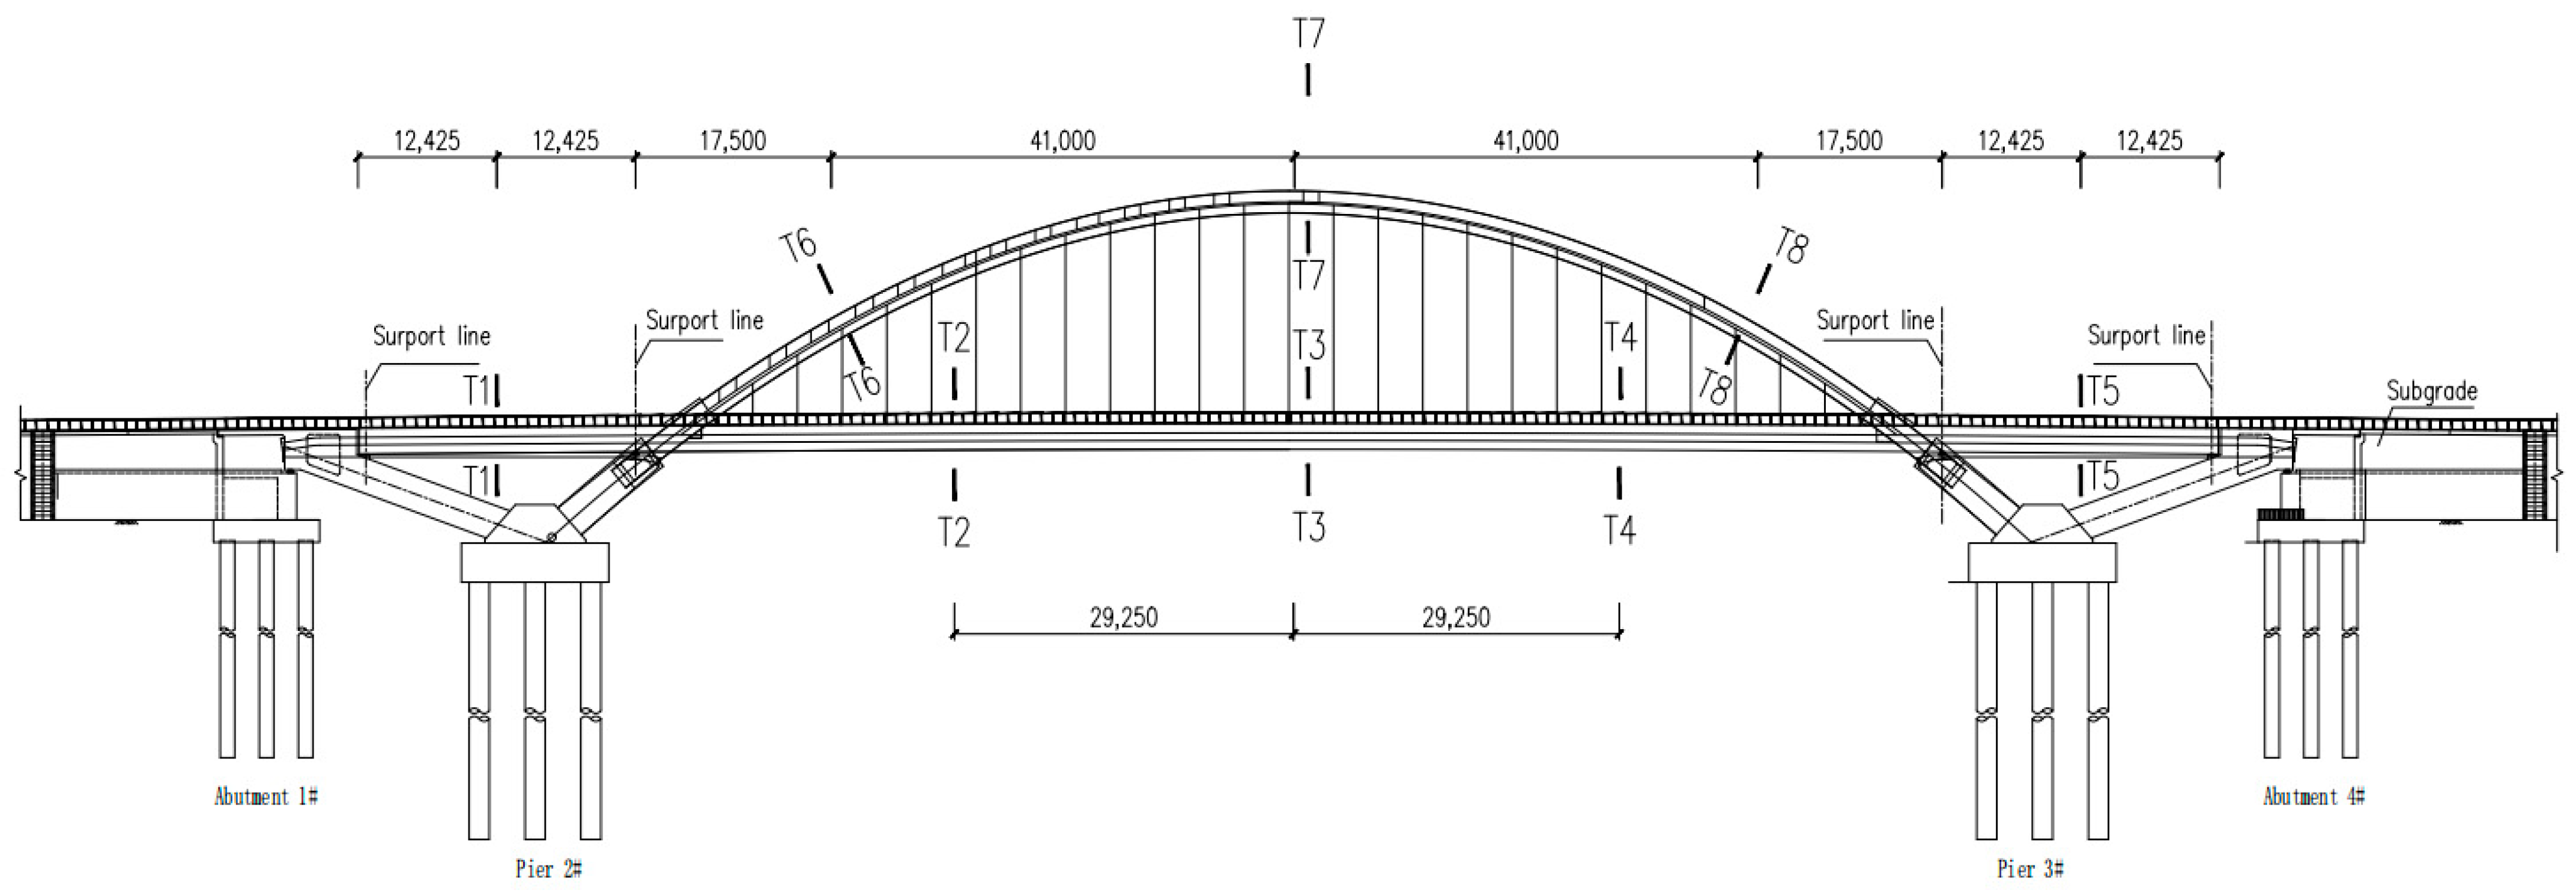
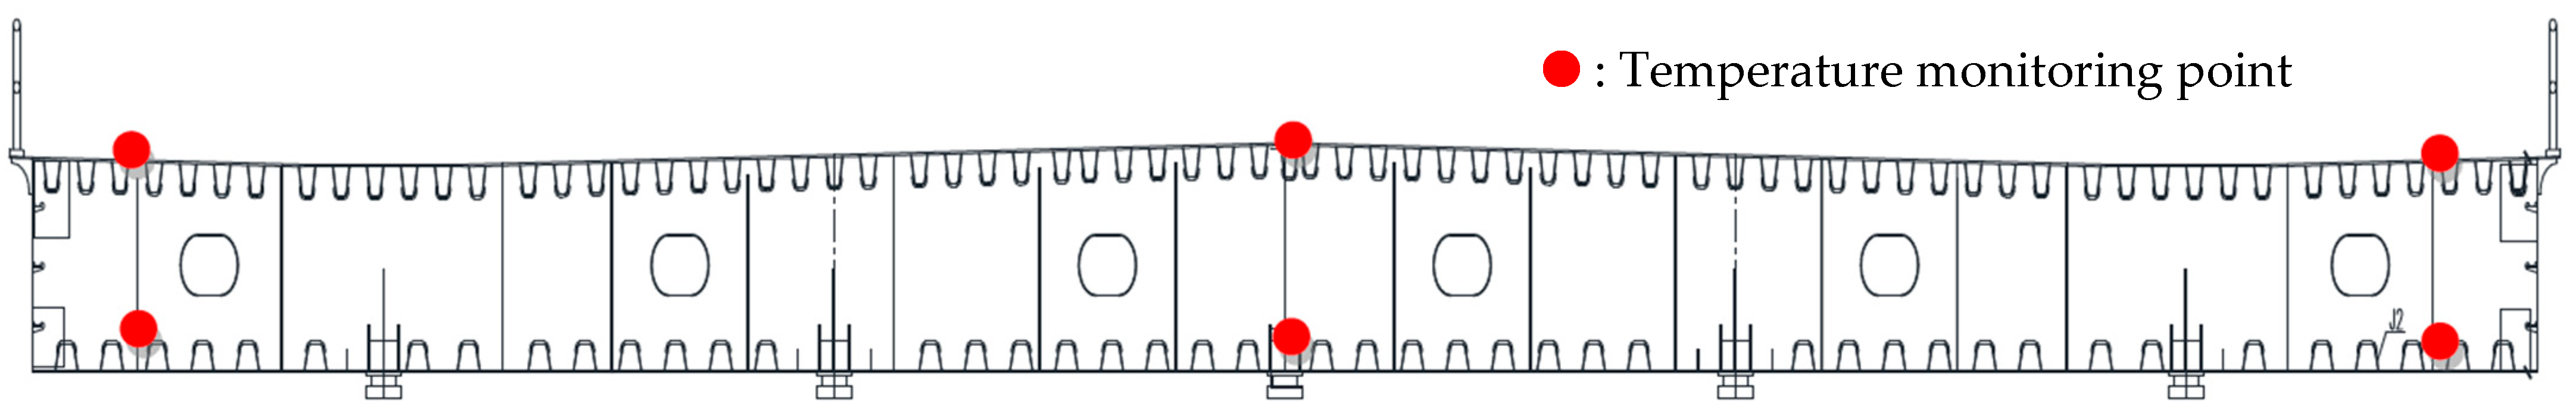
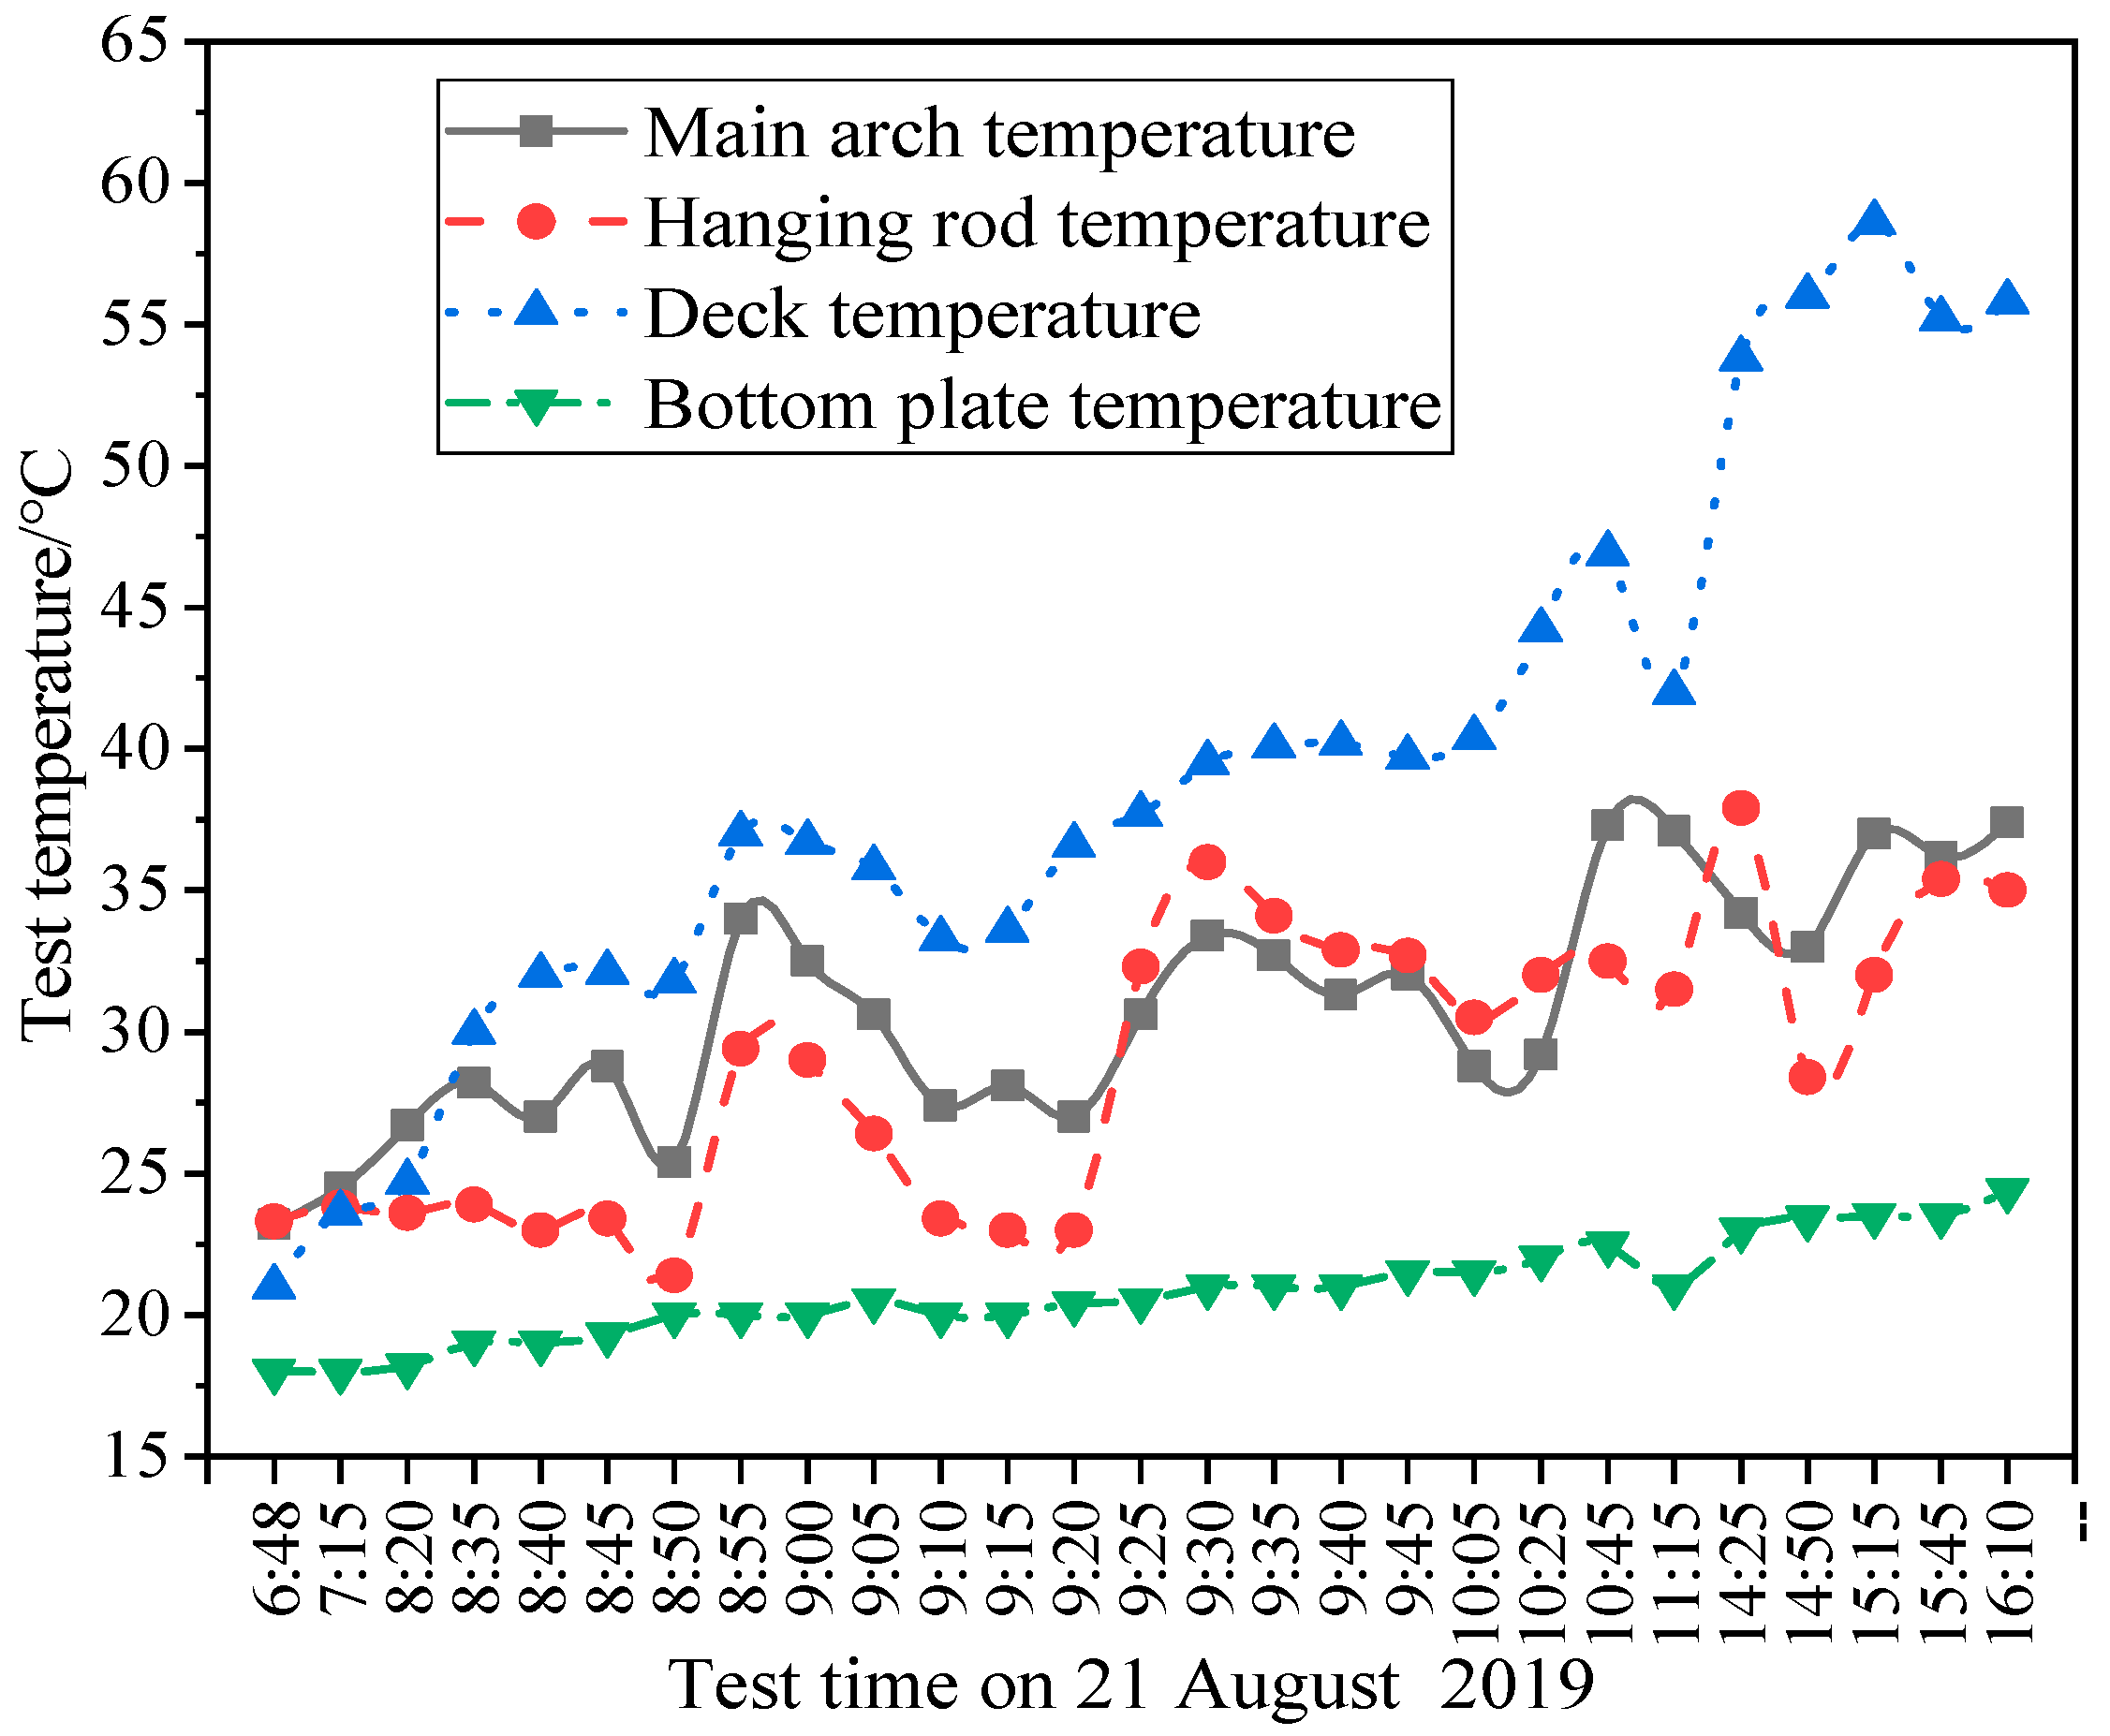
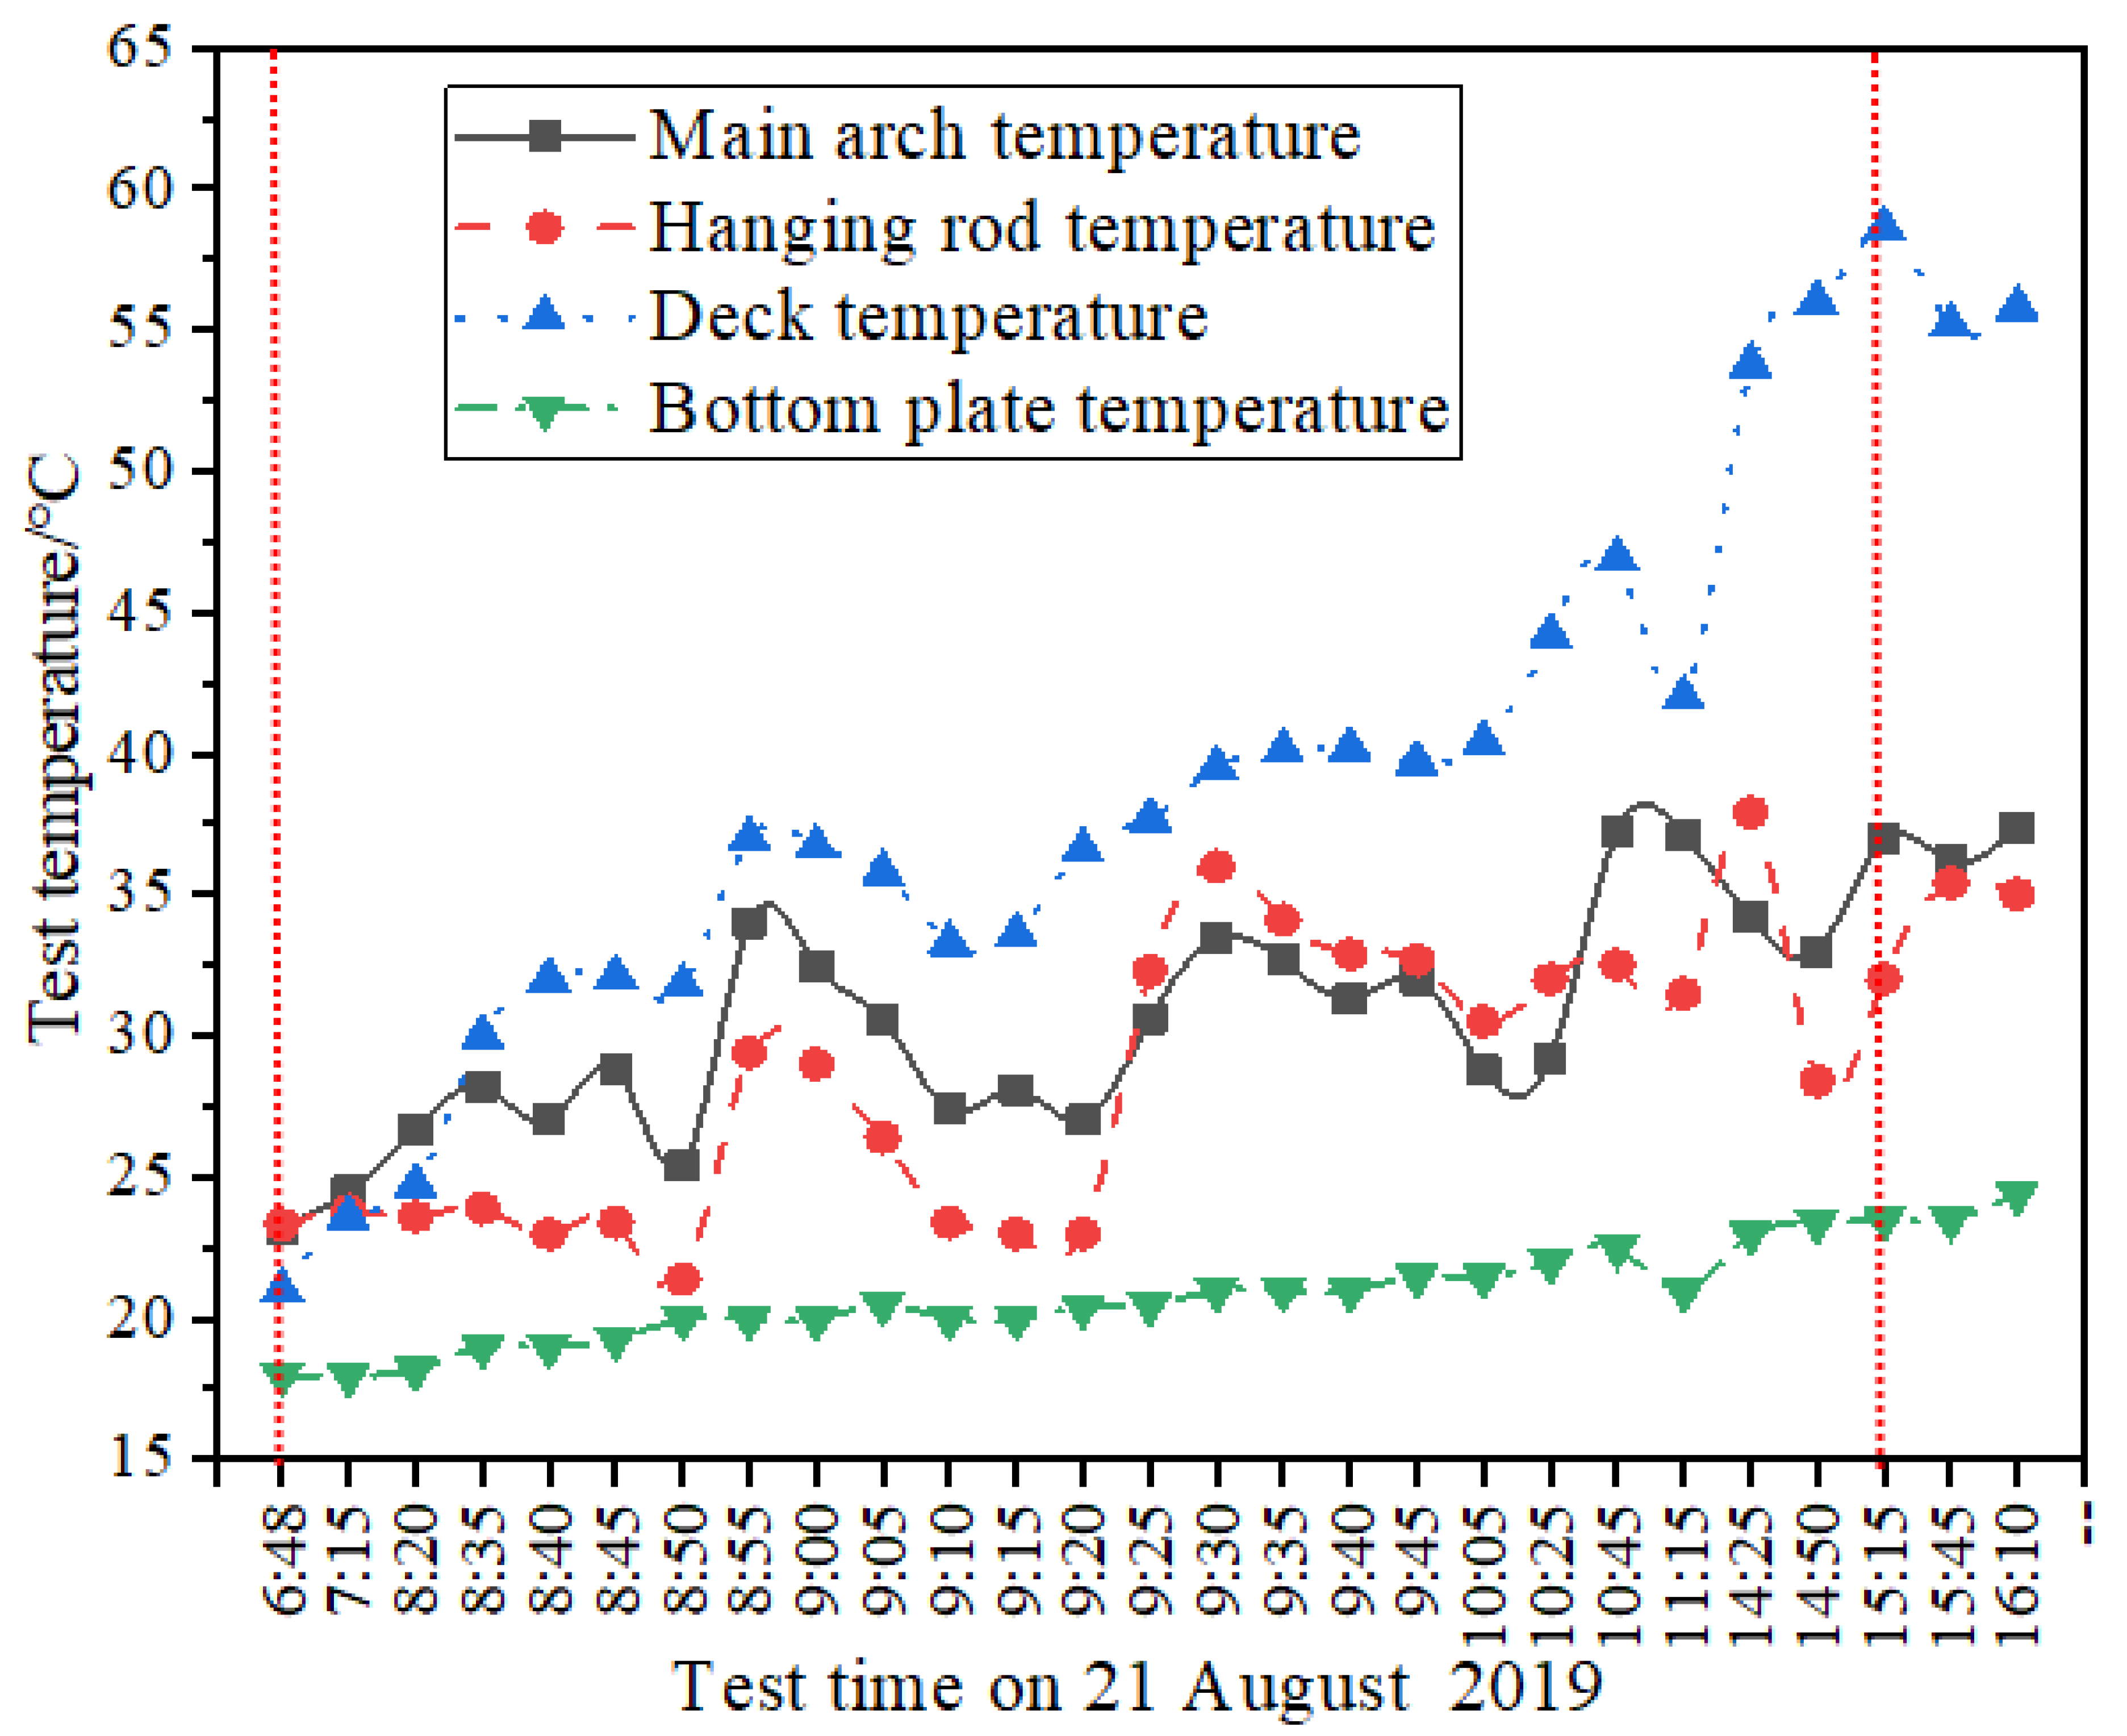
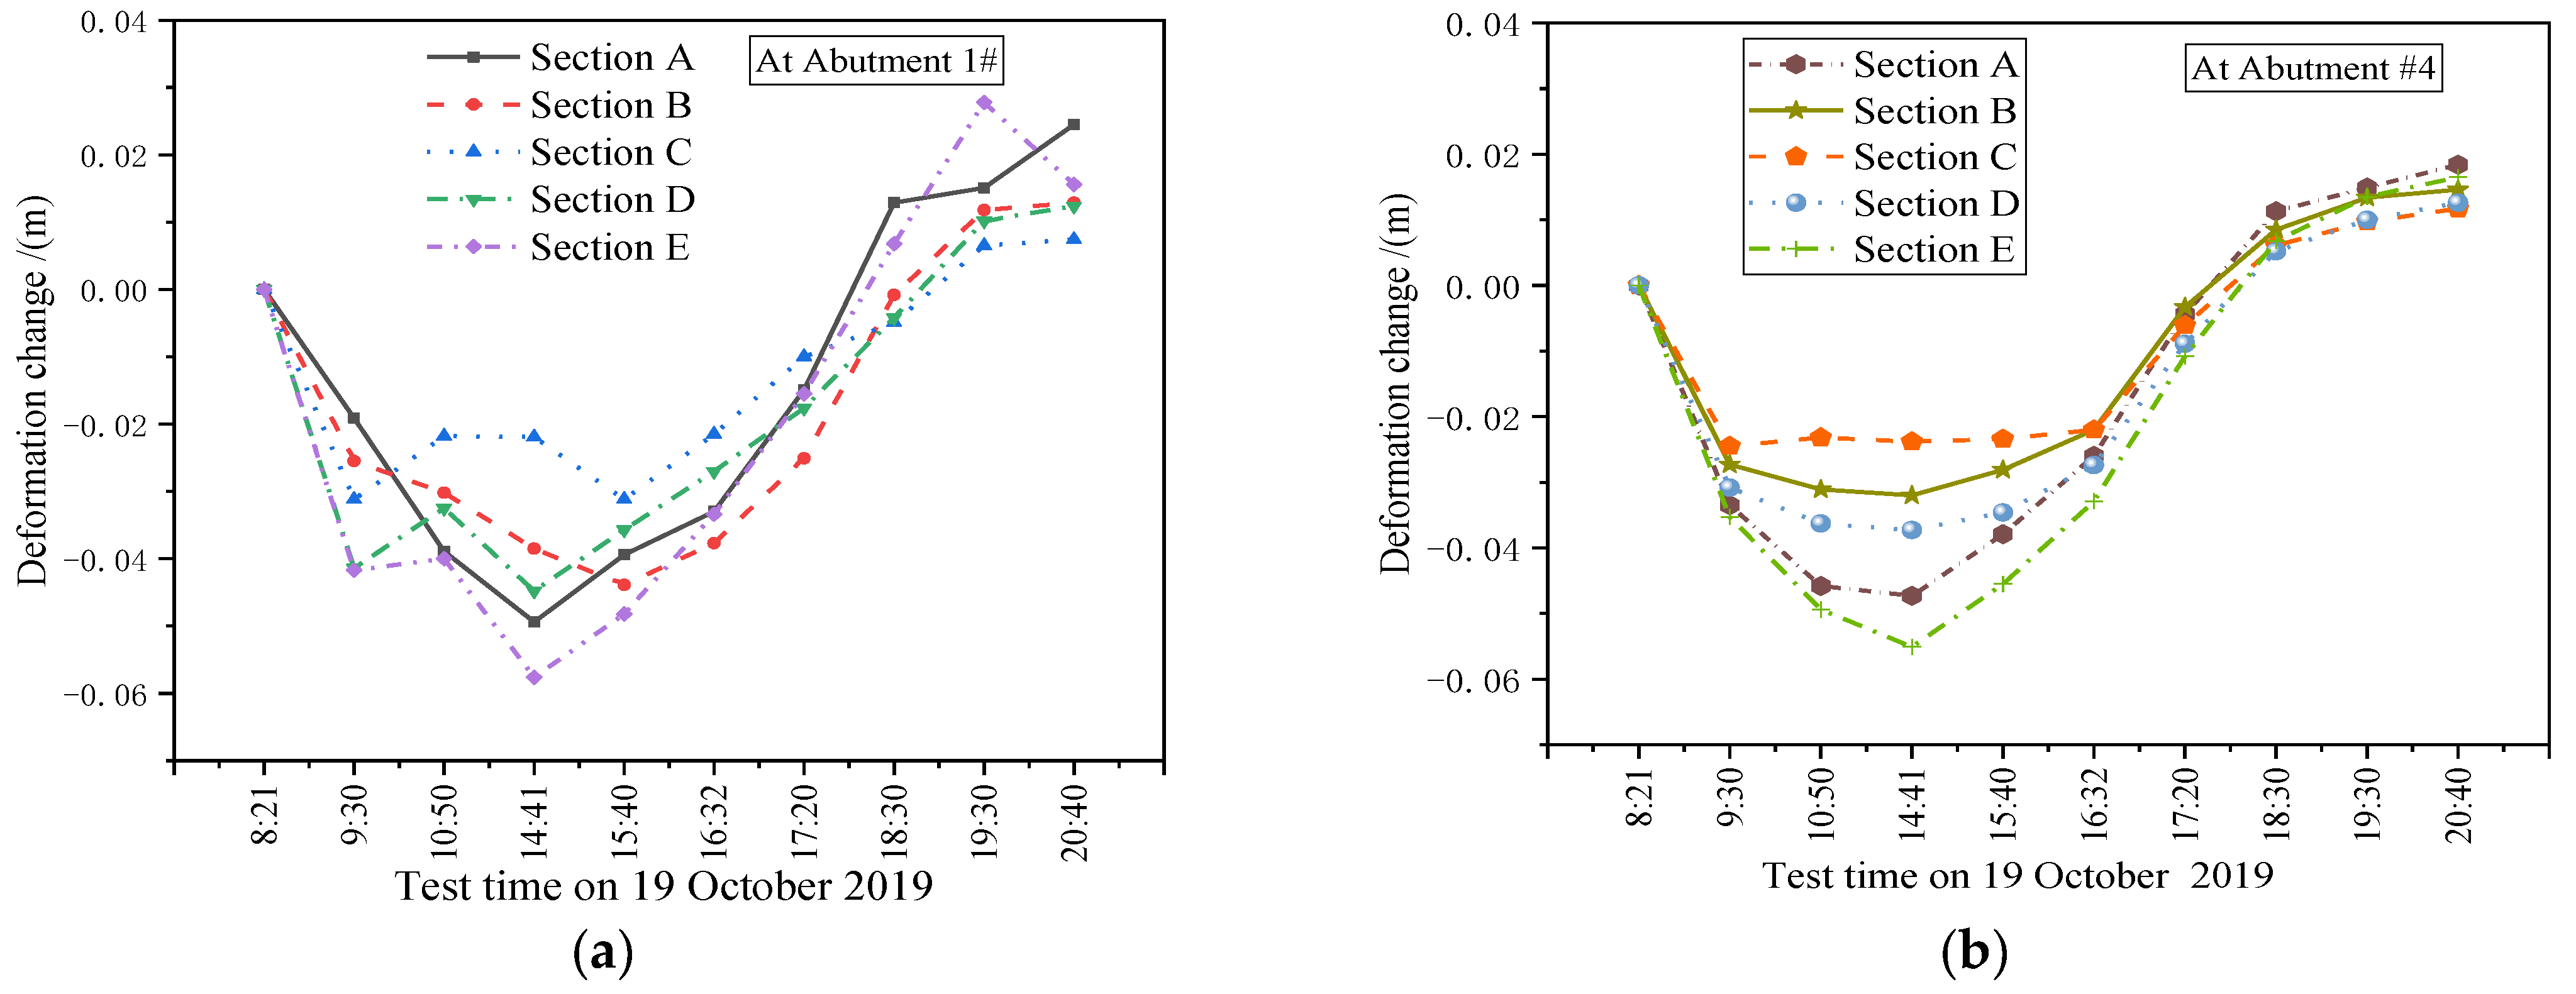
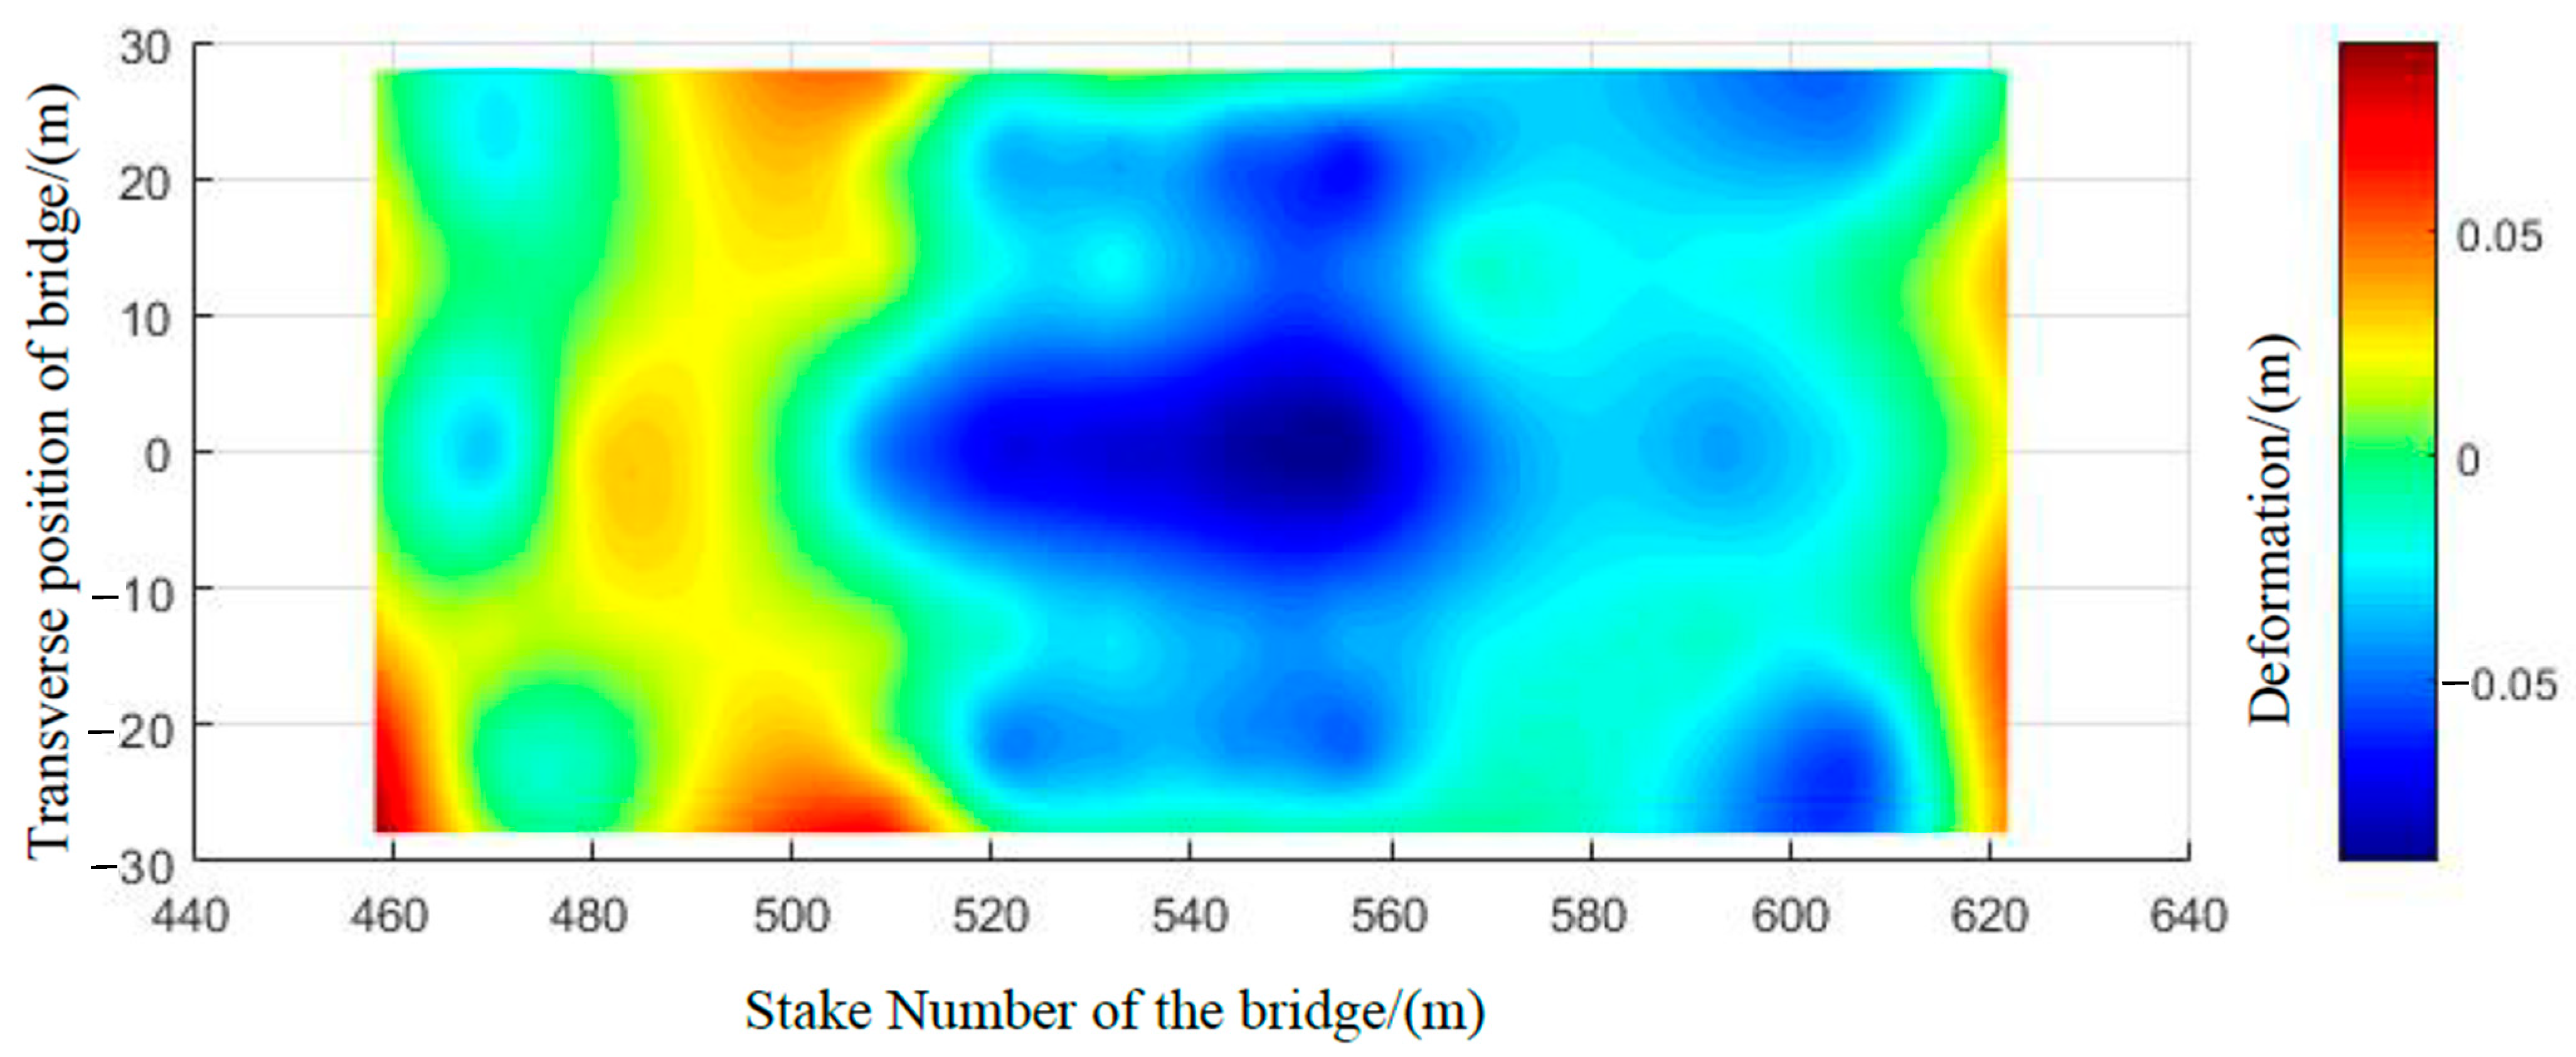
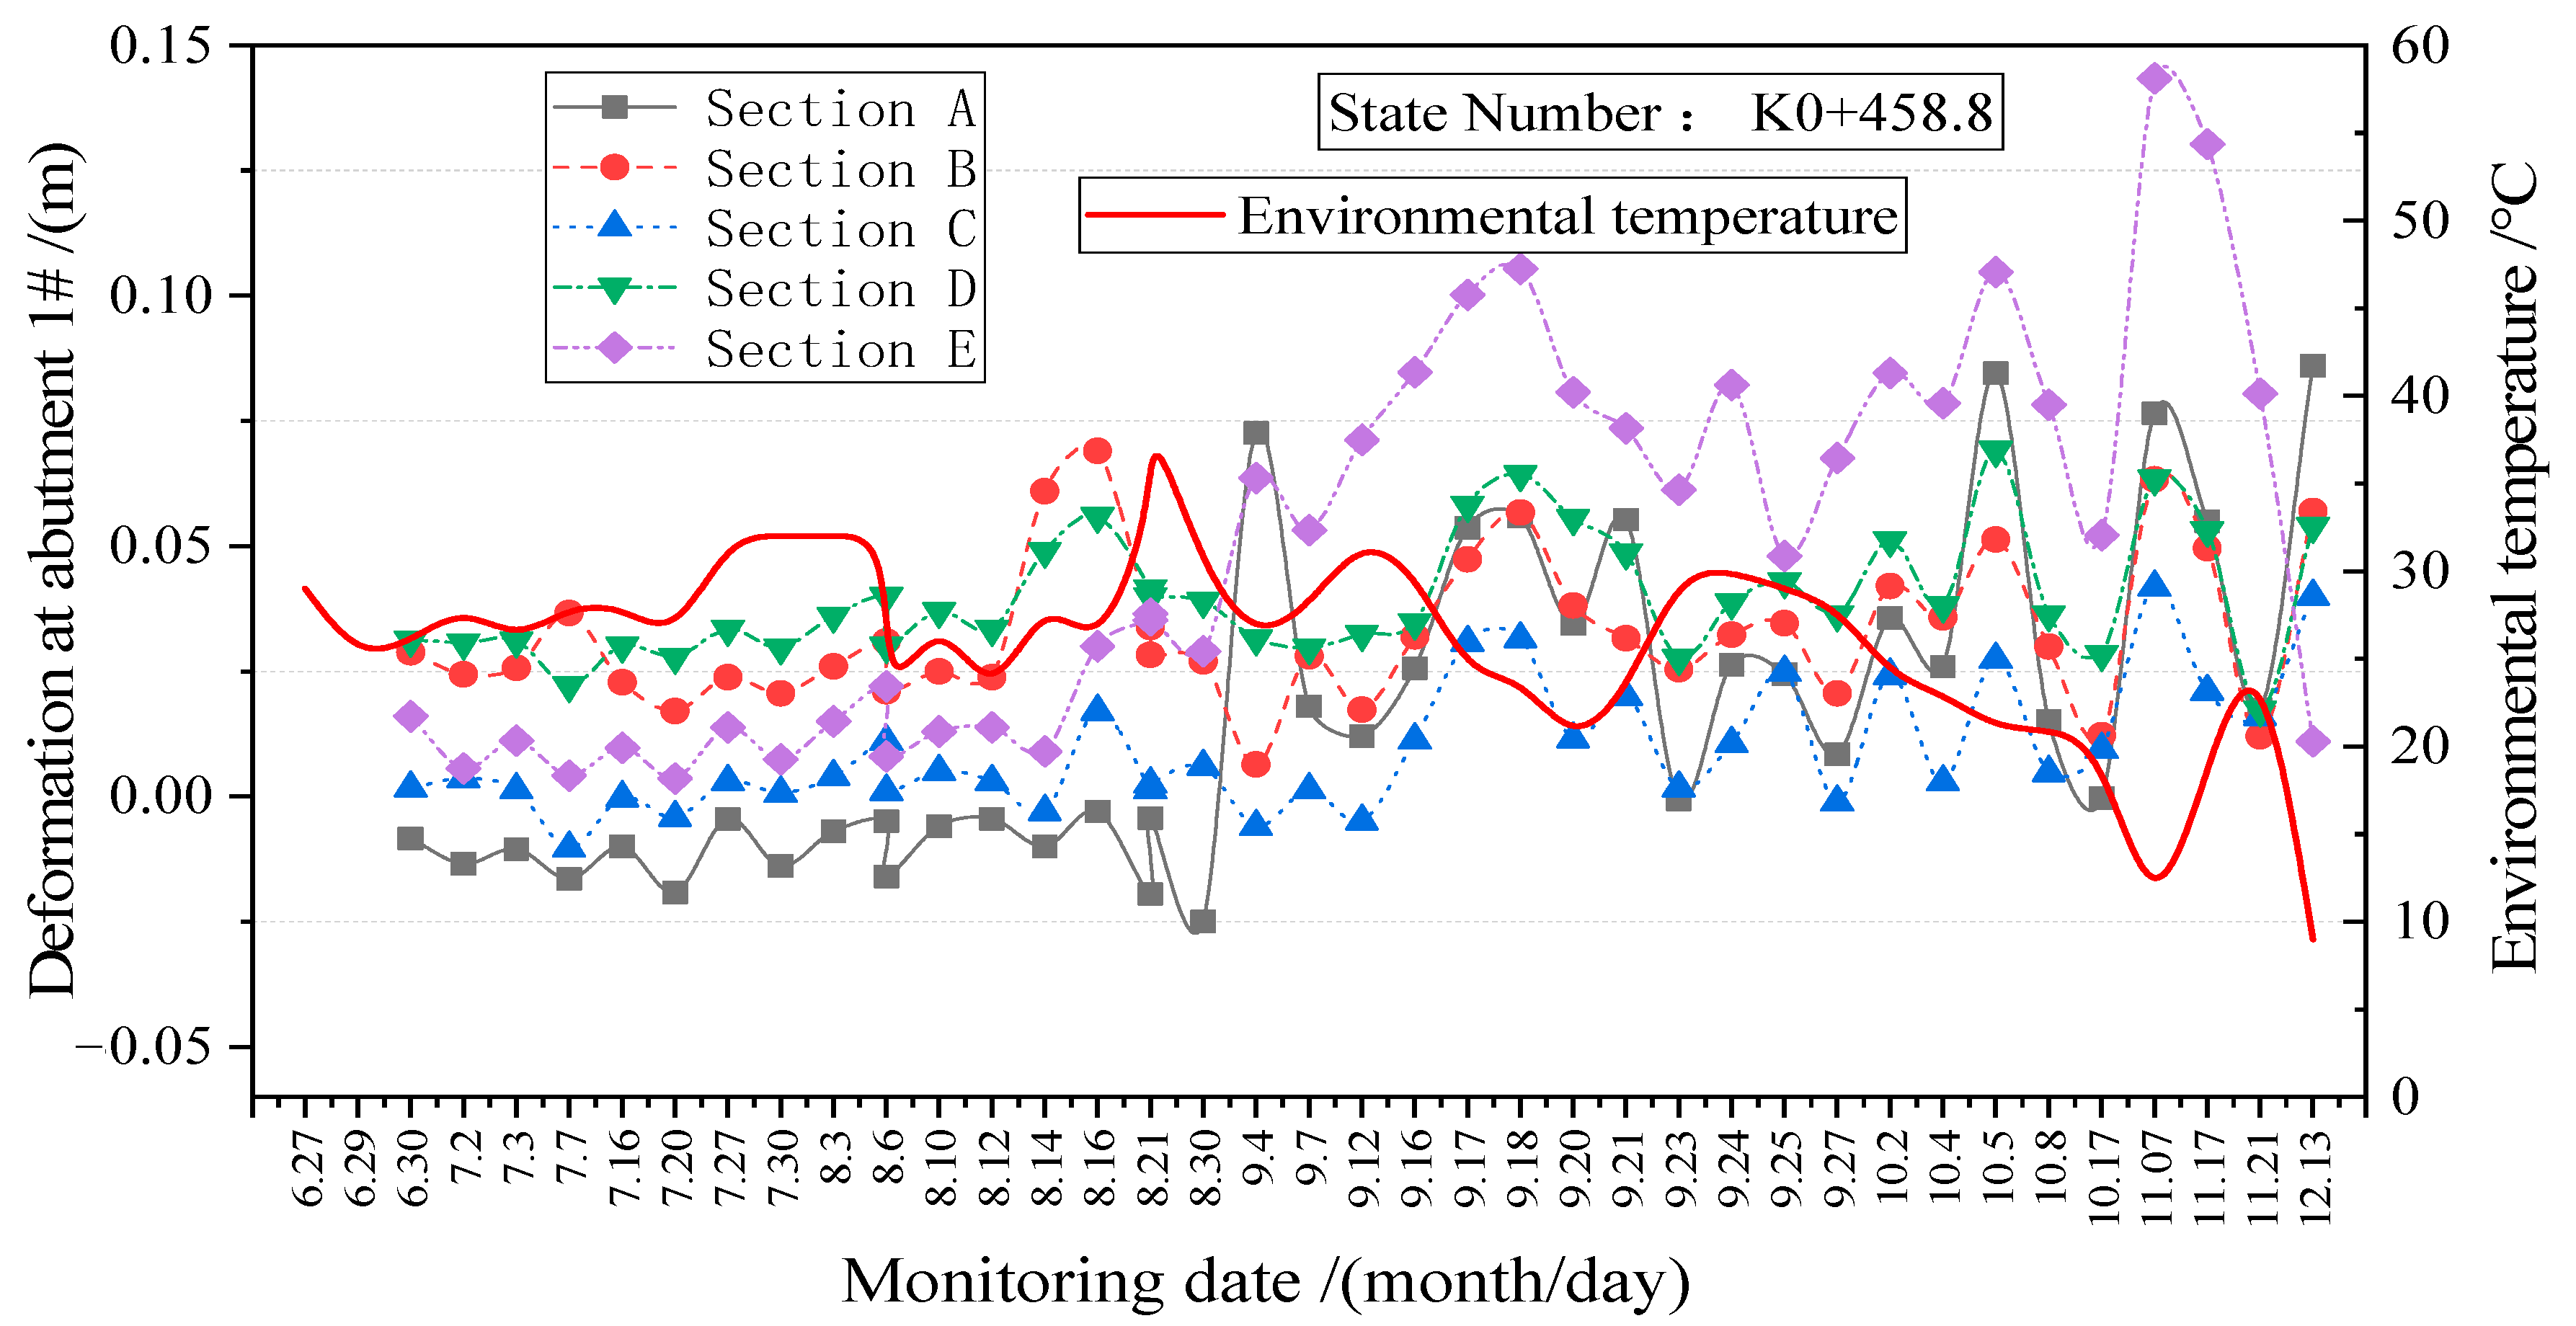
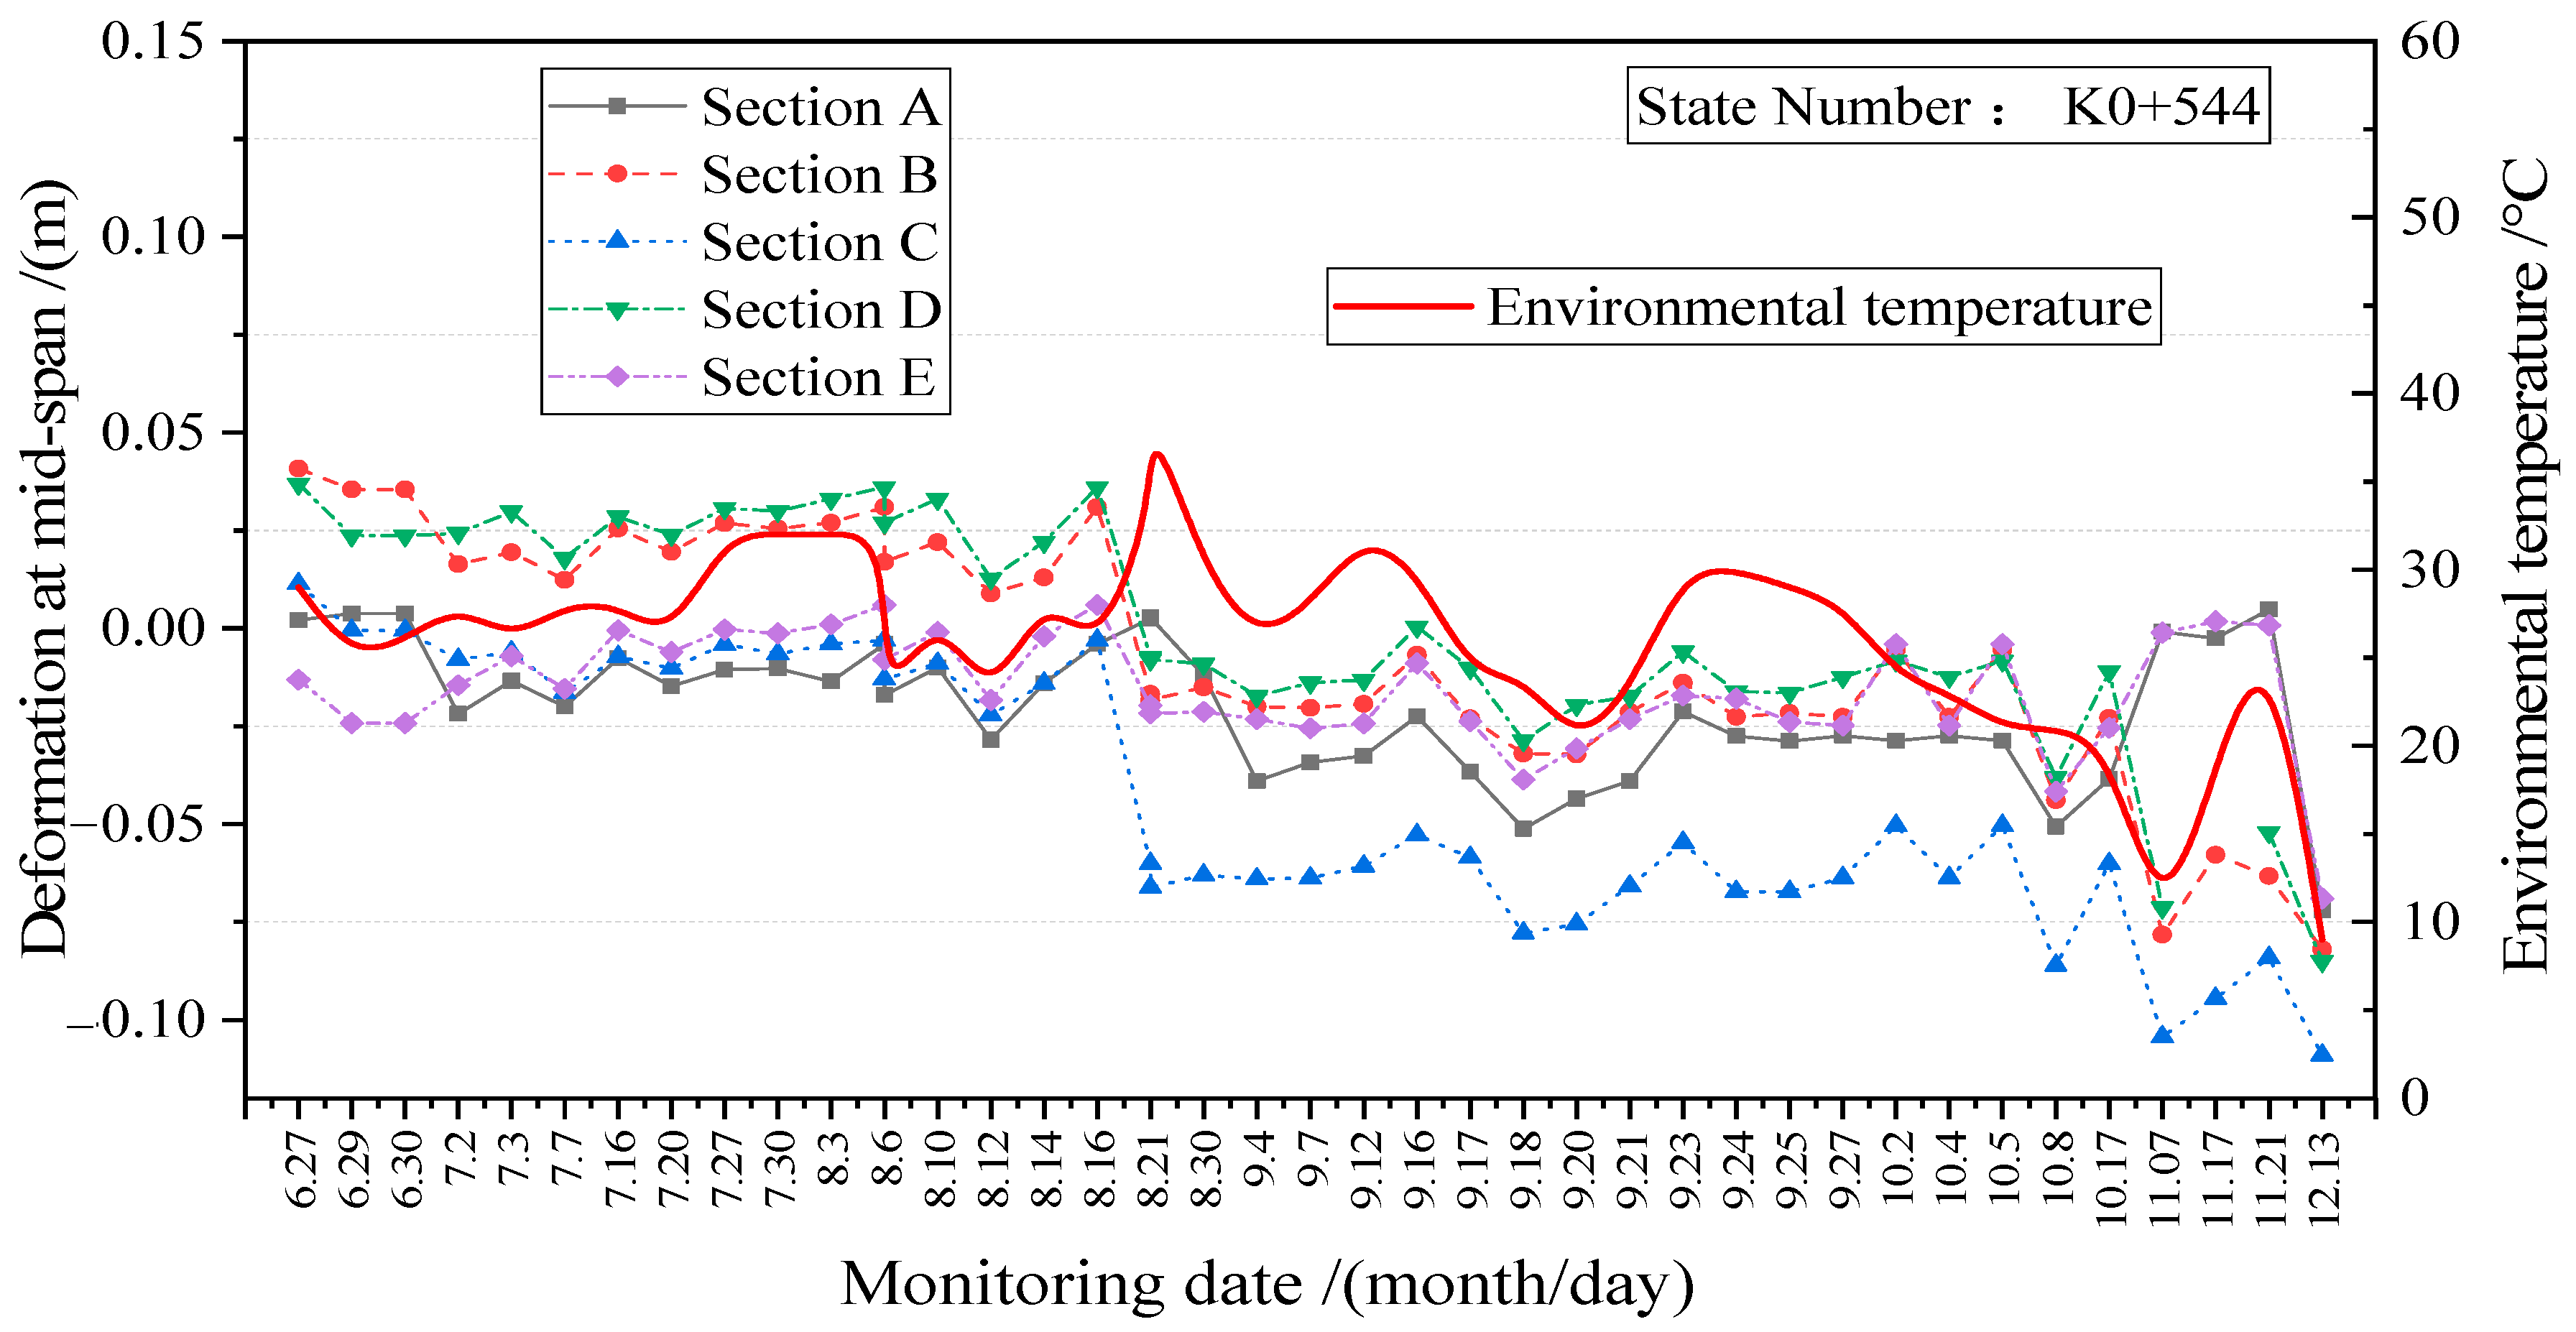
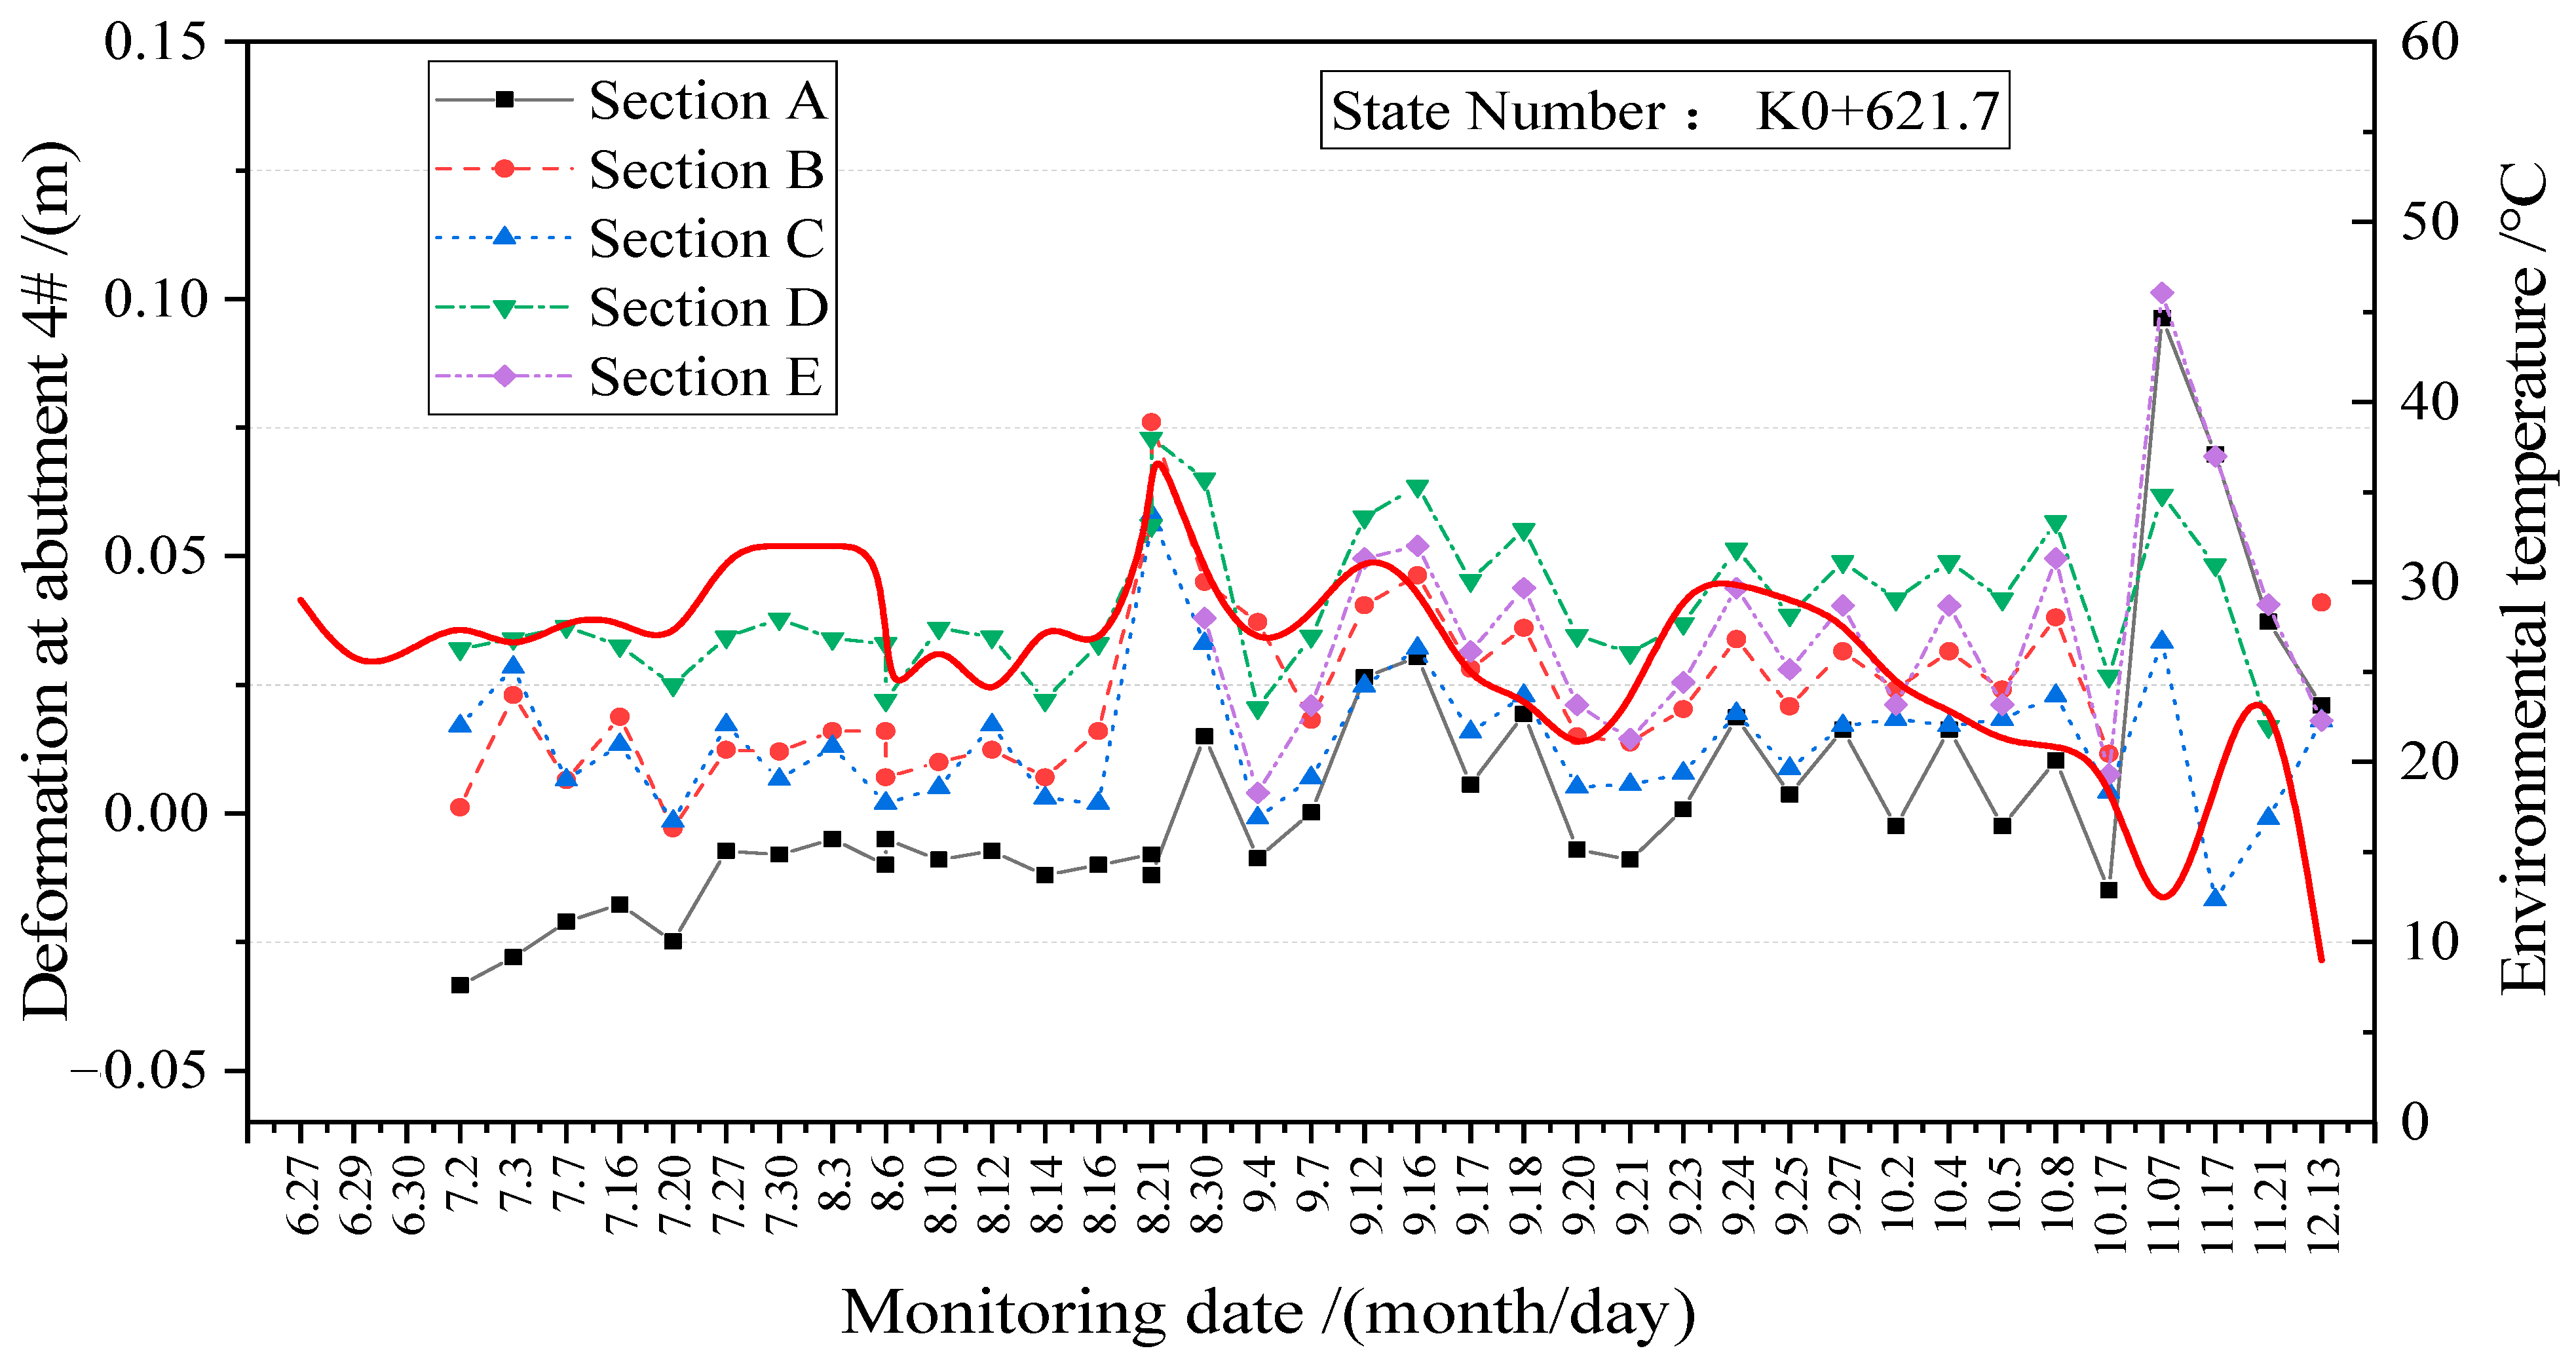
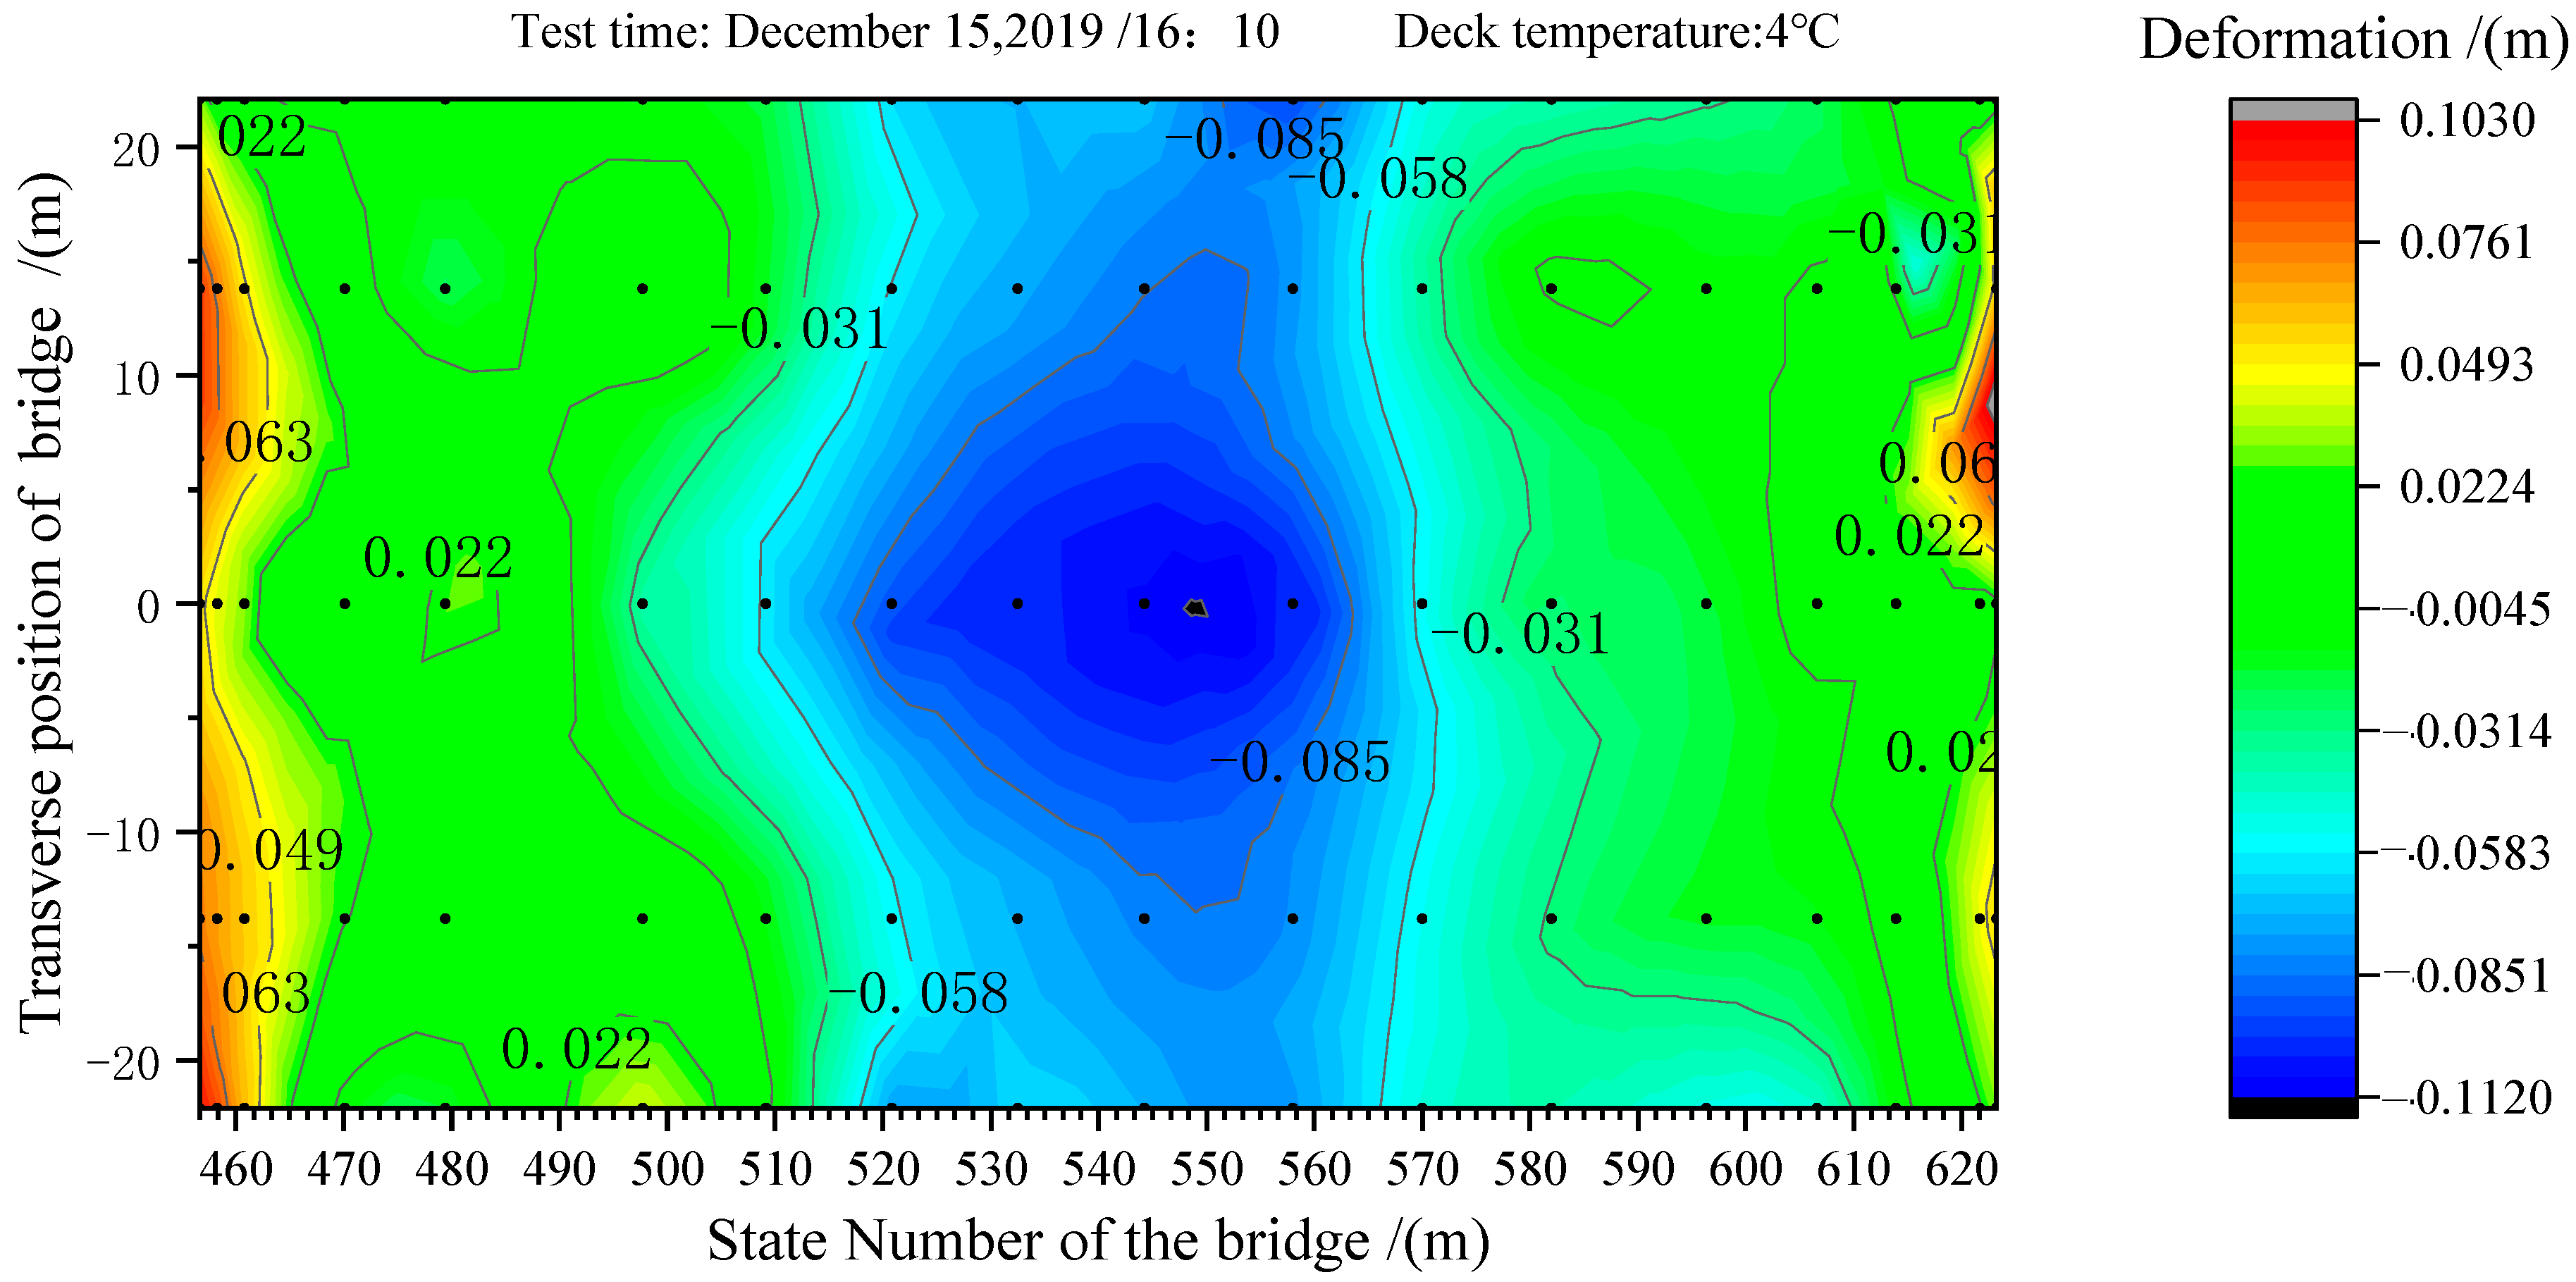
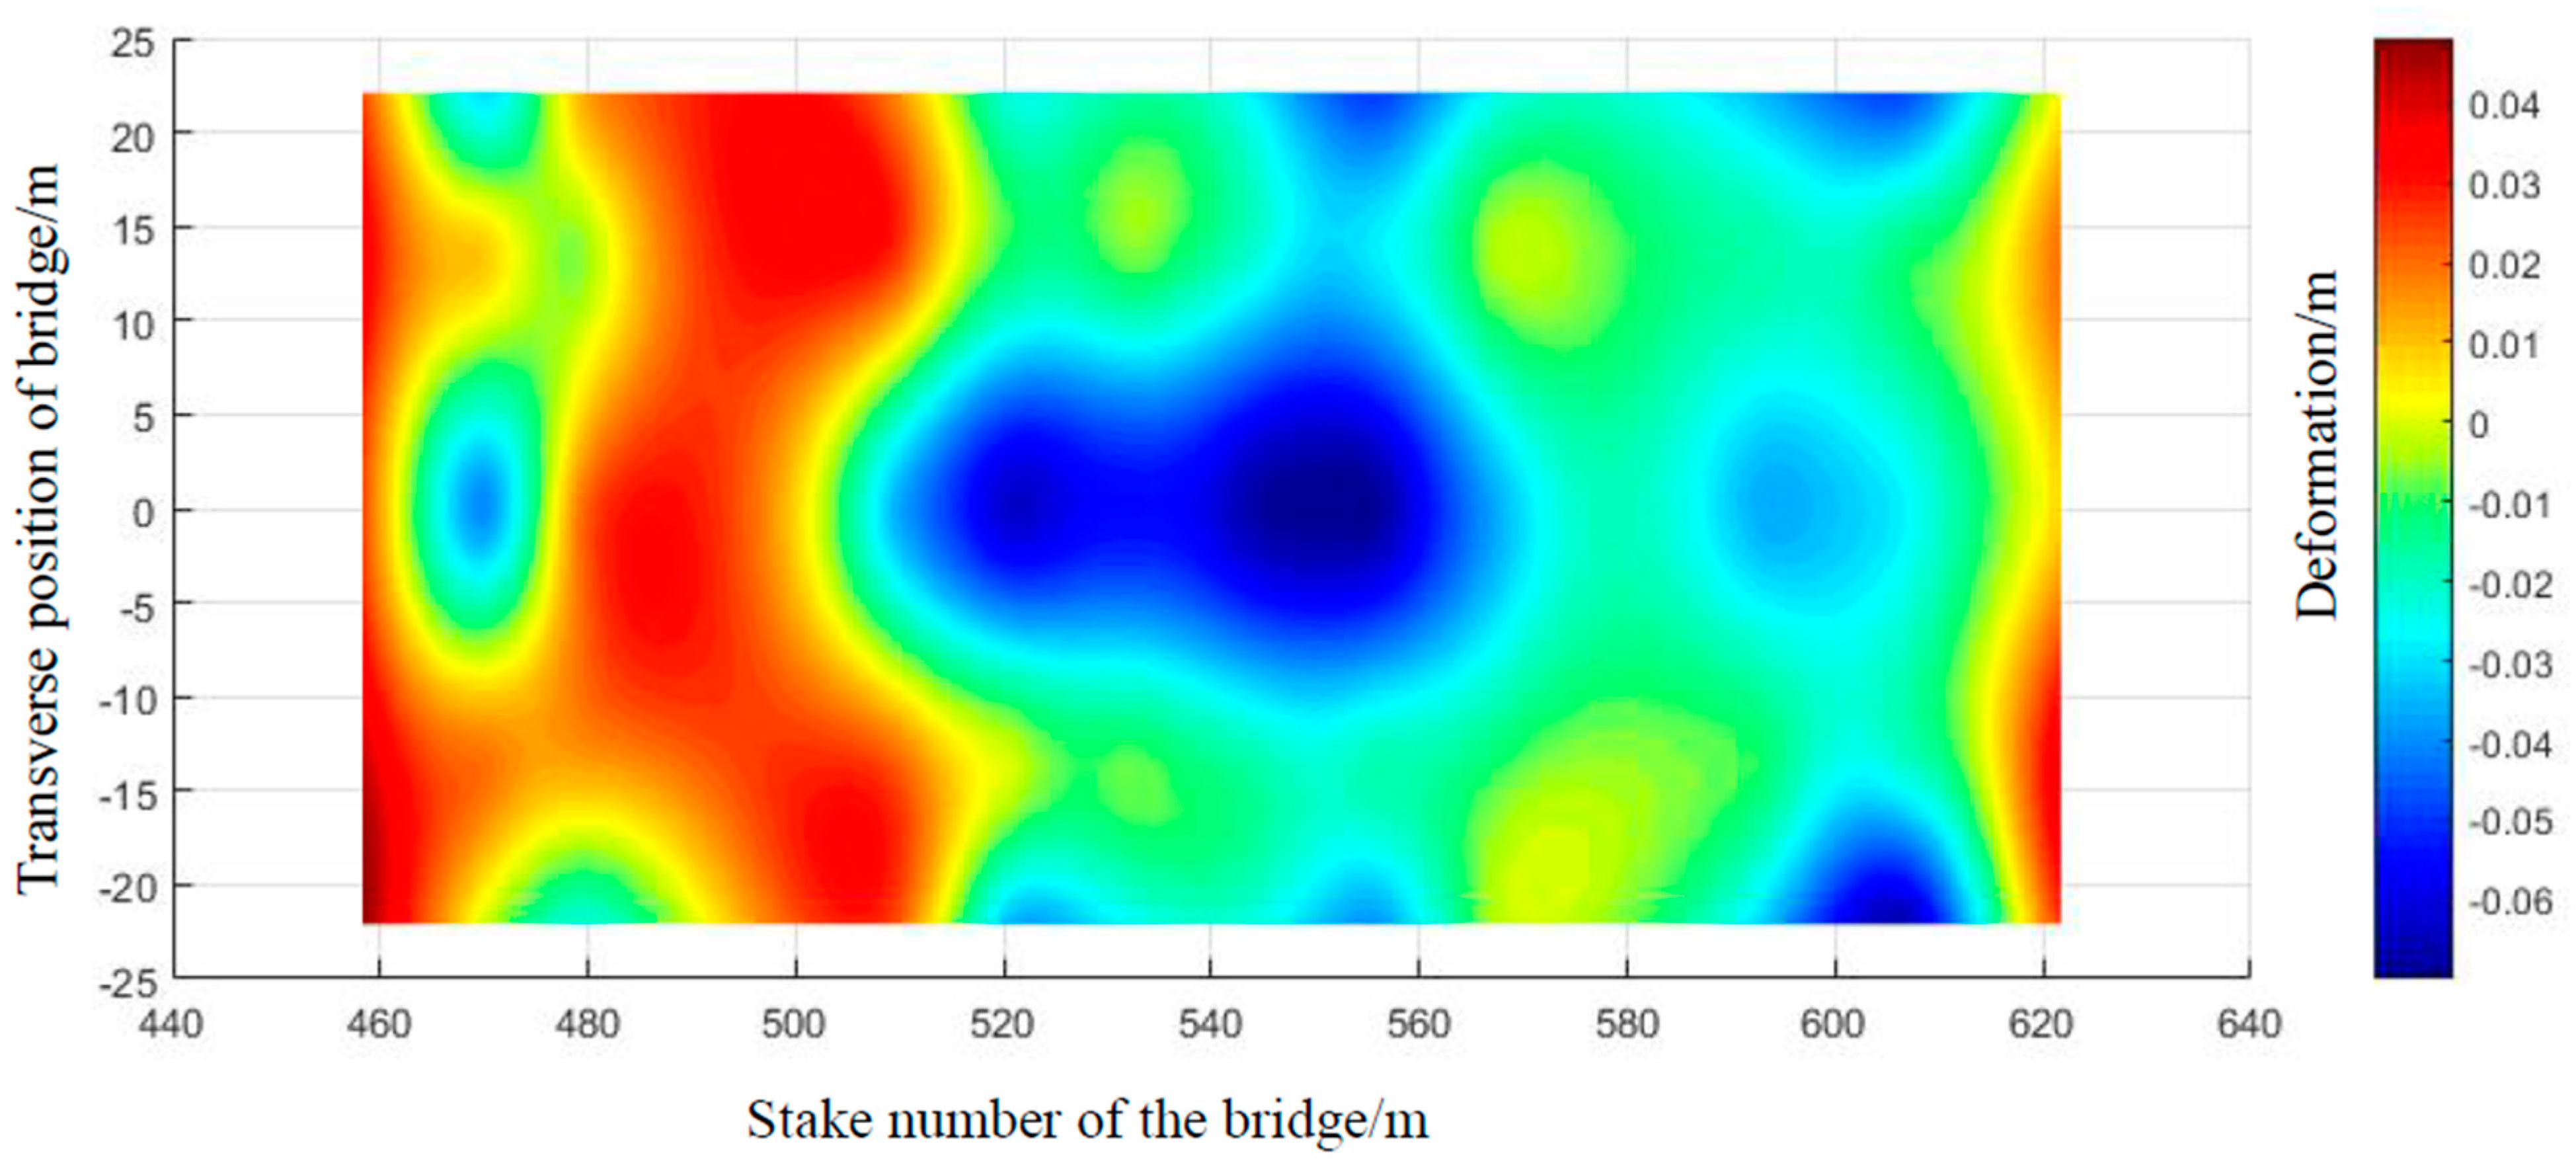
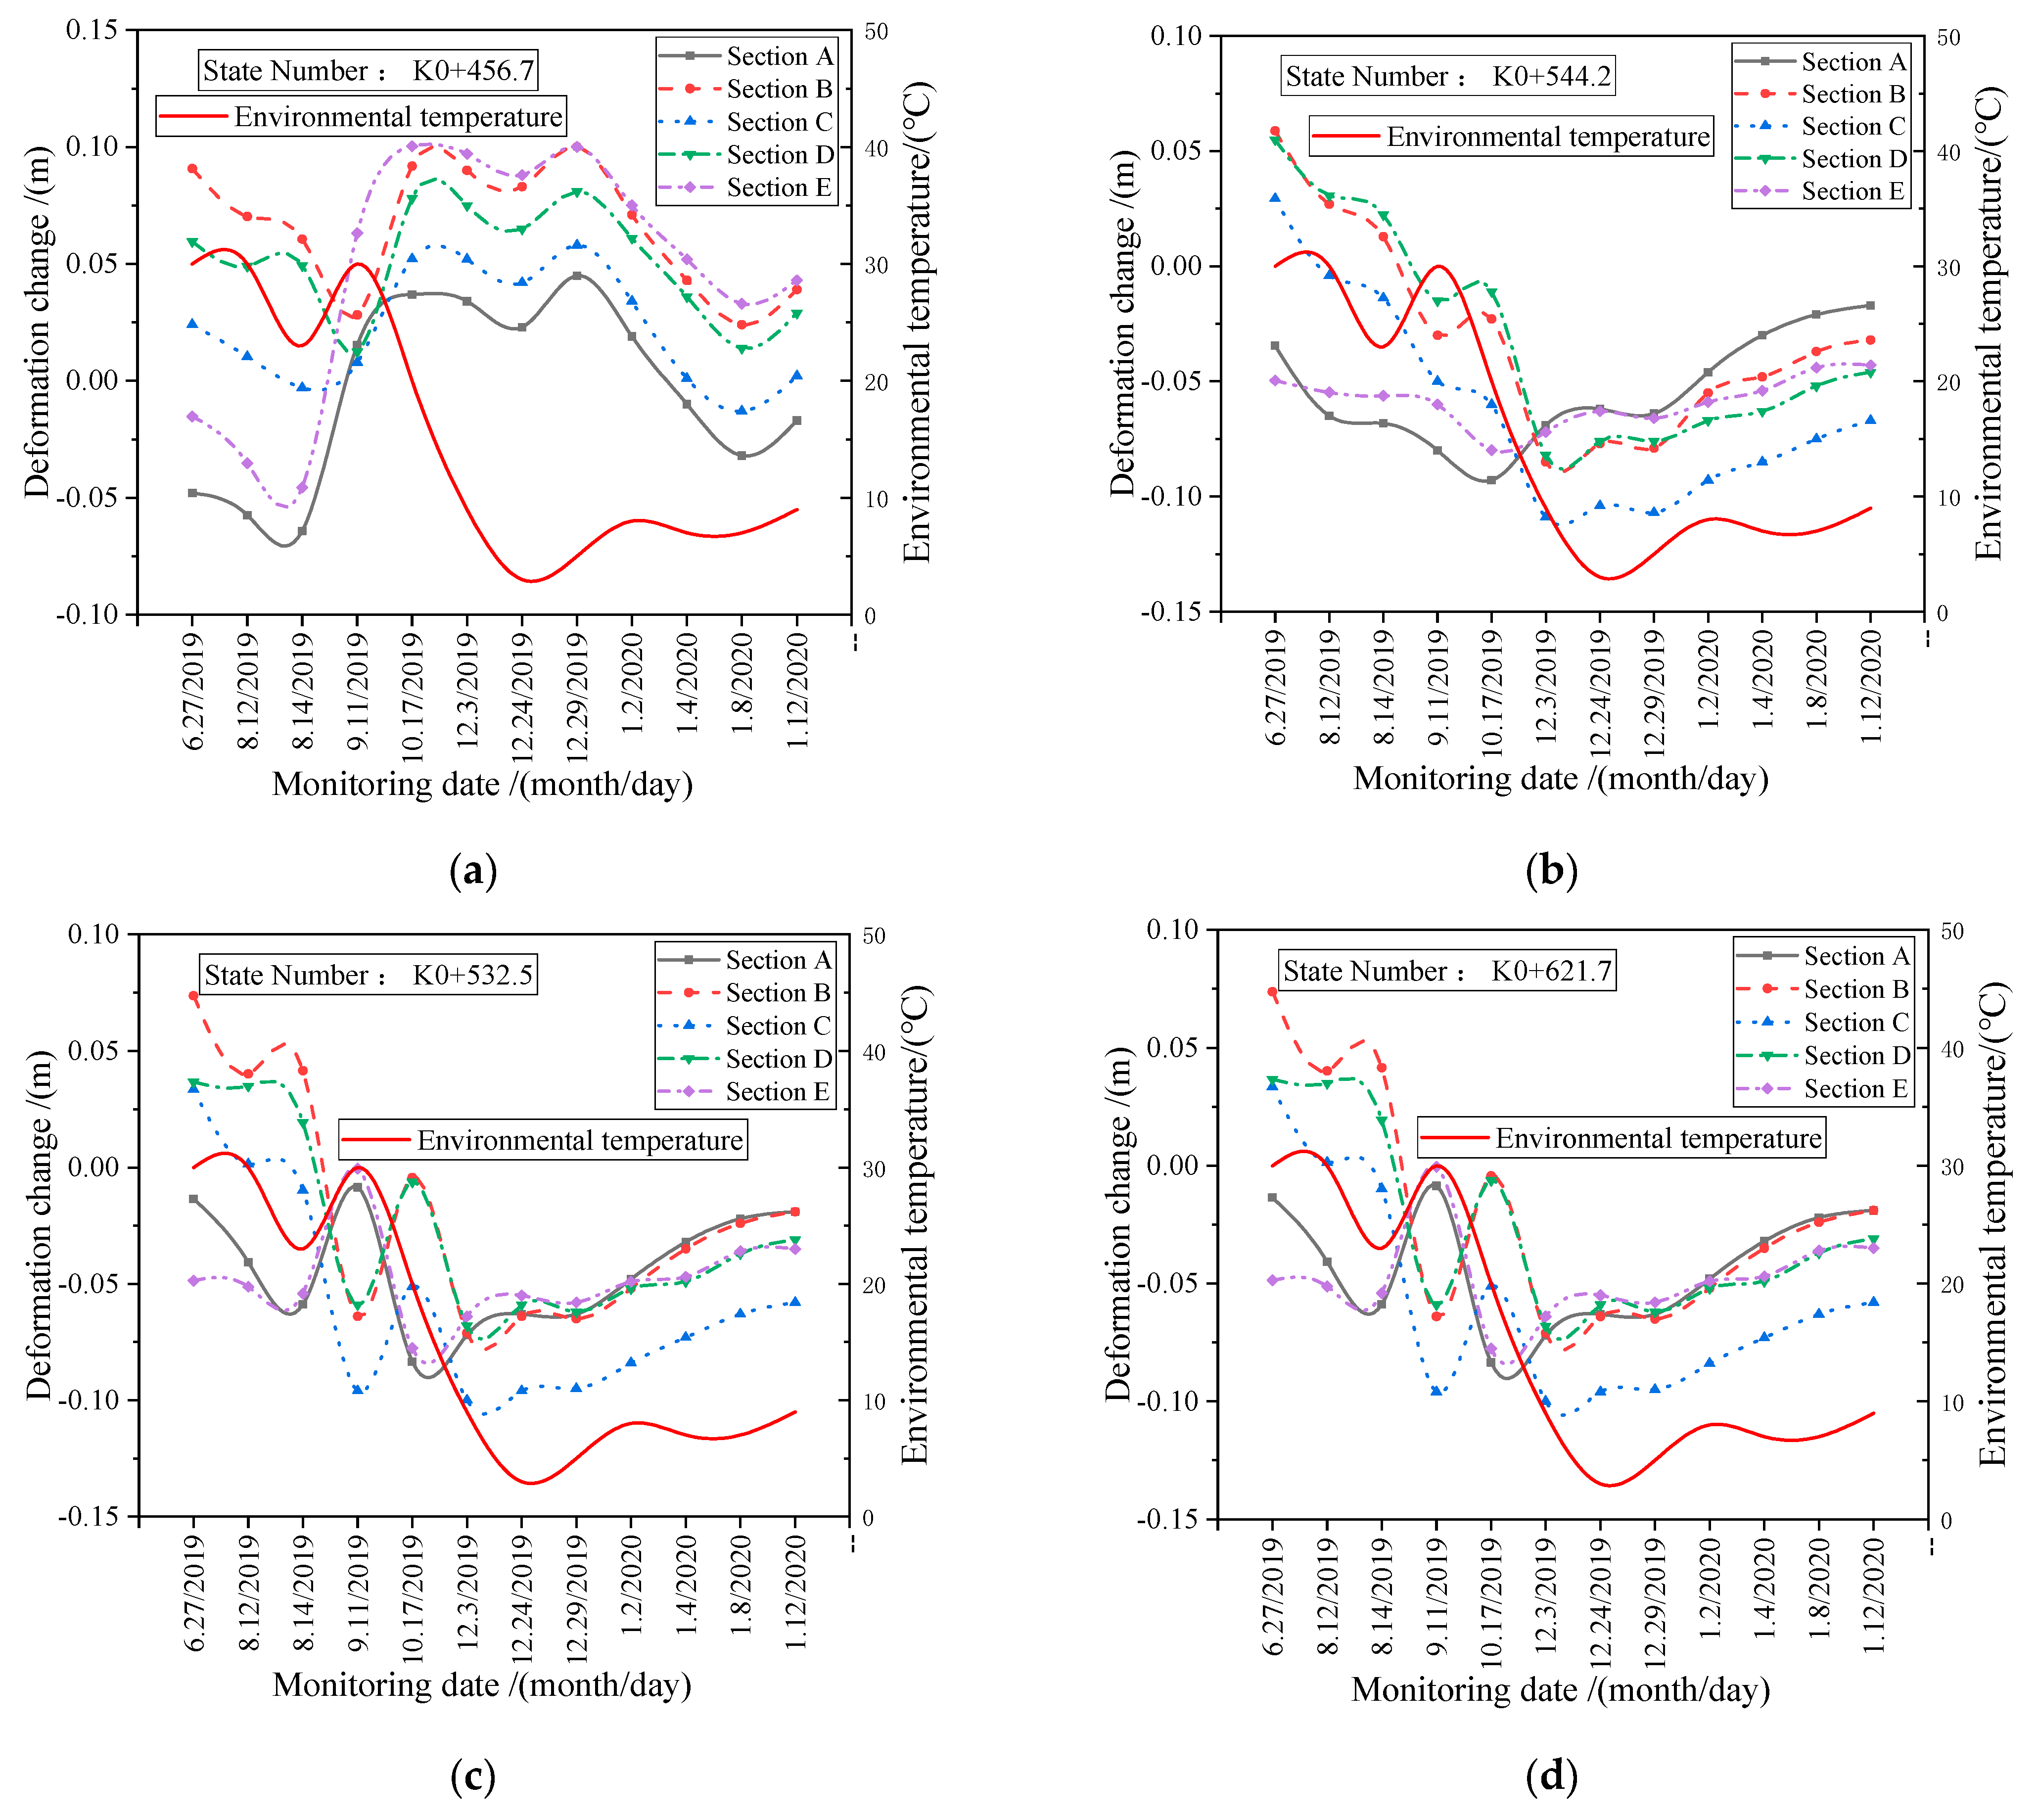
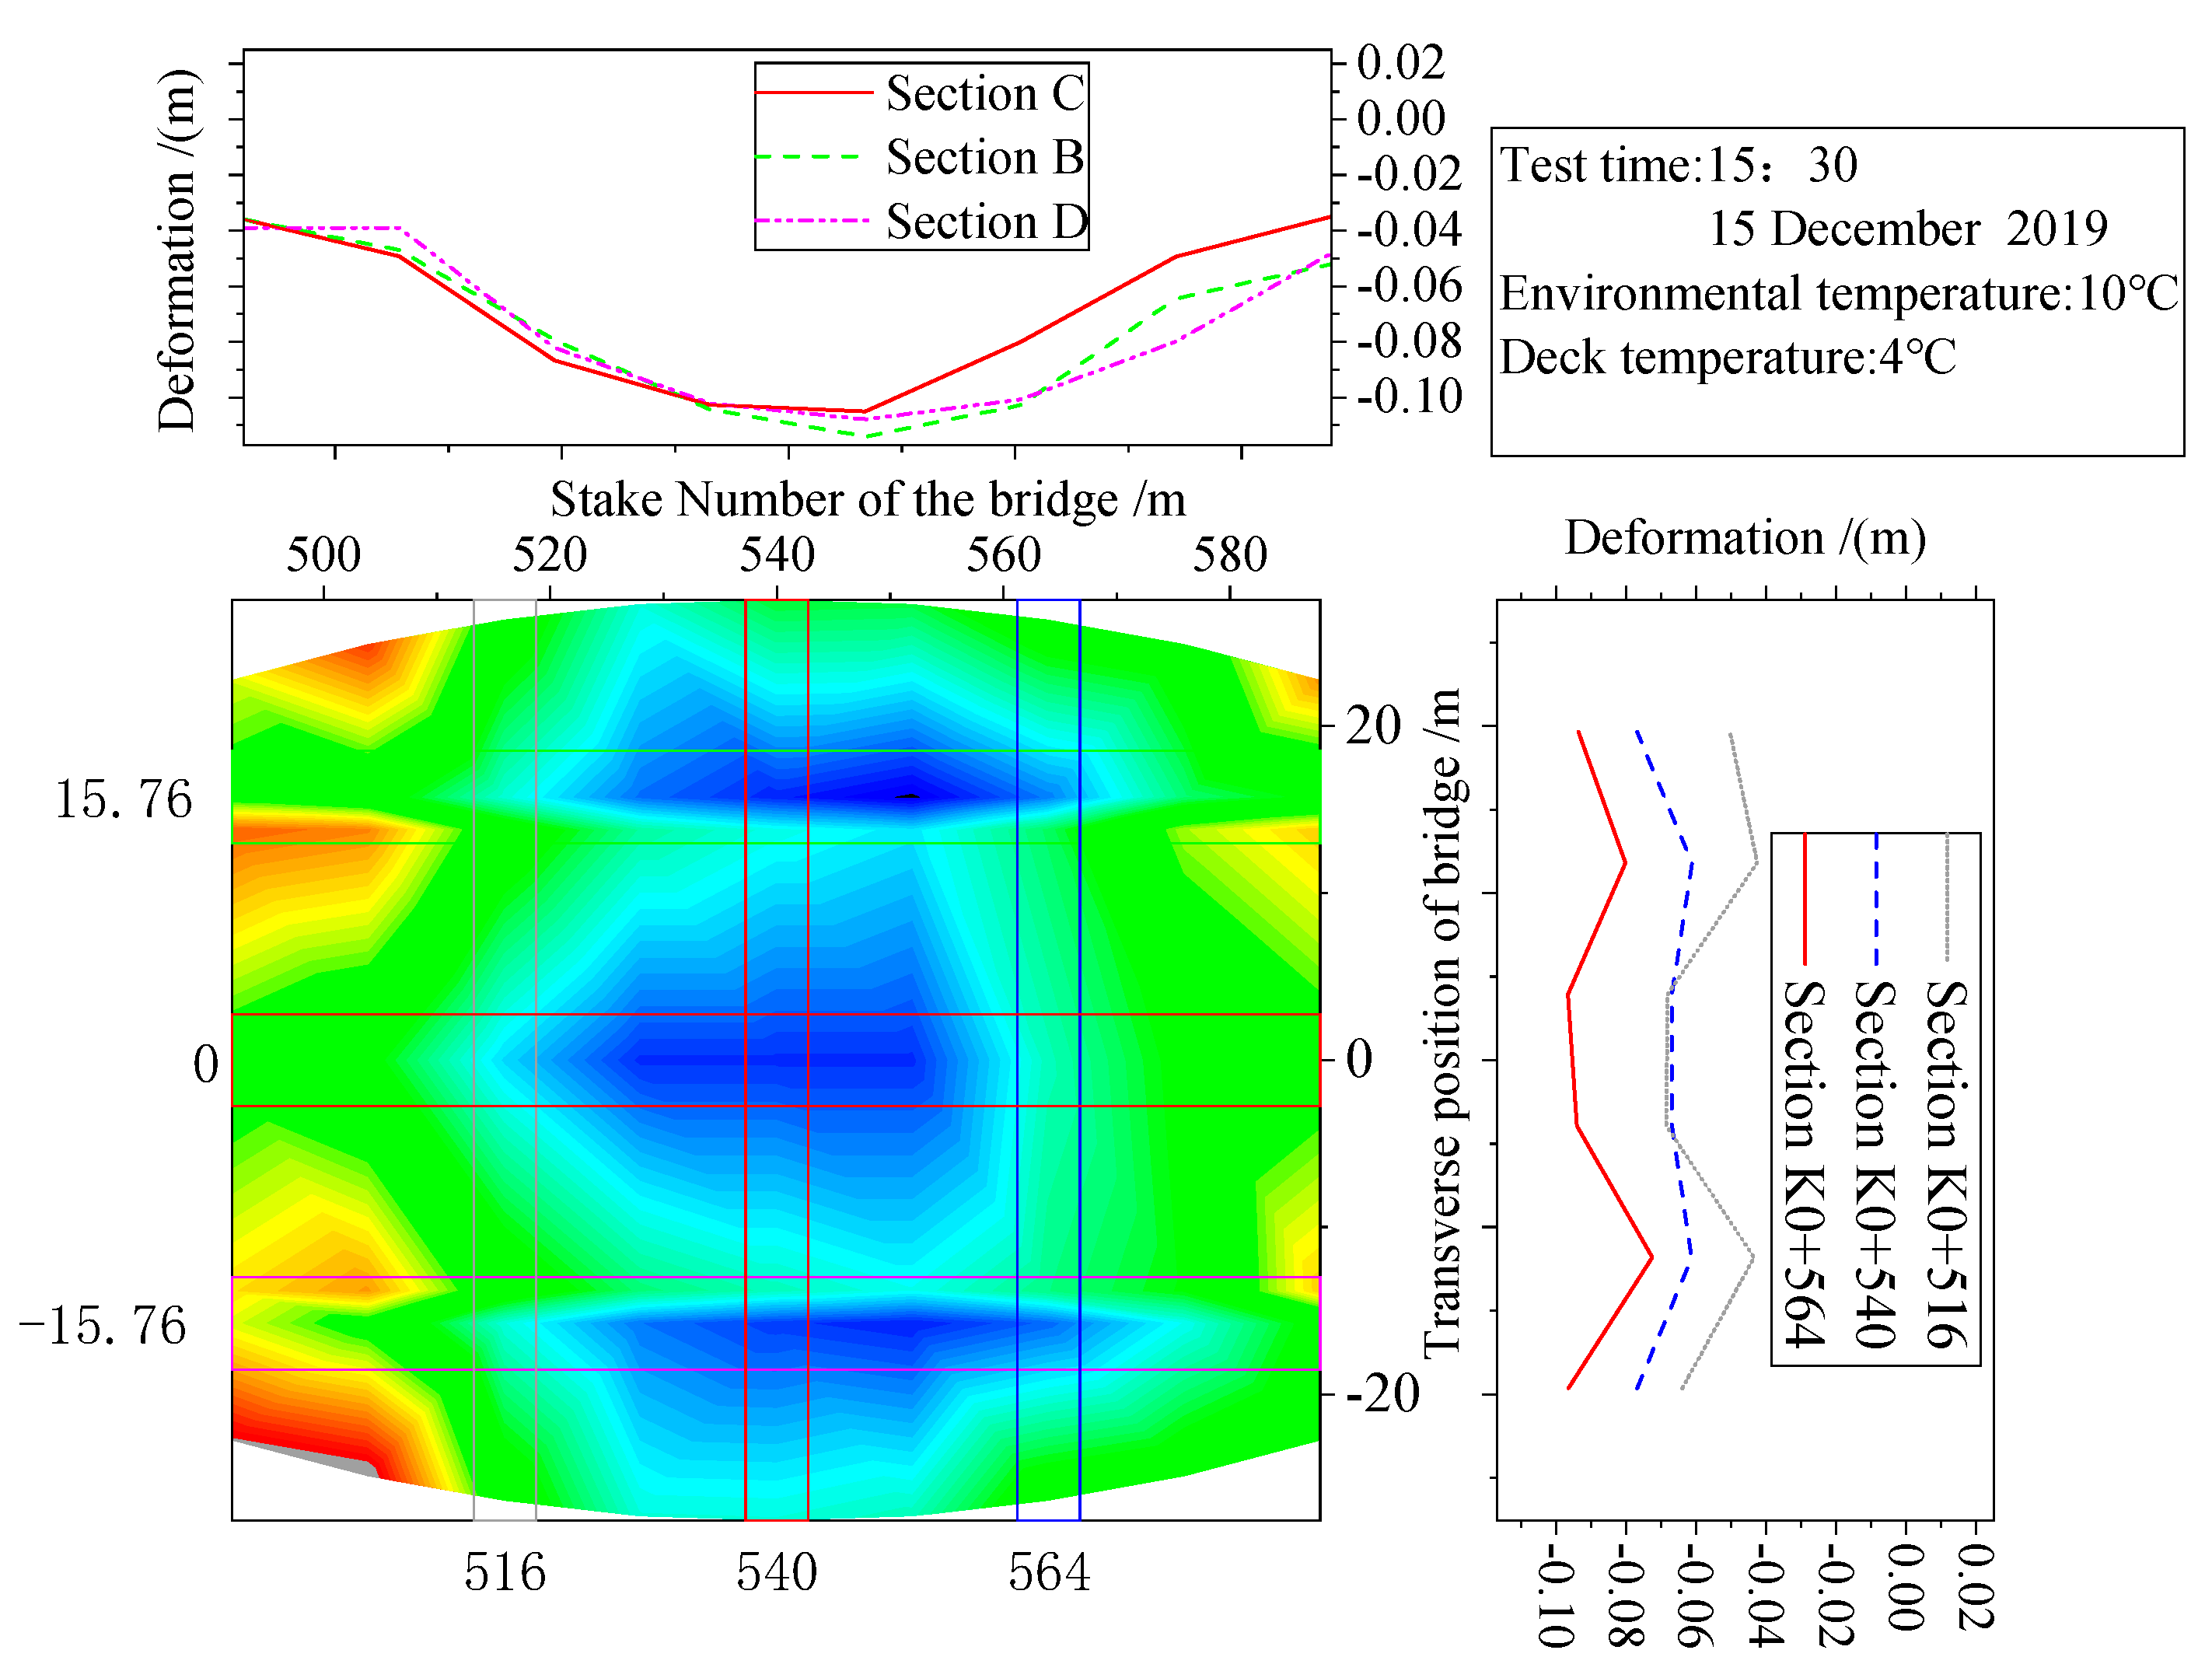
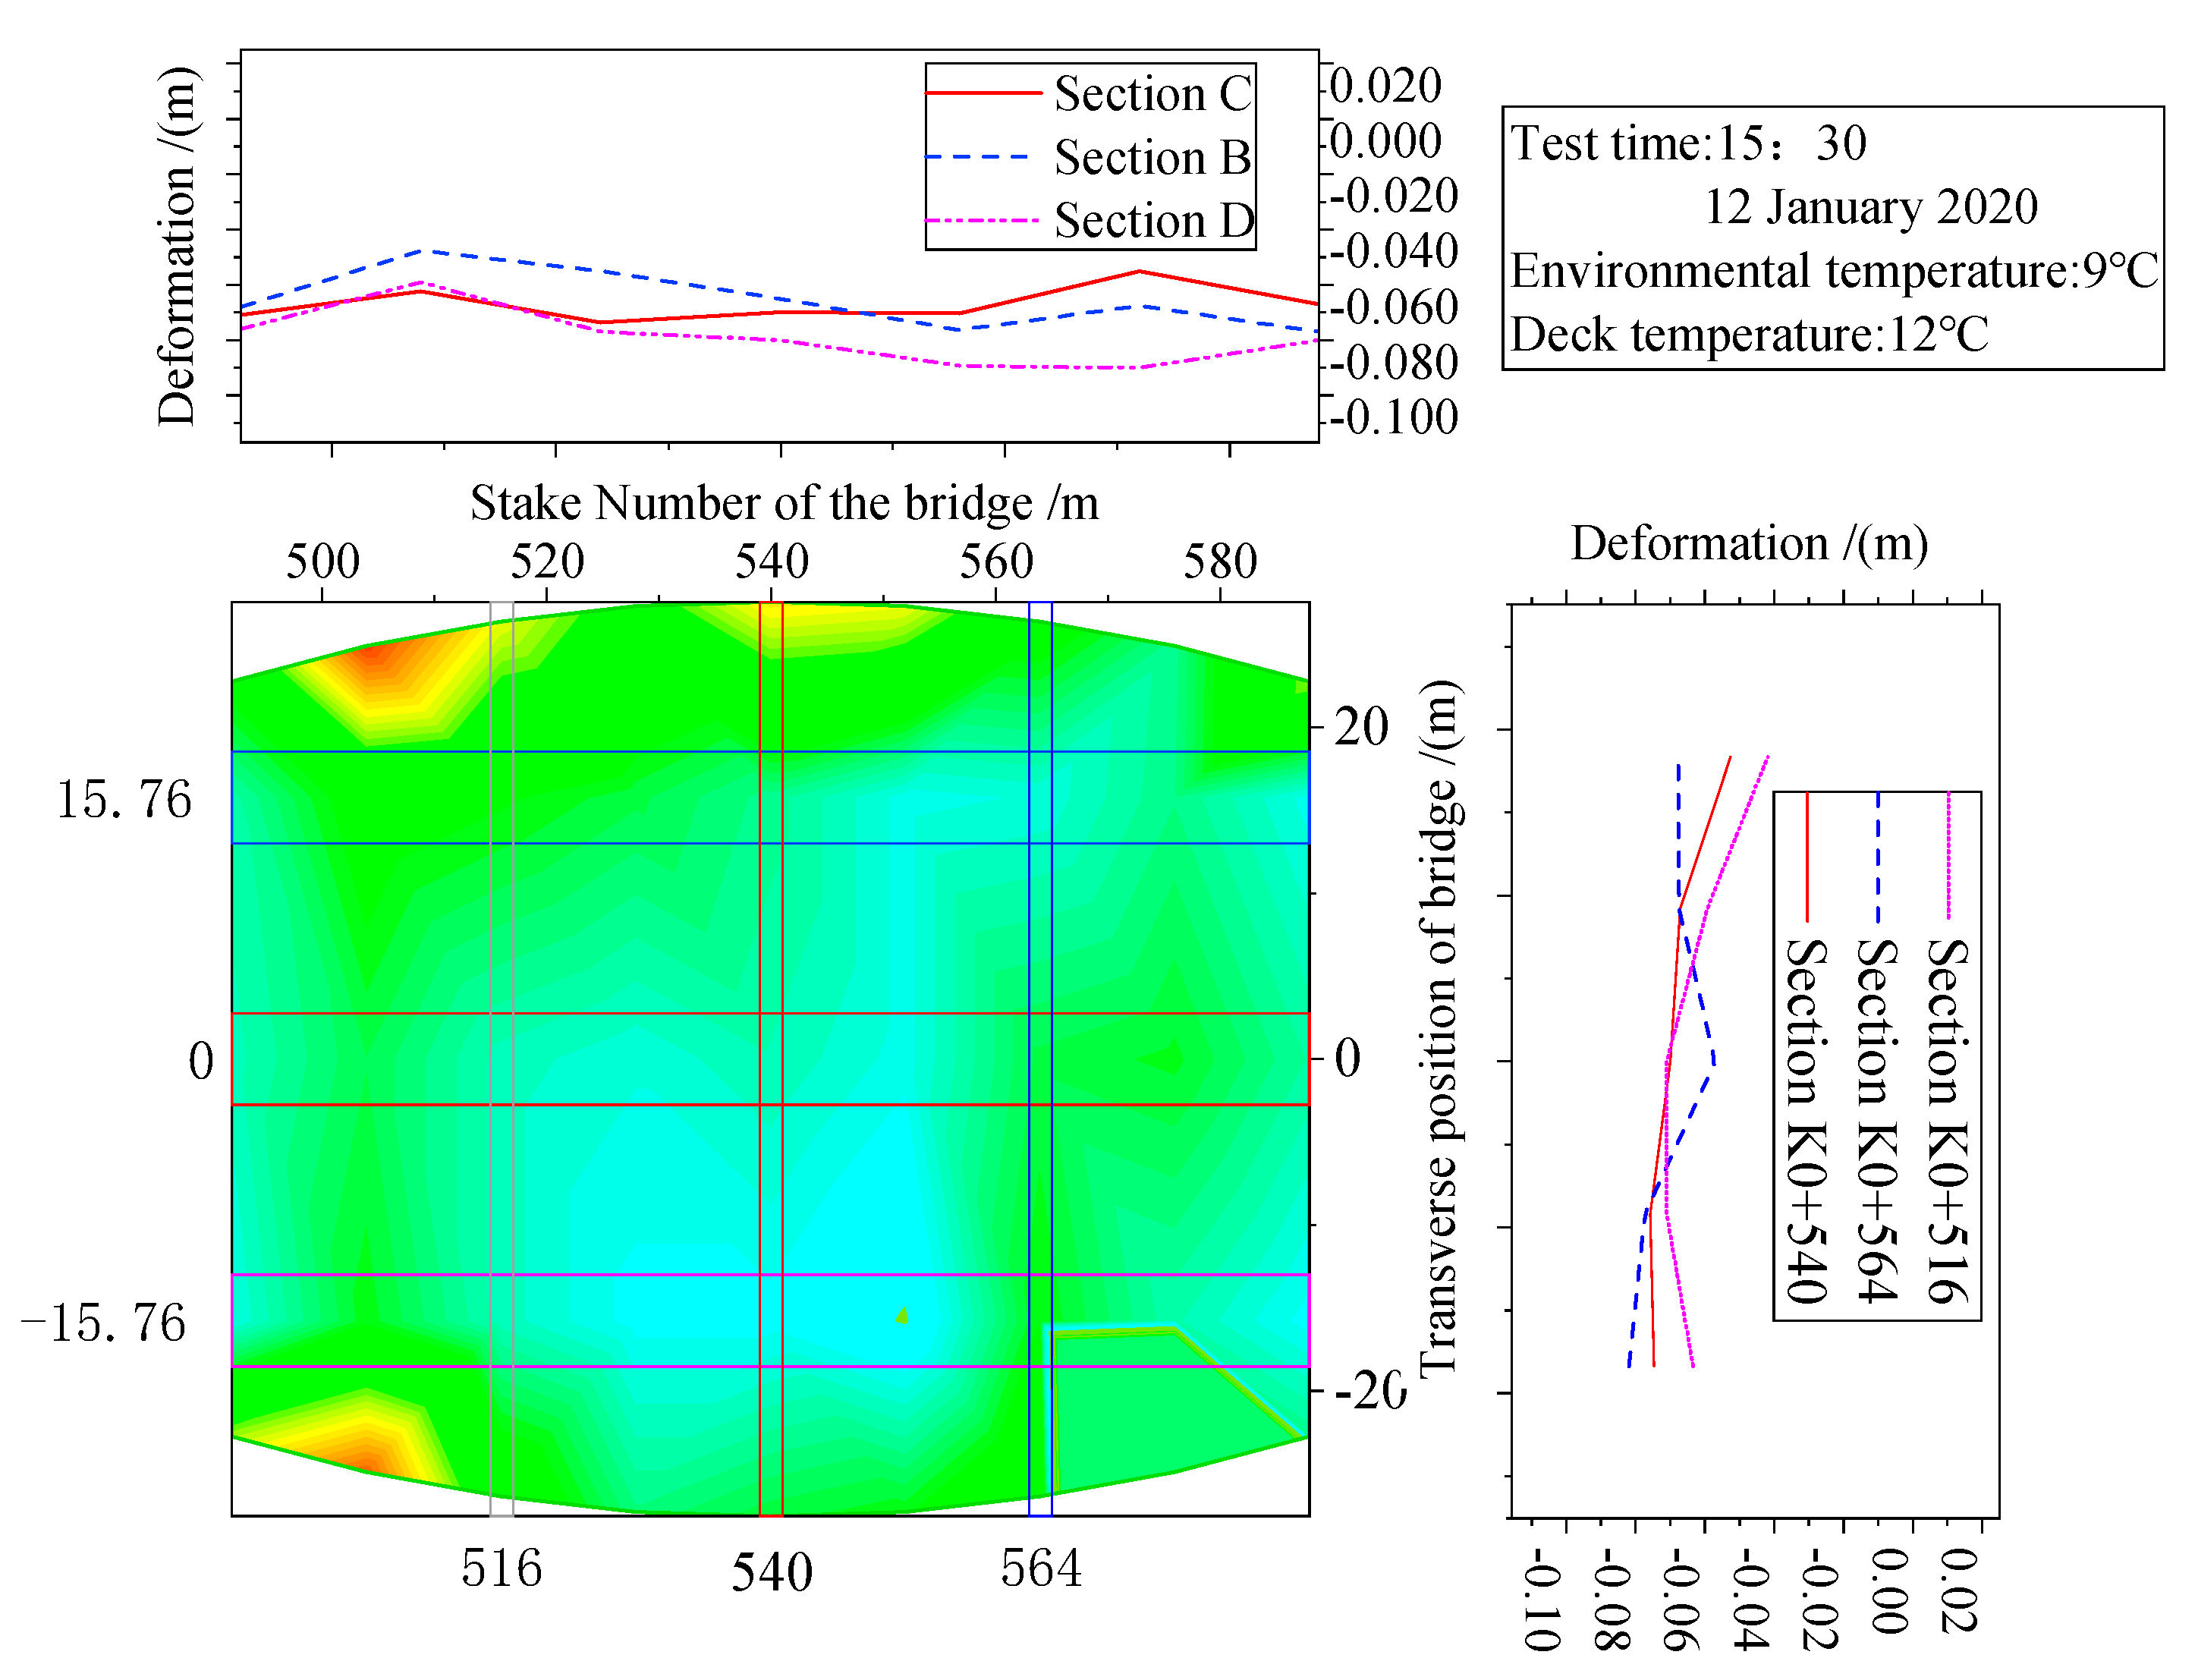
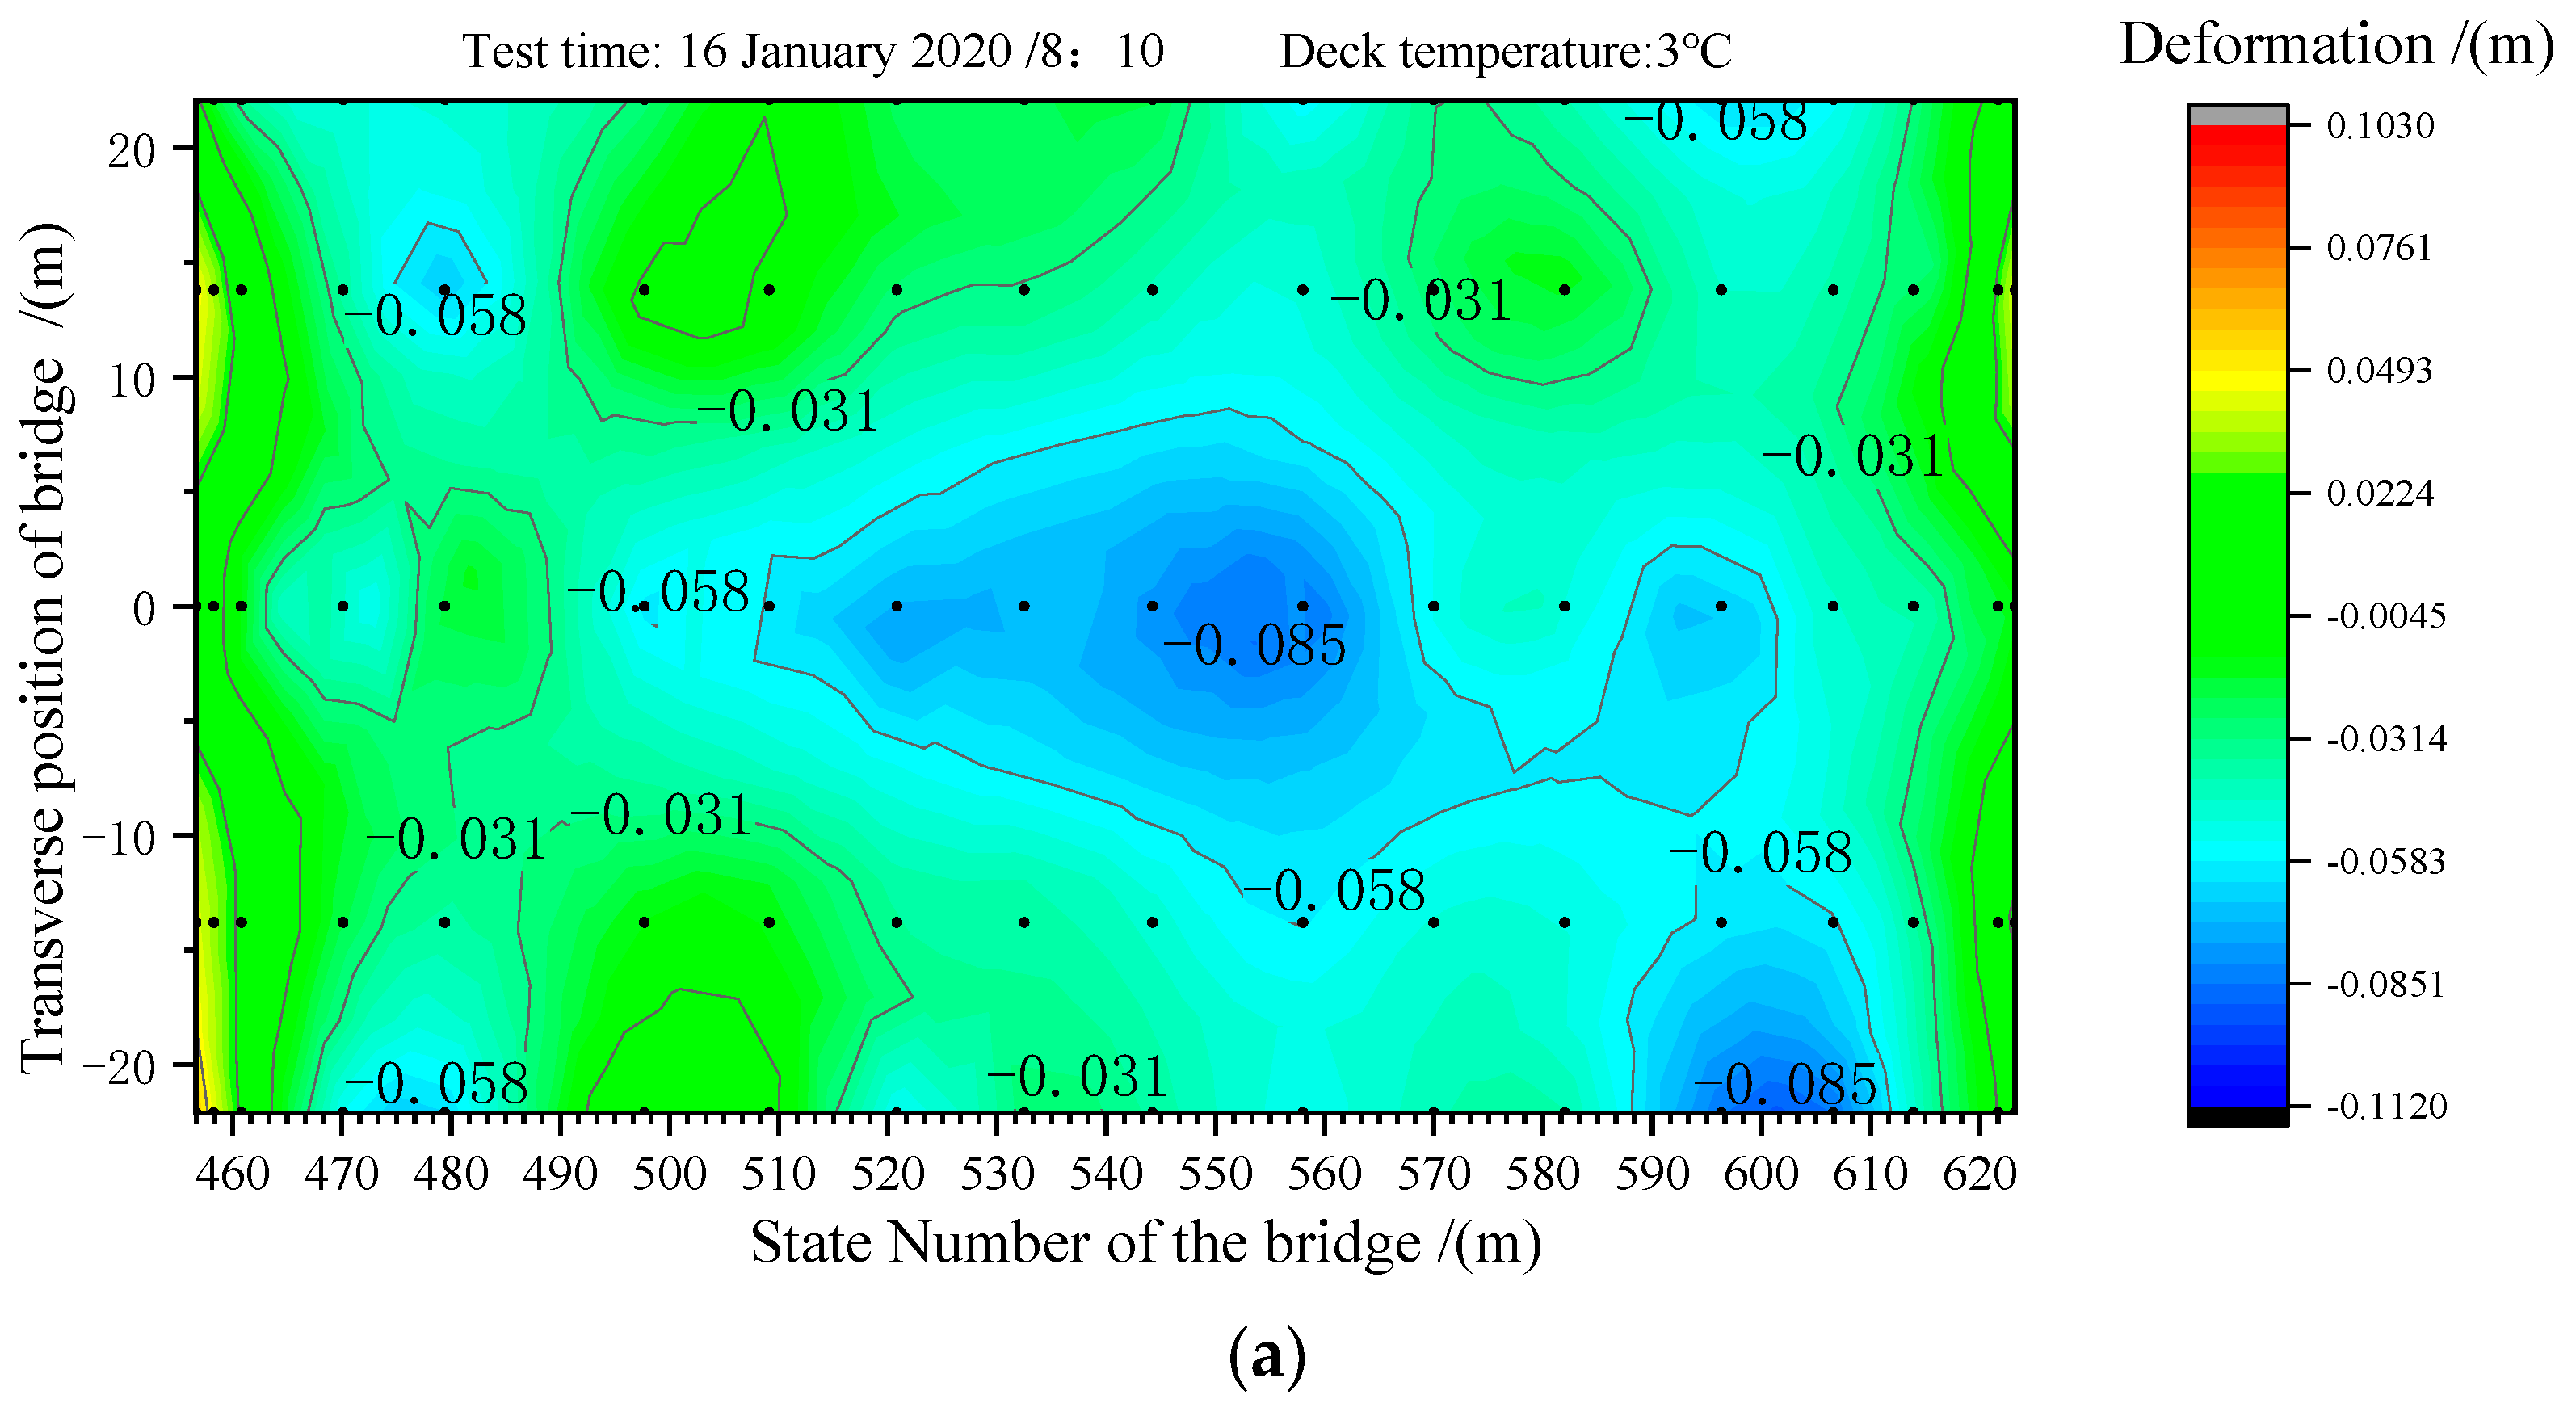
3.1. Result of Temperature and Deformation Monitoring

Heat transfer occurred between the steel bridge deck and box girder during construction. As the box girder was gradually closed, field monitoring mainly targeted the temperature changes of the steel bridge deck and box girder. Before monitoring, the environmental parameters were recorded by obtaining meteorological information. The initial temperatures of the chosen cross-sections were measured every day. The influence of the temperature field on the bridge mainly refers to arch ribs, box girders, and hanger rods. The temperature monitoring sections of the arch ribs were set in the arch foot, at 1/4 L and 1/2 L of the main and vice arch, with two temperature sensors for each temperature monitoring section. Temperature monitoring sections of the box girder were arranged at 1/4 L and 1/2 L of the bridge’s side span and middle span, with four temperature sensors for each temperature monitoring section. The temperature monitoring points are shown in Figure 7, Figure 8 and Figure 9.
The deformation monitoring points of the bridge deck were arranged in 20 sections along the bridge, and each monitoring section set five test points along the centerline of the bridge deck, ±13.8 m from the centerline and ±22.1 m from the centerline of the bridge deck. The detailed monitoring point positions are shown in Figure 10.
The steel box girder was installed in many divided parts in the field of the bridge location, as follows: the bottom plates were installed first, and then the diaphragm plates and the belly plates, and the top plates (deck) were installed last. Figure 11 shows the temperature measurement result of the deck and air temperature in one day. After 9:30 A.M., the deck temperature was 12 °C higher than the air temperature in 1 h, which indicated that the heat absorption speed of the deck was very fast.
Figure 12 shows the monitored temperature of different parts of the bridge in one day (on 21 August). Figure 12 indicates that the rate of temperature increase on the deck was the fastest among all the parts, the rate of temperature increase on the bottom plate was the slowest, and the maximum temperature difference between the bridge deck and the bottom plate was 35 °C. This result indicates that if the deck was installed at a time with a high temperature on a hot day, while the remaining parts of the box girder were installed at a time with a lower temperature, once the bridge temperature reached uniformity during that night, the cooling value of the bridge deck was substantially higher than that of the remaining box girder.
Figure 13 shows the deck elevation at the hanging points under different temperatures. The deck elevation was set according the theoretical elevation which considered the determination of the pre-camber before the typhoon. It can be seen that the lower the bridge deck temperature is, the lower the bridge deck elevation near the mid-span is, and the deck elevation is lower than the theoretical elevation after the typhoon, and thus cannot recover to its position before the typhoon. Combined with the damage to the frame scaffolding on the day after the typhoon struck, the unrecoverable deformation would be preliminarily due to the sudden change in the temperature field of the steel box girder; therefore, both the temperature field of the steel box girder and the status of the frame scaffolding could not be restored to the initial condition of before the typhoon struck.
Figure 14 shows that the deformation change of the bridge deck at the end beam of the steel box girder was mainly affected by the temperature field. On the same day, the vertical deflection trend was consistent with the cooling trend of the bridge deck. The higher the temperature, the greater the vertical deflection, and the largest vertical deflection was 0.06 m.
After the first-phase stretching of the hanger rods, abnormal deformation still existed, which led to the bearings at the end of the box girder separating the box girder and the pad stones, with a maximum separated value of 8 cm, as shown in Figure 6. From the monitoring results (tested on 21 October 2019) shown in Figure 15, the distribution of the abnormal deformation was as follows: under different temperatures, for the section at the end of the side span it was from 1.5 cm to 7.8 cm higher than the design elevation, the section of the middle span was 6 cm to 8 cm below the design elevation, and the abnormal deformation directly affected the subsequent deck pavement and line shape of the bridge. The final welding phase of the top plate was from April to June, with the environmental temperature ranging from 25 °C to 42 °C.
To determine the exact causes and change rules of abnormal deformation after the typhoon, the historical deformation monitoring data of steel box girders were analyzed in this paper.
Figure 16 shows the deformation monitoring historical curves of the end of the box girder above abutment #1 (bridge state location K0+ 458.8). Figure 17 shows the deformation monitoring historical curves of the box girder at the mid-span of the main span. Figure 18 shows the deformation monitoring historical curves of the end of the box girder above abutment #4 (bridge state location K0+ 621.7). Figure 16, Figure 17 and Figure 18 show that the line shape was stable during the assembly stage of the box girder and the pre-stress of the tie bars. On 12 August 2019, when Typhoon Lekima arrived, the deformation monitoring historical curves of the end of the box girder above abutments #1 and #4 suddenly changed upwards. On 4 September 2019, the deformation of the box girder decreased after the demolition of the frame scaffolding of the middle span. After the second fine-tuning of the stretch of the hanger rods on 23 September 2019, the deformation returned to a certain extent. The deformation monitoring historical curves show that the deformation of the box girder fluctuated with the temperature on different dates. When the temperature dropped to 9 °C on 7 November 2019, the warping of the end of the box girder above the abutment was particularly obvious. The ichnography of the box girder’s deformation after the frame scaffolding’s demolition is shown in Figure 19. The most significant deformation of the middle span is 0.085 m, and the shape of deformation appears to be ‘a lid cover’.

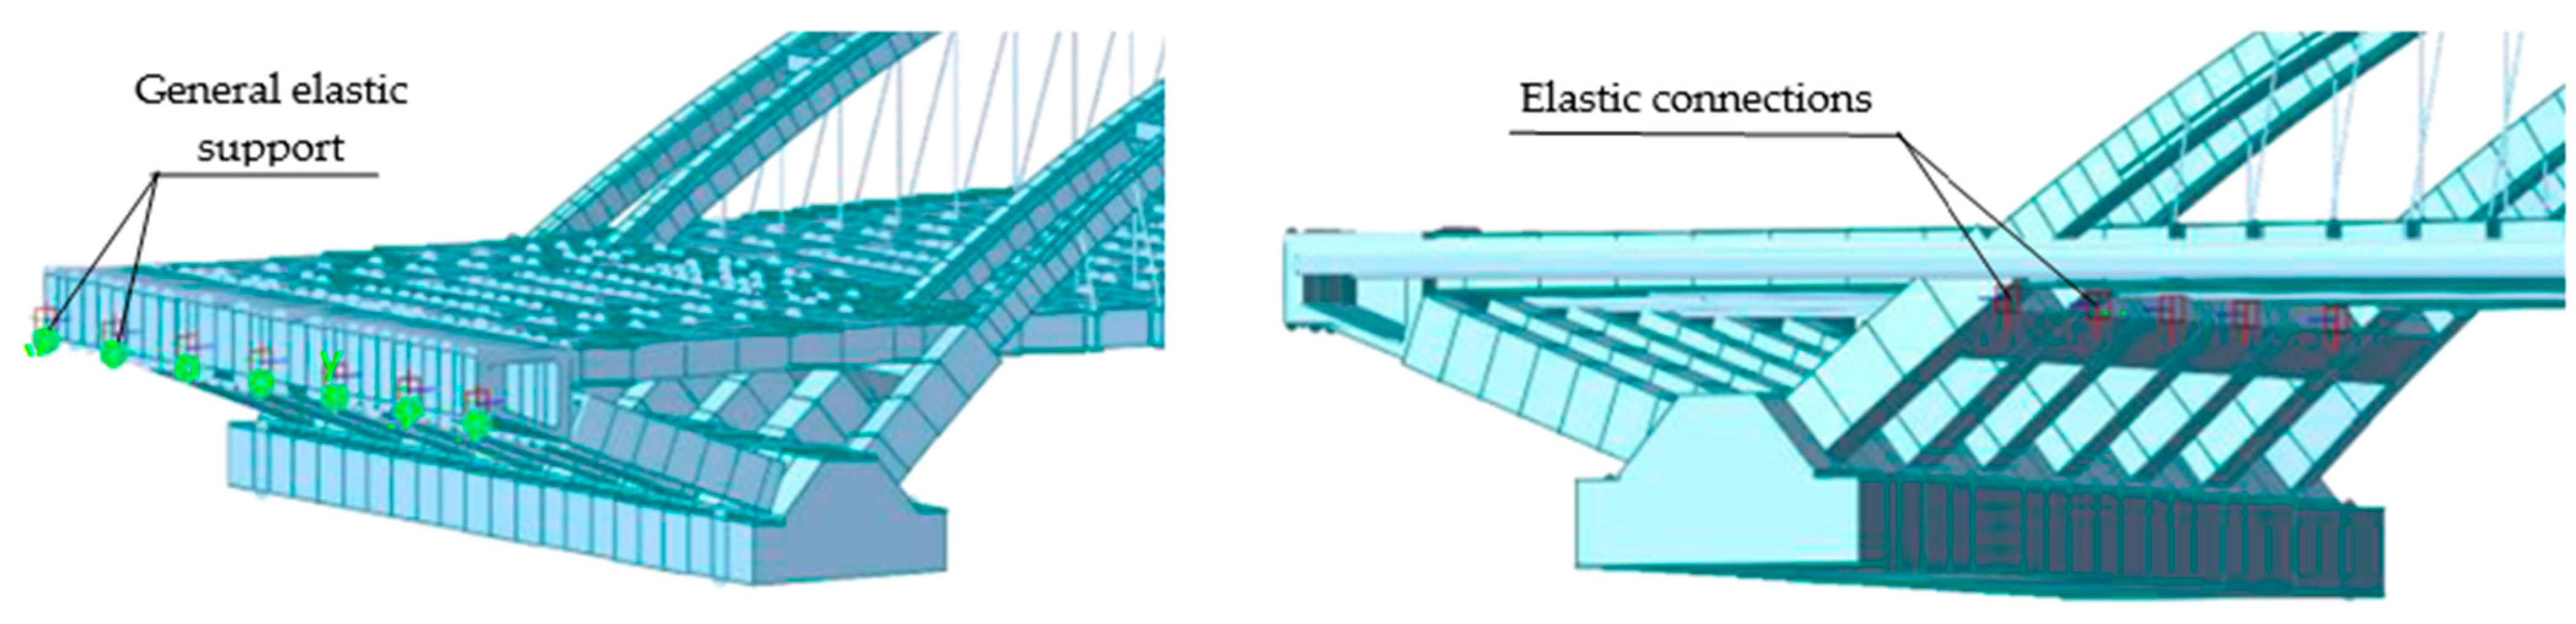
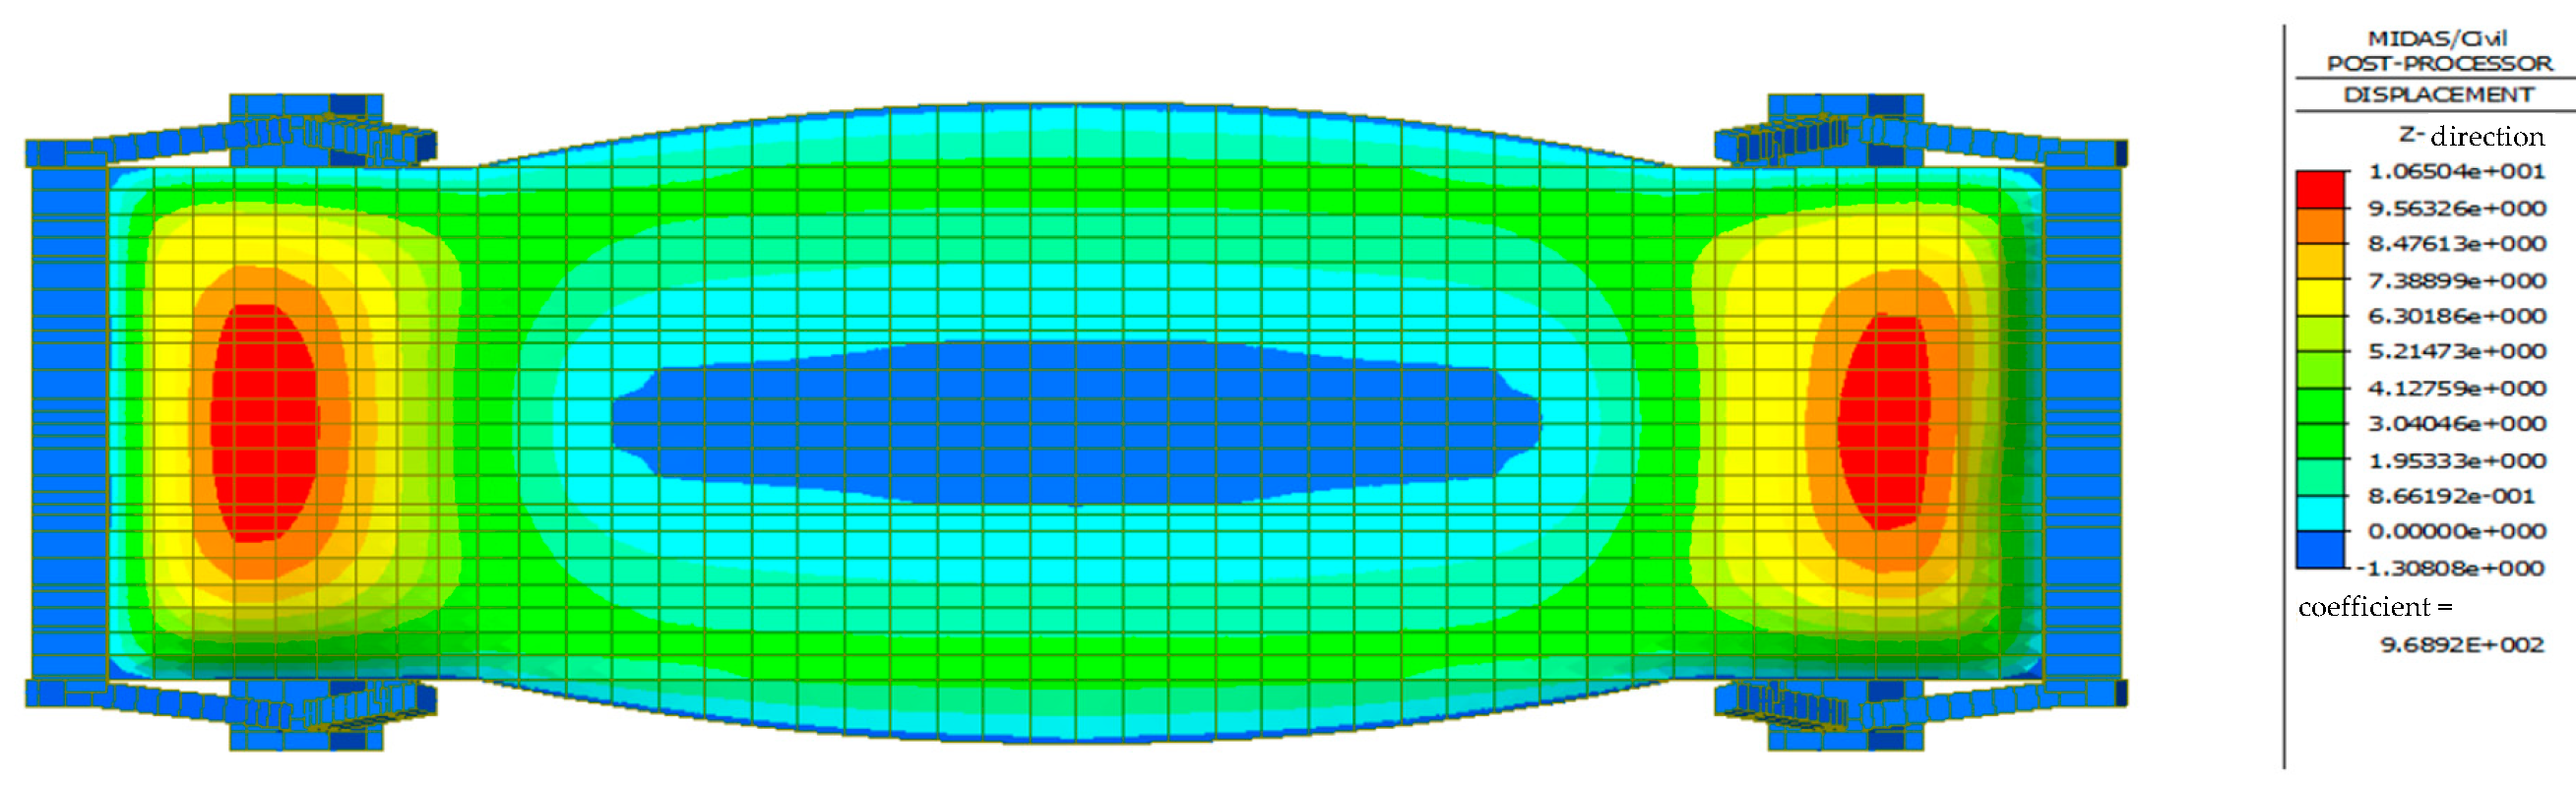
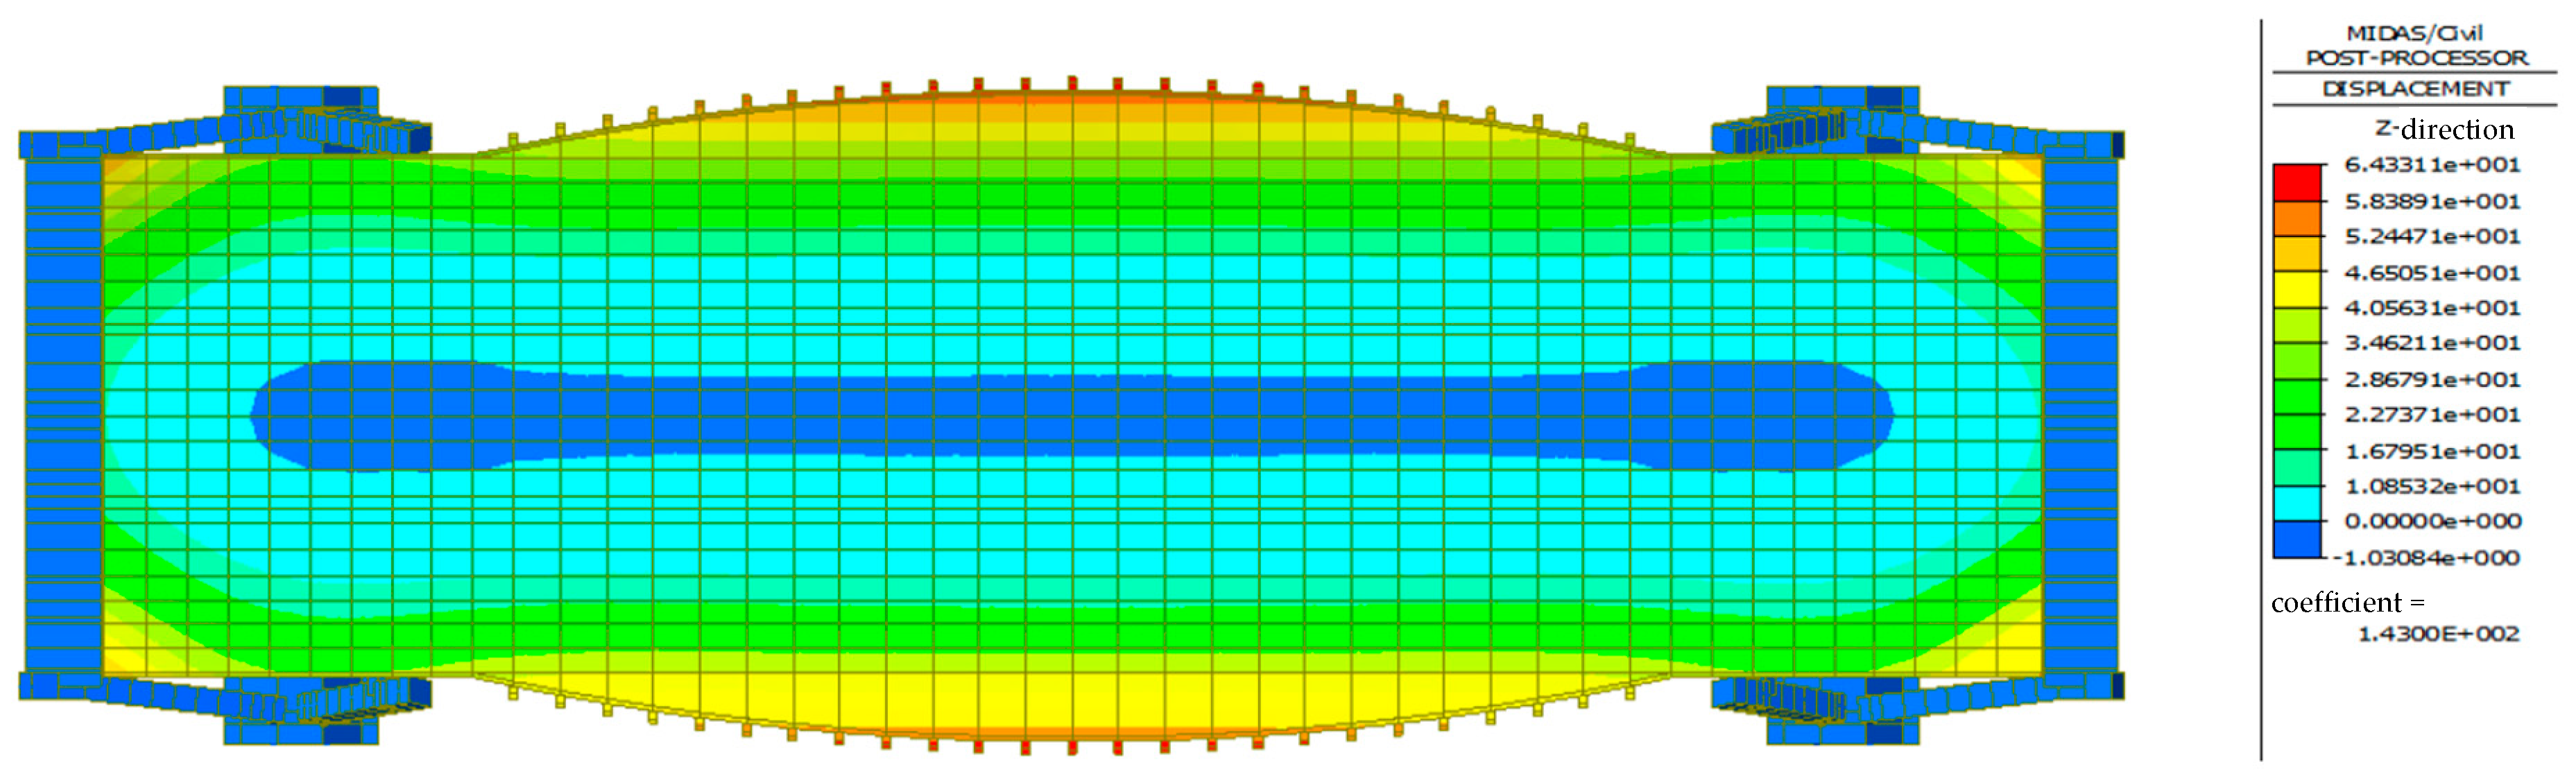
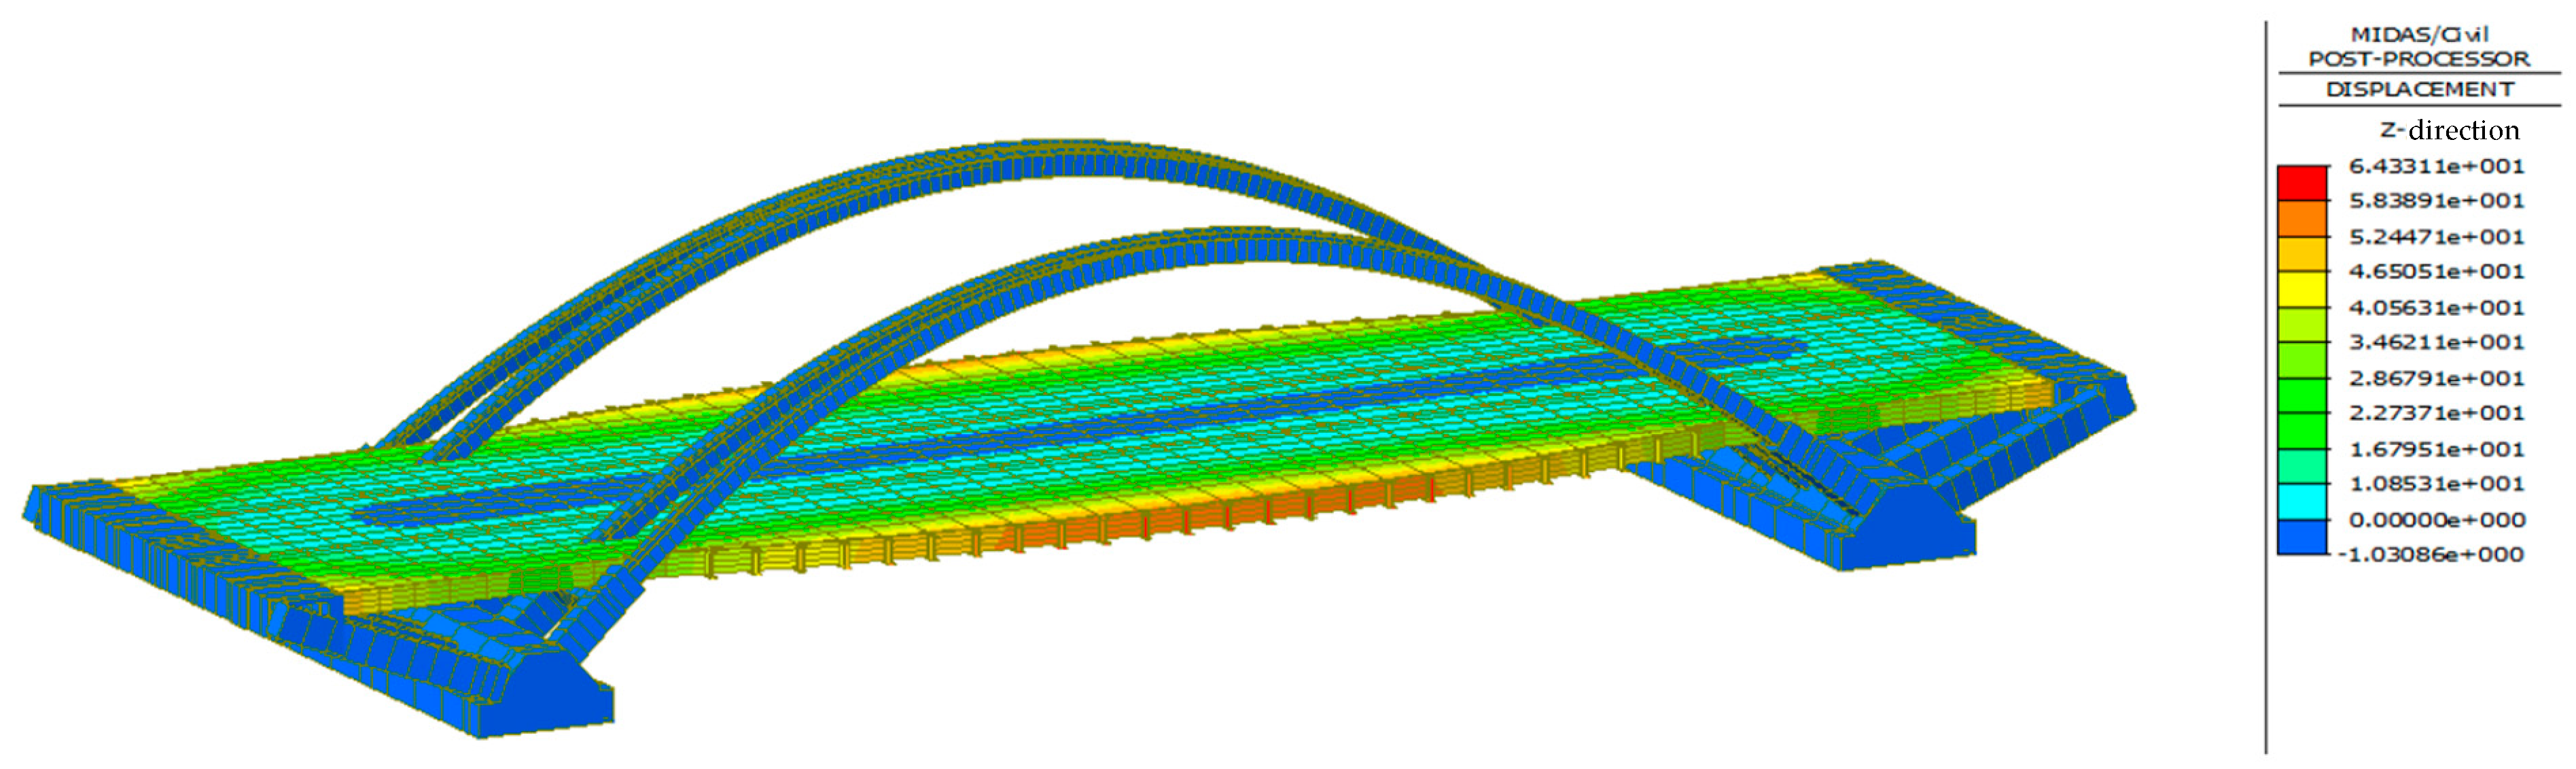
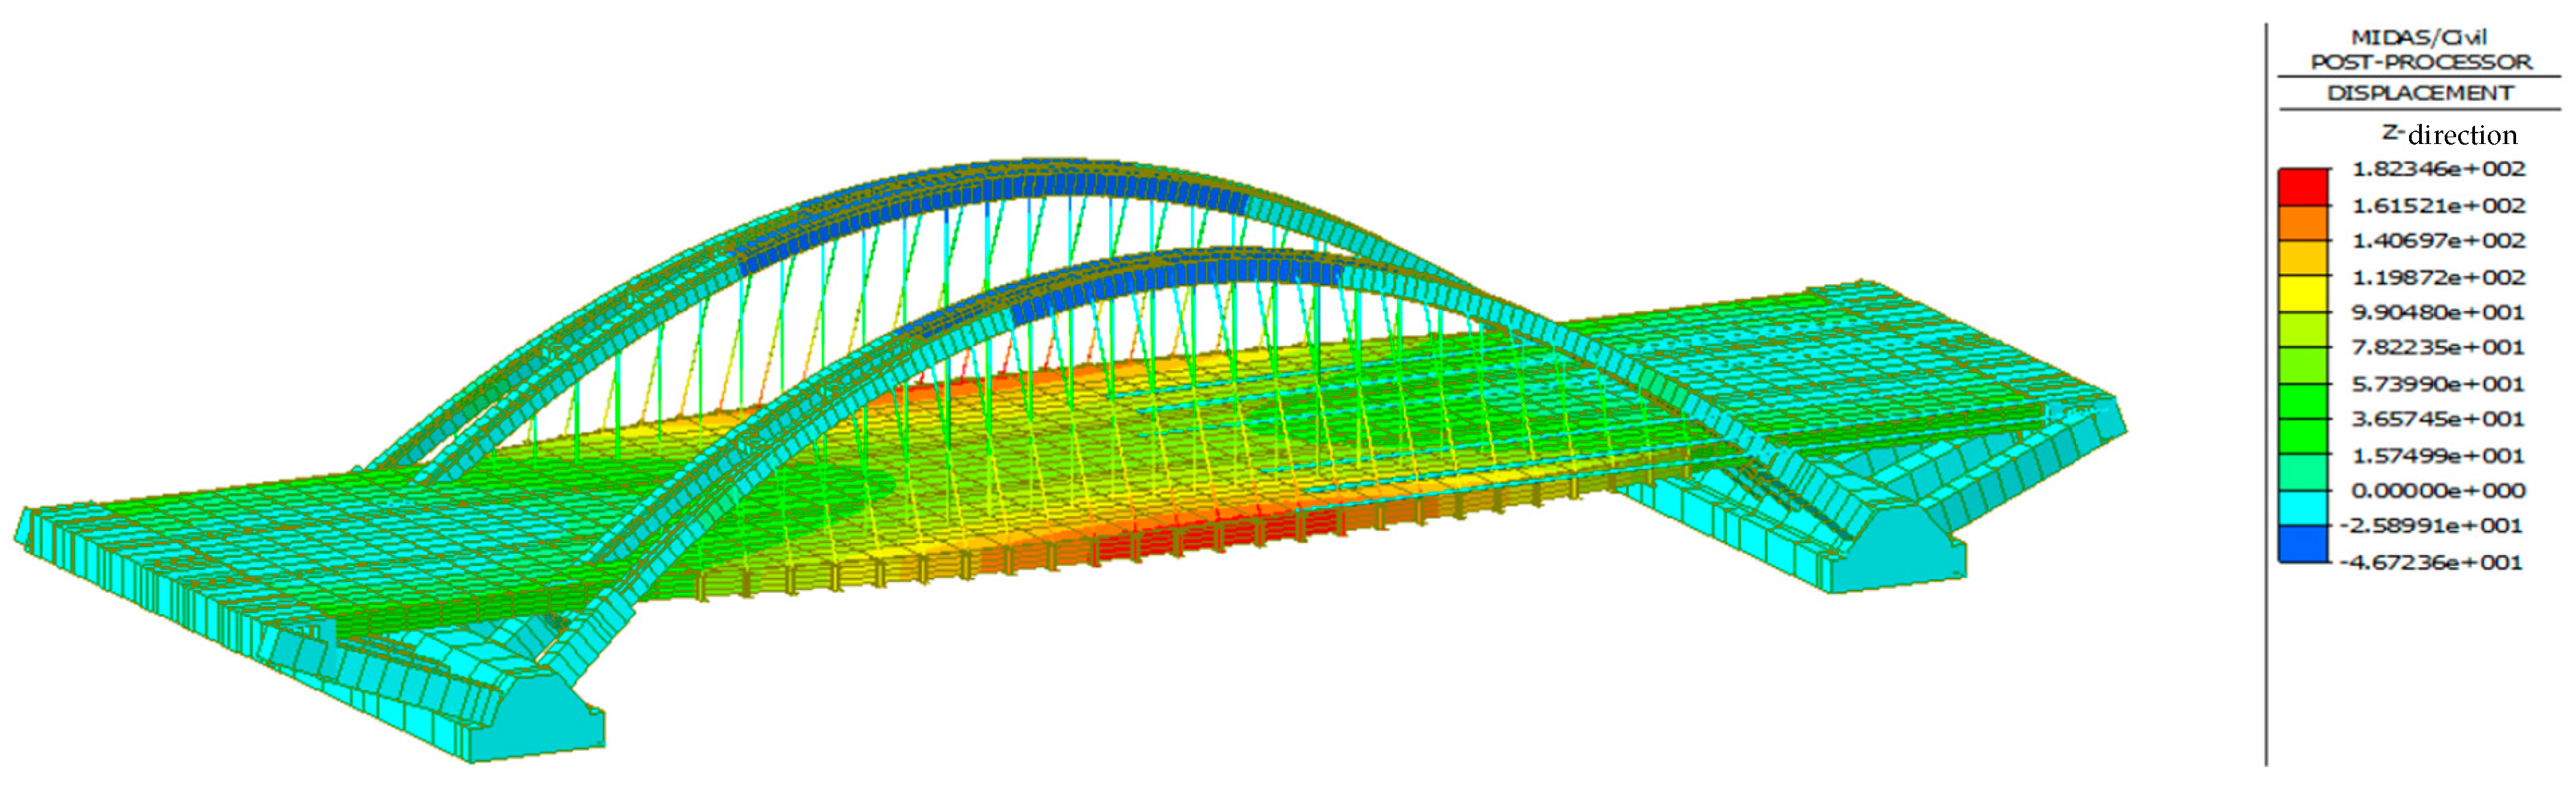
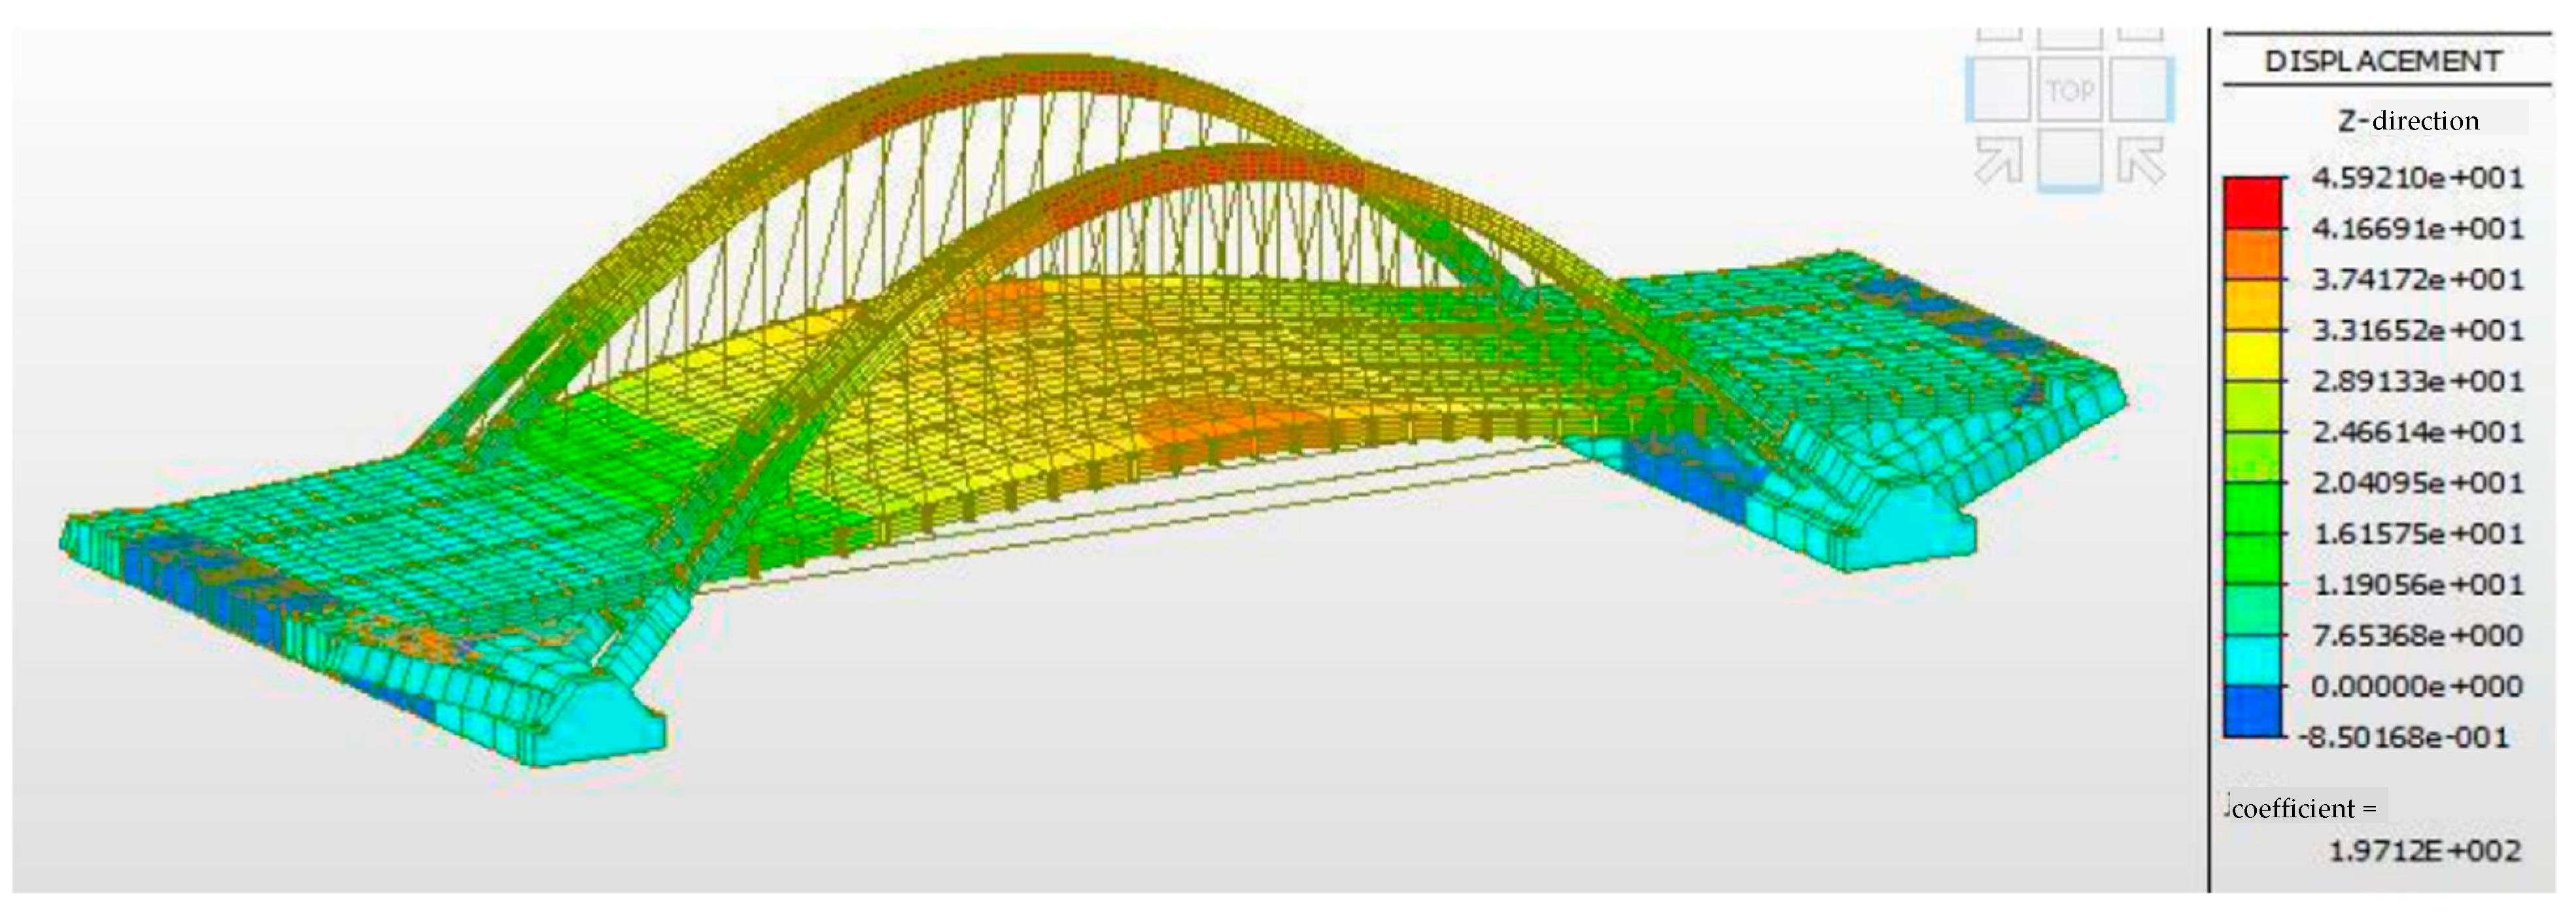
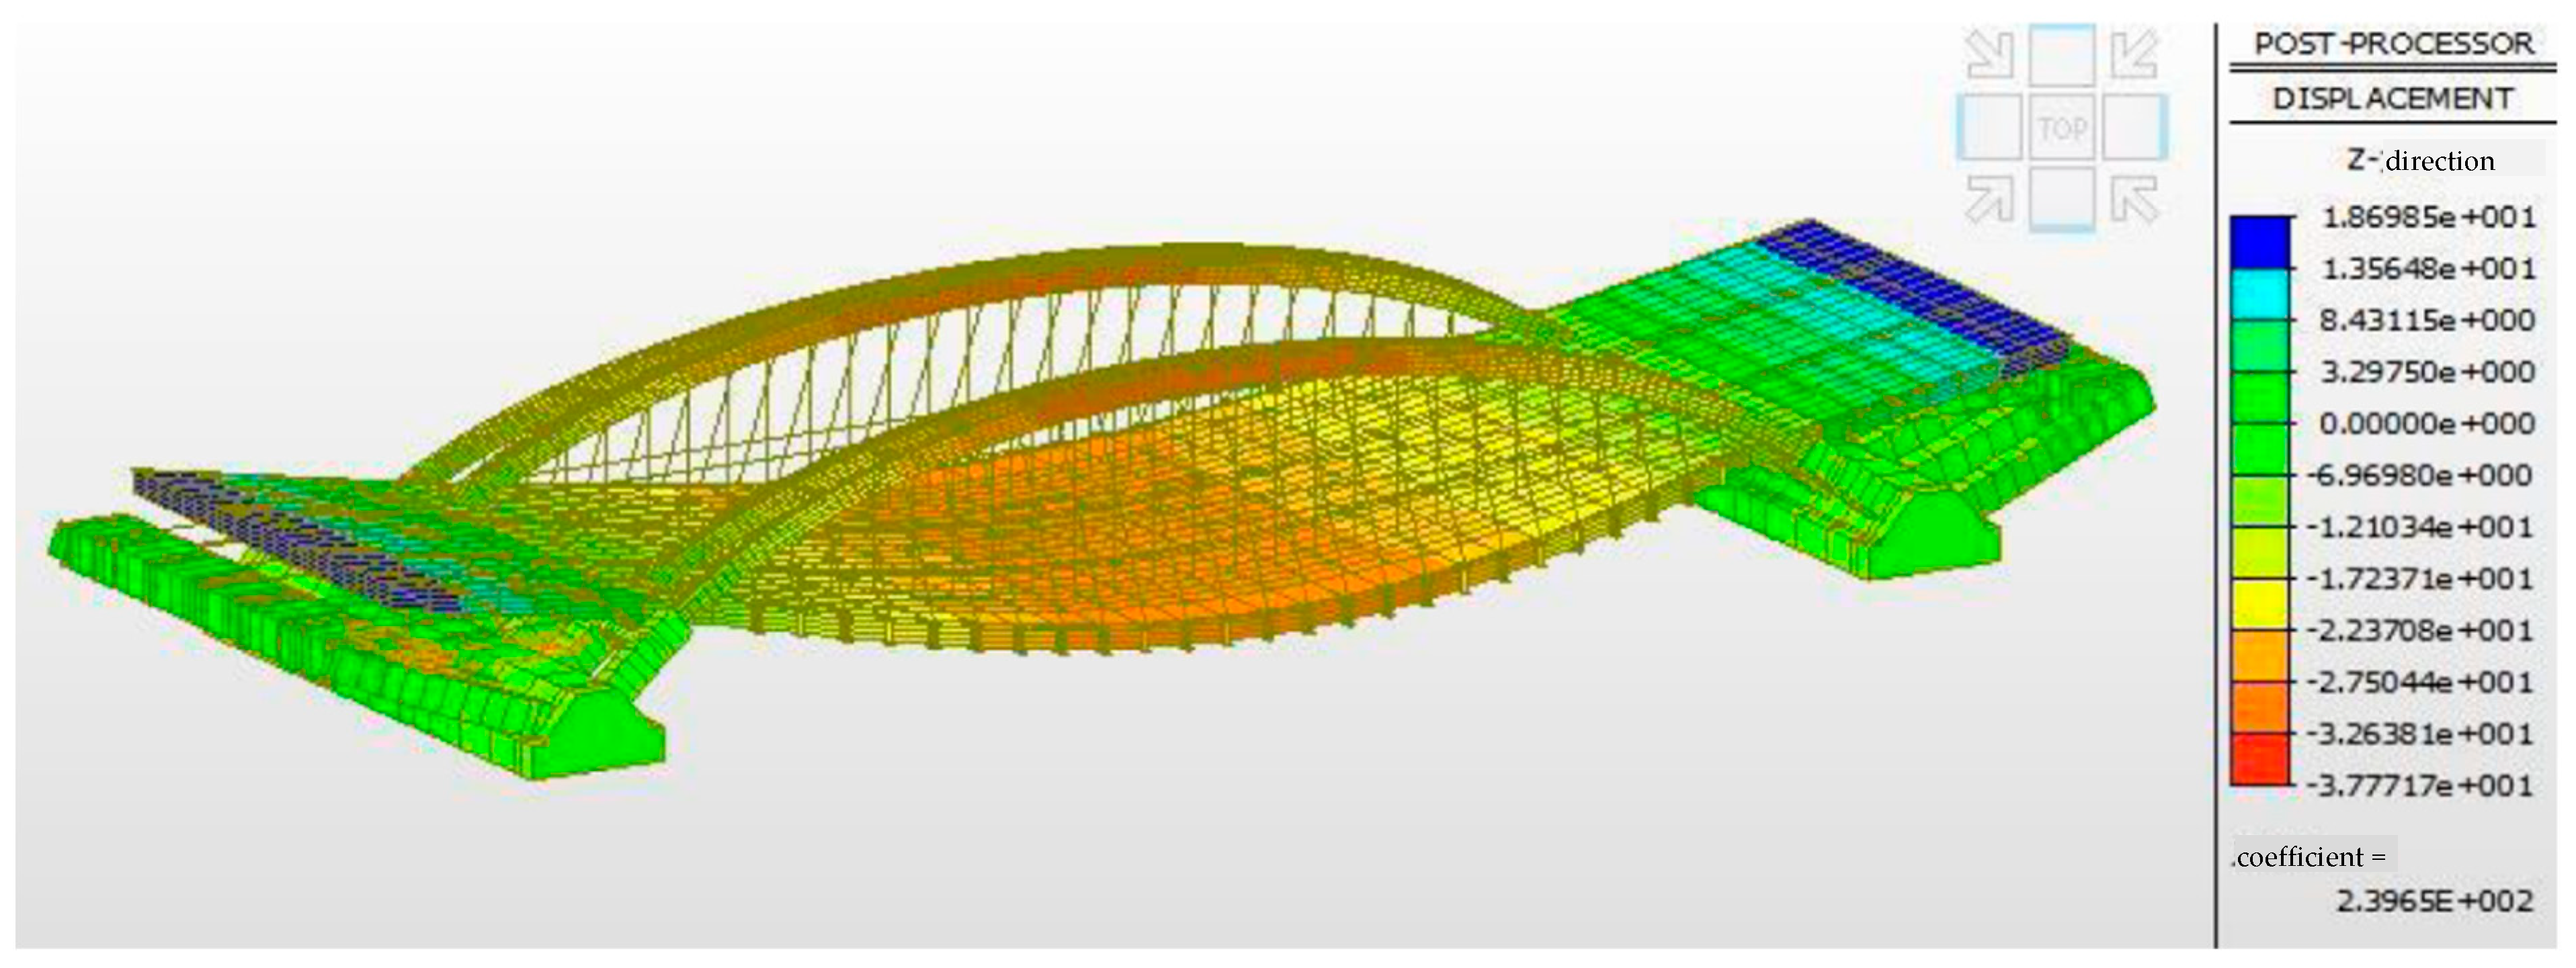
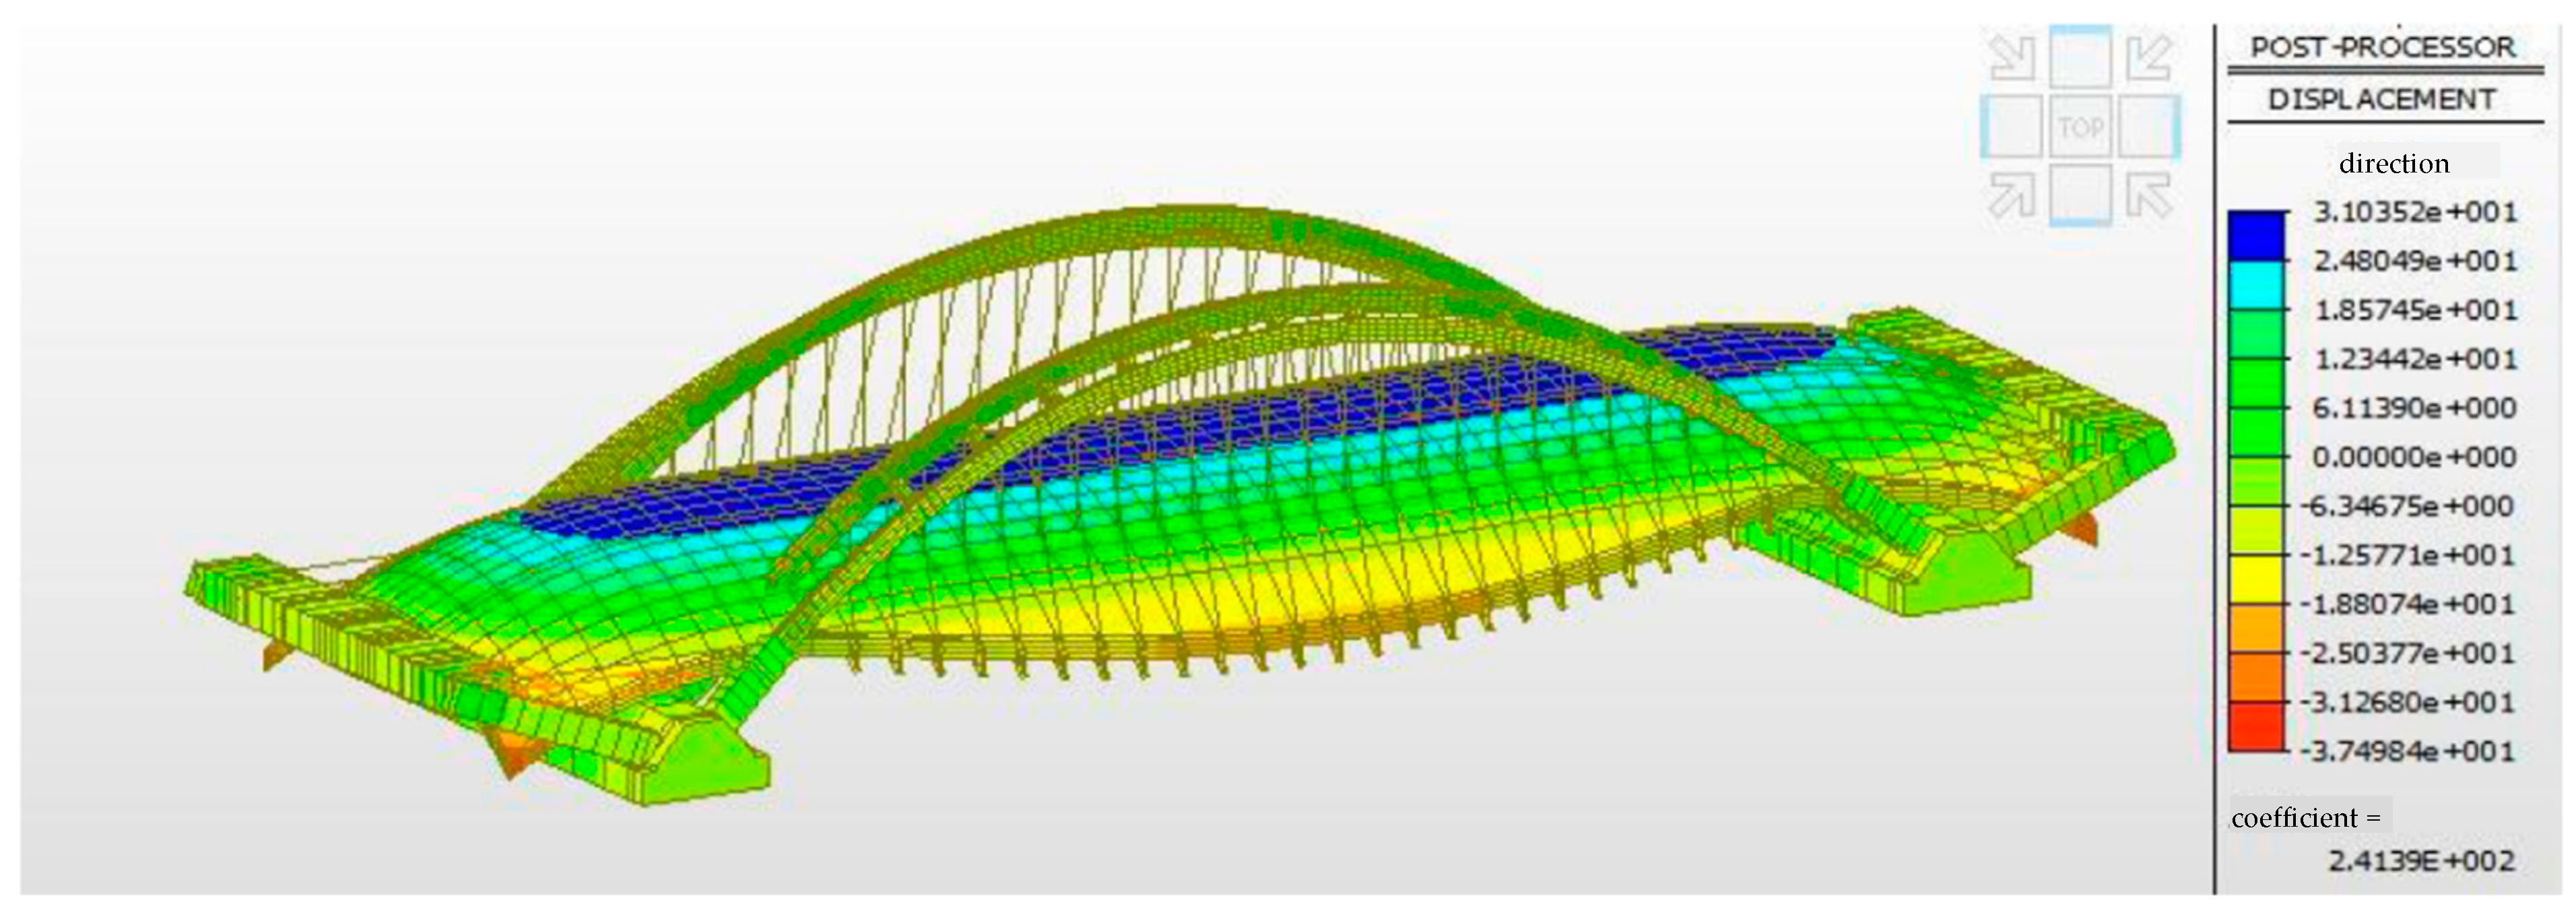
3.2. Numerical Analysis Results

To further analyze the mechanical behavior of the abnormal deformation caused by the sudden temperature drop after the typhoon, an FE model, as shown in Figure 20a, was developed and established by Midas Civil to compare the monitoring results. The steel box girder was discretized by four-node thick-plate elements in the element library of the software, as shown in Figure 20a. The arches and wind supports were simulated by beam elements, and the ties and hang rods were simulated by truss elements. Then, loads of the self-weight of the box girder, arch rib, wind supports, ties, and hang rods were added according to the actual materials. The mechanical properties of the materials of the bridge are shown in Table 1. From the deformation of the bridge structure under the action of self-weight, the mesh density was satisfied for the calculation accuracy requirements. To simulate the action of the temperature drop, the temperature gradient load during construction was added according to the temperature field measurement of the monitoring.
The boundary condition at the bottom of the abutment adopted compressive only elastic connection, and the foundation of the abutment was simulated by general elastic supports. Elastic connections simulate the supports between the crossbeams and the box girder; and the arch between the inclined supports is connected by rigid links, as shown in Figure 21.
According to the construction order and measured temperature field of the bridge in each stage, the FE model simulated the actual construction stages of the bridge. The steel box girder was shelved on the scaffolding during the installation period; however, because the scaffolding only provides vertical compression reaction force, the boundary condition contact between the bottom plate and scaffolding was simulated by compressive-only elastic connections in the FE model. As the bridge incurred abnormal deformation after the typhoon, many pipes of the failed frame scaffolding were also damaged due to its influence, and the bridge was exposed under open air conditions during the whole construction period. Furthermore, because the temperature field of the bridge generated by solar radiation in different times of the same day was complex and changeable, it was difficult to accurately simulate the deformation by the actual temperature field and boundary condition of the bridge in the FE model. Hence, it is difficult to make a direct comparison between the on-site monitoring and numerical results.
Notably, as can be seen from the temperature monitoring results in Figure 12, in the construction stage of installation of the steel box girder, the temperature of the bottom plates was 17–22 °C and the temperature of the top plates (the deck) was 21–60 °C Taking the most unfavorable situation, the temperature monitoring result at PM15:15 in Figure 12 was selected as the actual temperature gradient field when assembling and welding the box girder during most of the installation period. The assembling and welding of the box girder in the open air were mainly performed in daytime in May and June, and the in-site solar radiation and temperature during daytime from May to August were basically identical. Hence, the actual temperature gradient during the construction processes was added by the element temperature load in Midas Civil to the simulated deformation of the steel box beam in different construction stages, according to the day time monitoring results during most of the installation period. The initial and final temperature values of the elements of the bridge parts in the FE model are shown in Table 2.
Figure 22 and Figure 23 show the FE simulation results of the deformation of the steel box beam in different construction stages under the measured temperature field. The environmental temperature stabilized after installing the bottom plate under a high temperature of 60 °C; after installing the bottom plate the low temperature reached 20 °C; and the edge of the steel box beam underwent twisting deformation. The temperature gradient action generated inside the steel box beams caused the edge of the steel box beam to undergo twisting deformation, and the maximum twisting deformation was 6.3 cm. Figure 23 shows the upward twisting deformation at the end of beam and the two lateral free sides of the steel box girder in the FE model. The scaffolding only provided the vertical compression reaction force and the downward deflection deformation of the steel box girder was small enough to be almost negligible.
As shown in Figure 24 and Figure 25, deformation still existed even after installing the steel arch ribs and hanging rods, which was consistent with the in situ monitoring results, and the deformation at the end of the box girder led to upwarping overall following local upwarping after the removal of the frame scaffolding.
From the monitoring data, it can be seen that the highest temperature difference between the bottom and top plates of the steel box beam is 35–40 °C, and the final welding phase of the steel box beam mainly took place from April to June in 2019, which represents the time with the higher environmental temperature, especially June.
Figure 26 shows the deformation monitoring results of the steel box girder after removing the frame scaffolding. The figure shows that the two ends of the steel box girder are warped upwards, and the middle span of the box girder is concave, which coincides with the numerical simulation results in Figure 23. The deformation monitoring results of the steel box girder after the installation of hanging rods are shown in Figure 27 and are consistent with the numerical simulation results in Figure 23. As evidenced by the on-site monitoring and simulation results, the exact cause of the abnormal bridge deformation and separation between the bearings and the box girder is the inconsistency of the temperature field at the top and bottom plates. The inconsistency of the temperature field indicates a significant difference in the temperature field at different times. In the day time, during the installation and welding of the steel box girder segments, there was a significant difference between the top plates and bottom plates; the top plates’ temperature was high, the bottom plates’ temperature was lower. However, at a certain time after the completion of the installation and welding of the steel box girder segments, the temperature difference between the top plates and bottom plates of the steel box girder becomes quite small or even close to consistent, such as during the night time and the day time with low temperatures. The sudden approach of the typhoon changed the temperature of the top and bottom to a very low temperature field in a short time, which aggravated the inconsistency of the temperature field. As a result, the measured deformation value was greater than the theoretical value, mainly because of the temperature deformation of the steel box girder which led to forced displacement to the frame scaffolding, and subsequent compression damage of many steel pipes of the frame scaffolding, which further aggravated the deformation of the steel box girder at the main span.
To assess the effective temperature (ET) action, most bridge design codes, such as the Eurocode [25], British standard [26], AASHTO standard [27], and Chinese standard [28], recommend an indirect method, considering a conversion between air temperature and bridge temperature. Regarding the action of the temperature gradient, the specifications of different countries regulate the form of the vertical temperature gradient curve of the main girder [29]. Since the bridge was designed according to the Chinese standard [28], the deformation of temperature action was analyzed according this standard in the FE model simulation. The simulation results of the deformation (theoretical deformation) of temperature action in the Chinese standard are shown in Figure 28, Figure 29 and Figure 30. The deformation of the steel box girder is 3.7 cm at the midpoint due to the overall heating at 25 °C, and there is no abnormal deformation at the end of the steel box girder. The deformation of the steel box girder due to the overall cooling of 25 °C is also 3.7 cm in the mid-span. Under the action of the forward temperature gradient, the deformation direction of the steel box beam differs from the simulation results of the deformation, and the measured deformation due to the measured temperature field. The testing temperature deformation of the beam–arch combination bridge is slightly different from the result of the FE model, which means that the current temperature gradient in the Chinese standard (JTGD60-2015) is not applicable to the beam–arch combination bridge during construction.

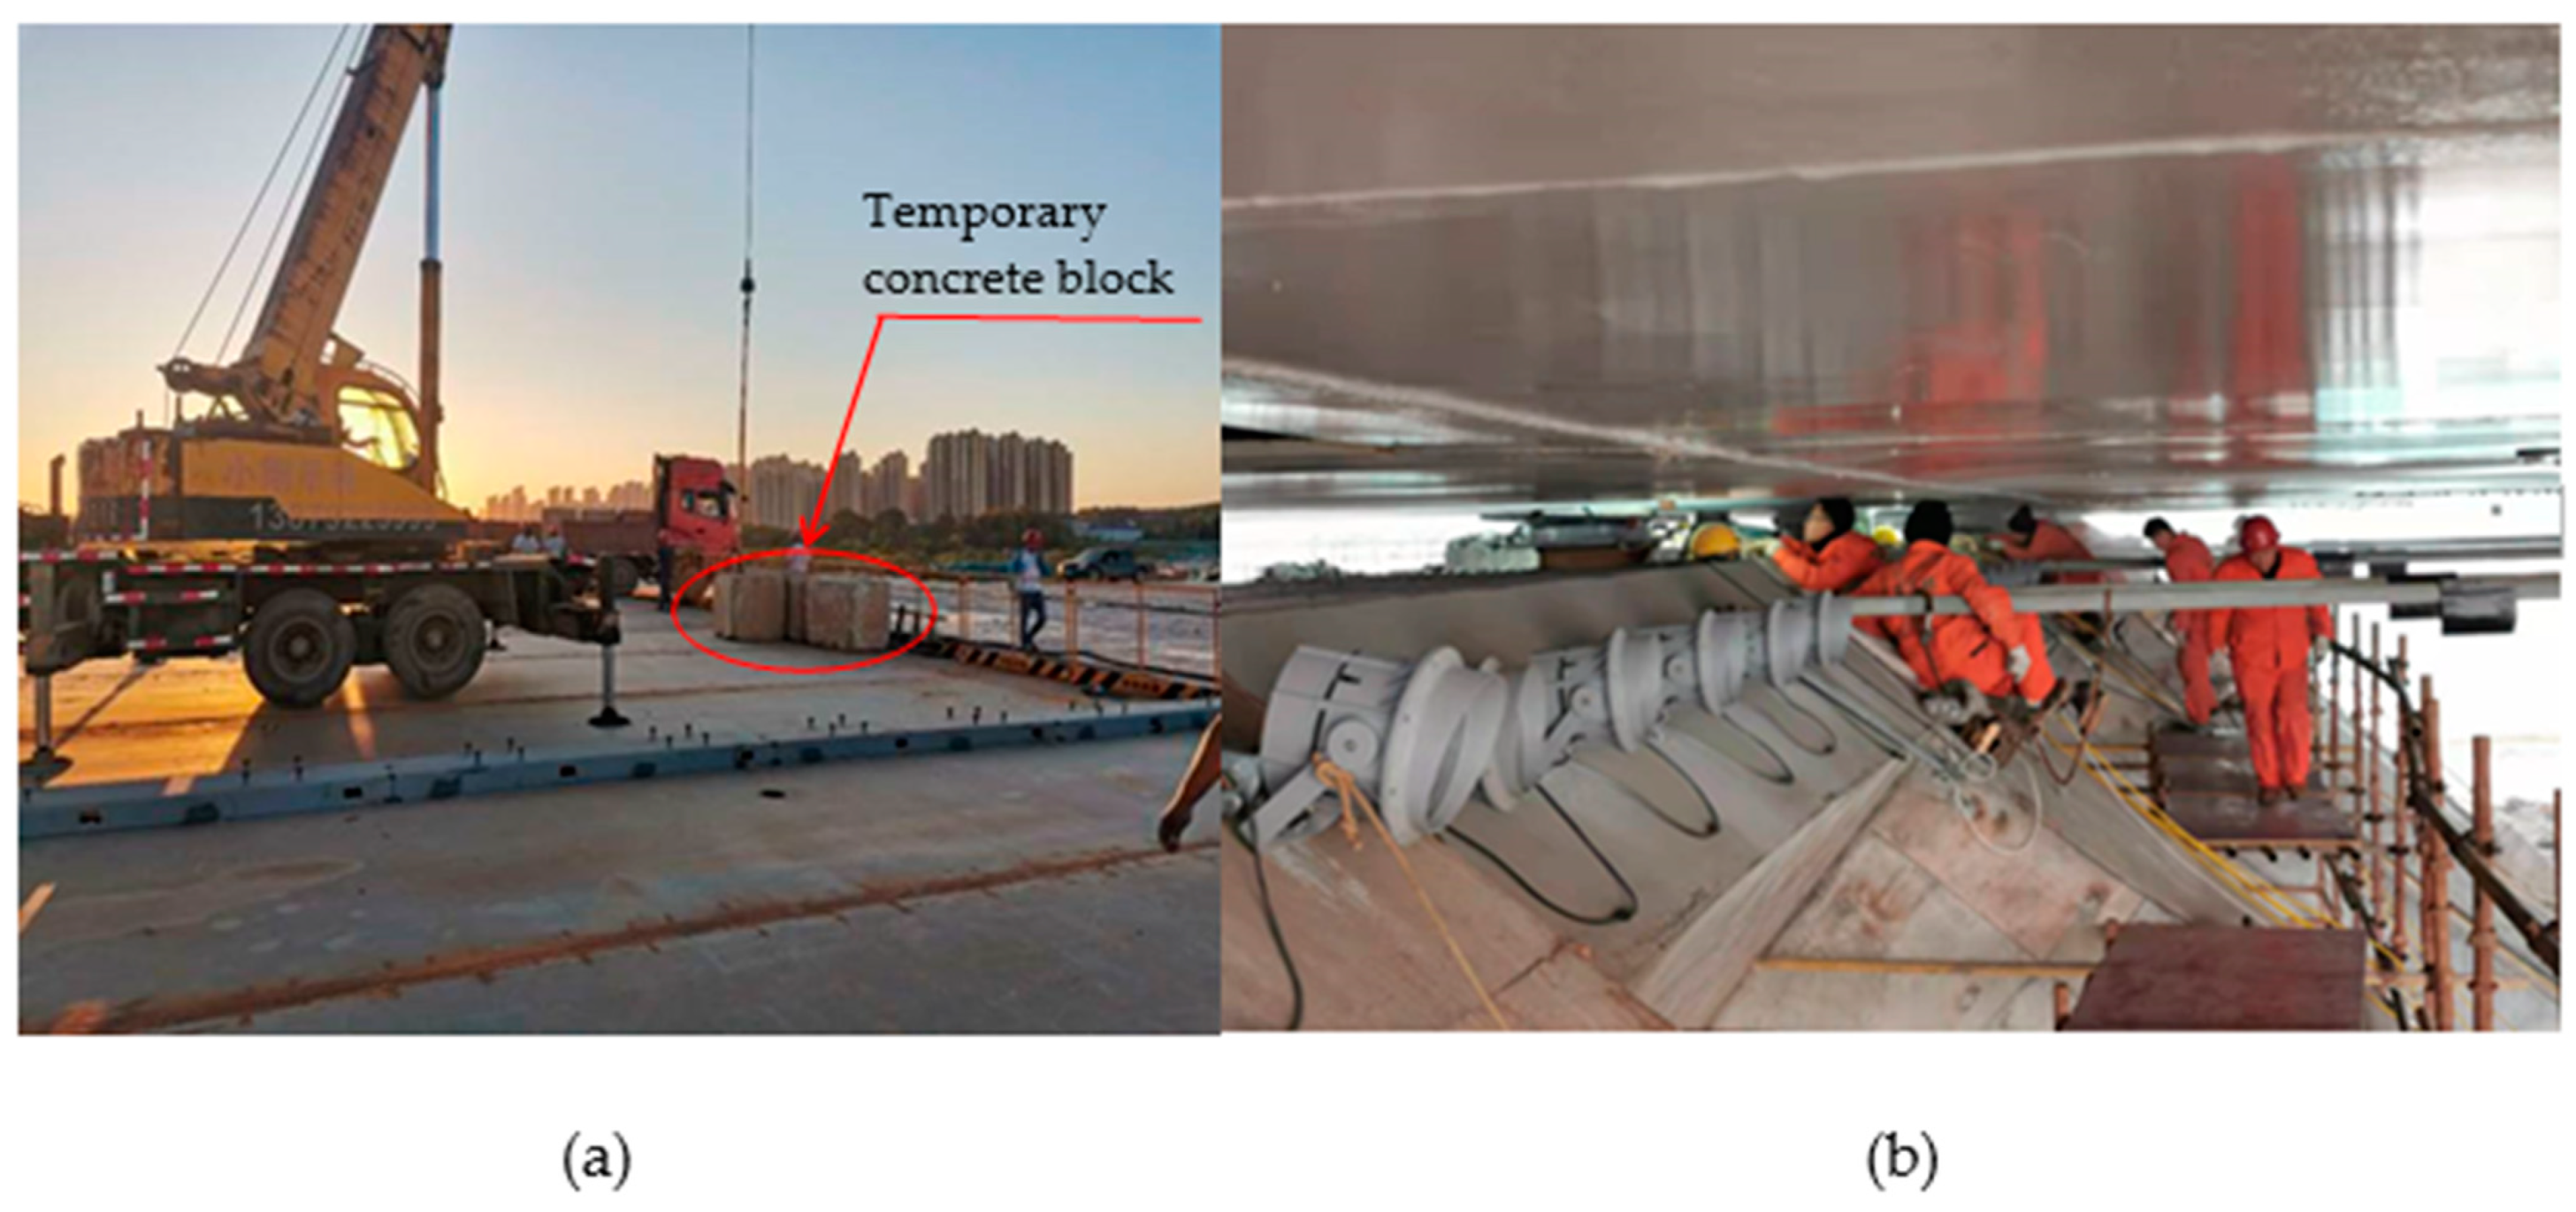
4. Rehabilitation Measures and Rehabilitation Effect

As highlighted in the previous analysis results, the exact cause of the abnormal deformation of the bridge is the inconsistency of the temperature field between the top and bottom plates of the box girder. However, the internal force due to the temperature gradient was stored in the steel box girder, and it is difficult to release by cutting and reforming the box girder of the formed bridge. To solve the abnormal deformation, rehabilitation measures should consider technology, cost, and the necessary construction period. From the monitoring and numerical simulation, the following steps were taken and put into engineering practice.
Step 1: Increase the force of the tie rods by 1000 kN based on the original design, and adopt the temporary concrete block, shown in Figure 31a, to position the end of the box girder downwards while pre-stressing the tie rods.
Step 2: Remove the temporary concrete block, jack up the steel box girder and lower the pad-stones by 45 mm, and remove the bearing anchor bolts and the original bearing. Drop the elevation of the box girder, replace the new bearings, and then position the whole steel box girder in place, as shown in Figure 31b.
Step 3: Adjust the force of the hanging rods to improve the whole deformation of the box girder. Add the pressure weight by casting concrete inside the compartment cell at the end of the box girder, to increase the reserve force of the support reaction. After the above adjustment, the side support (support away from the bridge axis) could have a sufficient pressure reserve to prevent the negative reaction force of the support.
The rehabilitation-measures process mainly involved the following steps: After the overall jacking-up of the box girder, all the bearings were removed to adjust the padstone height; the elevation at the whole bearing supports was lowered by 4.5 cm in stages; and the force of the hanging rods was adjusted according to the FE simulation. The primary issue dates before and after the rehabilitation measures are shown in Table 3.
The changes in the elevation of the box girder are shown in Figure 32. Figure 32a shows the elevation change of the end of the box girder above abutment #0. The elevation of this section increased by 4 cm after the rehabilitation measures. Figure 32b shows the elevation change of the mid-span of the main span of the box girder, and the overall elevation at this section increased by 3 cm after rehabilitation. Figure 32c shows the elevation change of the box girder at the section of hanging rod #11, and the overall elevation of this section increased by 5 cm. Figure 32d shows the elevation change of the end of the box girder above abutment #3. The elevation of this section increases by 6 cm after the rehabilitation measures.
The contour map deformation of the box girder in the main span is shown in Figure 33 and Figure 34. The deformation before treatment demonstrated obvious parabolic characteristics between the longitudinal section and the cross-section, and the maximum deformation was −11.5 cm, forming a concave “pot cover” shape as shown in Figure 33. After the treatment, the deformation ranged from −0.6 cm to −0.8 cm, and the error was close to the error value of −0.7 cm. This result means that rehabilitation measures improved the overall linearity of the bridge deck.
To ensure that bridge deformation after rehabilitation does not develop in service, long-term monitoring of the deformation was performed at different temperatures. Representative deformation monitoring data are shown in Figure 35, from 16 January 2020, 30 March 2020, and 7 June 2020, with temperatures of 3 °C, 19 °C, and 24 °C, respectively. Figure 35 shows that the box girder’s deformation at the bridge’s central axis at 3–24 °C was mainly from −4.0 cm to −6.3 cm, and the deformation area was stable, which indicates that the bridge can withstand different temperatures under service.
Figure 36 compares the box girder elevation and design theoretical elevation at the longitudinal section of the central axis of the bridge. The elevation is generally 4 cm to 6 cm lower than the design elevation. Because the entire support elevation was uniformly reduced by 4.5 cm during rehabilitation processing, the actual elevation error can be considered to compensate by 0.5~1.5 cm.
Figure 37 shows that the measured forces of the main arch hanging and the vice arch hanging rods were stable, the environmental temperature was 3 °C on 13 January, and 25 °C on 26 March 2020. The intermittent relaxation of the states after Typhoon Lekima no longer appears. Hence, the rehabilitation measures proposed in this paper achieved the expected target to solve the abnormal deformation of the bridge.

5. Discussions and Suggestion

Through the investigation in this research, the exact cause of abnormal deformation of the beam–arch combination bridge was found to be the temperature effect of the typhoon. The arrival of the typhoon led the temperature of the entire top and bottom to drop to a very low temperature field in a short time, which aggravated the inconsistency of the temperature field between the top and bottom plates. The inconsistency of the temperature field changed the internal force and deformation of the steel box girder, led to the failure of some of the top pipes of the frame scaffolding by shear, and the frame scaffolding damage exacerbated the abnormal deformation. The internal force induced by the temperature action of the bridge gradually acted on the frame scaffolding, and changes in the bridge geometry gradually appeared because of the constraints between internal components of bridge structures. Changes in the bridge geometry appeared after several days, once the typhoon had passed. After the later removal of the frame scaffolding, once the low temperature weather appeared, the twisting deformation at the end of the box girder above the abutment inevitably reappeared. Therefore, the possibility of wind load or the settlement of the foundation of the frame scaffolding can be excluded as the exact cause. Furthermore, if the abnormal deformation is due to the wind load or the settlement of the foundation, the twisting deformation could be recovered in the subsequent construction stages, and would not reappear at certain times such as at nighttime and daytime with low temperatures.
Hence, when the steel box girder of the beam–arch combination bridge is assembled in open air, the temperature inevitably increases in the daytime along the cross-section of the girder segment; therefore, it is necessary to propose control measures to ensure the uniform distribution of the temperature field inside and outside the steel girder during the construction period. Otherwise, similarly to the background bridge in this article, unrecoverable abnormal deformation under extreme temperature fields is likely to occur, which brings great harm in the construction of similar bridges. Moreover, due to the temperature difference of the box girder segments before and after girth-welding in the open air, some residual thermal deflections will appear on the box girder segments because of the change of the boundary conditions of the structure by the girth-welding [22].
Combined with the temperature control measures taken in the construction of the steel box girder of other bridges that have already been built [30,31], the following suggestions are proposed to avoid abnormal deformation occurring: (1) to ensure the uniform distribution of the temperature field inside and outside the steel box girder, it is necessary to establish a construction shed with a constant temperature during assembling and welding in the daytime. (2) Girth-welding of the divided parts of the box girder segment should be performed during a period when the vertical temperature difference of the girder is within 1 °C, such as after 22:00.

6. Conclusions

To reveal the exact causes of the abnormal deformation of a construction bridge following Typhoon Lekima, an FE model considering the temperature field based on measurement data was established, and rehabilitation measures were proposed based on simulation and on-site monitoring. The conclusions are summarized as follows:
(1)
The exact cause of the abnormal deformation of the bridge was the inconsistency of the temperature field between the top and bottom plates, and the sudden approach of the typhoon aggravated the inconsistency of this temperature field;
(2)
Abnormal deformation of the construction bridge was the result of a temperature decrease caused by the typhoon, and other abnormal weather conditions should be addressed with special treatments, such as replacing bearings by jacking the whole superstructure before forming the bridge because short-term recovery is difficult.
(3)
An extreme temperature field should be considered in the design of a beam–arch combination bridge. To prevent abnormal deformation of the beam–arch combination bridge caused by the extreme temperature field, controlling measures should be taken to ensure the uniform distribution of the temperature field inside and outside the steel box girder during the construction period, such as assembling the steel box girder in a construction shed with a constant temperature. These results can provide a reference for the design and construction of similar bridges.

Author Contributions

Conceptualization, investigation, Y.L.; software, Y.L. and L.Z.; analysis, Y.L. and M.F.; resources, M.F.; writing—original draft preparation, M.F. and Y.L.; writing—review and editing, Y.L. and B.W.; project administration, G.T.; funding acquisition, M.F. All authors have read and agreed to the published version of the manuscript.

Funding

This research was funded by the National Natural Science Foundation of China, grant number 51878277, 52068022, the Youth Science Foundation of the Education Department of Jiangxi Province, grant number GJJ180335, GJJ190341, and the Natural Science Foundation of Jiangxi Province, Grant number 20212BAB204010).

Institutional Review Board Statement

Not applicable.

Informed Consent Statement

Not applicable.

Data Availability Statement

Not applicable.

Acknowledgments

The authors would kindly like to thank all the collaborators and engineers working in the engineering background bridge, whose contributions played a key role in constructing the beam–arch combination bridge.

Conflicts of Interest

The authors declare no conflict of interest.

References

  1. Kehlbeck, F. The Influence of Solar Radiation on the Bridge Structure; China Railway Publishing House: Beijing, China, 1981. [Google Scholar]
  2. Hao, C. Study on nonlinear influence of temperature on long-span steel cable-stayed bridge during construction. J. Highw. Transp. Res. Dev. 2013, 20, 63–66. [Google Scholar]
  3. Dilger, W.H.; Ghali, A.; Chan, M.; Cheung, M.S.; Maes, M.A. Temperature stresses in composite box girder bridges. J. Struct. Eng. 1983, 109, 1460–1478. [Google Scholar] [CrossRef]
  4. Saetta, A.; Scotta, R.; Vitaliani, R. Stress analysis of concrete structures subjected to variable thermal loads. J. Struct. Eng. 1995, 121, 446–457. [Google Scholar] [CrossRef]
  5. Cao, Y.; Yim, J.; Zhao, Y.; Wang, M.L. Temperature efects on cable stayed bridge using health monitoring system: A case study. Struct. Health Monit. 2011, 10, 523–537. [Google Scholar] [CrossRef]
  6. Kim, S.; Kim, C.Y.; Lee, J. Monitoring Results of a Selfanchored Suspension Bridge; Springer: Dordrecht, The Netherlands, 2005. [Google Scholar]
  7. Xia, Y.; Chen, B.; Zhou, X.Q.; Xu, Y.L. Field monitoring and numerical analysis of Tsing Ma Suspension Bridge temperature behavior. Struct. Control Health Monit. 2013, 20, 560–575. [Google Scholar] [CrossRef]
  8. Chang, S.P.; Yee, J.; Lee, J. Necessity of the bridge health monitoring system to mitigate natural and man-made disasters. Struct. Infrastruct. Eng. 2009, 5, 173–197. [Google Scholar] [CrossRef]
  9. Xu, Y.L.; Chen, B.; Ng, C.L.; Wong, K.Y.; Chan, W.Y. Monitoring temperature effect on a long suspension bridge. Struct. Control Health Monit. 2010, 17, 632–653. [Google Scholar] [CrossRef]
  10. Yarnold, M.T.; Moon, F.L. Temperature-based structural health monitoring baseline for long-span bridges. Eng. Struct. 2015, 86, 157–167. [Google Scholar] [CrossRef]
  11. Liu, H.; Chen, Z.; Zhou, T. Investigation on temperature distribution and thermal behavior of large span steel structures considering solar radiation. Adv. Steel Constr. 2013, 9, 41–58. [Google Scholar] [CrossRef] [Green Version]
  12. Zhao, Z.; Liu, H.; Chen, Z. Field monitoring and numerical analysis of thermal behavior of large span steel structures under solar radiation. Adv. Steel Constr. 2017, 13, 190–205. [Google Scholar] [CrossRef] [Green Version]
  13. Zhao, Z.; Liu, H.; Chen, Z. Thermal behavior of large-span reticulated domes covered by ETFE membrane roofs under solar radiation. Thin-Walled Struct. 2017, 115, 1–11. [Google Scholar] [CrossRef]
  14. Lee, J.; Loh, K.J.; Choi, H.S.; An, H. Effect of structural change on temperature behavior of a long-span suspension bridge pylon. Int. J. Steel Struct. 2019, 19, 2073–2089. [Google Scholar] [CrossRef]
  15. Yu, X.M.; Chen, D.W.; Bai, Z.Z. A stability study of the longest steel truss deck cable-stayed bridge during construction. KSCE J. Civ. Eng. 2019, 23, 1717–1724. [Google Scholar] [CrossRef]
  16. Hrichi, S.; Chaabane-Banaoues, R.; Bayar, S.; Flamini, G.; Oulad El Majdoub, Y.; Mangraviti, D.; Mondello, L.; El Mzoughi, R.; Babba, H.; Mighri, Z.; et al. An experimental study of temperature efect on modal parameters of the Alamosa Canyon Bridge. Earthq. Eng. Struct. Dyn. 1999, 28, 879–897. [Google Scholar] [CrossRef]
  17. Park, G.; Kabeya, K.; Cudney, H.H.; Inman, D.J. Impedance-Based Structural Health Monitoring for Temperature Varying Applications. JSME Int. J. Ser. A 2012, 42, 249–258. [Google Scholar] [CrossRef] [Green Version]
  18. Lynch, J.P.; Loh, K.J. A summary review of wireless sensors and sensor networks for structural health monitoring. Shock Vib. Dig. 2006, 38, 91–128. [Google Scholar] [CrossRef] [Green Version]
  19. Magalhaes, F.; Cunha, A.; Caetano, E. Vibration based structural health monitoring of an arch bridge: From automated OMA to damage detection. Mech. Syst. Signal Processing 2012, 28, 212–228. [Google Scholar] [CrossRef]
  20. Liu, J.; Liu, Y.J.; Bai, Y.X.; Liu, G.L. Regional Variation and Zoning of Temperature Gradient Pattern of Concrete Box Girder. China J. Highw. Transp. 2020, 33, 73–84. [Google Scholar] [CrossRef]
  21. Chen, J.Q.; Yan, Q.S. Observation and analysis of Zhanjiang Bay Bridge temperature field during construction. In Proceedings of the 13th Computer Application Academic Conferences Symposium of Engineering Construction, Foshan, China, 7–9 November 2006; pp. 512–518. [Google Scholar]
  22. Wang, J.F.; Zhang, J.T.; Yang, Z.X.; Xu, R.Q. Control measures for thermal effects during placement of span-scale girder segments on continuous steel box girder bridges. J. Zhejiang Univ.-Sci. A 2020, 21, 255–267. [Google Scholar] [CrossRef]
  23. Han, S.; Liu, Y.J.; Wang, Z.H.; Bai, Y.X.; Liu, J.; Wang, Z.X. Study on Temperature Effect of Composite Girder Cable-stayed Bridge During Construction in Alpine Region. J. Archit. Civ. Eng. 2021, 38, 107–117. [Google Scholar] [CrossRef]
  24. Wei, M.C.; Qiao, J.G.; Wang, W.G. Effect of temperature gradient on force of steel box girder support under construction. Hunan Commun. Sci. Technol. 2015, 41, 100–102. [Google Scholar]
  25. European Committee for Standardization (CEN). Eurocode 1: Actions on Structures—Part 1–5: General Actions—Thermal Actions. EN 1991-1-5; European Committee for Standardization: Brussels, Belgium, 2003. [Google Scholar]
  26. British Standards Institution (BSI). Steel, Concrete and Composite Bridges—Part2: Specification for Loads; BS 5400-2; British Standards Institution: London, UK, 1978. [Google Scholar]
  27. AASHTO. LRFD Bridge Design Specifications; Customary U.S. Unit; American Association of State Highway and Transportation Officials: Washington, DC, USA, 2012. [Google Scholar]
  28. Ministry of Transport of the People’s Republic of China (MOT). The General Specifications for Design of Highway Bridges and Culverts; JTG D60-2015; Ministry of Transport of the People’s Republic of China: Beijing, China, 2015.
  29. Wang, Z.W.; Zhang, W.M.; Zhang, Y.F.; Liu, Z. Temperature prediction of flat steel box girders of long-span bridges utilizing in situ environmental parameters and machine learning. J. Bridge Eng. 2022, 27, 04022004. [Google Scholar] [CrossRef]
  30. Gao, W.B.; Su, Q.K.; Zhang, J.W.; Xie, H.B.; Liu, J.Z. Steel bridge construction of Hong Kong-Zhuhai-Macao Bridge. Int. J. Steel Struct. 2020, 20, 1498–1508. [Google Scholar] [CrossRef]
  31. Jing, Q. Continuous steel box girders and reinforced concrete structures in the main bridge project of Hong Kong-Zhuhai-Macao Bridge. J. Zhejiang Univ.-Sci. A 2020, 21, 249–254. [Google Scholar] [CrossRef]
Figure 1. 3-D view of the bridge.
Applsci 12 06909 g001
Figure 2. Bridge-type diagram of the bridge (unit: mm).
Applsci 12 06909 g002
Figure 3. Cross-section of the bridge (unit: mm).
Applsci 12 06909 g003
Figure 4. Steel box girder and arch ring construction completed.
Applsci 12 06909 g004
Figure 5. Top pipes of the frame scaffolding failed after the typhoon.
Applsci 12 06909 g005
Figure 6. Bearings of the bridge separated the box girder and the pad stones.
Applsci 12 06909 g006
Figure 7. Temperature monitoring section of the bridge (unit: mm).
Applsci 12 06909 g007
Figure 8. Temperature monitoring points of arch ribs (T6 to T8).
Applsci 12 06909 g008
Figure 9. Temperature monitoring points of the box girder (T1 to T5).
Applsci 12 06909 g009
Figure 10. Deformation monitoring points of the bridge deck (unit: mm).
Applsci 12 06909 g010
Figure 11. Monitored temperature field at different times.
Applsci 12 06909 g011
Figure 12. Monitored temperature of different parts.
Applsci 12 06909 g012
Figure 13. Deck elevation at the hanging point under different temperatures. (a) Eastside hanging point area. (b) Westside hanging point area.
Applsci 12 06909 g013
Figure 14. Results of elevation measurement at the end of the box girder at the abutment. (a) At abutment #1. (b) At abutment #4.
Applsci 12 06909 g014
Figure 15. Top view of the distribution of the abnormal deformation.
Applsci 12 06909 g015
Figure 16. Deformation monitoring historical curves of the box girder at abutment #1.
Applsci 12 06909 g016
Figure 17. Deformation monitoring historical curves of the box girder at the mid-span.
Applsci 12 06909 g017
Figure 18. Deformation monitoring historical curves of the box girder above abutment #4.
Applsci 12 06909 g018
Figure 19. Deformation of the box girder after demolition of the frame scaffolding.
Applsci 12 06909 g019
Figure 20. Finite element numerical simulation model: (a) 3-D view; (b) local view of the steel box girder discretized by 4-nodes thick-plate elements.
Applsci 12 06909 g020
Figure 21. Rigid connections and elastic connections in the FE model.
Applsci 12 06909 g021
Figure 22. Deformation of the box girder after installation of the bottom plate (unit: mm).
Applsci 12 06909 g022
Figure 23. Deformation of the box girder after installation of the top plate (unit: mm).
Applsci 12 06909 g023
Figure 24. Deformation of the box girder after installation of arch ribs (unit: mm).
Applsci 12 06909 g024
Figure 25. Deformation of the box girder after the demolition of the frame scaffolding (unit: mm).
Applsci 12 06909 g025
Figure 26. Deformation of the box girder after the demolition of the frame scaffolding (unit: m). Measurement time: 17:36–18:20 on 25 September 2019. Environmental temperature: 29 °C.
Applsci 12 06909 g026
Figure 27. Deformation of the box girder after the installation of hanging rods (unit: m). Measurement time: 17:36–18:20 on 4 October 2019. Environmental temperature: 23 °C.
Applsci 12 06909 g027
Figure 28. Theoretical deformation of the temperature action of overall heating at 25 °C (unit: mm).
Applsci 12 06909 g028
Figure 29. Theoretical deformation of the temperature action of overall cooling at 25 °C (unit: mm).
Applsci 12 06909 g029
Figure 30. Theoretical deformation of the temperature gradient in the China standard (JTGD60-2015) (unit: mm).
Applsci 12 06909 g030
Figure 31. Rehabilitation measures: (a) Adopt the temporary concrete block to position the end of the box girder downwards. (b) Replace bearings by jacking up the overall box girder.
Applsci 12 06909 g031
Figure 32. Deformation of the key section of the box girder before and after the rehabilitation measures. (a) End of the box girder above abutment #1. (b) mid-span of the main span of the box girder. (c) Section of hanging rod #11. (d) End of the box girder above abutment #4.
Applsci 12 06909 g032
Figure 33. Deformation of the whole box girder before rehabilitation measures.
Applsci 12 06909 g033
Figure 34. Deformation of the whole box girder after rehabilitation measures.
Applsci 12 06909 g034
Figure 35. Long-term monitoring of the deformation at different temperatures of different times. (a) Test result on 16 January 2020, 3. (b) Test result on 30 March 2020, 7. (c) Test result on 7 June 2020.
Applsci 12 06909 g035aApplsci 12 06909 g035b
Figure 36. Elevation of the box girder after demolition of rehabilitation measures.
Applsci 12 06909 g036
Figure 37. Measured force value of the main arch hanging rods.
Applsci 12 06909 g037
Table 1. Mechanical properties of the materials of the bridge.
ClassificationMain ArchSecondary ArchConcrete Arch FootSteel Box GirderTie Bar
Elastic modulus [MPa]2.06 × 1052.06 × 1053.25 × 1042.06 × 1051.95 × 105
Bulk density (Y) [kN/m3]76.9876.9825.0076.9878.50
Resistance to moment of Inertia (Iy) [m4]0.17740.11538.1920//
Coefficient of linear expansion [1/°C]1.20 × 10−61.20 × 10−61.20 × 10−51.20 × 10−61.20 × 10⁻⁶
Cross section (A) [m2]0.28190.19879.600.460.0013
Table 2. Temperature values of the elements of bridge parts in the FE model.
Elements of the Bridge PartsInitial Temperature
Values/°C
Final Temperature
Values/°C
Arches2035
Hanging rods2035
Steel box girdertop plate2060
belly plate2025
transverse plate2025
bottom plate2020
Table 3. Primary issue dates before and after the rehabilitation measures.
DatesPrimary Issues
27 June 2019Installation of box girder completed
12 August 2019The day before Typhoon Lekima arrived
14 August 2019The day after Typhoon Lekima arrived
11 September 2019Pre-stress of the hanger rods completed
17 October 2019Demolition of the frame scaffolding completed
24 December 2019Plan of rehabilitation measures research completed
29 December 2019Overall jacking-up of the box girder completed
2 January 2020First time of descent of the box girder
4 January 2020Adjustment of the force of the hanging rods completed
8 January 2020Second time of descent of the box girder
12 January 2020Rehabilitation measures completed
Publisher’s Note: MDPI stays neutral with regard to jurisdictional claims in published maps and institutional affiliations.

