Article

The Characteristics and Mechanisms of High-Intensity Sound in a High-Speed Multistage Compressor

1
Liaoning Province Key Laboratory of Advanced Measurement and Test Technology of Aviation Propulsion Systems, Shenyang Aerospace University, Shenyang 110136, China
2
Beijing Aerospace Technology Institute, Beijing 100074, China
3
Aero Engine Corporation of China (AECC) Shenyang Engine Research Institute, Shenyang 110015, China
*
Author to whom correspondence should be addressed.
Appl. Sci. 2022, 12(14), 6865; https://doi.org/10.3390/app12146865
Submission received: 2 June 2022 / Revised: 2 July 2022 / Accepted: 5 July 2022 / Published: 7 July 2022
(This article belongs to the Special Issue Aircrafts Reliability and Health Management)

Abstract

:
An experiment with a multistage high-speed compressor is conducted to investigate the high noise with abnormal blade vibration. Different points are selected to monitor the noise in the compressor and the amplitude of blade vibration. The evolution rhythm of sound frequency and sound pressure level against speed is captured. The relation between the vibration and the noise is obtained. A research method based on an acoustic analogy is developed to investigate the characteristics and mechanisms of high-intensity sound in a rectangular cavity pipeline. The calculated distribution of the first four-order acoustic mode inside the rectangular cavity pipe is consistent with the results in the literature, and the maximum calculation error of the acoustic mode frequency value is 2.7%, which certifies the effectiveness of the method. A simplified compressor model is established to study the vortex system and the sound field characteristics of this method when high-intensity sound occurs. The results present the motion law of shedding vortices with high-intensity sound, and the calculation error of the frequency corresponding to the high-intensity sound is 3.6%. The “frequency-locked phase-locked” characteristics (i.e., character frequency) keep constant at a range of velocities, showing similarity with the phenomenon obtained in experiment above, and beta mode forms of Parker are captured. The study in the present paper makes a contribution for the cognition of mechanisms with high-intensity sound in aeroengine compressors.

1. Introduction

Research institutions such as the National Aeronautics and Space Administration (NASA) in the United States and Deutsches Zentrum für Luft- und Raumfahrt (DLR) in Germany have discovered many structural failures in engine casing components, such as rotor blades and casing, which all result from high-intensity sound [1,2]. Additionally, the “Engine Structural Integrity Plan” presents the notion that the verification of high-intensity sound in aeroengines is difficult because of the simultaneous occurrence of multiple acoustic modes within a closed space. The emergence of multiple modes actually reduces the intensity of every acoustic mode [3]. The establishment of the theoretical model for predicting the occurrence of high-intensity sound in a compressor is rather complicated due to numerous factors including changed duct geometry, the propagation of acoustic waves, load changes, and so on. The simulation of the whole process of pressure disturbance, as well as the coupling calculations in the three-dimensional field for flow, sound and structure are difficult to finish with unsteady methods due to unacceptable computational costs. Therefore, it is necessary to derive a simplified model to study high-intensity sound in multistage compressors [4].
Parker [5] successfully established the first high-intensity sound model based on the plate cascade and experimentally studied acoustic waves and the interaction between shedding vortices and sound. The typical characteristic of “frequency-locked” was presented in the experiment. The proposal of Parker’s mode further clarifies that the plate vibration pattern is determined by the interaction between the sound and plate in the duct [6,7,8]. Clements made a detailed explanation for the evolution of the shedding vortex of the rectangular plate with a numerical simulation on a two-dimensional cascade model [9]. The key factors affecting high-intensity sound, including slab thickness, the shape of the plate trailing edge, the dimensions of the pipeline, and so on, are ensured, as is the interaction mechanism between plate wake flow and flow-induced high-intensity sound in hard-walled pipelines [10]. Thompson completed the recovery of the shedding vortex from the trailing edge of the plate locked in the duct with the assumption that there was little influence on the results from flow velocity changing, and found the phenomenon of the coupling of sound wave frequency and vortex frequency and the interaction between the sound wave and the shedding vortex [11,12]. For the study of high-intensity sound in real compressors, Hellmich used a numerical model to capture the interaction of the compressor blades and the acoustic waves during propagation in a multi-stage compressor [1]. Courtiade then used an experiment base from that model to explore the reason for the occurrence of high-intensity sound [13]. Cooper established an excited disk model that could recover the processing of the high-intensity sound of aeroengines and pointed out that the high-intensity sound only occurred in certain combined conditions of the parameters, such as rotor speed, flow velocity, and some other elements [14]. Some investigation into broken components in aeroengines has been implemented [15,16,17]. Parker’s study regarding the high-intensity sound in ducts points out the importance of the interaction between acoustic waves and plate wake vortices, which make a foundation for the failure of the components—especially the blades in the compressor of the aeroengine—that arise with high-intensity sound.
Structural acoustic resonance is the coupled vibration between the sound and the structure, and is associated with the high-intensity sound in the internal cavity of the structure, and the physical essence of it is the fluid-induced cavity sound. In 1878, Strouhal conducted an experimental study of the sound of a wire at discrete velocity ranges of wind, which was a precedent study for the wake sounds of turbulent fluid in a flow field. Experiments showed that the vortex shedding frequency of the wire wake was approximately equal to the sound frequency which occurred under specific wind speed conditions. The method, which combined computational fluid dynamics (CFD) technology with acoustic analogy, is taken by most researchers to solve problems when performing the numerical simulation of flow-induced acoustic problems in the development of computational aeroacoustics. The most famous Lighthill equation provides a good theoretical foundation for solving aeroacoustic problems, and is also an important technical mean for the development of numerical calculation methods [18]. Bailly extracted the sound source information from the turbulent shear layer with the Lighthill equation in the study of supersonic aircraft jet noise [19]. The final noise directivity prediction results showed good agreement with the experimental results. Taking the Reynolds-averaged Navier–Stokes (RANS) method to extract the sound source information from the flow field is impossible due to the fact that it is only suitable for average flow problems, which results in the failure of representing unsteady flow information effectively [20]. In order to solve that problem, a hybrid large eddy simulation (LES)/RANS method was developed to capture the velocity and pressure information of the unsteady flow field, using the acoustic analogy method to achieve the effective prediction of jet noise [21]. In dealing with the radiation noise prediction of the three-dimensional square cavity structures under complex flow conditions, Lai completed the calculation of the acoustic radiation characteristics of the structure in the far field with a method combining the LES and The Ffowcs Williams and Hawkings Model.(FW-H) equations [22]. Flemming first achieved the simulation of the combustion reaction flow field at a low Mach number with LES, and loaded the sound source term and nonuniform flow field information caused by combustion into the acoustic wave equation with the acoustic analogy method, thereby realizing the prediction of combustion noise [23]. The combined use of the LES and the acoustic analogy method make a significant contribution to the noise prediction problem under the action of complex turbulence. A relevant adjustment should be made in the acoustic analogy equation according to the boundary conditions, flow characteristics and other factors.
The influence of the solid wall was taken into context by Curle, who made a contribution to the calculation of the problem of the variable flow cross section and then improved the equation that had been established with the base of the Lighthill equation [24]. Thus, researchers try to rectify convection-induced sound sources by solving the flow field where the structure is located, then converting the aerodynamic force as the sound source term with the acoustic analogy equation. Some numerical simulations have been validated for this method [25,26,27]. The sound source arising from the action of the solid wall shows a relation between it and the force from the wall. Thus, there is a need to take this aerodynamic force resulting from the solid wall into account for flow-induced sound problems. Blasius established the relationship between aerodynamic force and vortices with theory, making it possible to exclude the force arising from the object, as verified by Howe [28]. Escoba studied the reappearance of sound information in a structure through numerical simulation, but did not consider the influence of sound on flow [29]. Although numerous investigations have aimed to characterize this flow-induced sound issue, there is a huge gap in its application in engineering [30]. Therefore, there is urgent need for an accurate and reasonable numerical method to solve the coupling problem of sound and flow. This paper focuses on the sound problem of the shedding vortex from the trailing edge of the plate inside a rectangular cavity pipeline using a method combining LES and acoustic analogy, which is regarded as a good solution for the complex turbulent sound problem.
The experiment on the multistage high-speed compressor is conducted to investigate abnormal vibration with the high noise of the blades. The noise spectrum is obtained by the deployed monitored points. Characteristic frequency gradually increases with increasing rotational speed, and there is a phenomenon that the characteristic frequency is locked in a range of rotor speed. The research method based on the acoustic analogy is developed to study the characteristics and mechanisms of high-intensity sound in this paper. Initially, a rectangular cavity pipeline model is established to analyze the distribution characteristics of the vortex system and the acoustic mode distribution in the duct under flow conditions, and verify the validity of the acoustic analogy method with the identification of the acoustic modes in the pipeline. Then, we use the acoustic analogy method to calculate the built-in plate pipeline model, which is a simplified compressor model based on Parker’s model. The sound pressure level spectrum of this model includes high-amplitude pure sound components and is characterized by a frequency-locked, phase-locked system, which is consistent with the phenomenon in the experiment. The method proposed in the present investigation may make a contribution to the cognition of mechanisms with high-intensity sound in aeroengine compressors.

2. Numerical Calculation Theory

2.1. Flow-Induced Sound Theory

During the calculation, the renormalization group (RNG) k ε model is selected to calculate the steady-state flow field. The LES turbulence model is taken in the present investigation for transient flow field calculations [31]. After addressing the flow field, the Lighthill acoustic analogy method is taken to derive the sound source information from the flow field information [32]. The mass conservation and momentum conservation equations are as follows:
{ ρ t + ρ v i x i = 0 ρ v i t + ρ v i v j x j = p i j x i
In the above equation, the term p i j can be expressed as:
p i j = p δ i j τ i j
where ρ , p and v are the density, pressure and velocity in the presence of acoustic disturbances in the flow. δ i j is the Kronecker notation ( δ i j = 1 , δ i j = 0 ; i j ).
Taking the time and space partial derivatives of the formula in Equation (1), the following can be obtained:
2 ρ t 2 = x i ( ρ v i v j x j + δ i j p x i + τ i j x j )
Subtracting c 0 2 2 ρ x i 2 from both sides of Equation (3) simultaneously:
2 ρ t 2 c 0 2 2 ρ x i 2 = 2 T i j x i x j
The parameters of Equation (4) satisfy the following relationship:
{ T i j = ρ v i v j ( p c 0 ρ ) δ i j + τ i j p = p 0 + p a ρ = ρ 0 + ρ a
where p 0 and ρ 0 are the airflow pressure and density when there are no sound, p a and ρ a are the pressure and density changes arising from the pulsation of sound pressure, and c 0 is the sound velocity separate from the sound source and the mean flow area. T i j is the Lighthill stress tensor.
Due to 2 ρ 0 t 2 c 0 2 2 ρ 0 x i x i = 0 , the simultaneous Equation (4) is derived as:
2 ρ a t 2 c 0 2 2 ρ a x i x i = 2 T i j x i x j
At low Mach numbers and small amplitudes, regardless of the entropy source terms and viscous stress conditions, the following relation can be obtained:
ρ v i v j = ( ρ 0 + ρ a ) v i v j ρ 0 v i v j = T i j
Therefore, the Lighthill acoustic analogy equation is derived as follows:
{ 2 ρ a t 2 c 0 2 2 ρ a x i x i = 2 T i j x i x j 2 p x i x i = 1 c 0 2 2 p t 2
This method considers the flow field separately from the sound field. In the first equation of Equation (8), the right term can be regarded as the source term which can be calculated from the flow field, and the left is a typical sound wave equation.

2.2. Rotating Sound Source Theory

The instability pressure wave p ( φ F , t ) shows the difference at different reference coordinates. The pressure wave form which is locked in the fixed coordinate frame can be expressed as [33]:
p ( φ F , t ) = n = 1 α = + A n α F cos ( α φ F ω n F t ϕ n α F )
and when the rotating noise source frequency (RS) is ω RS S / 2 π , Equation (9) can be represented as follows in the noise source coordinate frame (s):
p ( φ S , t ) = n = 1 α = + A n α S cos ( α φ S ω n S t ϕ n α S )
The above equation can be re-expressed as follows in the rotor blade coordinate frame (R):
p ( φ R , t ) = n = 1 α = + A n α R cos ( α φ R ω n R t ϕ n α R )
The relations between various sound sources at different coordinate frames are as follows:
{ φ F = φ S + Ω S F t φ F = φ R + Ω R F t φ S = φ R + Ω R F t Ω R F = Ω S F + Ω R S
Taking the above relation equations to Equation (10):
p ( φ F , t ) = n = 1 α = + A n α F cos ( α φ F ( ω n S + α Ω S F ) t ϕ n α F )
The rotating noise source frequency ω RS S / 2 π with the fixed coordinate frame is as follows:
ω RS F = ω RS S + α Ω S F
Taking the propagation of the sound source into account in the compressor, the mode number α of the source is derived:
| α | = | ω RS F | ± | ω RS R | | Ω R F |

3. Noise Experiment of the Compressor

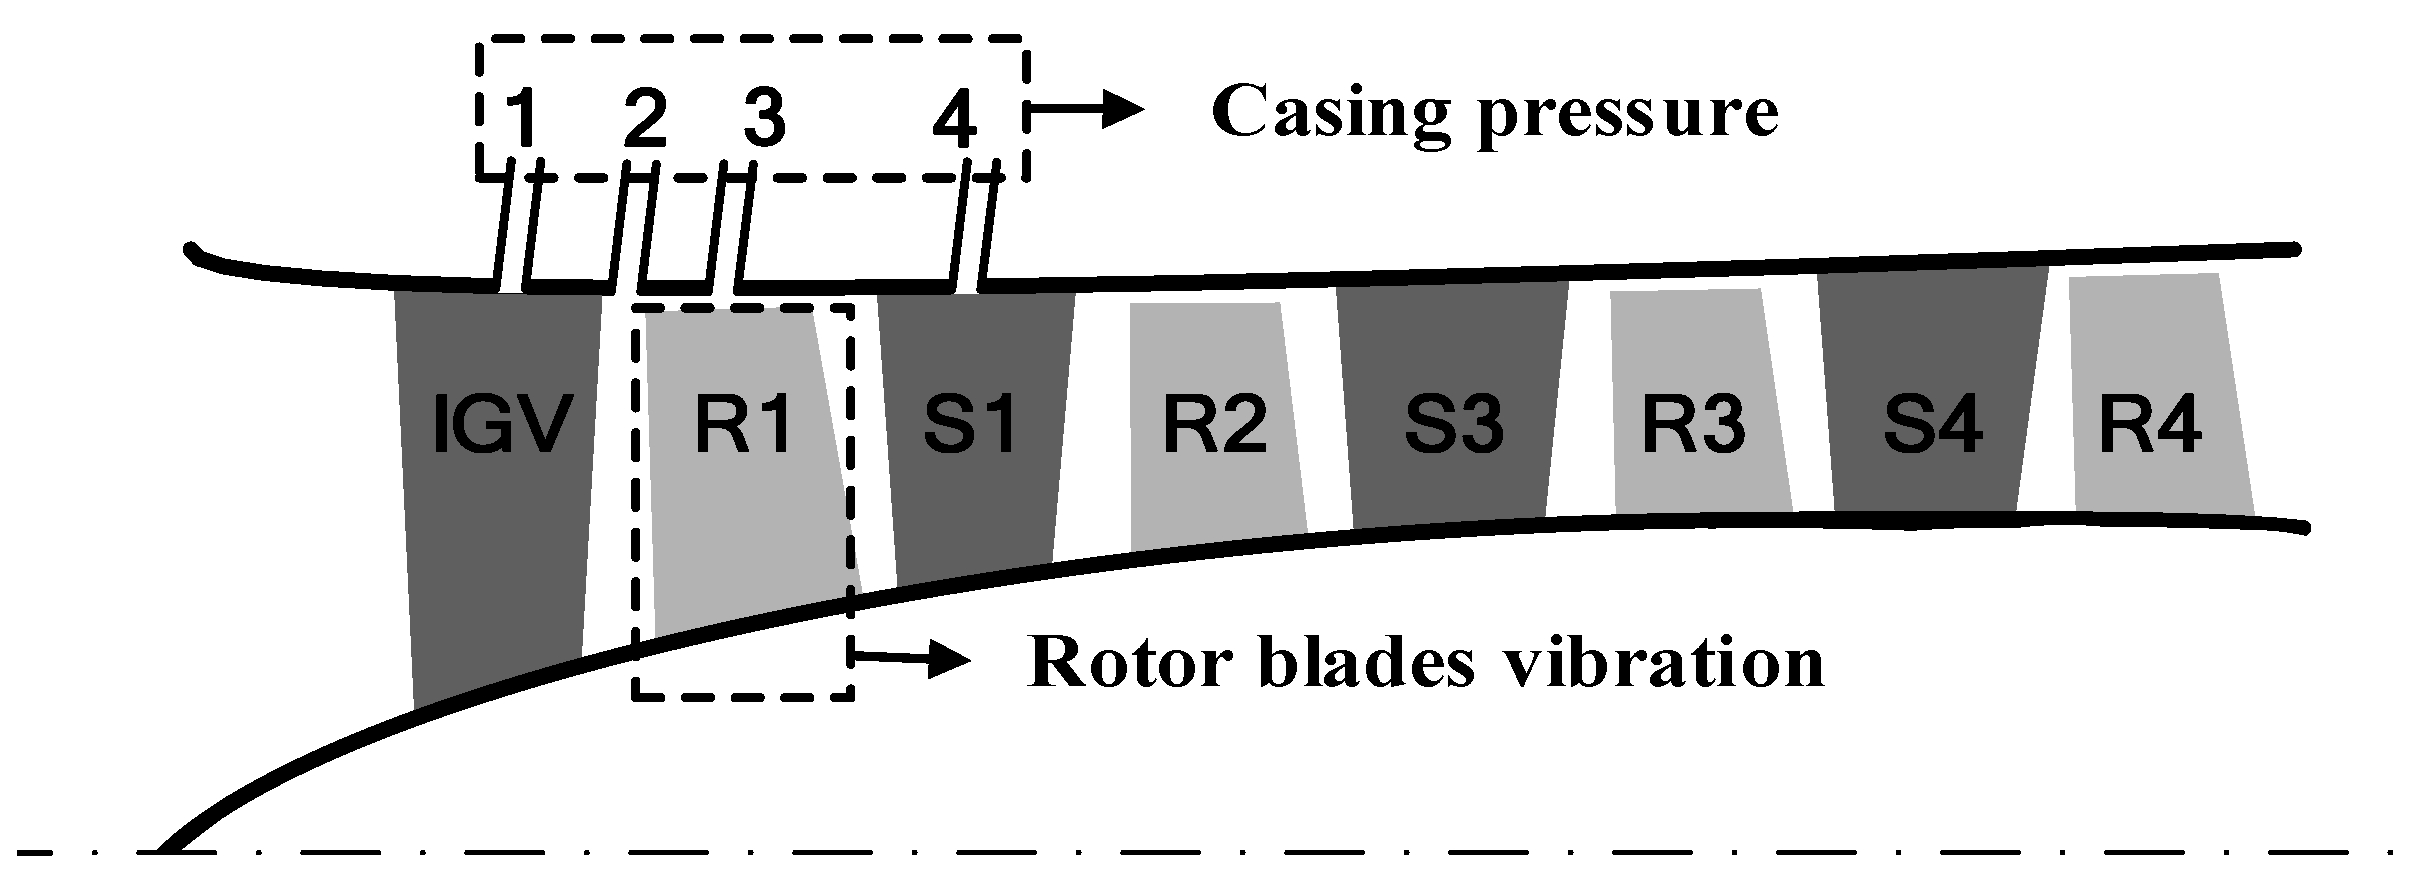
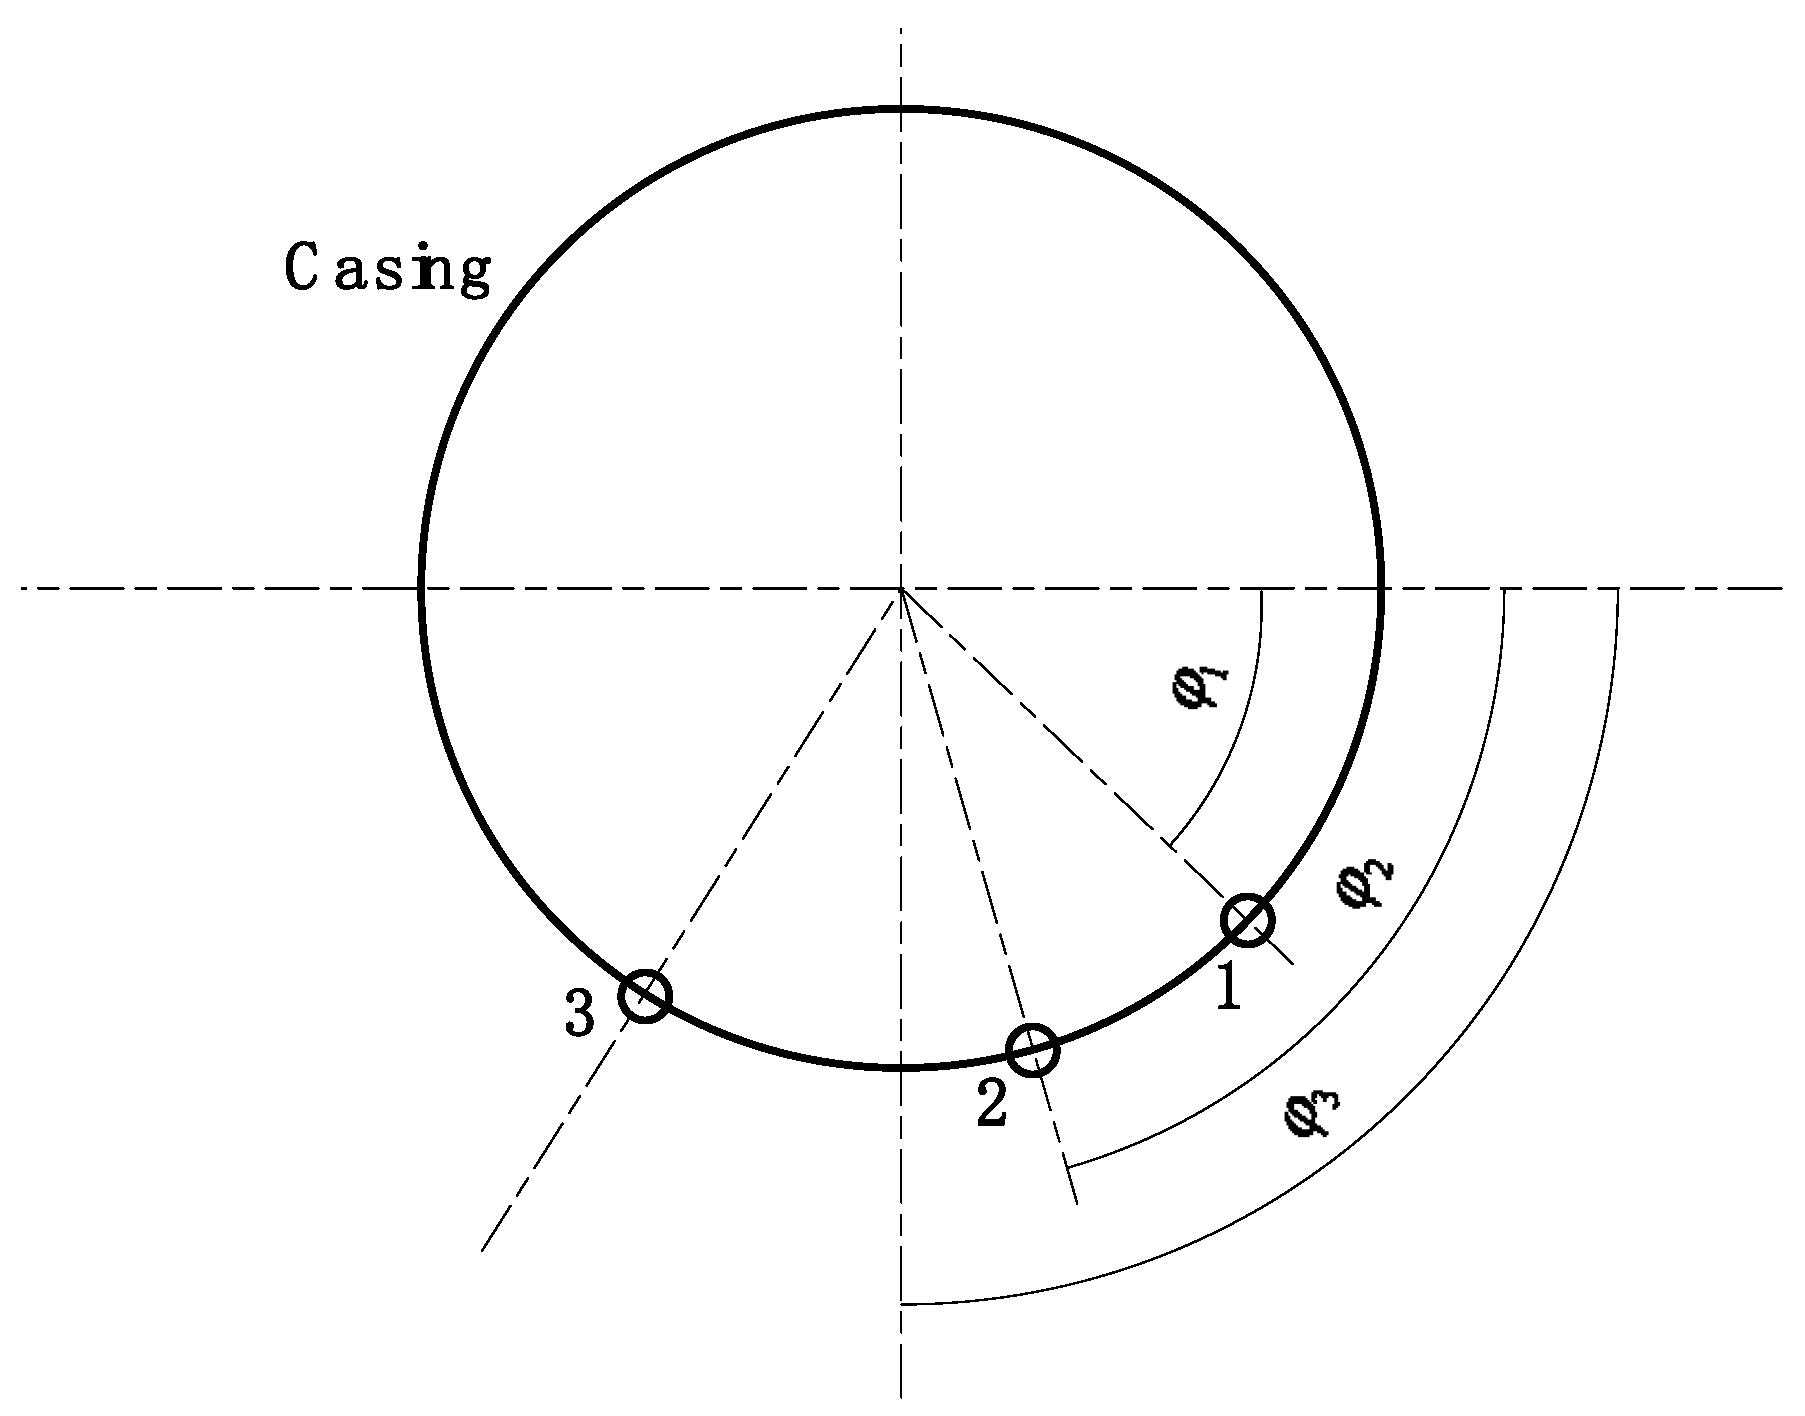
The noise experiment of a certain turbo-fan high-pressure compressor component is conducted with a derived noise test system. This system is consistent with the acoustic waveguide, microphone mounting base, semi-infinite attenuator tube, data acquisition and analysis equipment. The acoustic waveguide is connected to the engine compressor casing and a 1/4-inch condenser microphone is placed inside the microphone support. One end of the microphone support is connected with the acoustic waveguide, and the other end is connected with the semi-infinite attenuator tube. A total of four measuring points are settled to measure the sound pressure distribution along the axis direction in the casing of the compressor. The four measuring points are locked on the zero-stage guide vane channel (IGV), the inter-stage between the zero-stage guide vane and the first-stage rotor blade (IGV/R1), the first-stage rotor blade (R1), and the first stage of the stator (S1) of the high-pressure compressor, respectively. The schematic diagram of the measuring point positions along the axis direction are shown in Figure 1. At the same time, the vibration of R1 with the high-pressure compressor is monitored by a non-contact blade vibration test system which uses three vibration detection points along the circumferential position of the casing. This system is consistent and consists of an optical fiber sensor, photoelectric converter, signal preprocessor and blade vibration data acquisition and analysis software. A fiber optic sensor probe is installed at the designated position of the casing near the top of R1, and the positioning sensor is placed on the surface of the rotor blade. The time difference between the blade tip amplitude pulse and the speed pulse is obtained by measuring and calculating. During the vibration of the blade, the blade tip will shift in the direction of rotation during the process of blade vibration, making the time to reach the sensor change, so the vibration parameter information such as blade amplitude, phase, frequency, and so on, are obtained. The schematic diagrams of different circumferential positions of the vibration measuring points of the first-stage rotor blades are shown in Figure 2.
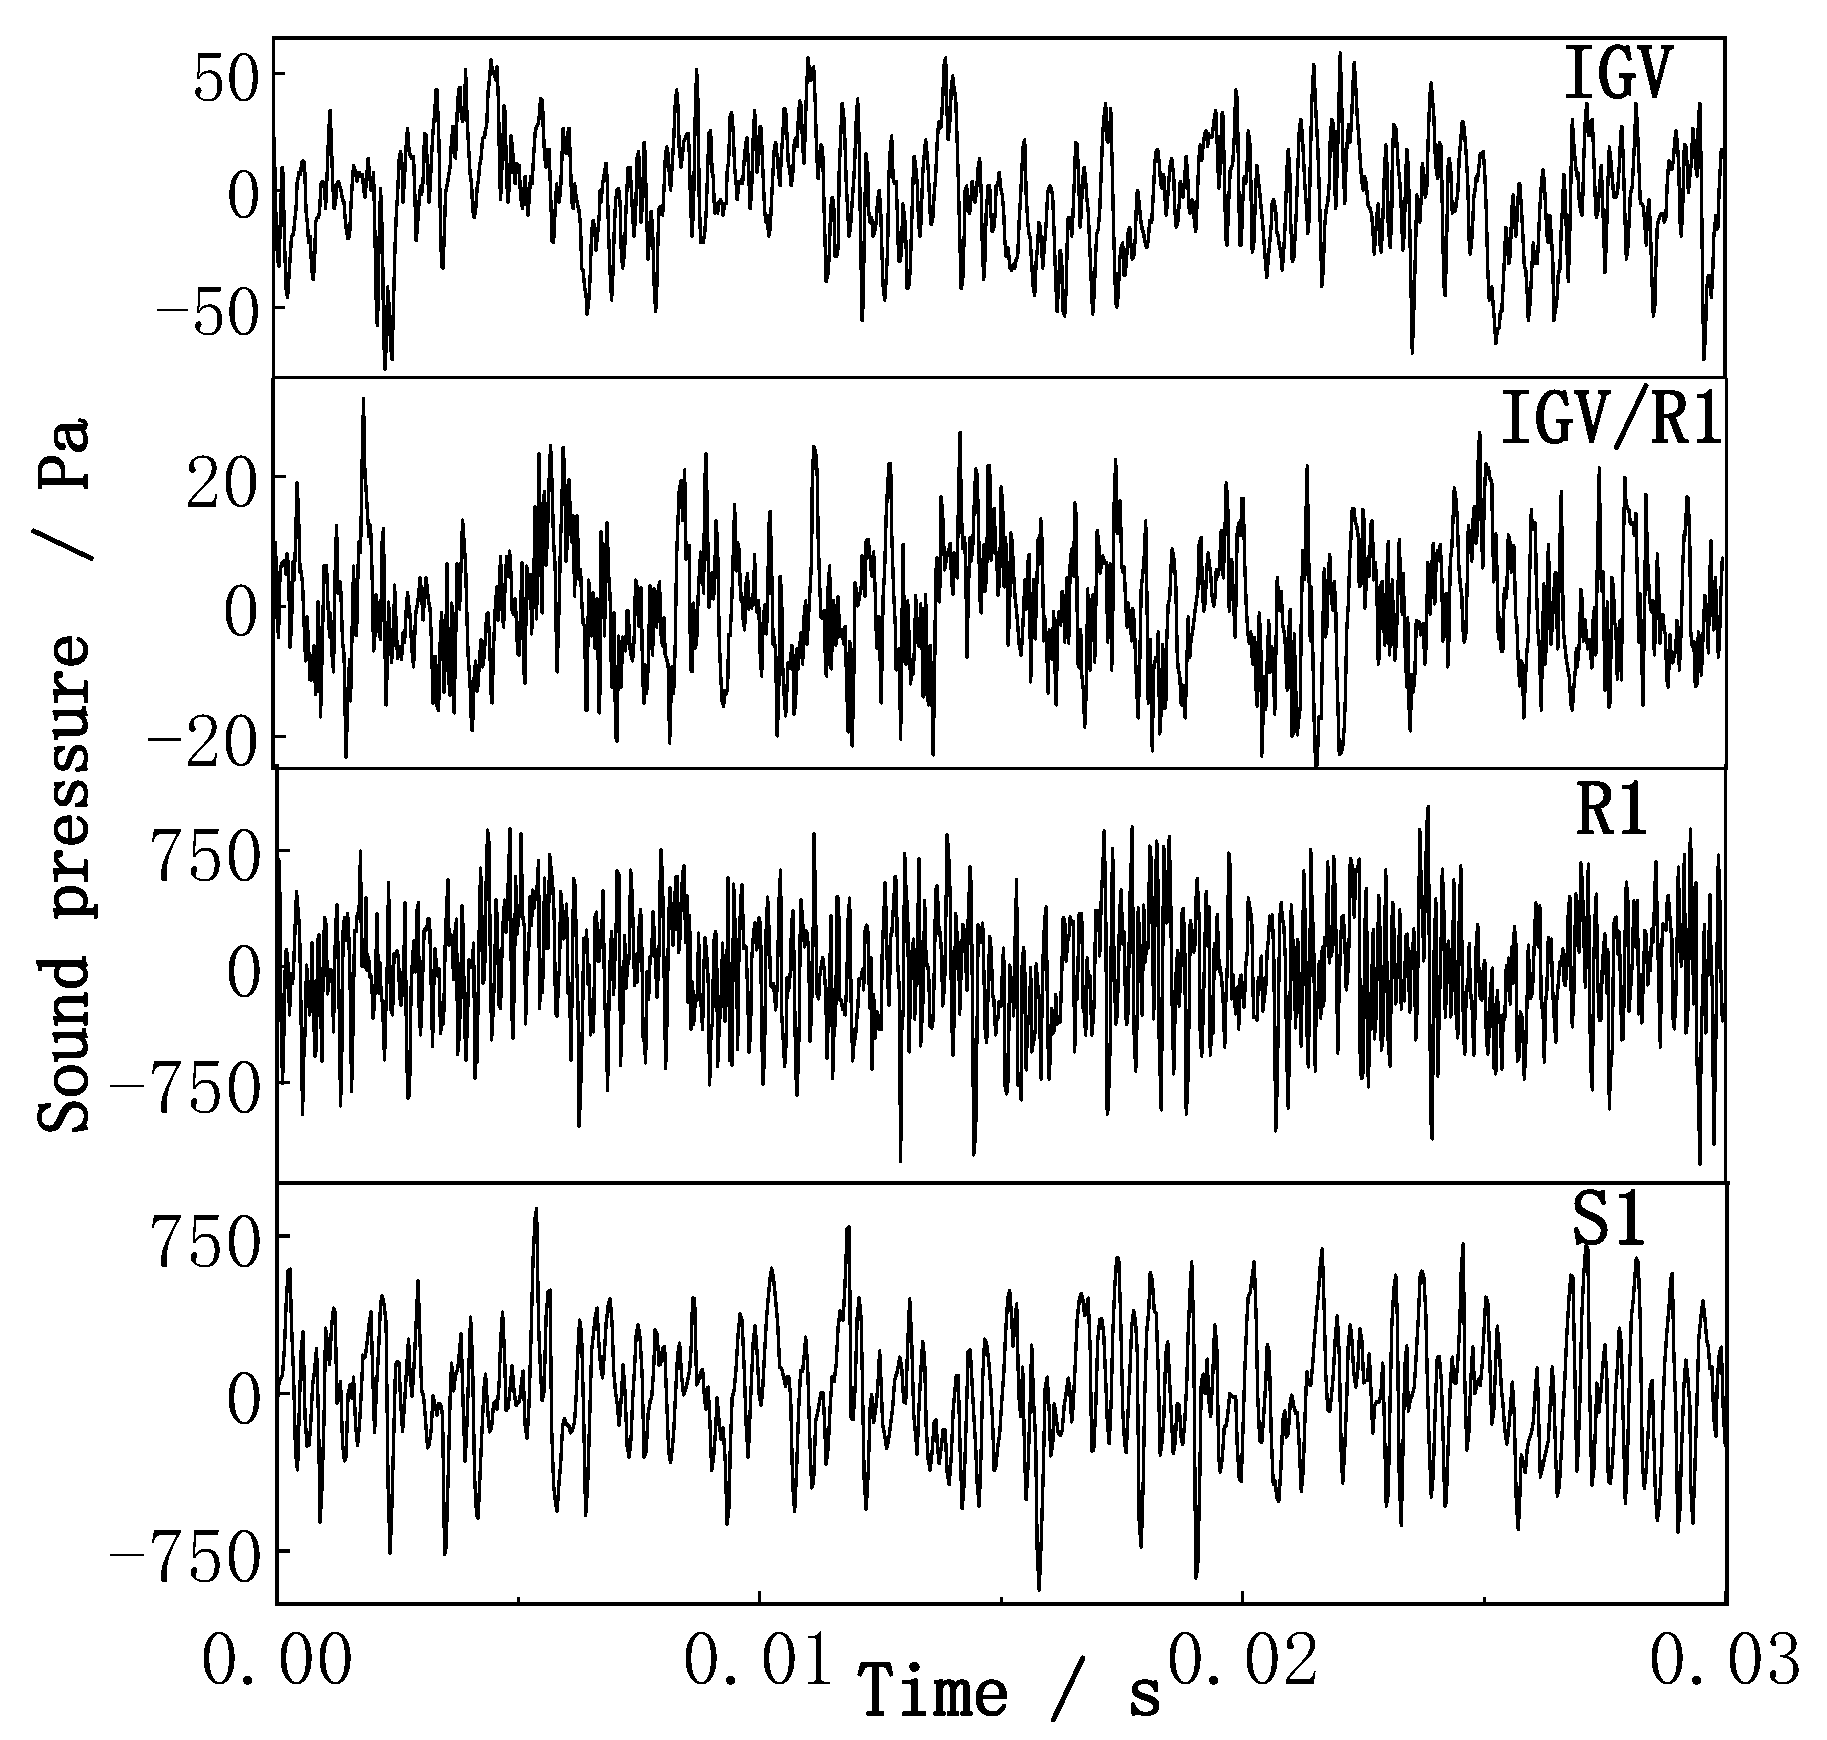
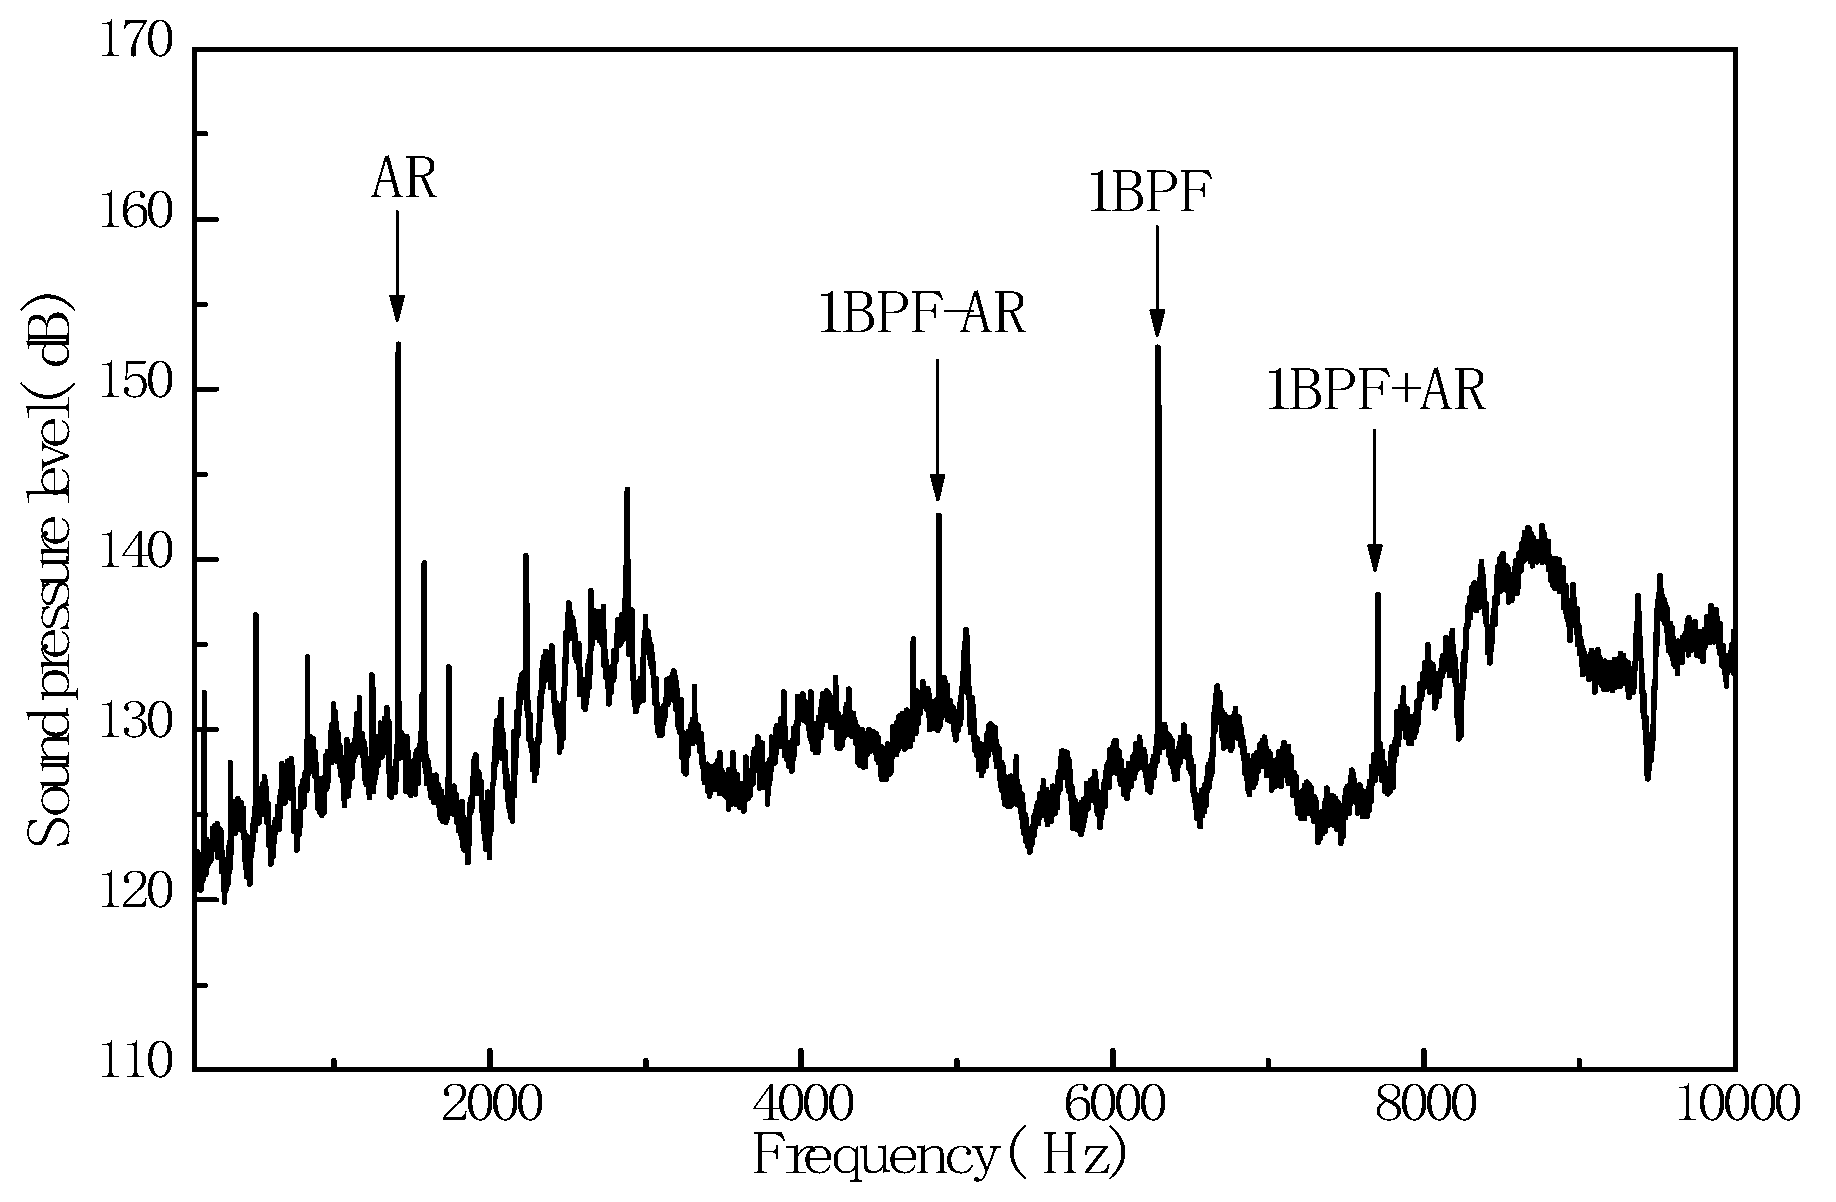
The adjustment of the deflection angle of the zero-stage stator vanes is associated with the air flow state in the flow channel of the high-pressure compressor in the experiment. The noise signals in the flow channel significantly vary with different deflection angles, and abnormal vibration occurs on R1 at the same time. At the condition of a certain deflection angle of IGV of the compressor and a certain rotational speed, the noise signal with characteristic frequency structure in the flow channel is detected, and high-amplitude vibration occurs on the R1. The time series of the character frequency noise signal monitored by the microphones at the four measuring points is shown in Figure 3. The noise signal spectrum with the characteristic frequency monitored in the experiment is shown in Figure 4, and is characterized with typical broadband. 1BPF is the blade passing frequency of the first stage of rotor blades, AR is a special characteristic frequency with the highest peak value. The values measured at the four measuring points all present the characteristic frequencies with multiple high-peak discrete pure tone components. These characteristic frequencies are 1402 Hz for the highest peak value of the pure tone component, 6285 Hz for the high-pressure R1 passing frequency (1 BPF) and 12,595 Hz for the multiplier of the high-pressure R1 passing frequency. Moreover, 4883 Hz had a certain combined relationship with the pass frequencies of the high-pressure R1.
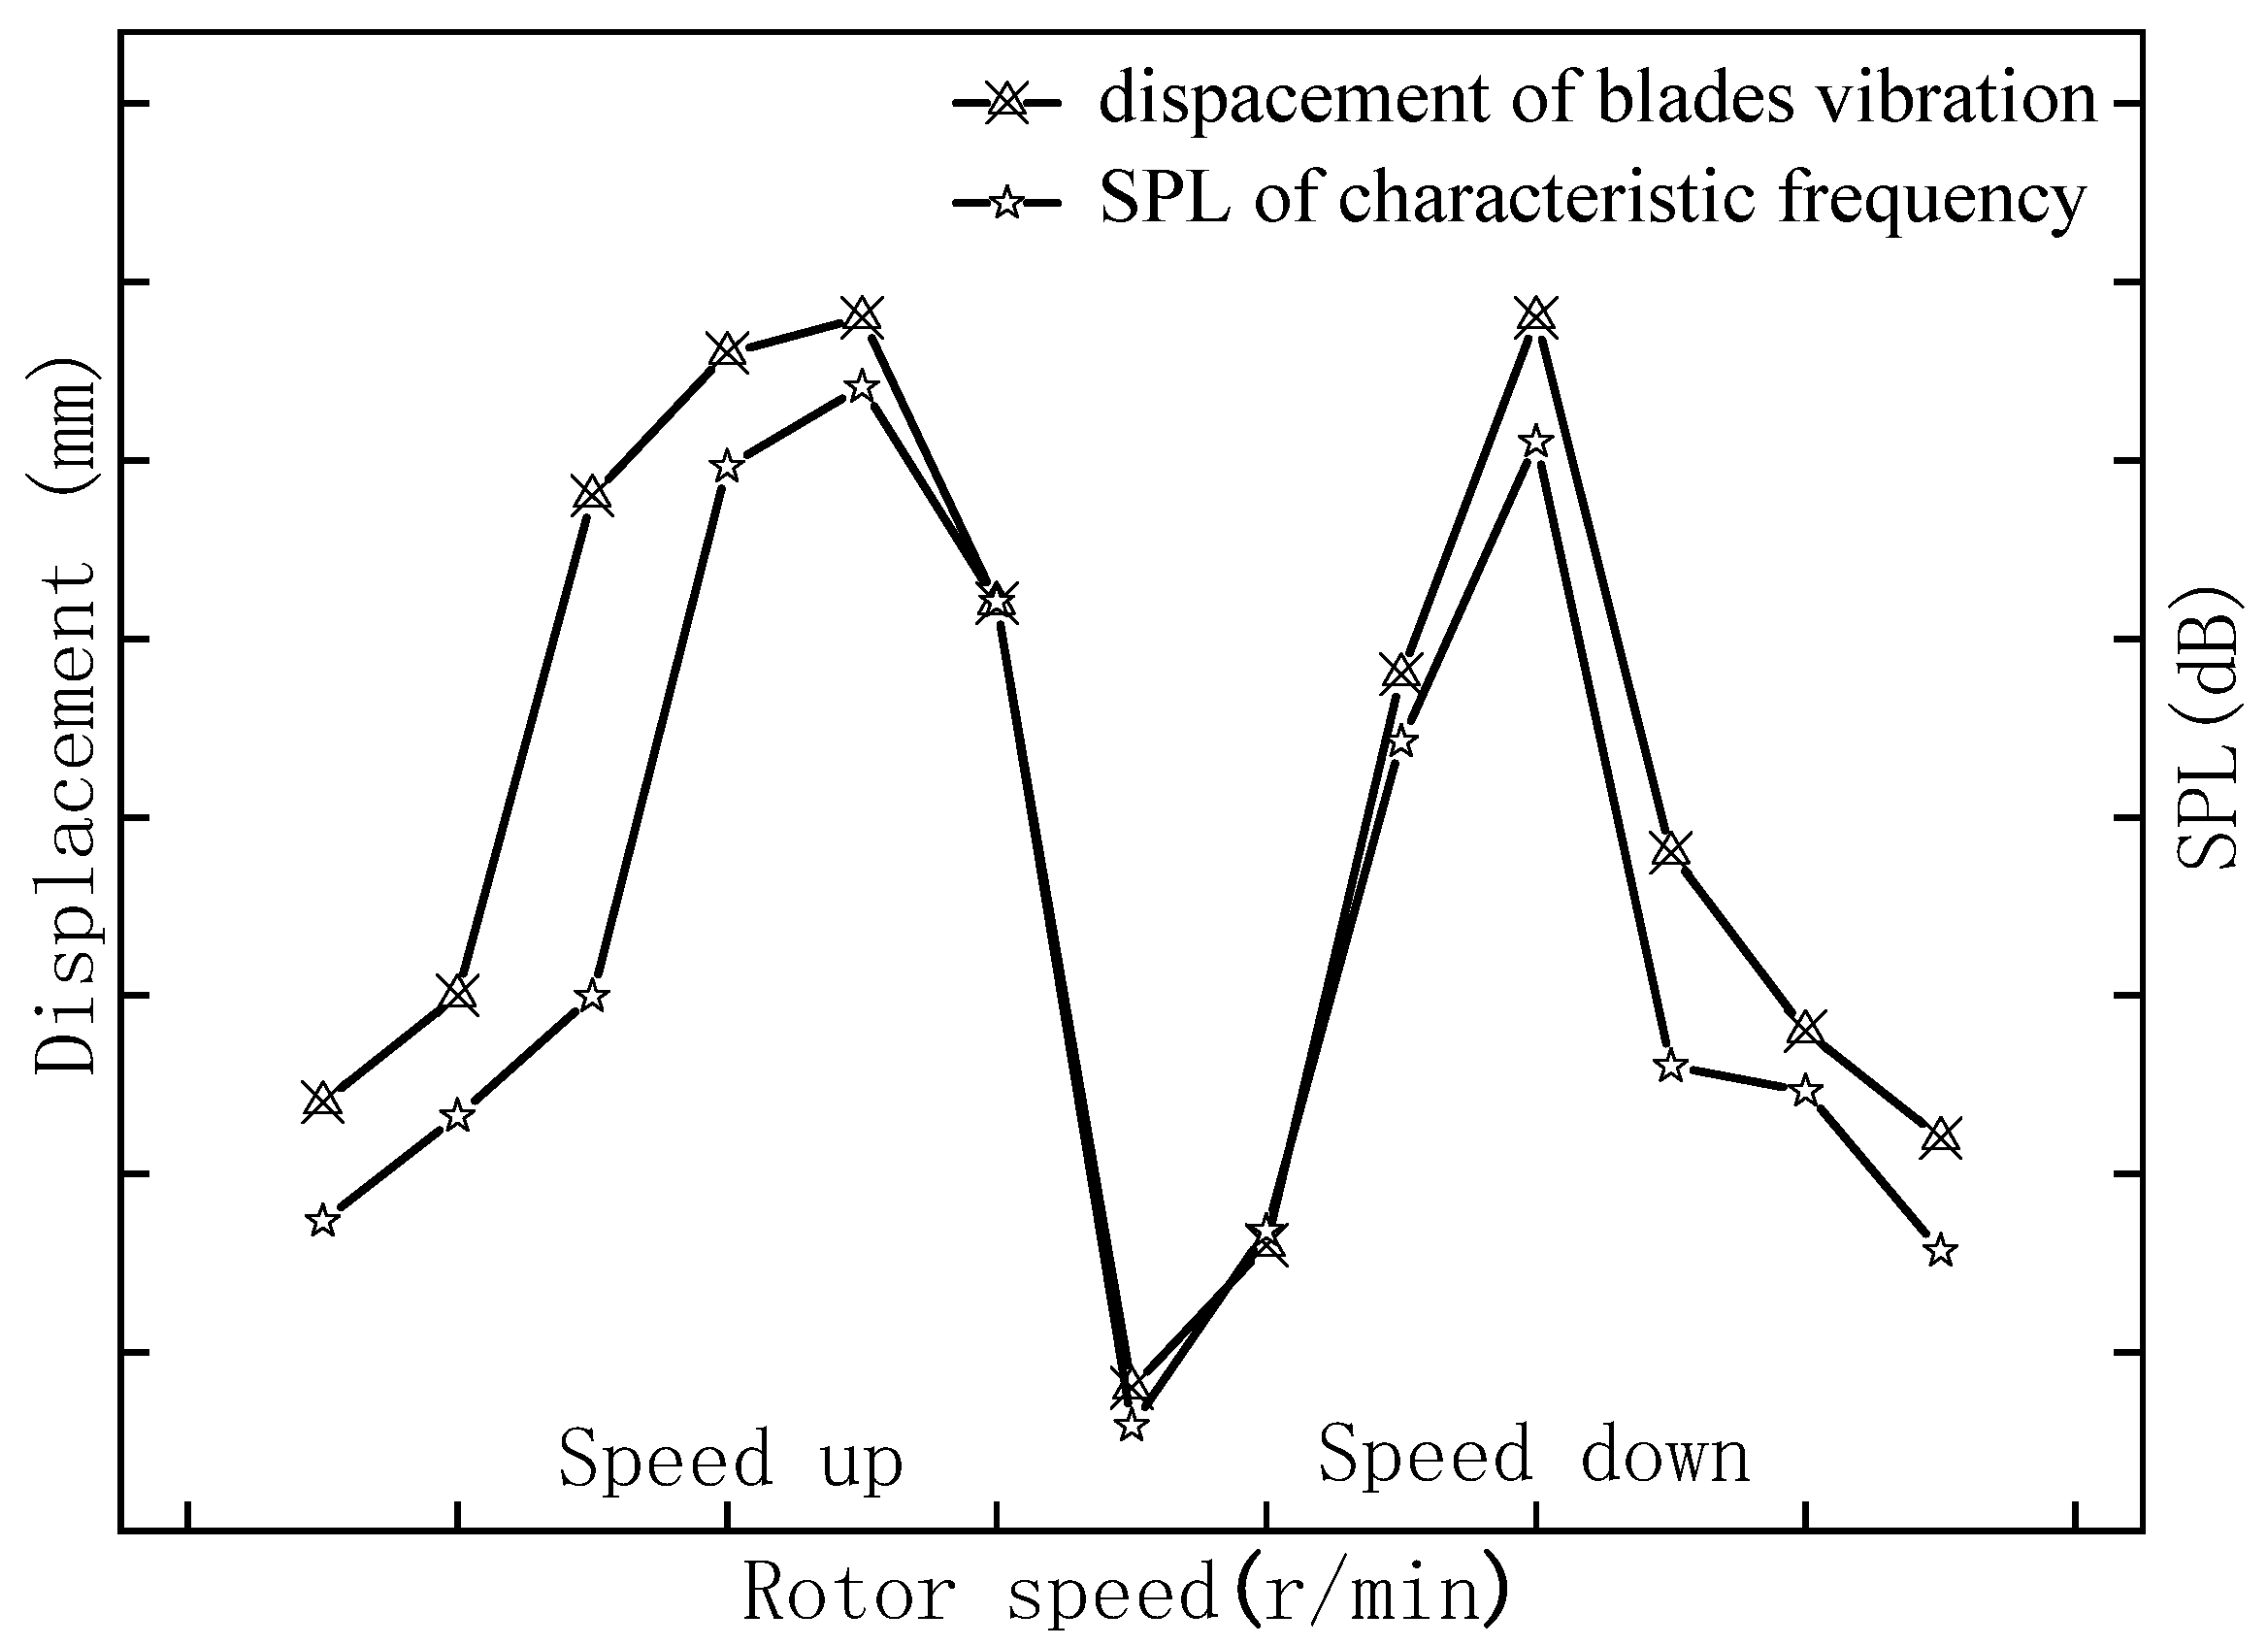
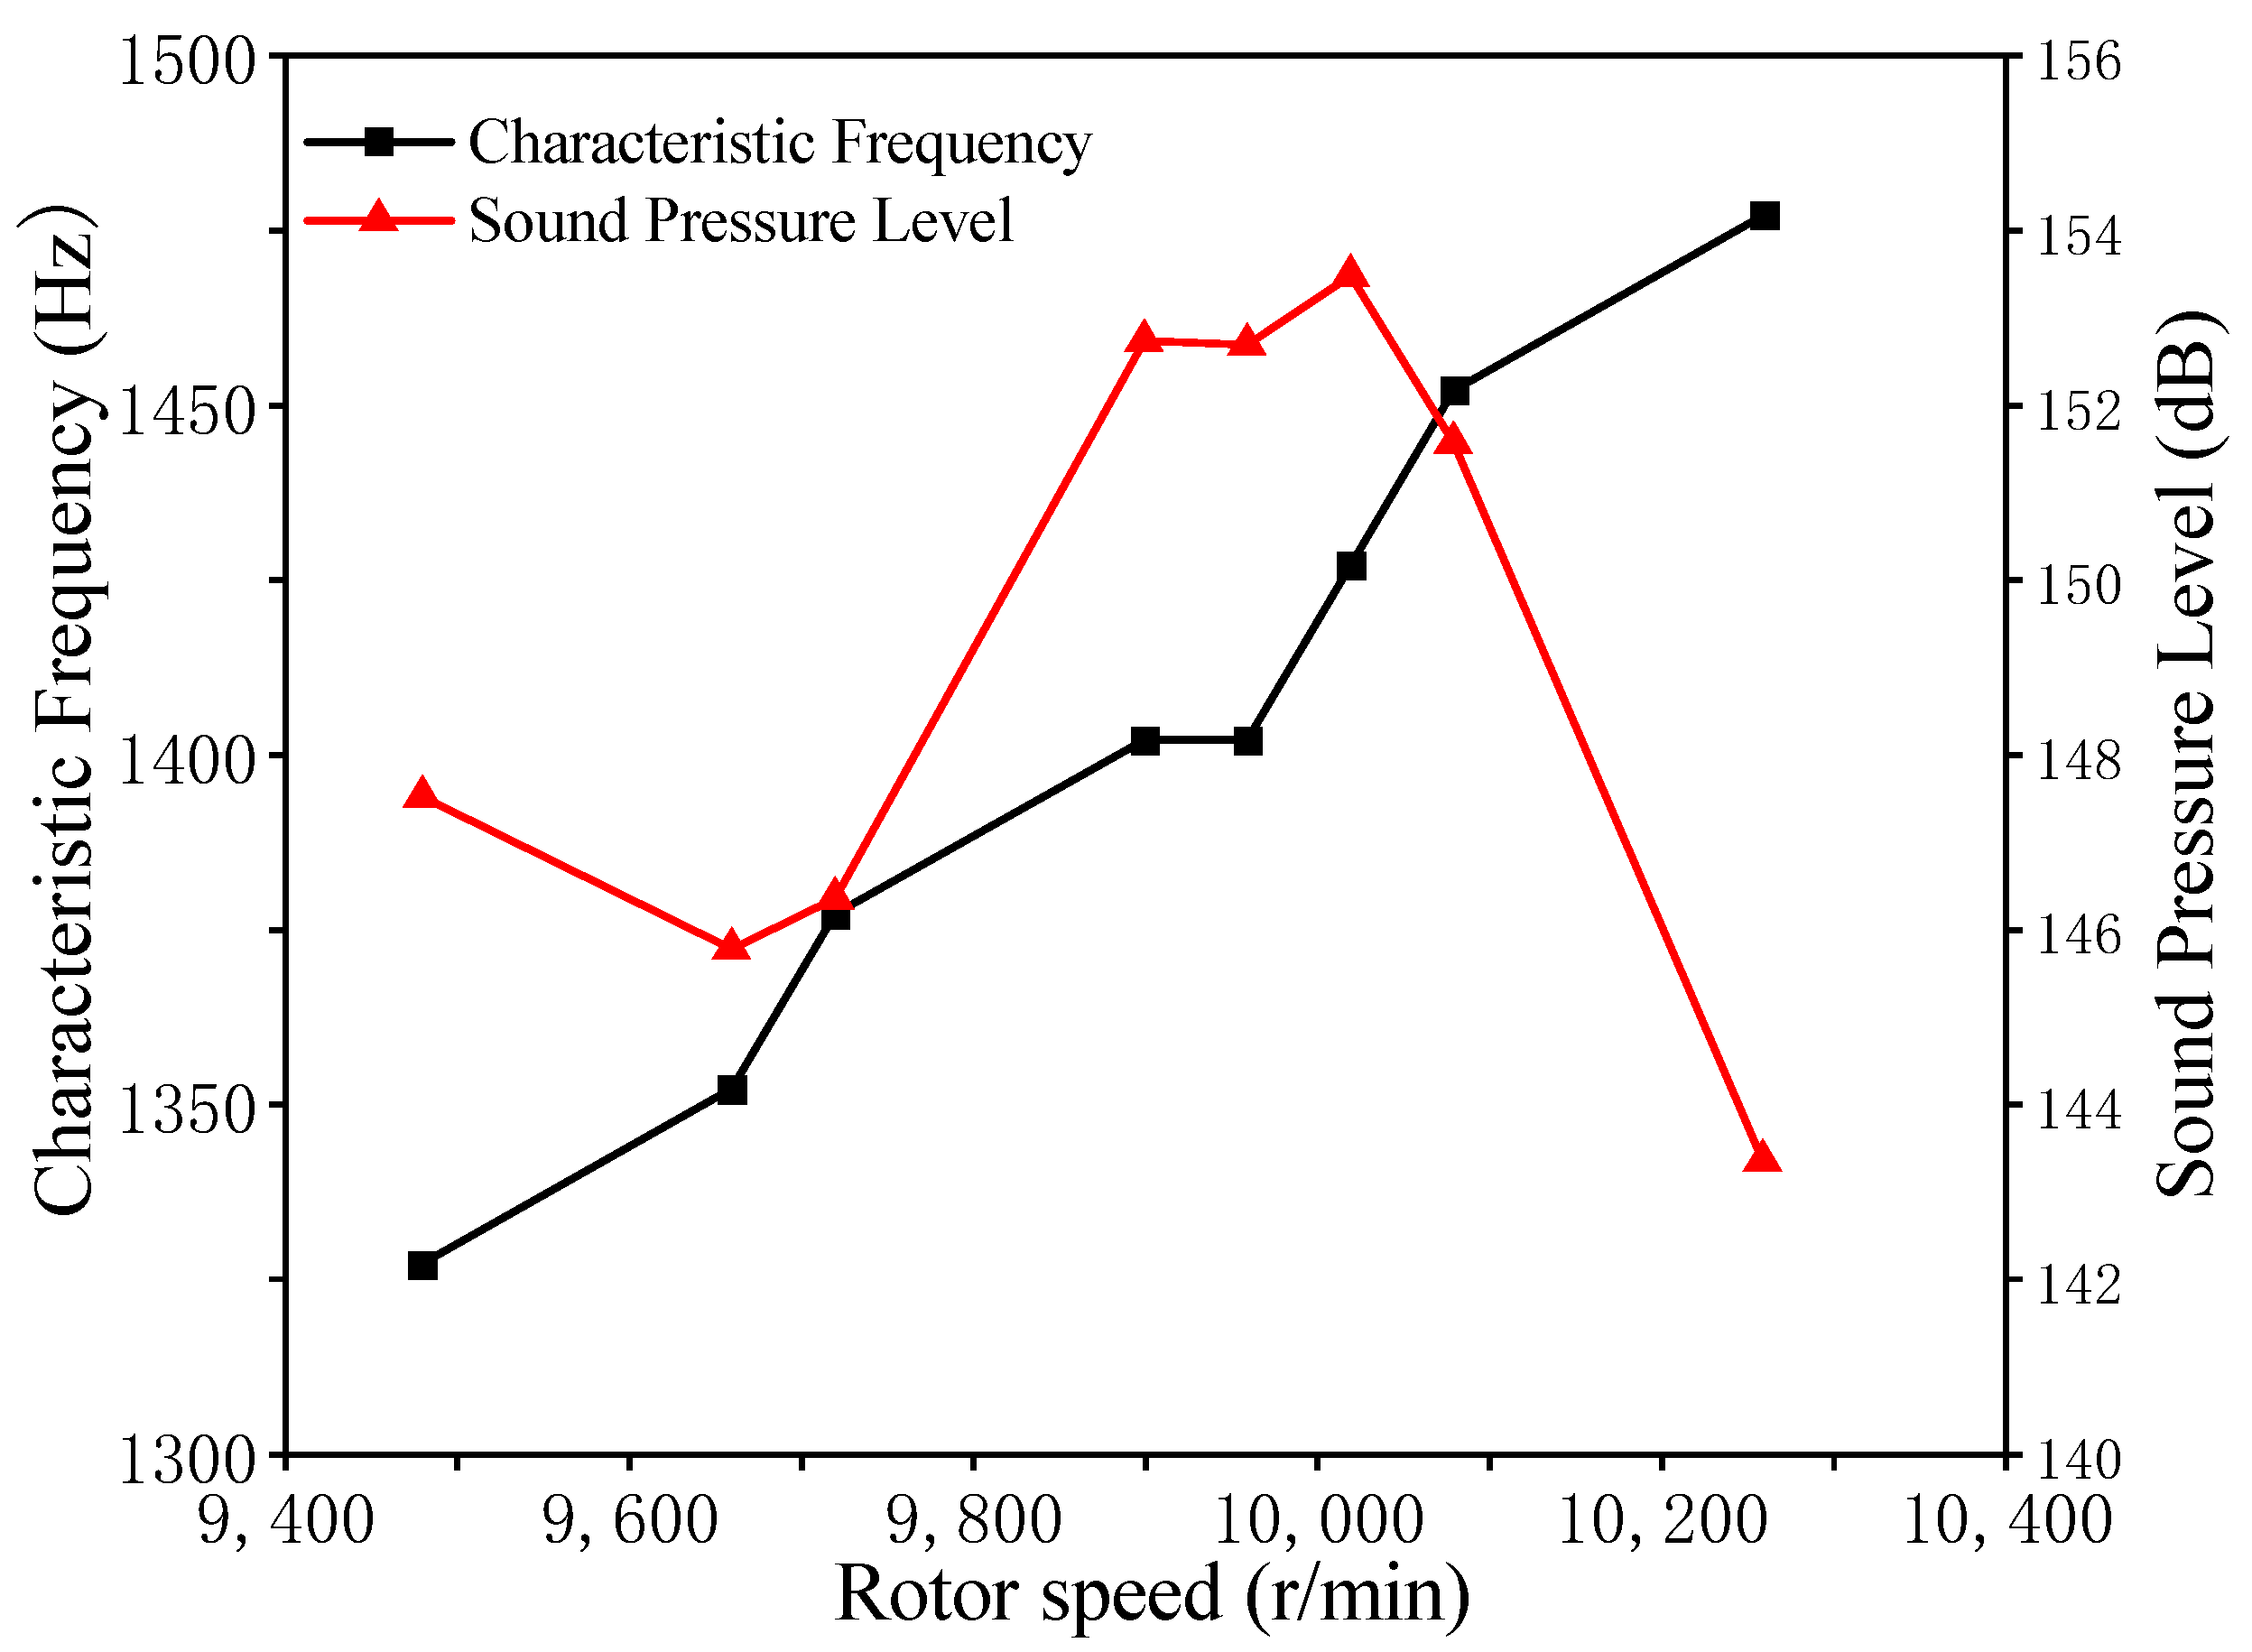
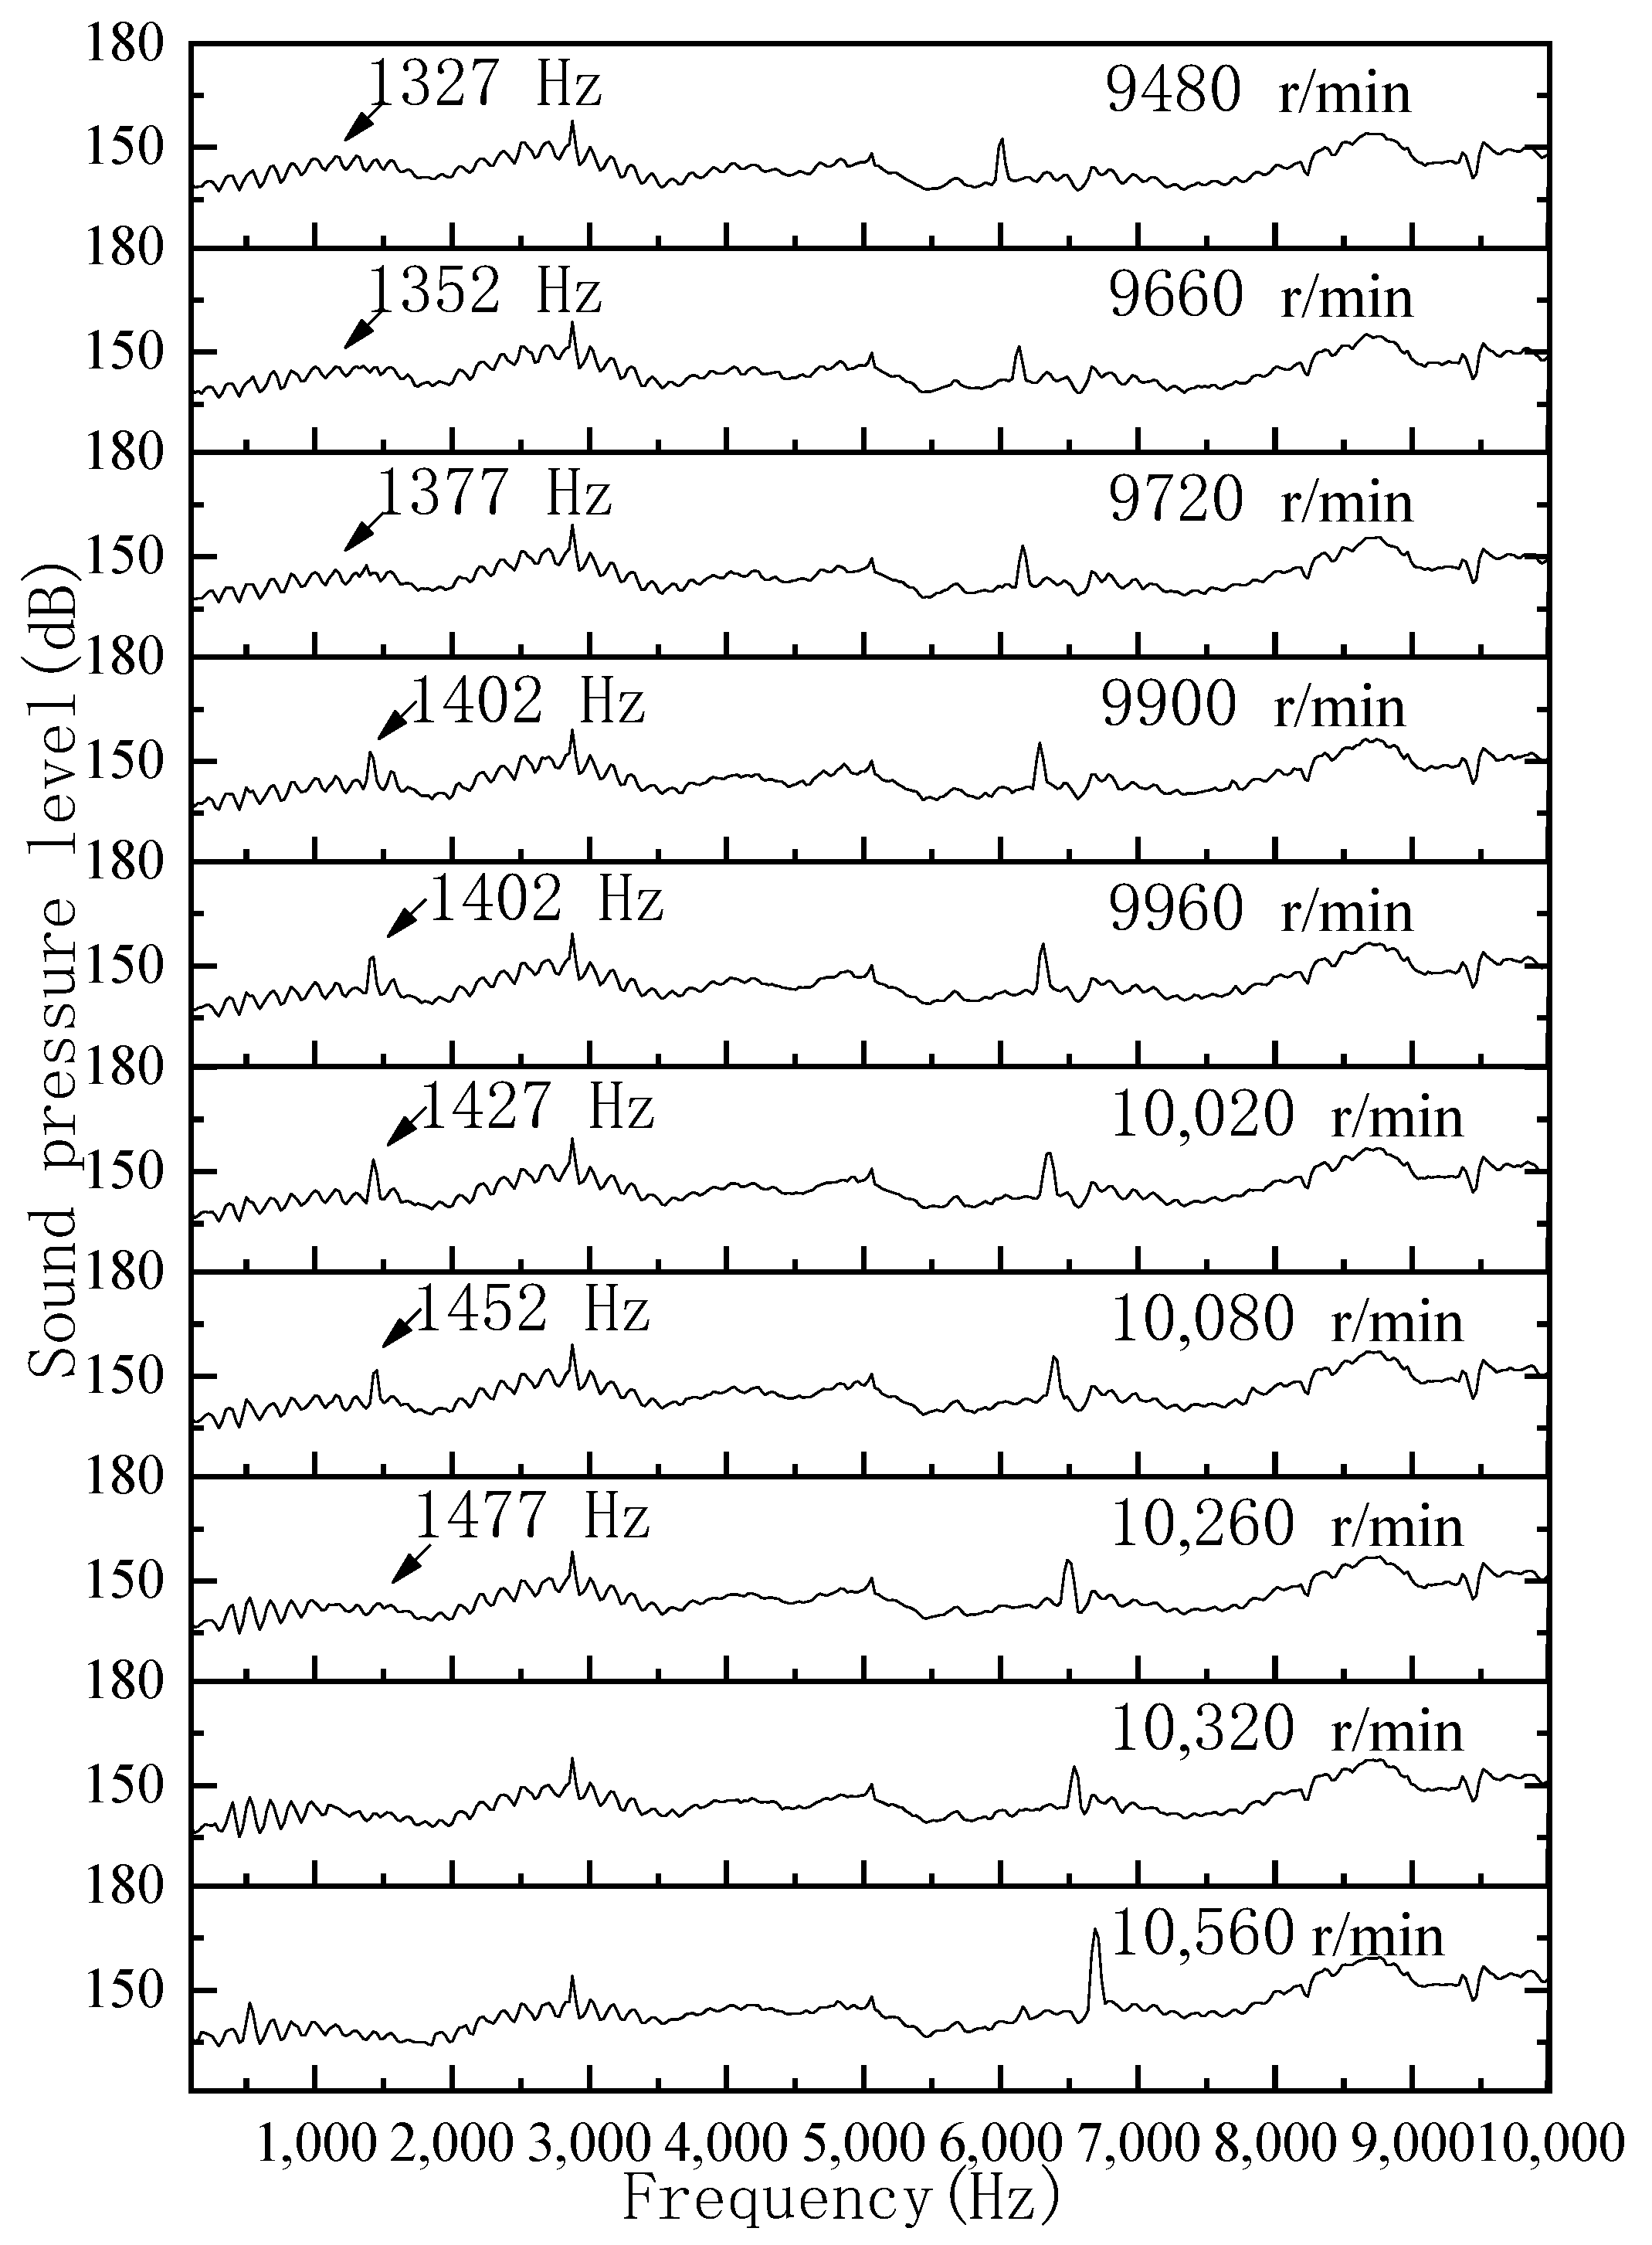
The internal noise and vibration of R1 in the high-pressure compressor were simultaneously measured under different rotational speed conditions in the experiment. The relationship between the vibration displacement of R1 and the sound pressure level (SPL) of the internal characteristic frequency with the rotational speed was obtained through the arranged vibration and noise measurement points, as shown in Figure 5. It is obvious that the vibration amplitude of the high-pressure R1 and the sound pressure level of the noise signal at the characteristic frequency measured directly above the rotor blade increased and decreased synchronously against the rotational speed, and the evolution trends were consistent. When the blade vibration amplitude reached the maximum value, the SPL of the noise signal at the characteristic frequency was also the highest. Therefore, there may be a relation between this characteristic frequency and the vibration of R1. Figure 6 shows the noise spectrum in the compressor with different rotor speeds. The evolution rhythms of the characteristic frequencies and SPLs corresponding with the increasing rotor speeds are derived in Figure 7. It was found that this characteristic frequency increased with the rotor speed. The SPL corresponding to characteristic increased with increasing rotor speed; it reached the maximum value of 153 dB at the rotor speed of 10,020 r/min. Then, SPL suddenly decreased with the rotor speed. Additionally, there was a special phenomenon in a certain rotor speed range which the characteristic frequency did not change with the rotation speed.
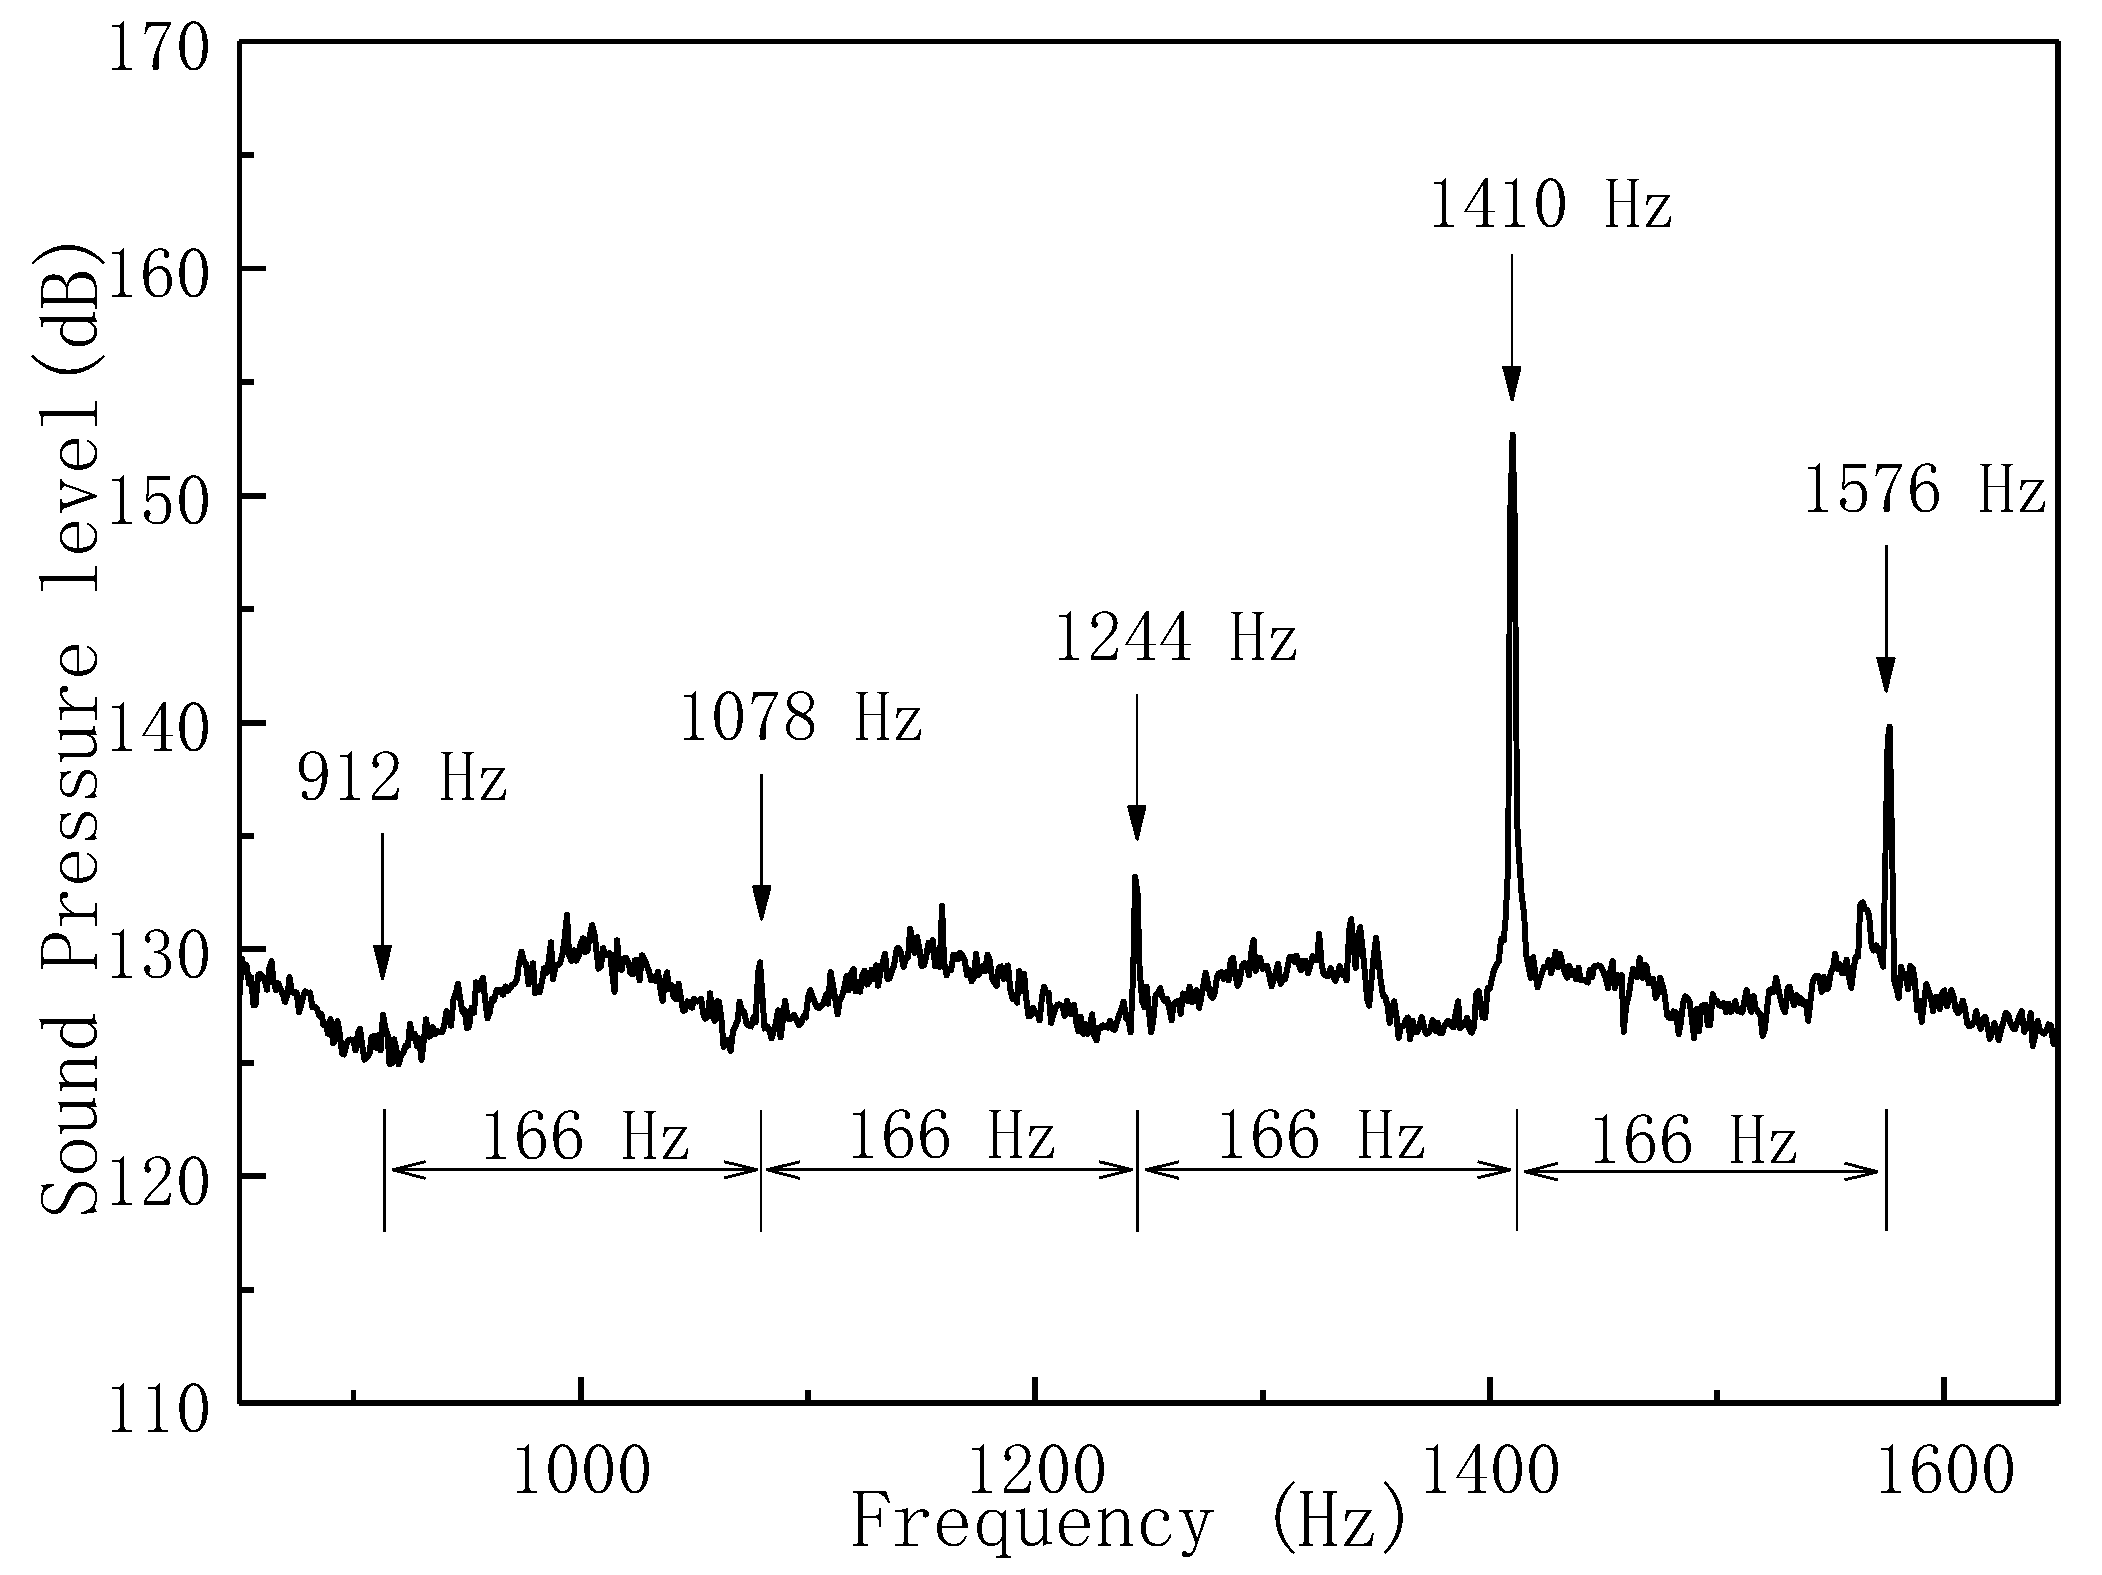
The consistency of the character frequency evolution rhythm and the vibration of the rotor blades with rotor speed suggest the relationship between these factors. Figure 8 shows that, when high-amplitude vibration appears on a rotor blade, several peak frequencies with equal space appear around a characteristic frequency of 1410 Hz. This phenomenon is consistent with the characteristics of rotational sound sources. This frequency interval is perfectly matched to the rotational speed of the rotor and further confirms that a certain connection between character frequency and the vibration of the first-stage rotor blades can be made.
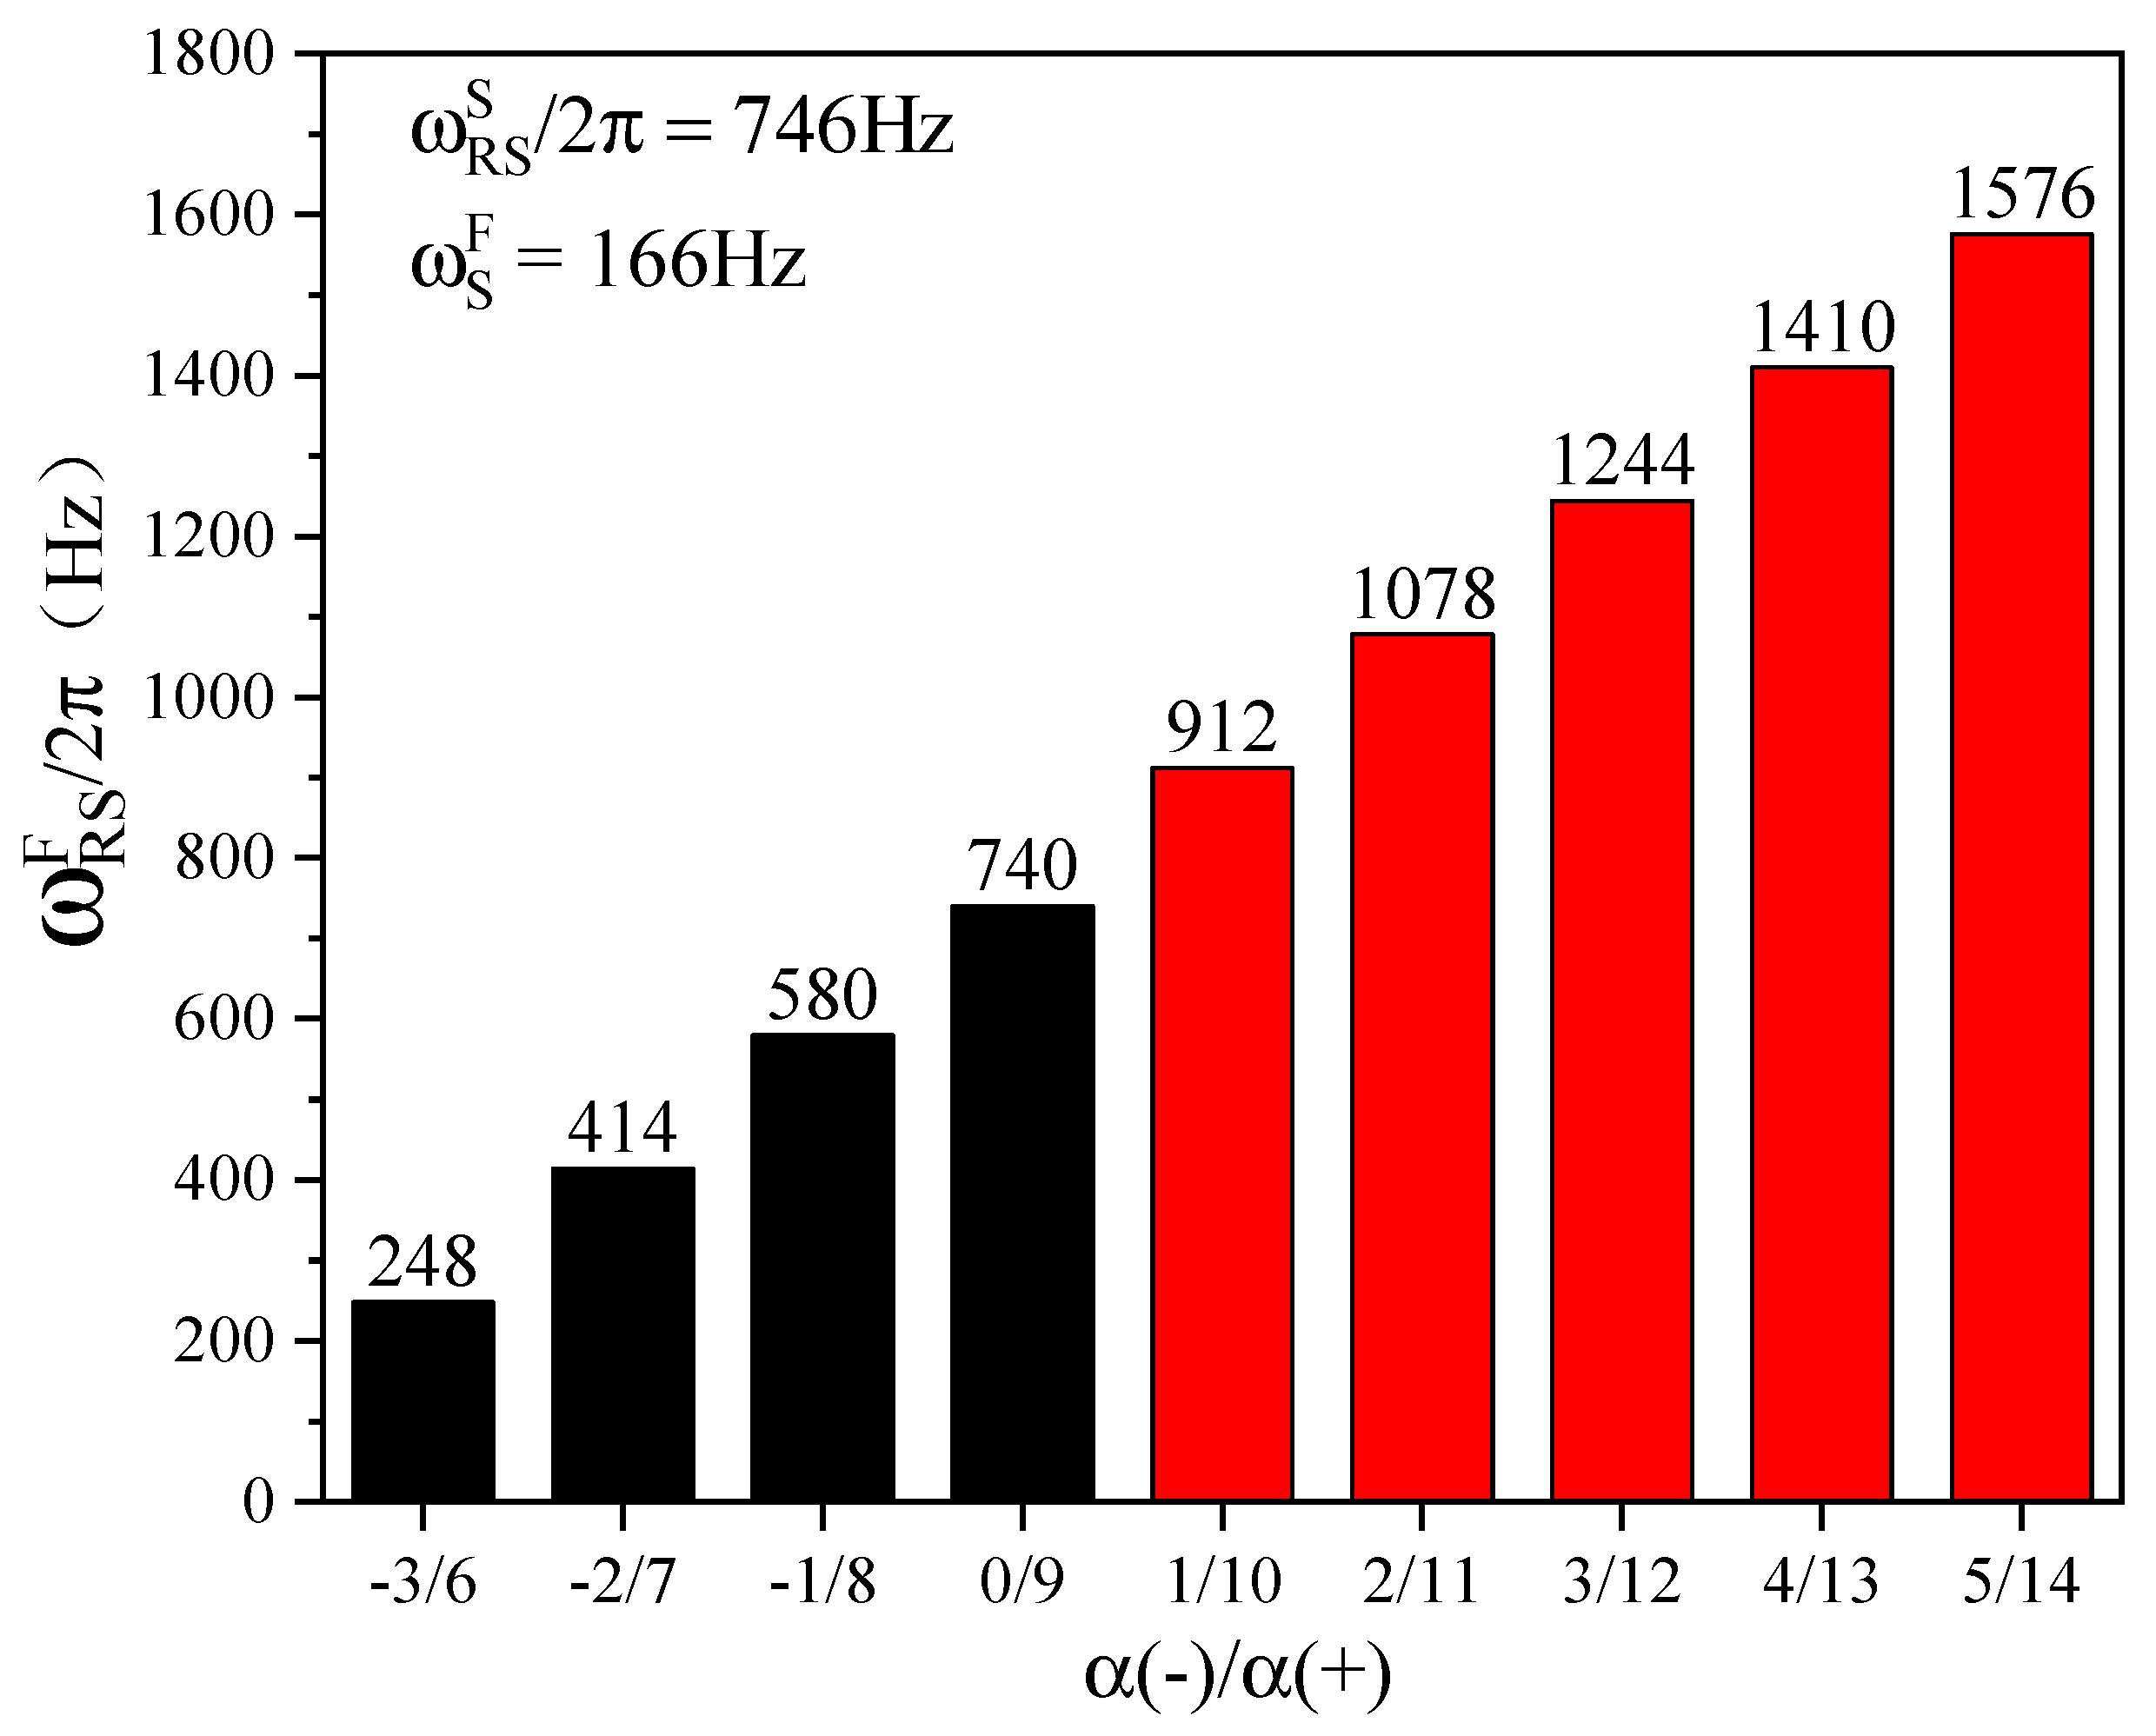
It can be assumed that rotational noise source is the reason for the vibration of R1. Then, the rotational noise source frequency should be consistent with the blade vibration frequency when the high amplitude appears on R1, i.e., ω RS S / 2 π = 746 Hz . When the rotational noise source rotates around the rotor blade circumferentially at a certain rotational frequency, a series of pure tone components with equal frequency intervals which are consistent with the rotational frequency will be modulated under different circumferential modal numbers. These pure tone components comprise the rotational noise source frequency, ω RS F / 2 π , measured in a fixed coordinate system. Figure 8 shows that the rotational frequency of rotational noise source is Ω S F = 166 Hz . Taking the ω RS S / 2 π and Ω RS F values into Formula (12), the rotational noise sources corresponding to different circumferential modal number systems can be obtained, as shown in Figure 9.
According to the above assumptions, the rotational instability noise source frequency and the rotational frequency corresponding to the resonant frequency of the high-pressure first-stage rotor blade are taken as input. When the circumferential modal number of the rotating noise source is 4 or 13, the 1410 Hz pure sound component when the high-amplitude first-stage rotor blade vibrates can be recovered. Additionally, under other circumferential modal numbers, the peak frequencies at equal frequency intervals near the pure tone component can also be recovered. Considering that the rotationally unstable pressure wave usually occurs in the compressor with a higher modal number, the modal number corresponding to the 1410 Hz pure tone component should be 13. Therefore, we can be sure that the assumption is reasonable and correct, and the mechanisms of characteristic frequency noise sources and the high-amplitude vibrations of the rotor blades are clear. It is worth noting that the noise frequencies of other circular mode numbers do not appear, which may be ascribed to the internal structural dimensions of the compressor.

4. Numerical Method Validation

A research method based on this acoustic analogy is developed to investigate the characteristics and mechanisms of high-intensity sound generated in a rectangular cavity pipeline, and is established on the basis of Ziada’s experimental devices for built-in plate pipelines. The whole process of the calculation is described in detail. The validity and applicability of this method are verified with comparison between the results calculated and the corresponding data achieved in the experiment.

4.1. Computational Model

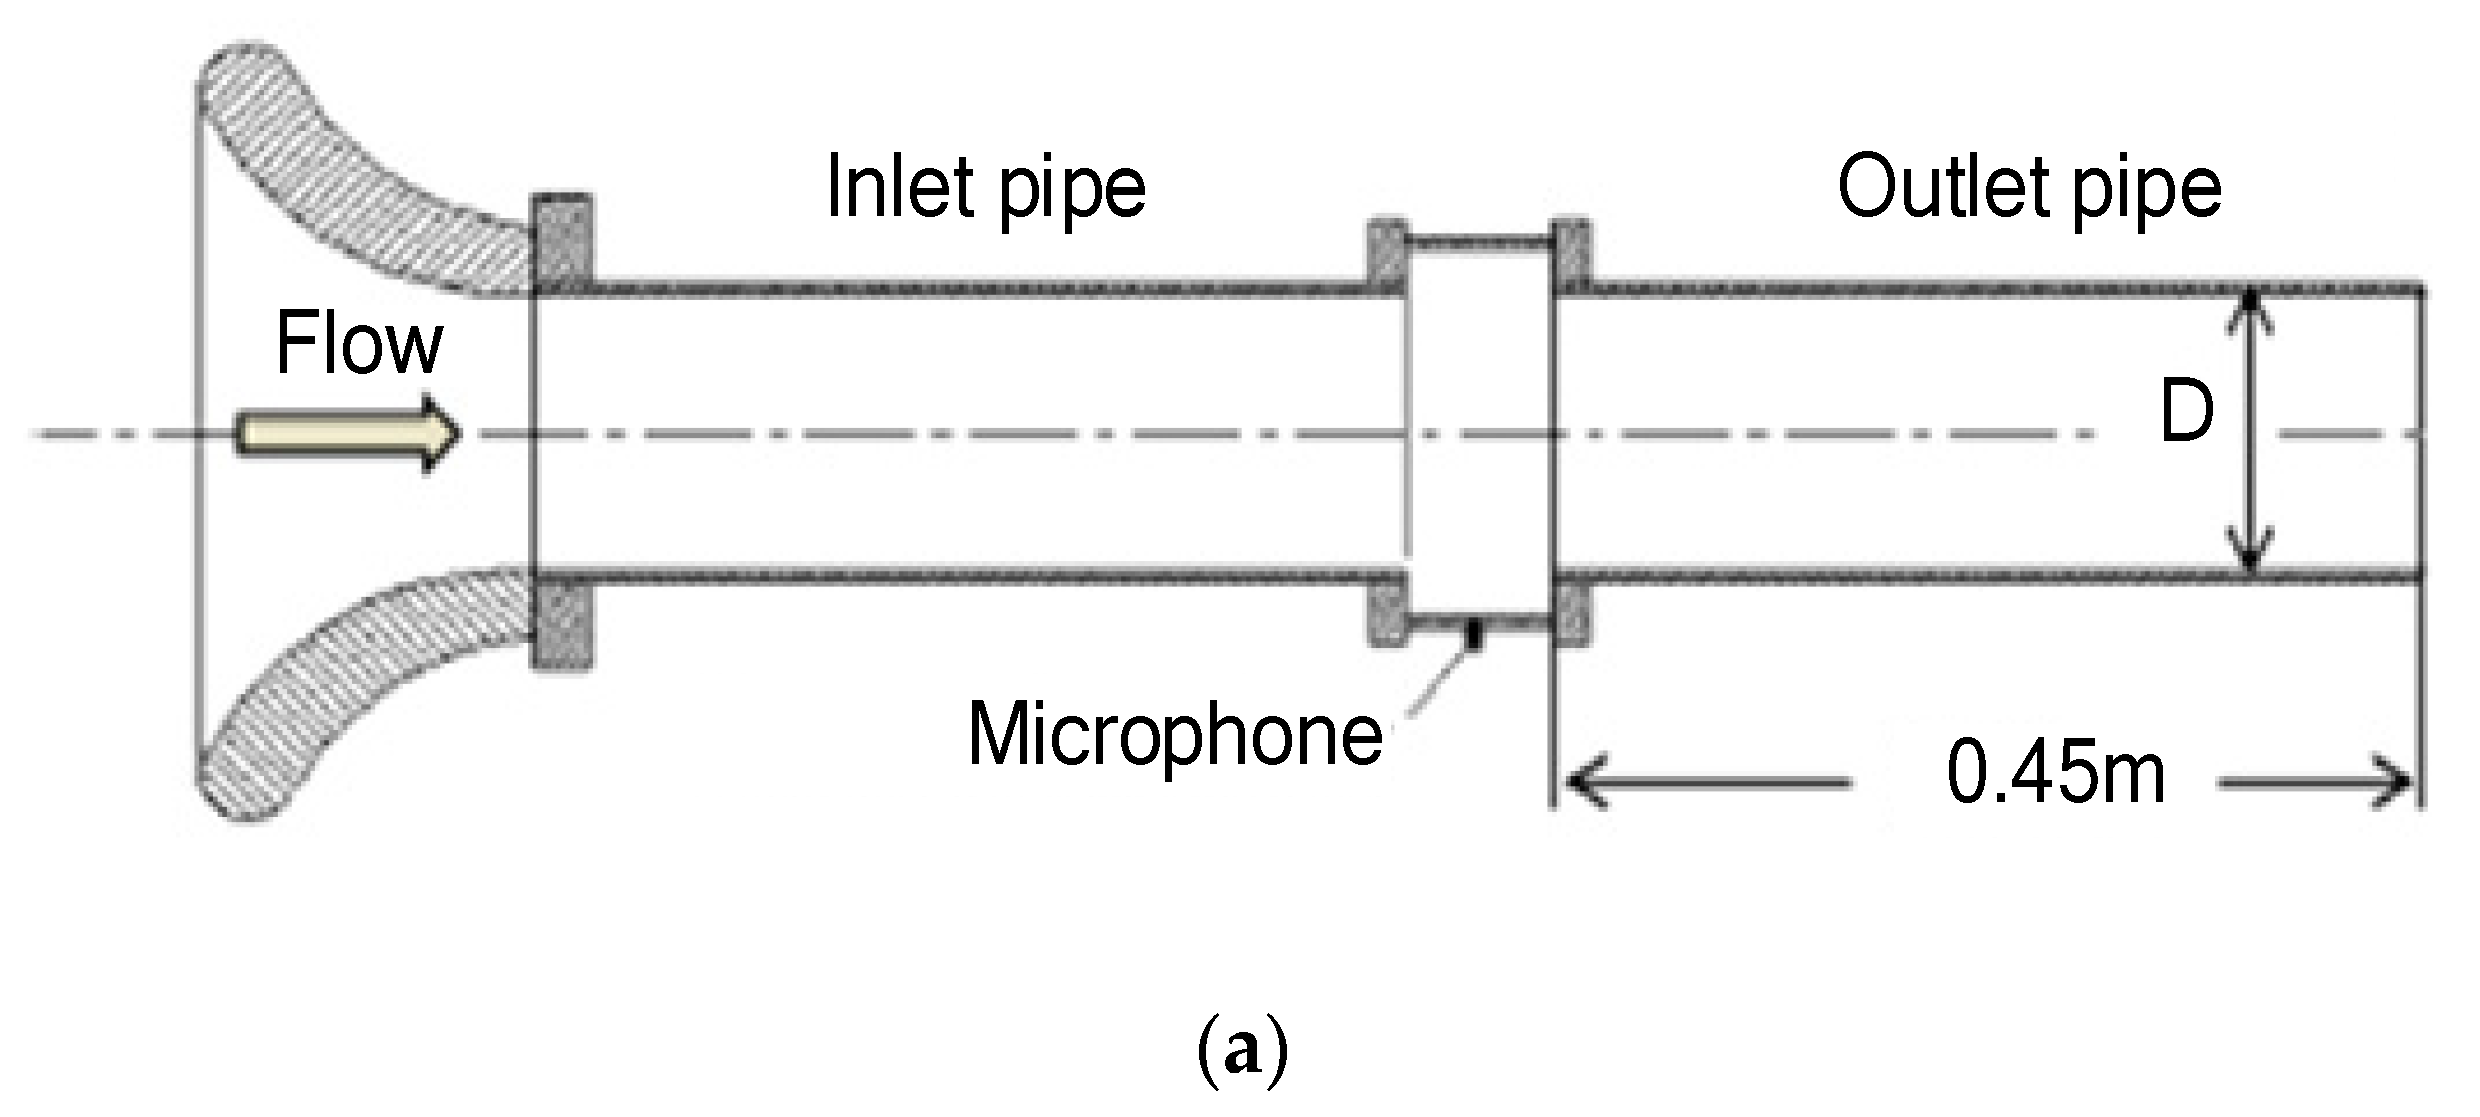
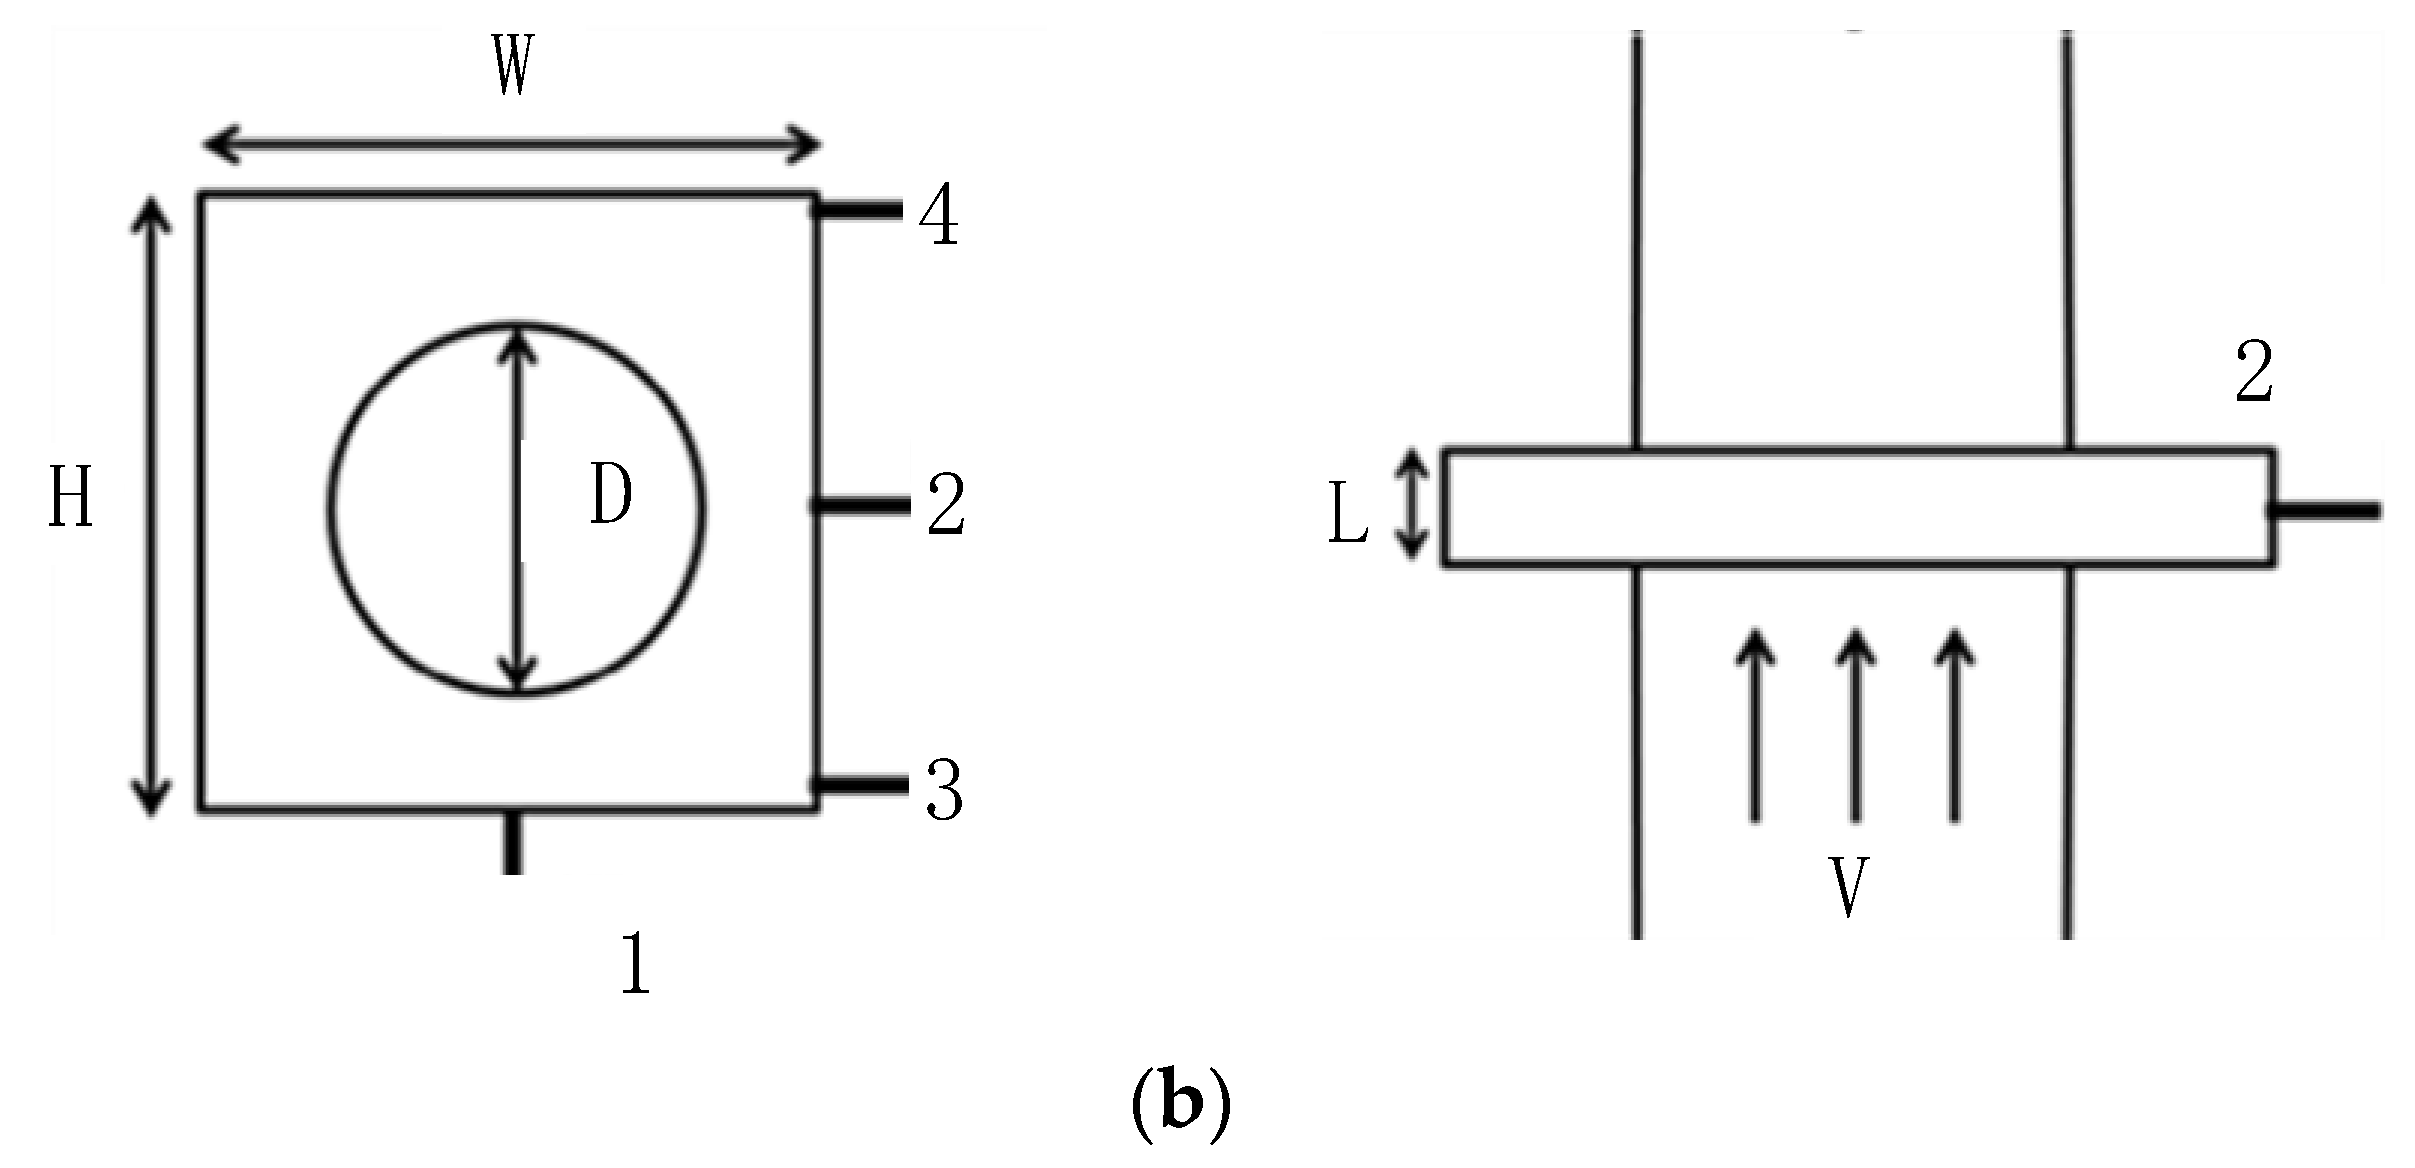
The calculation of cavity flow-induced acoustics is the basis for the study of sound induced by the wake vortices of plates. In this paper, the rectangular cavity pipeline model proposed by Ziada is used as a reference [34] to calculate and analyze the flow-induced sound characteristics of a rectangular pipeline. At the same time, the calculation method used in this paper is verified. Ziada established a rectangular cavity pipeline model and designed rectangular cavities with different geometric dimensions to investigate flow-induced sound in industrial valve pipelines. By means of experimental measurement and numerical simulation, a link between intake air flow and acoustic mode inside the rectangular cavity pipeline is studied. The rectangular cavity pipeline model is consistent with two circular straight pipes and a rectangular cavity, and the incoming air enters the middle rectangular cavity through the intake pipe, and then is freely discharged through the exhaust pipe. The diameter of the circular pipe is 150 mm, and the thickness L of the rectangular cavity is 25.4 mm. The schematic diagram of the rectangular cavity pipeline model experimental device and the location of the sound pressure measurement points are shown in Figure 10. The geometric dimensions of the rectangular cavity are shown in Table 1.

4.2. Calculation Parameter Settings

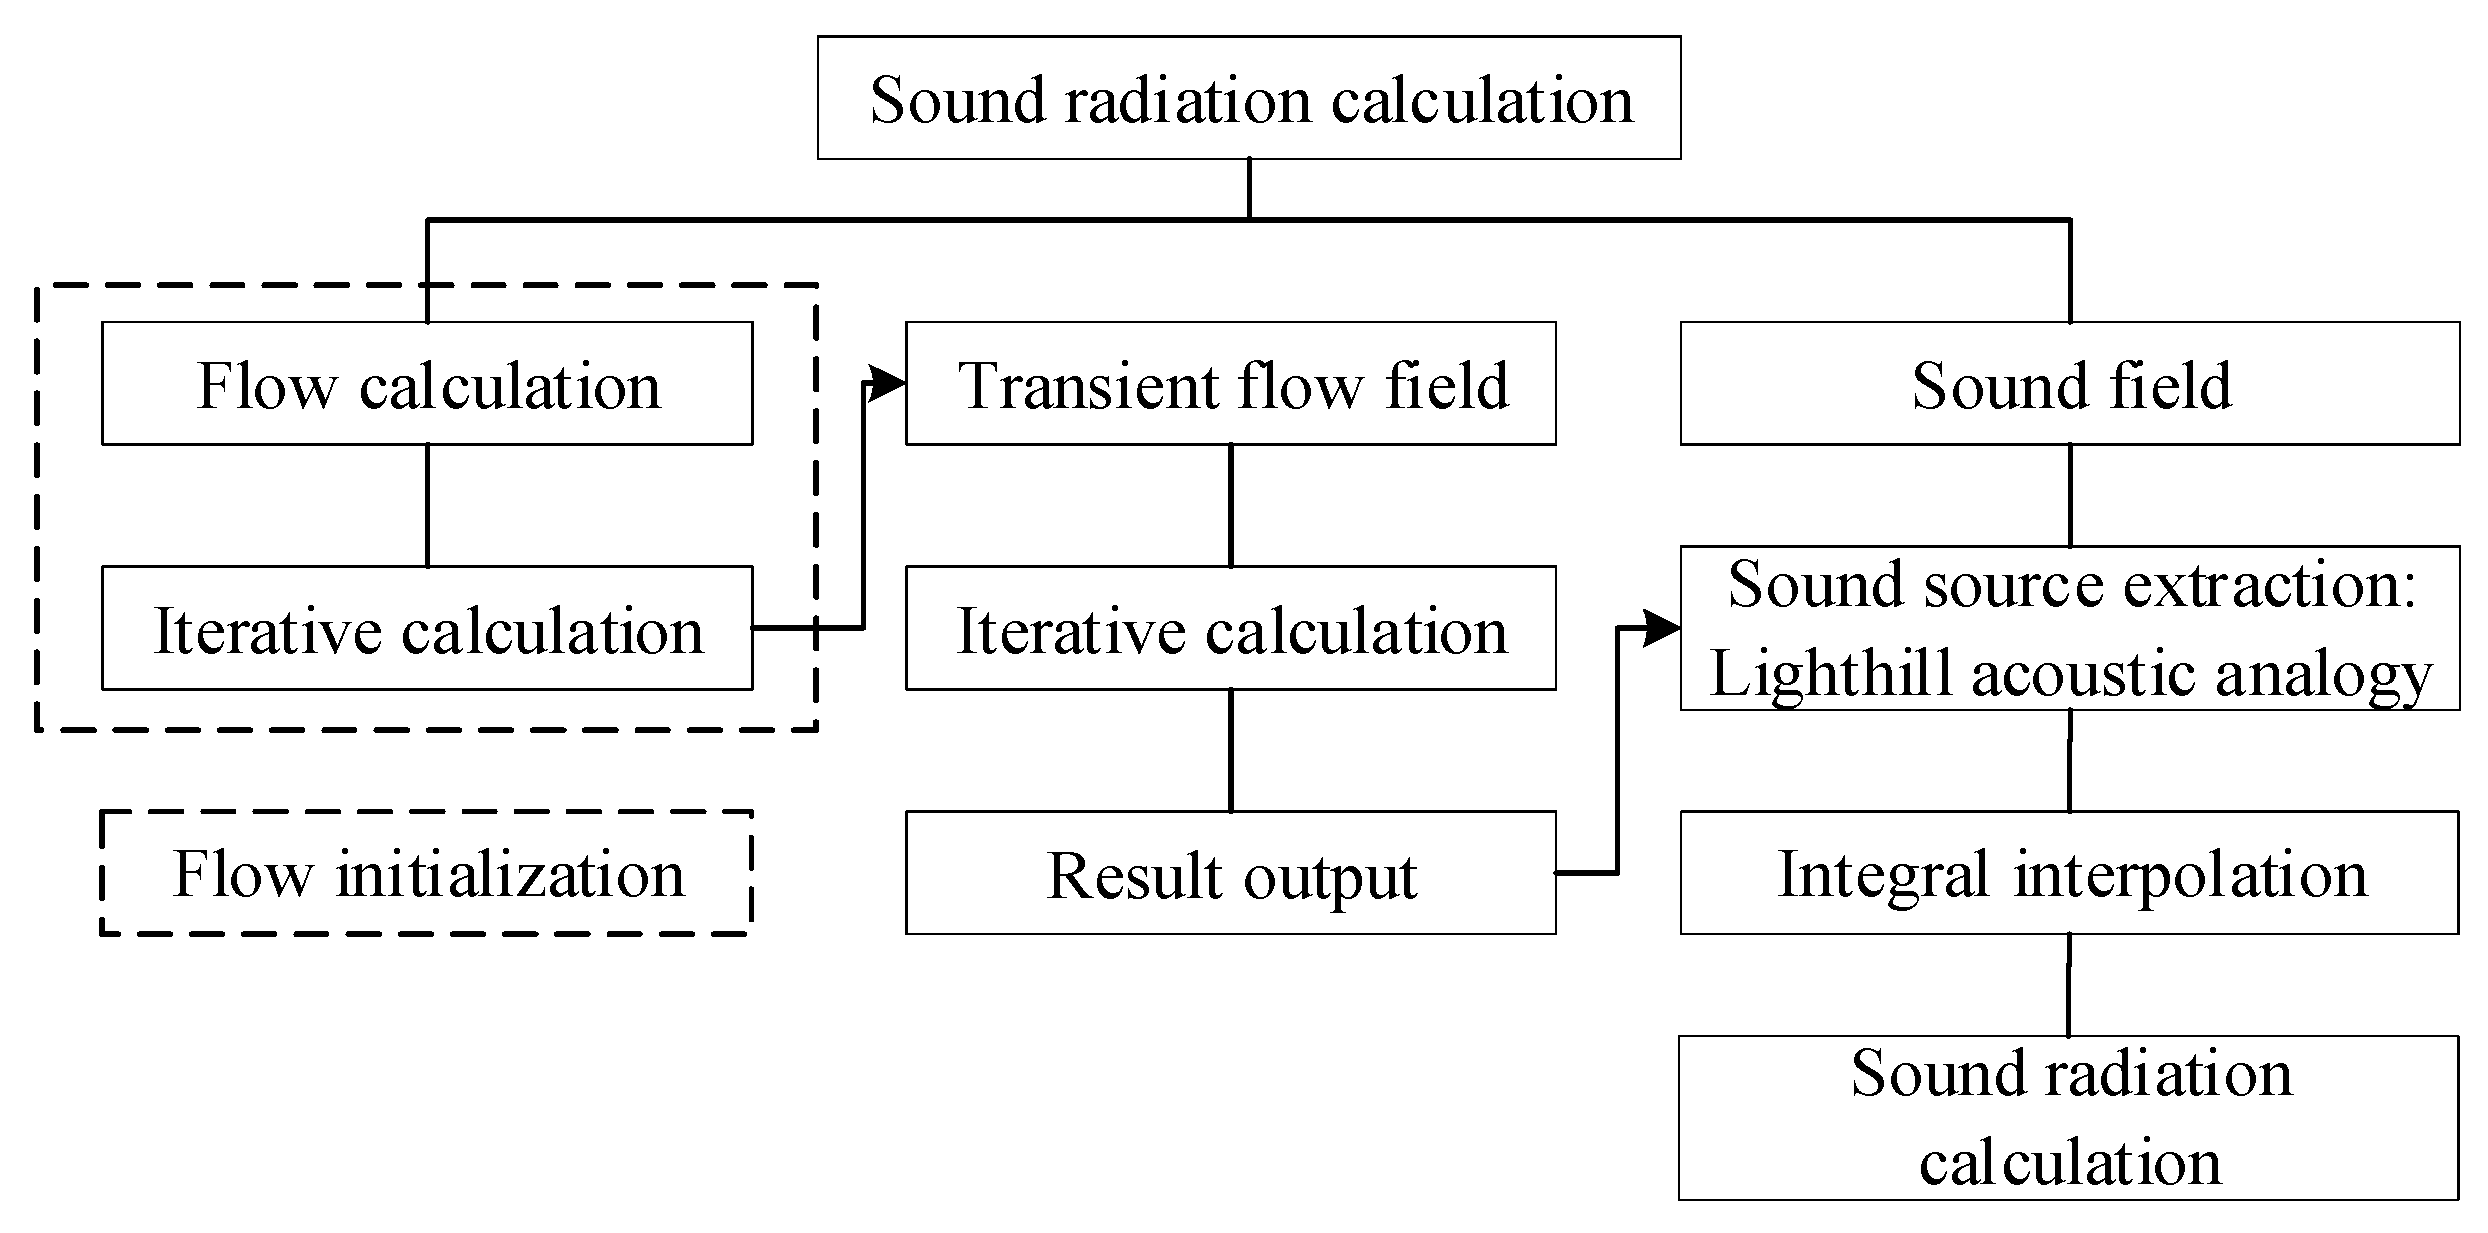
In the calculation process of flow-induced sound in the rectangular cavity pipeline, the characteristics of the unsteady flow field are first calculated and analyzed in the present investigation, and then the sound source information is derived using the acoustic analogy method. The results, including acoustic modal frequency and distribution characteristics, are obtained. Firstly, the steady flow field calculation is carried out, and then the results of it are taken for the initialization of the transient flow. The RNG k ε turbulence model is used for the steady flow and a standard wall is selected to process the flow near the wall. Transient flow uses the LES turbulence model. There are two steps of correction in the process of applying the Pressure-Implicit with Splitting of Operators (PISO) algorithm to solve the pressure equation. Firstly, the first velocity correction value is obtained by solving the momentum equation on the premise of a given assumed pressure field. Then, the continuous equation is solved to derive the pressure correction value which is used to correct the pressure equation. Secondly, the momentum equation is solved again with the corrected pressure equation to obtain the second velocity correction value. Consequently, the iterative equation satisfies both mass conservation and the implicit momentum conservation equation. The iterative calculation does not stop until the velocity field satisfies the continuity equation. The amount of computation of each iteration increases due to the repeated solving of the momentum equation. The PISO algorithm shows obvious advantages in dealing with unsteady flow problems or high-distortion flow field grid problems due to its effective and efficient convergence. Therefore, in the calculation of the flow field characteristics of the rectangular cavity pipeline, the Semi-Implicit-Method for Pressure Linked Equations Consistent (SIMPLEC) algorithm is used for the steady flow field calculation, the second-order upwind style is used for field variable interpolation, the Green–Gauss node-based calculation method is used for the gradient calculation, and the second-order interpolation method is used for surface pressure calculation. The PISO algorithm is taken for transient flow field calculations, the second-order upwind style is taken for field variable interpolation, the gradient and surface pressure calculations are also the same as the steady state calculations, and the transient equations are second-order implicit. The initialization of the flow field is realized with 200 iterations in the steady state calculation process. In the transient calculation, the transient calculation time step is set to 0.000167 s to capture the sound source information for 0–3000 Hz. The number of calculation time steps is set to 600 steps, and the iteration number of each time step is set to 20 steps. Total number of time steps is 600, with 20 iterations over one time step.
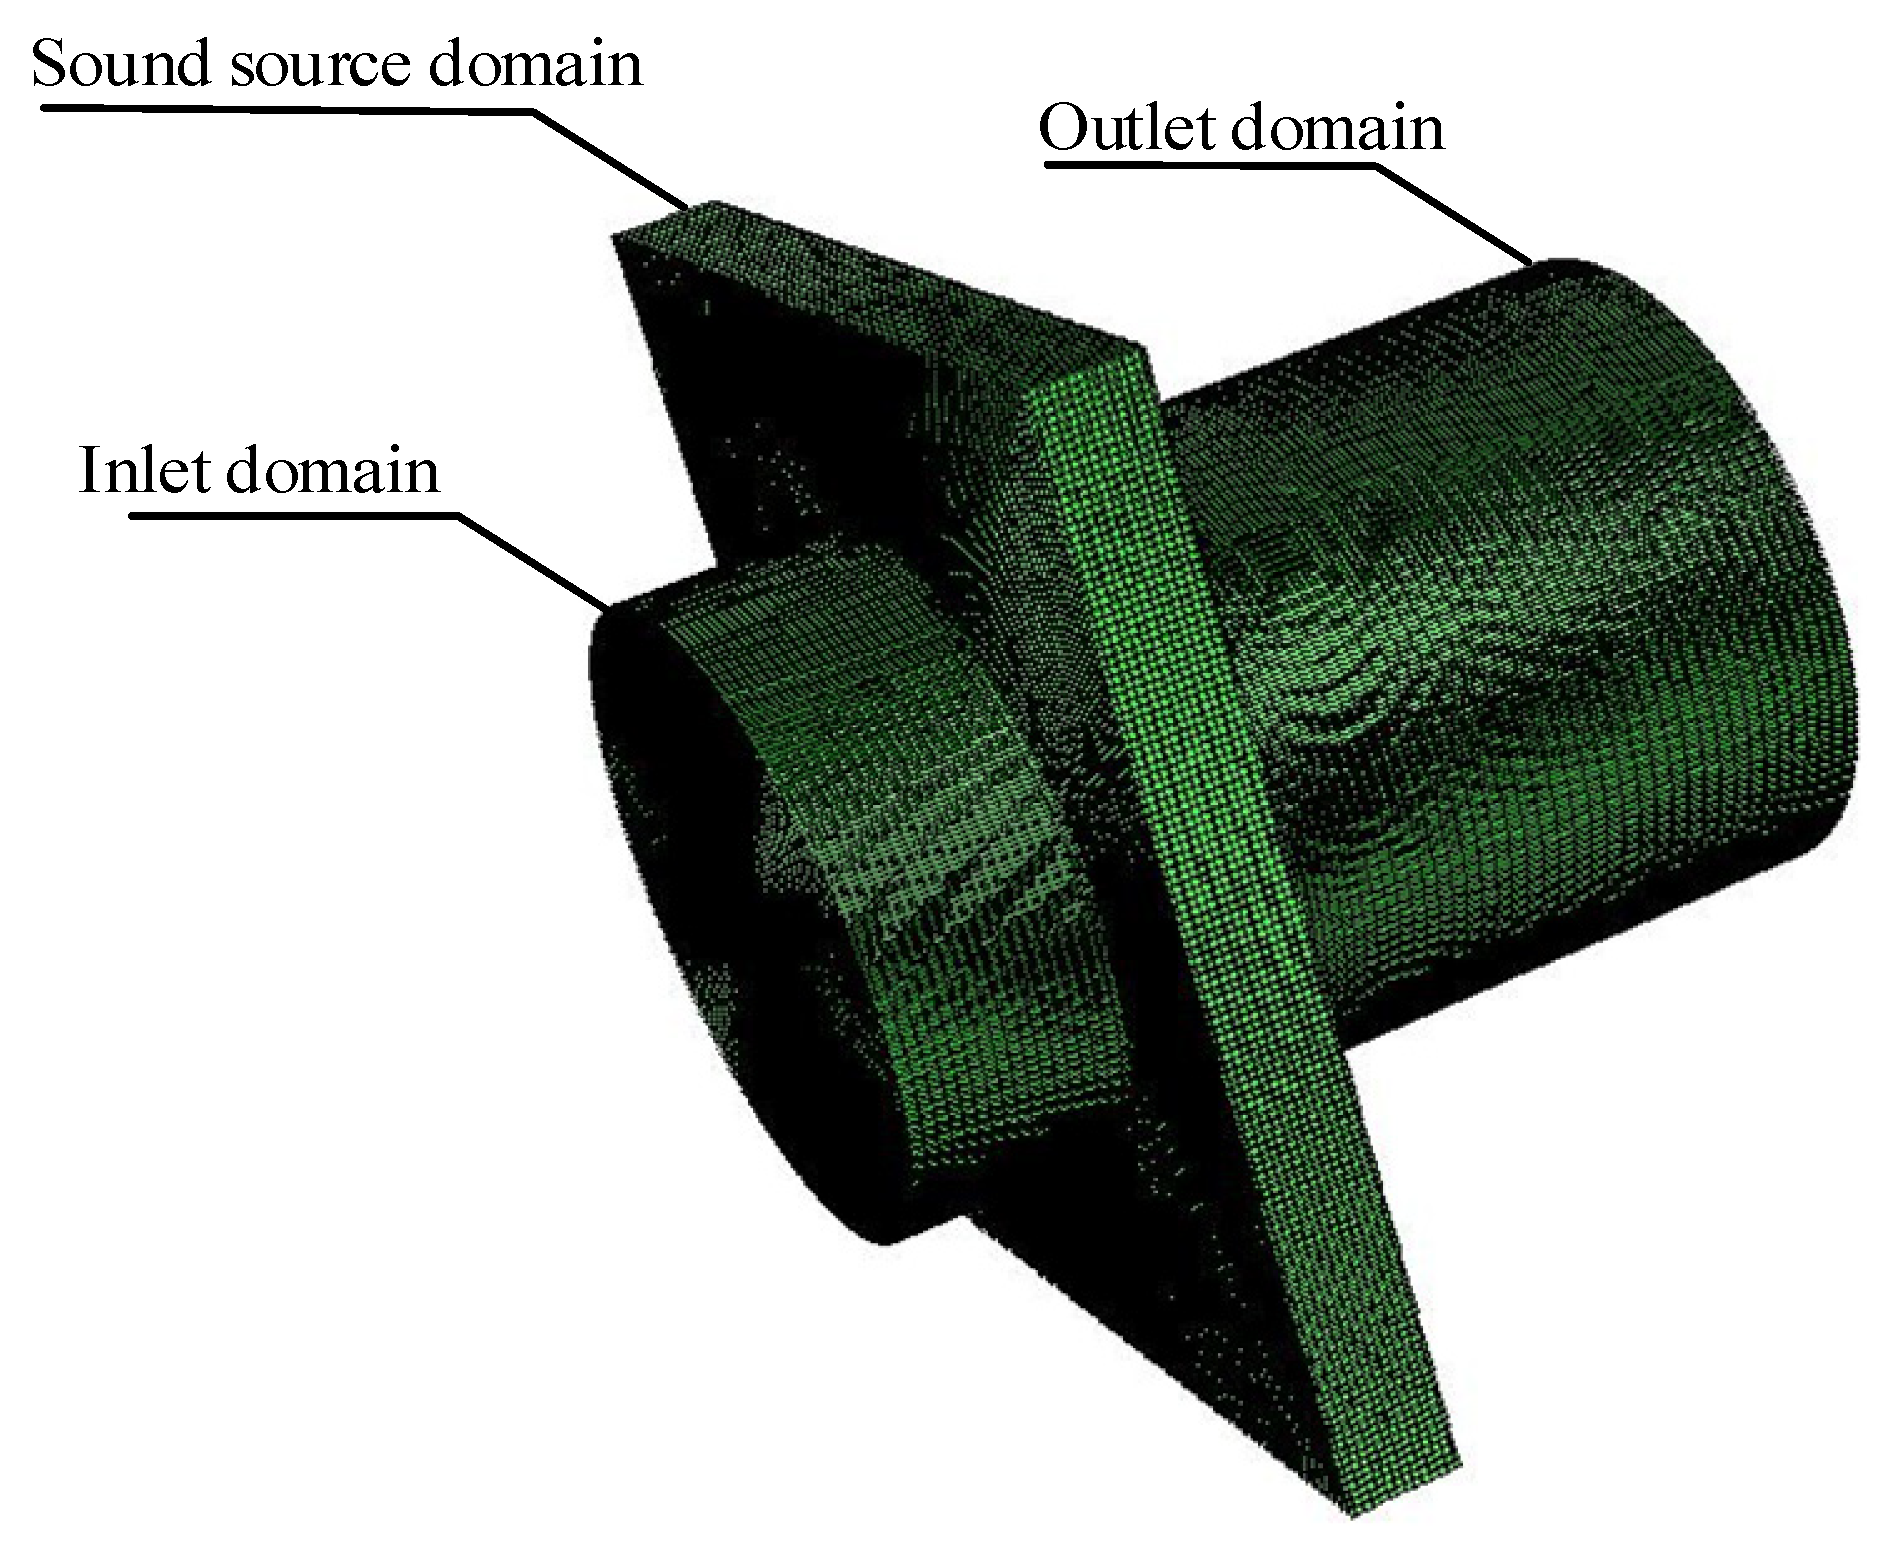
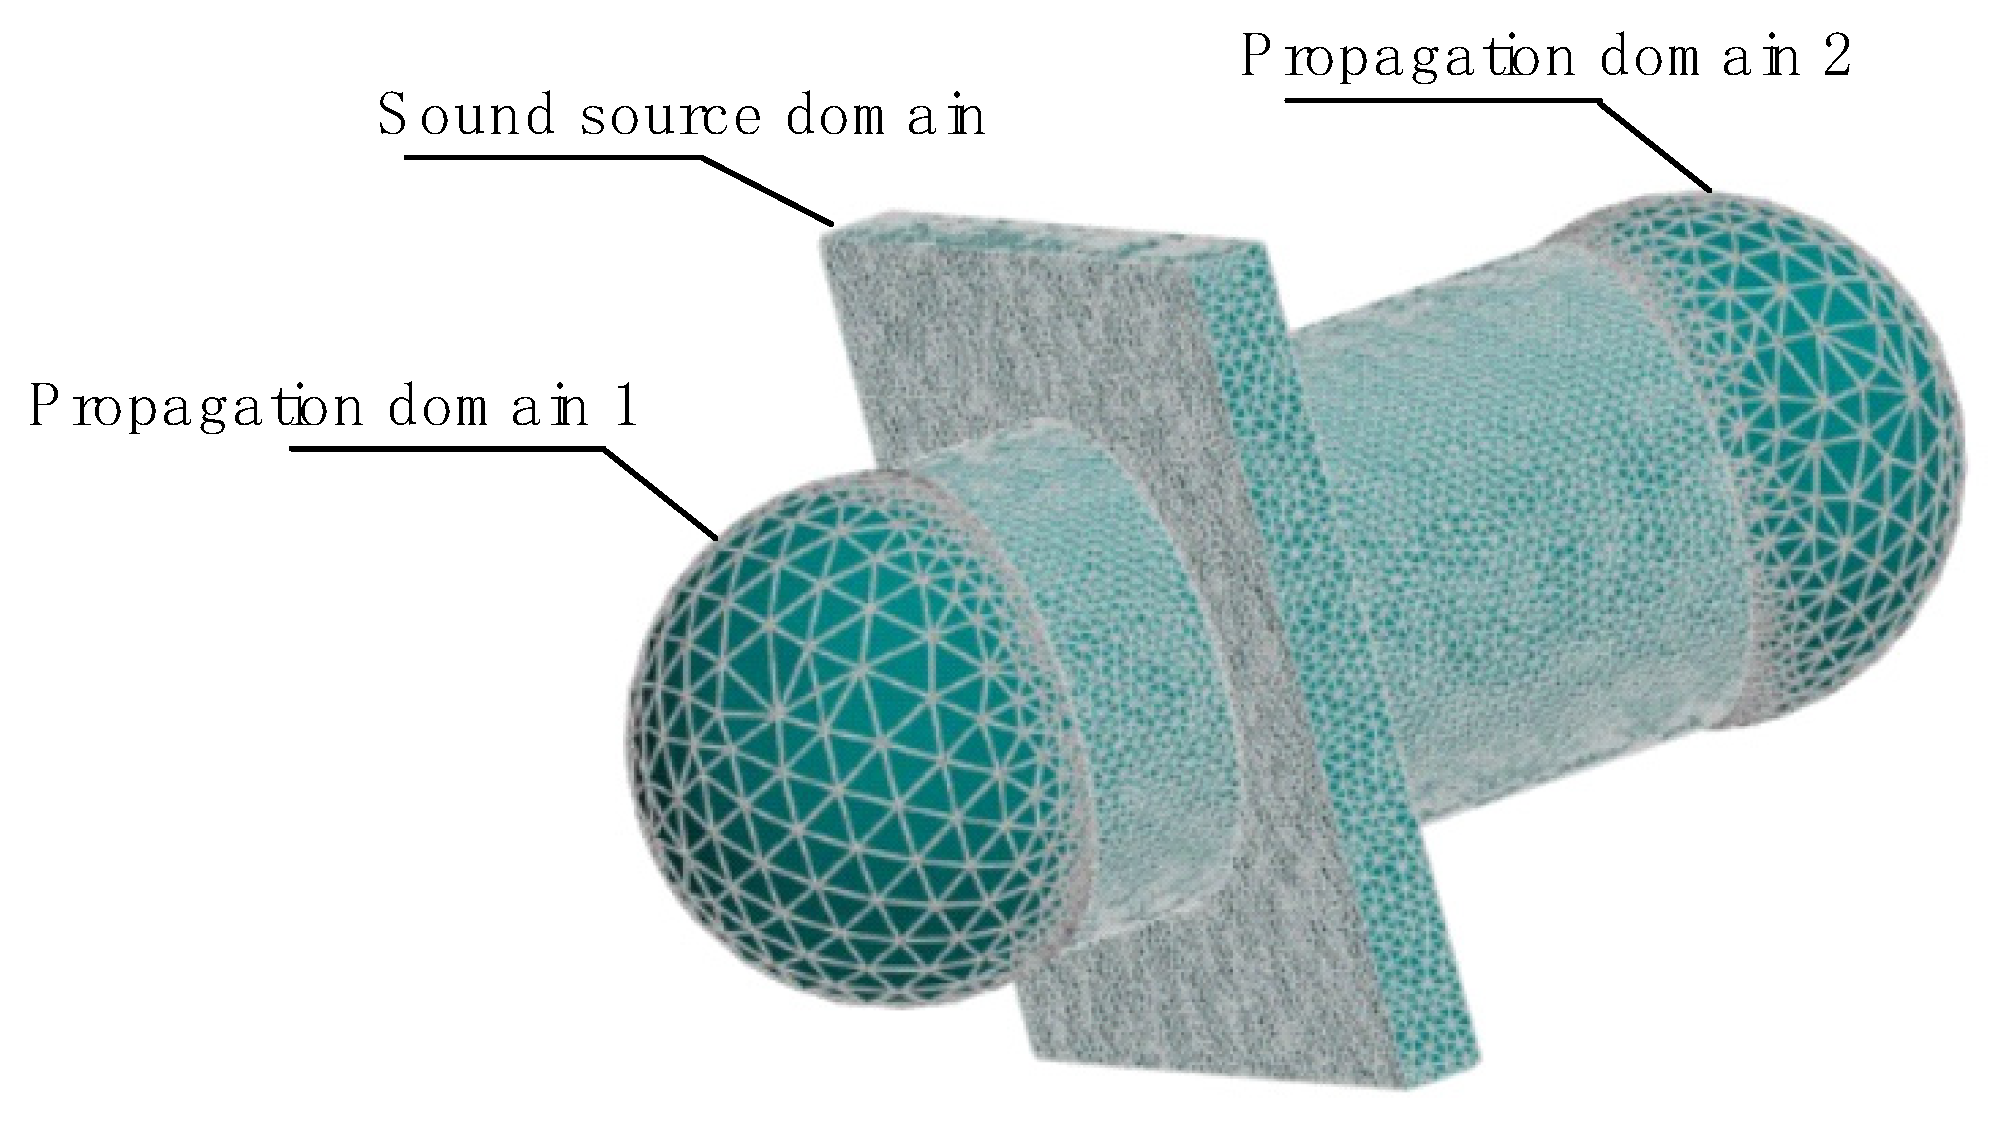
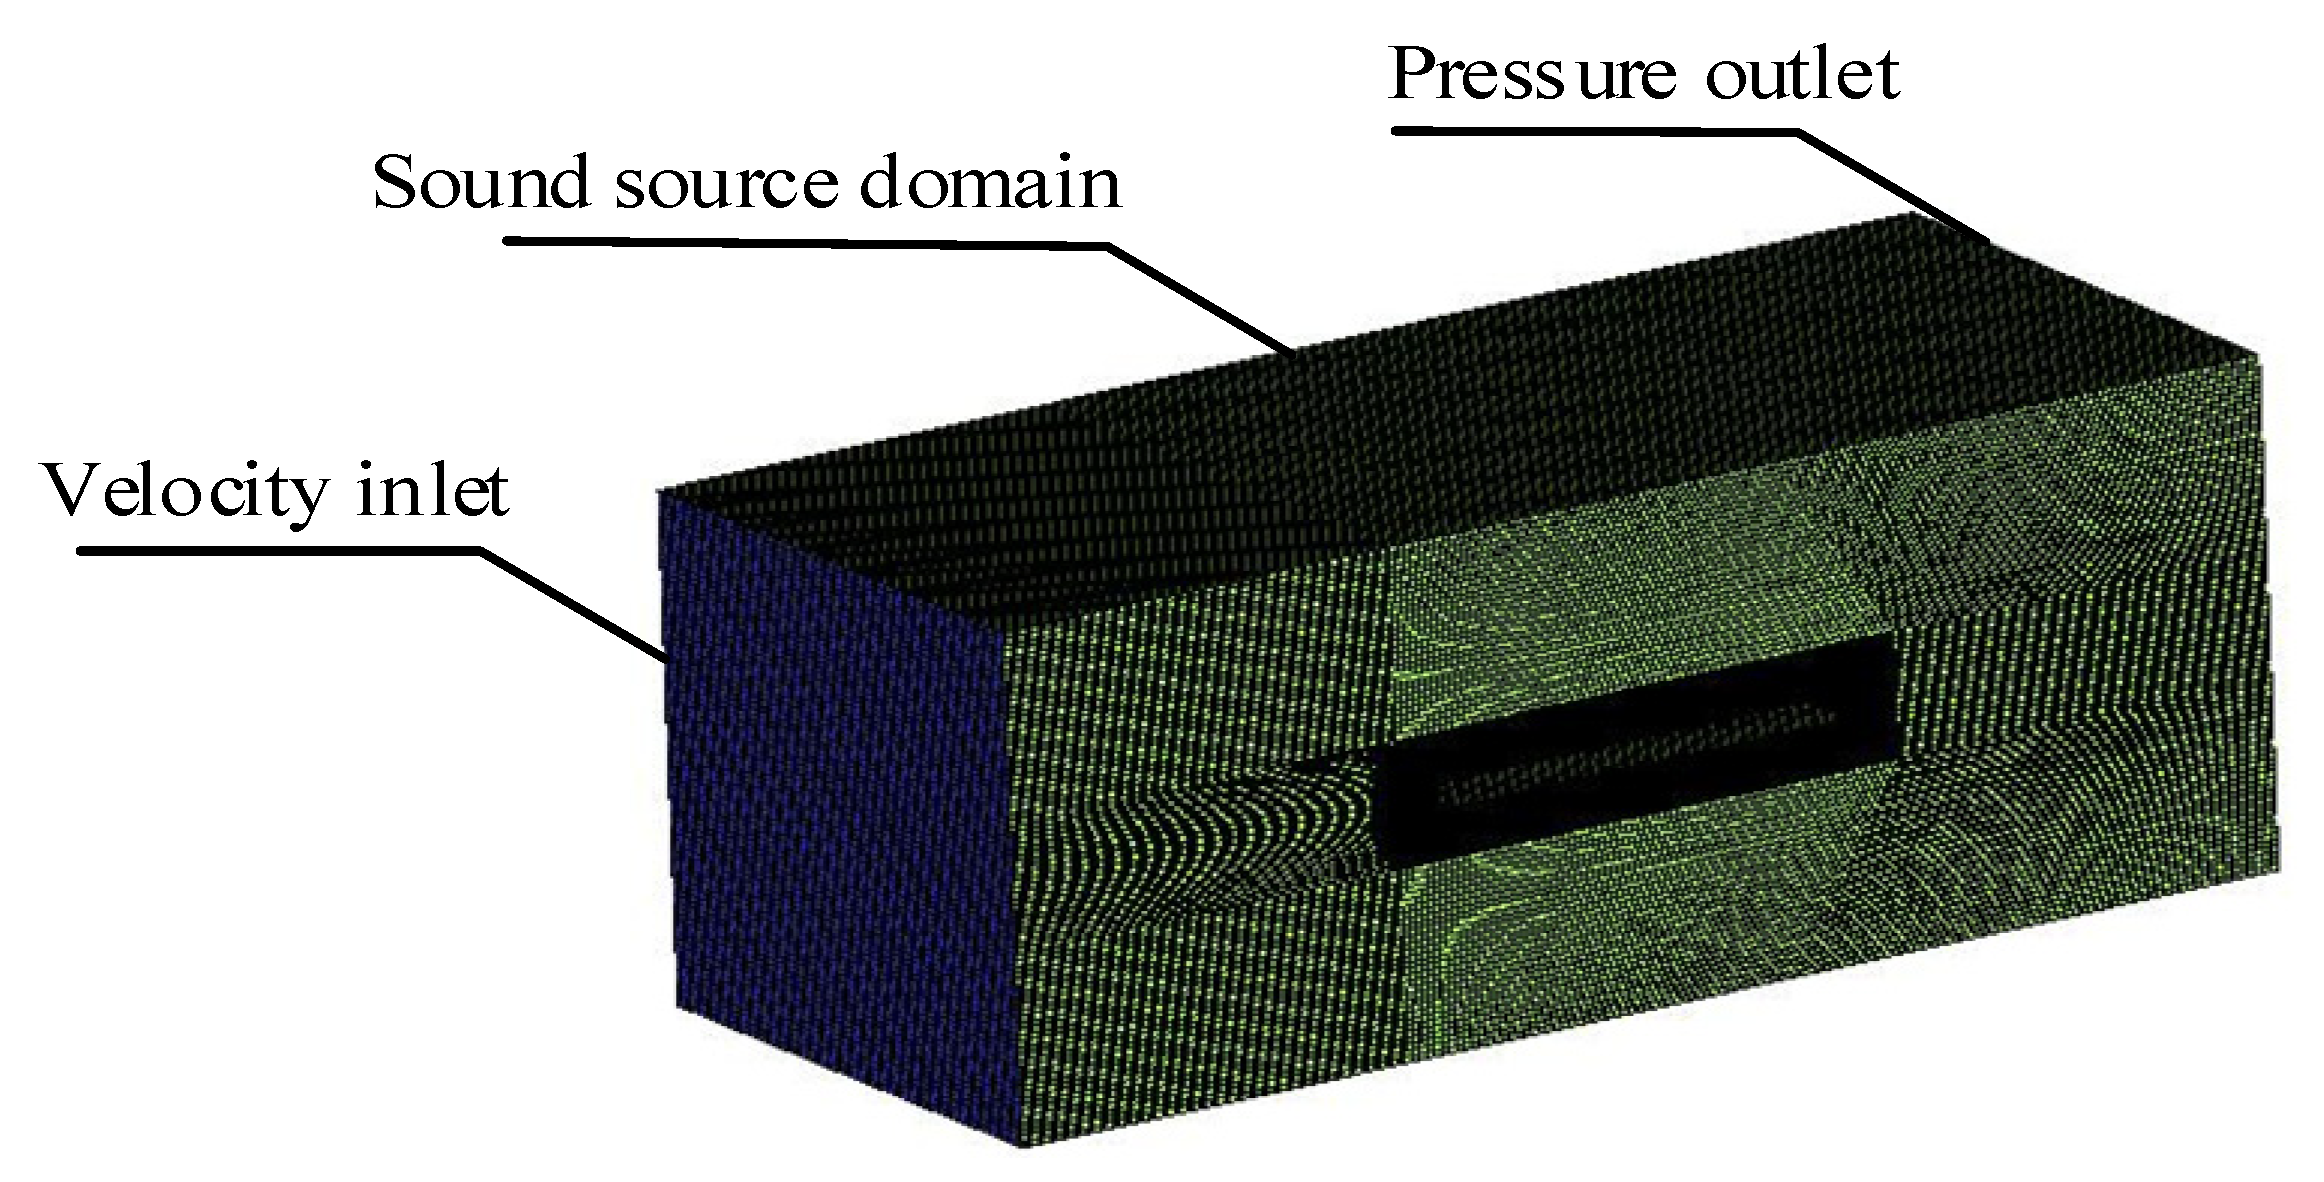
The computational model is constructed according to the geometry of rectangular cavity 2 in Table 1. The middle rectangular cavity part of the model is the sound source extraction region, and the two ends are the inlet and outlet flow development sections of the cavity flow field, respectively. The length of the outlet domain is 1.5 times longer than the inlet domain, which ensures that the inlet flow of the rectangular cavity is fully developed and the outlet boundary conditions do not disturb the flow in the cavity. A structured grid is selected as the flow field calculation grid with a maximum grid size of 2 mm and a grid height of 1 mm. The wall of the rectangular pipeline is the no-slip boundary condition, and the inlet and outlet boundary conditions are set to the velocity inlet and the pressure outlet, respectively. The flow field calculation model is shown in Figure 11. During the calculation of the sound field, the inlet and outlet domains are added to the sound field calculation model. An unstructured grid is selected as the acoustic field calculation grid with a maximum grid size of 3 mm and a grid height of 2 mm. Acoustic non-reflection regions are added to the inlet and outlet domains, i.e., free propagation domain 1 and free propagation domain 2, to simulate the free propagation of sound waves in the pipeline. All other walls of the model are hard walls. Two hemispherical regions are added to the inlet and outlet of the sound field calculation model to simulate reality in the actual process of sound wave propagation. The surfaces of hemispherical regions are set to the boundary of the infinite element, and the sound pressure of the sound field outside the infinite element region is calculated by interpolation. The interpolation order can be set lower as the infinite element boundary is far from the sound source and the finite element mesh number is sufficient. Therefore, the interpolation order is set to 5 in the hemispherical regions, the maximum grid size is set to 20 mm, and the grid height is set to 5 mm. The sound field calculation model is shown in Figure 12. The flow chart of numerical simulation is shown in Figure 13.

4.3. Characteristic Analysis of Eddy Sounds

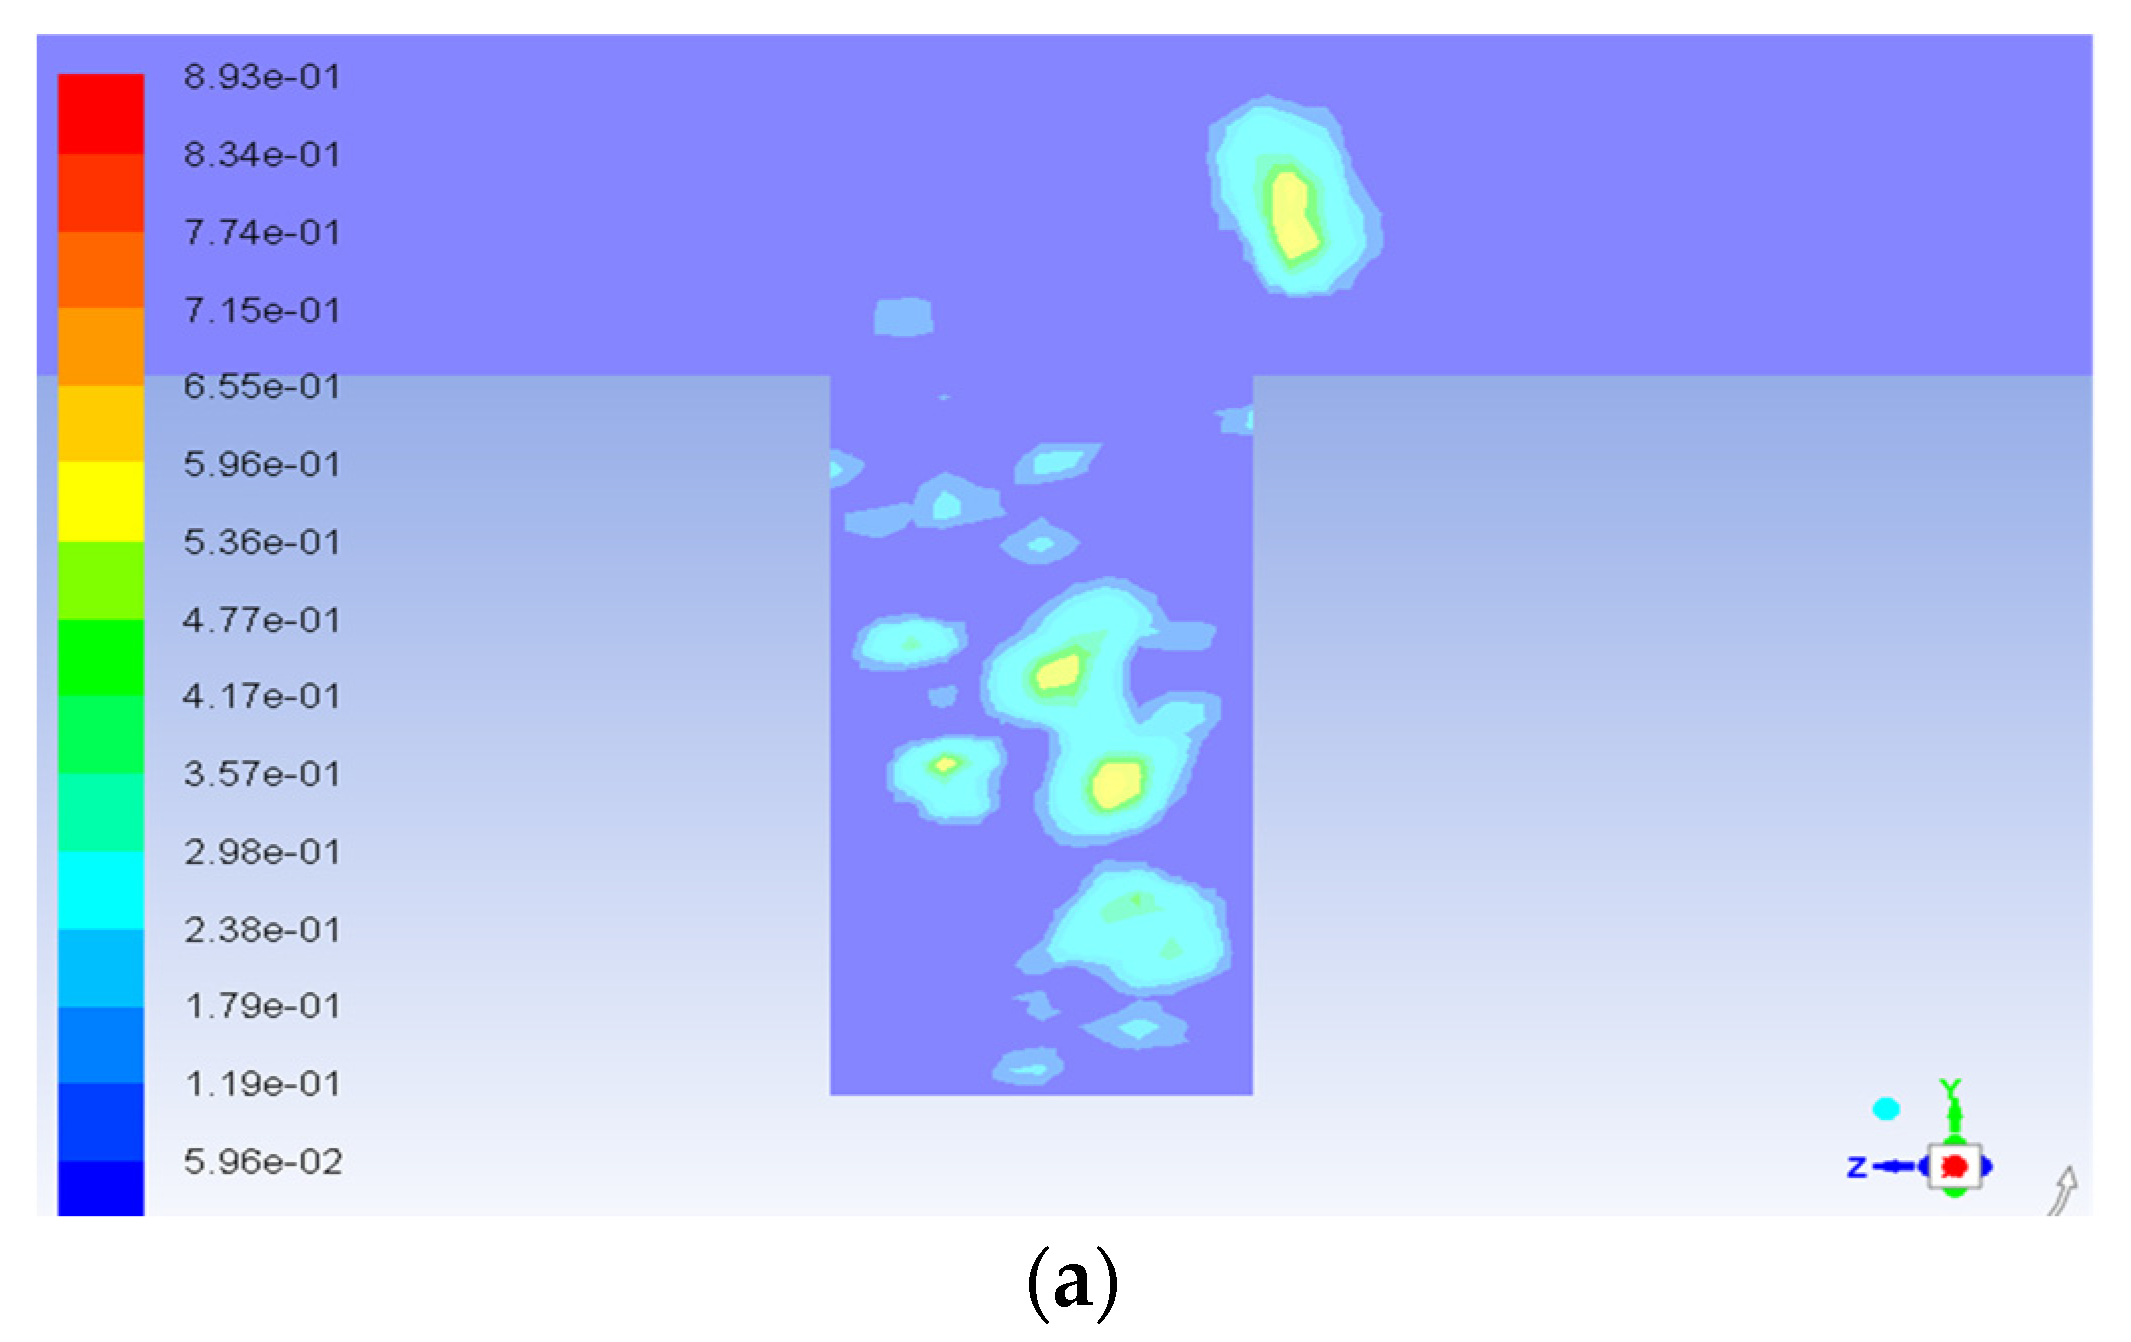
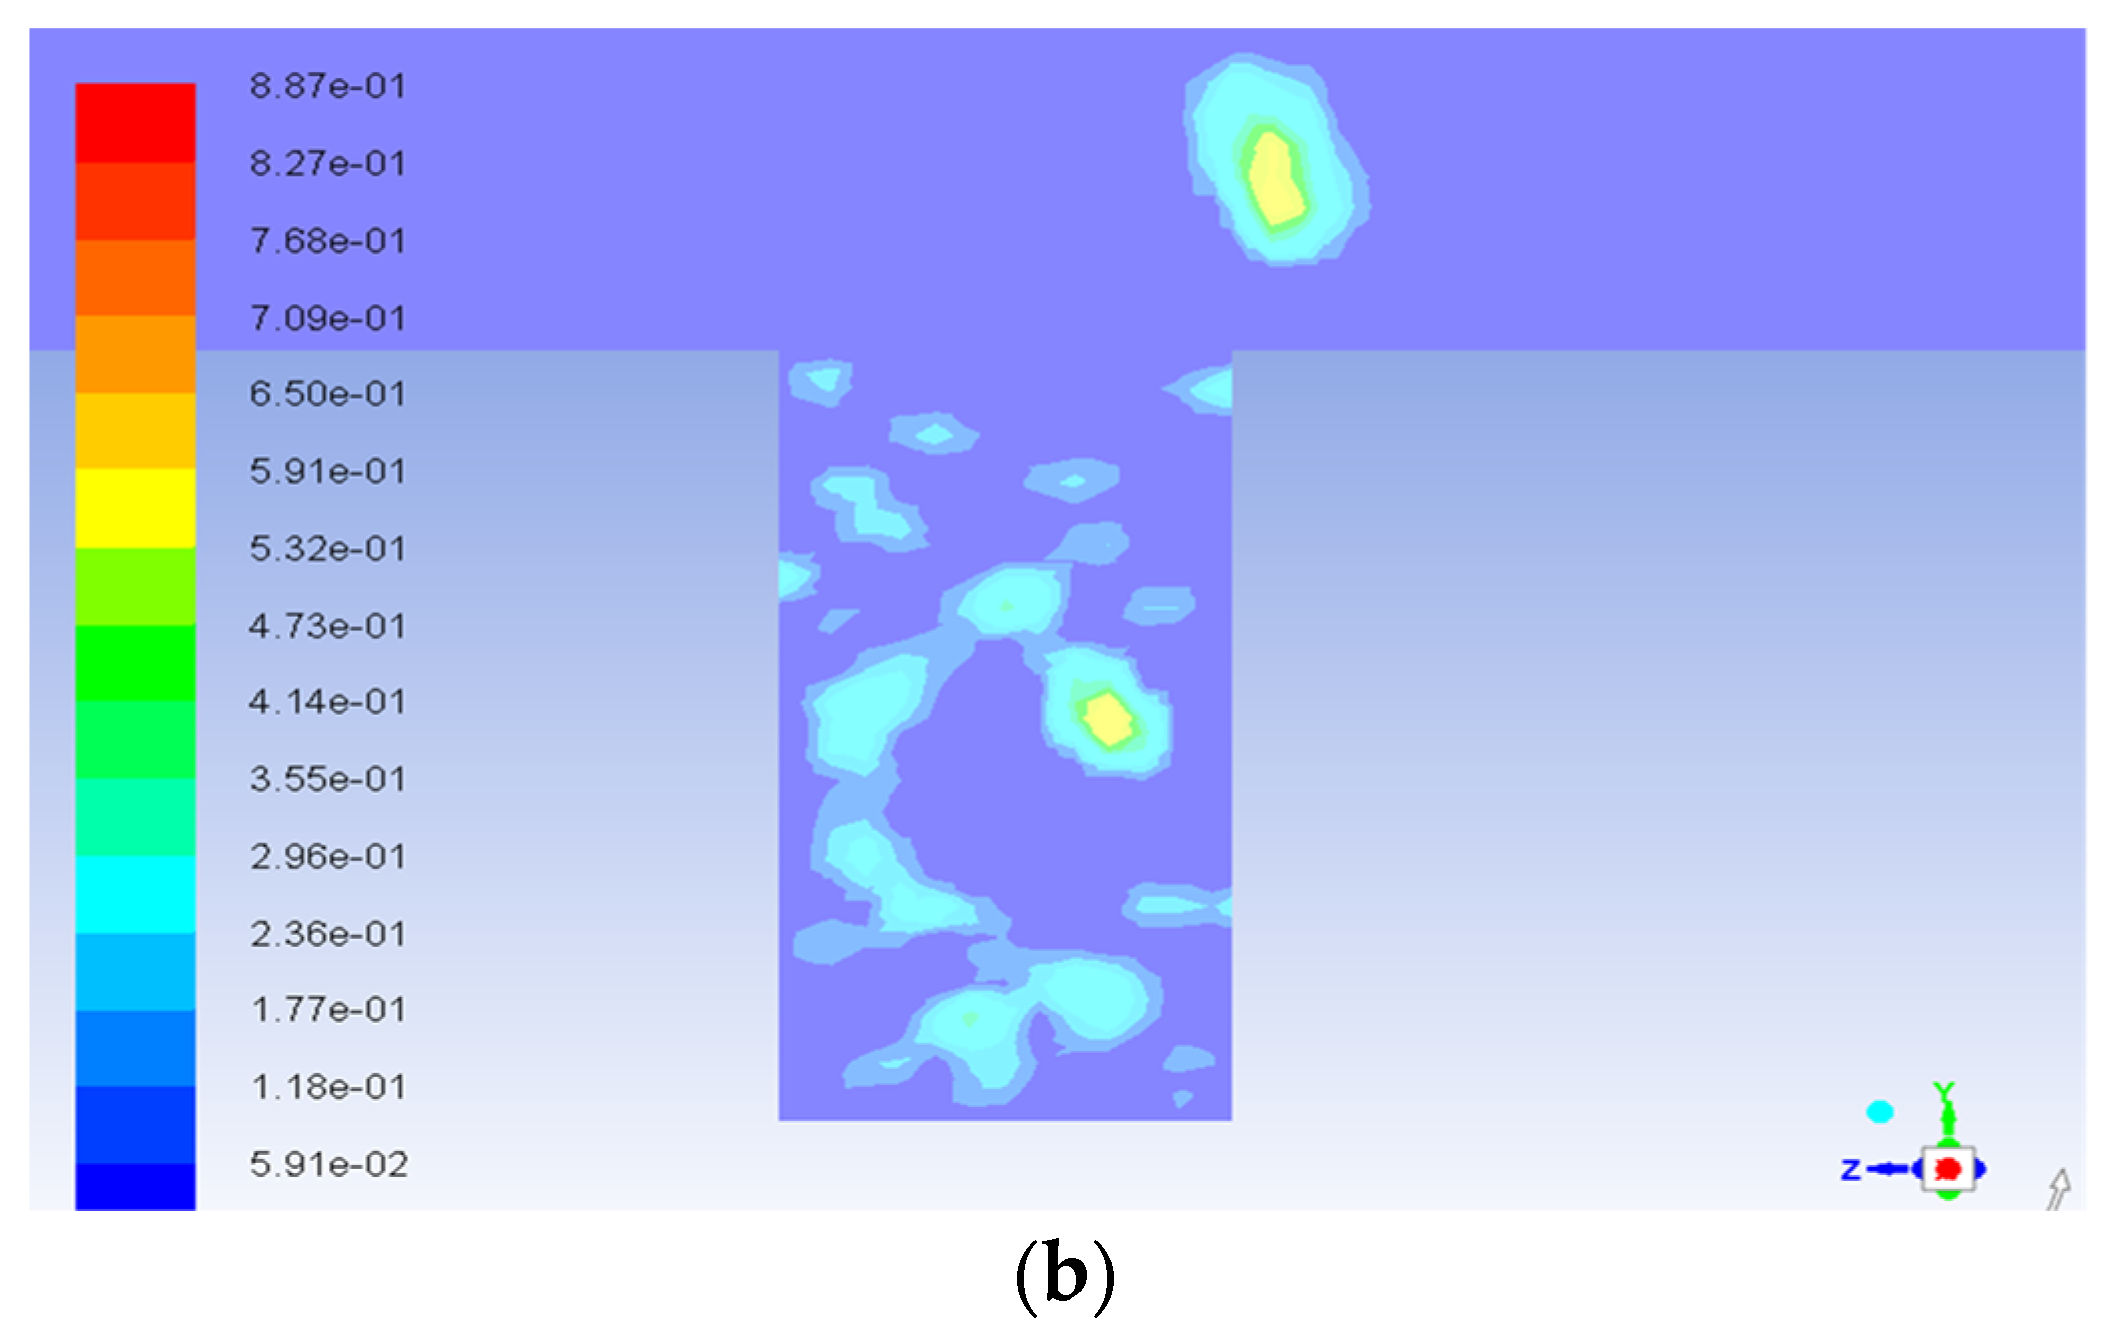
The flow characteristics of the rectangular cavity pipeline under different inlet velocities are calculated and analyzed. The distributions of the flow vortices in the rectangular cavity at the flow velocities of 60 m/s and 83 m/s are shown in Figure 14.
This shows that the intake air flow velocities are 60 m/s and 83 m/s, respectively. The flow is separated at the leading edge of the rectangular cavity (near the wall in the direction of flow), a large scale vortex is generated and developed in the cavity up to the rear edge of the cavity (away from the wall in the direction of flow), and then this flows to the circular pipe. The vortices are mainly concentrated in the rectangular cavity region. The above results are in line with the flow laws of the rectangular cavity in the literature [34,35].
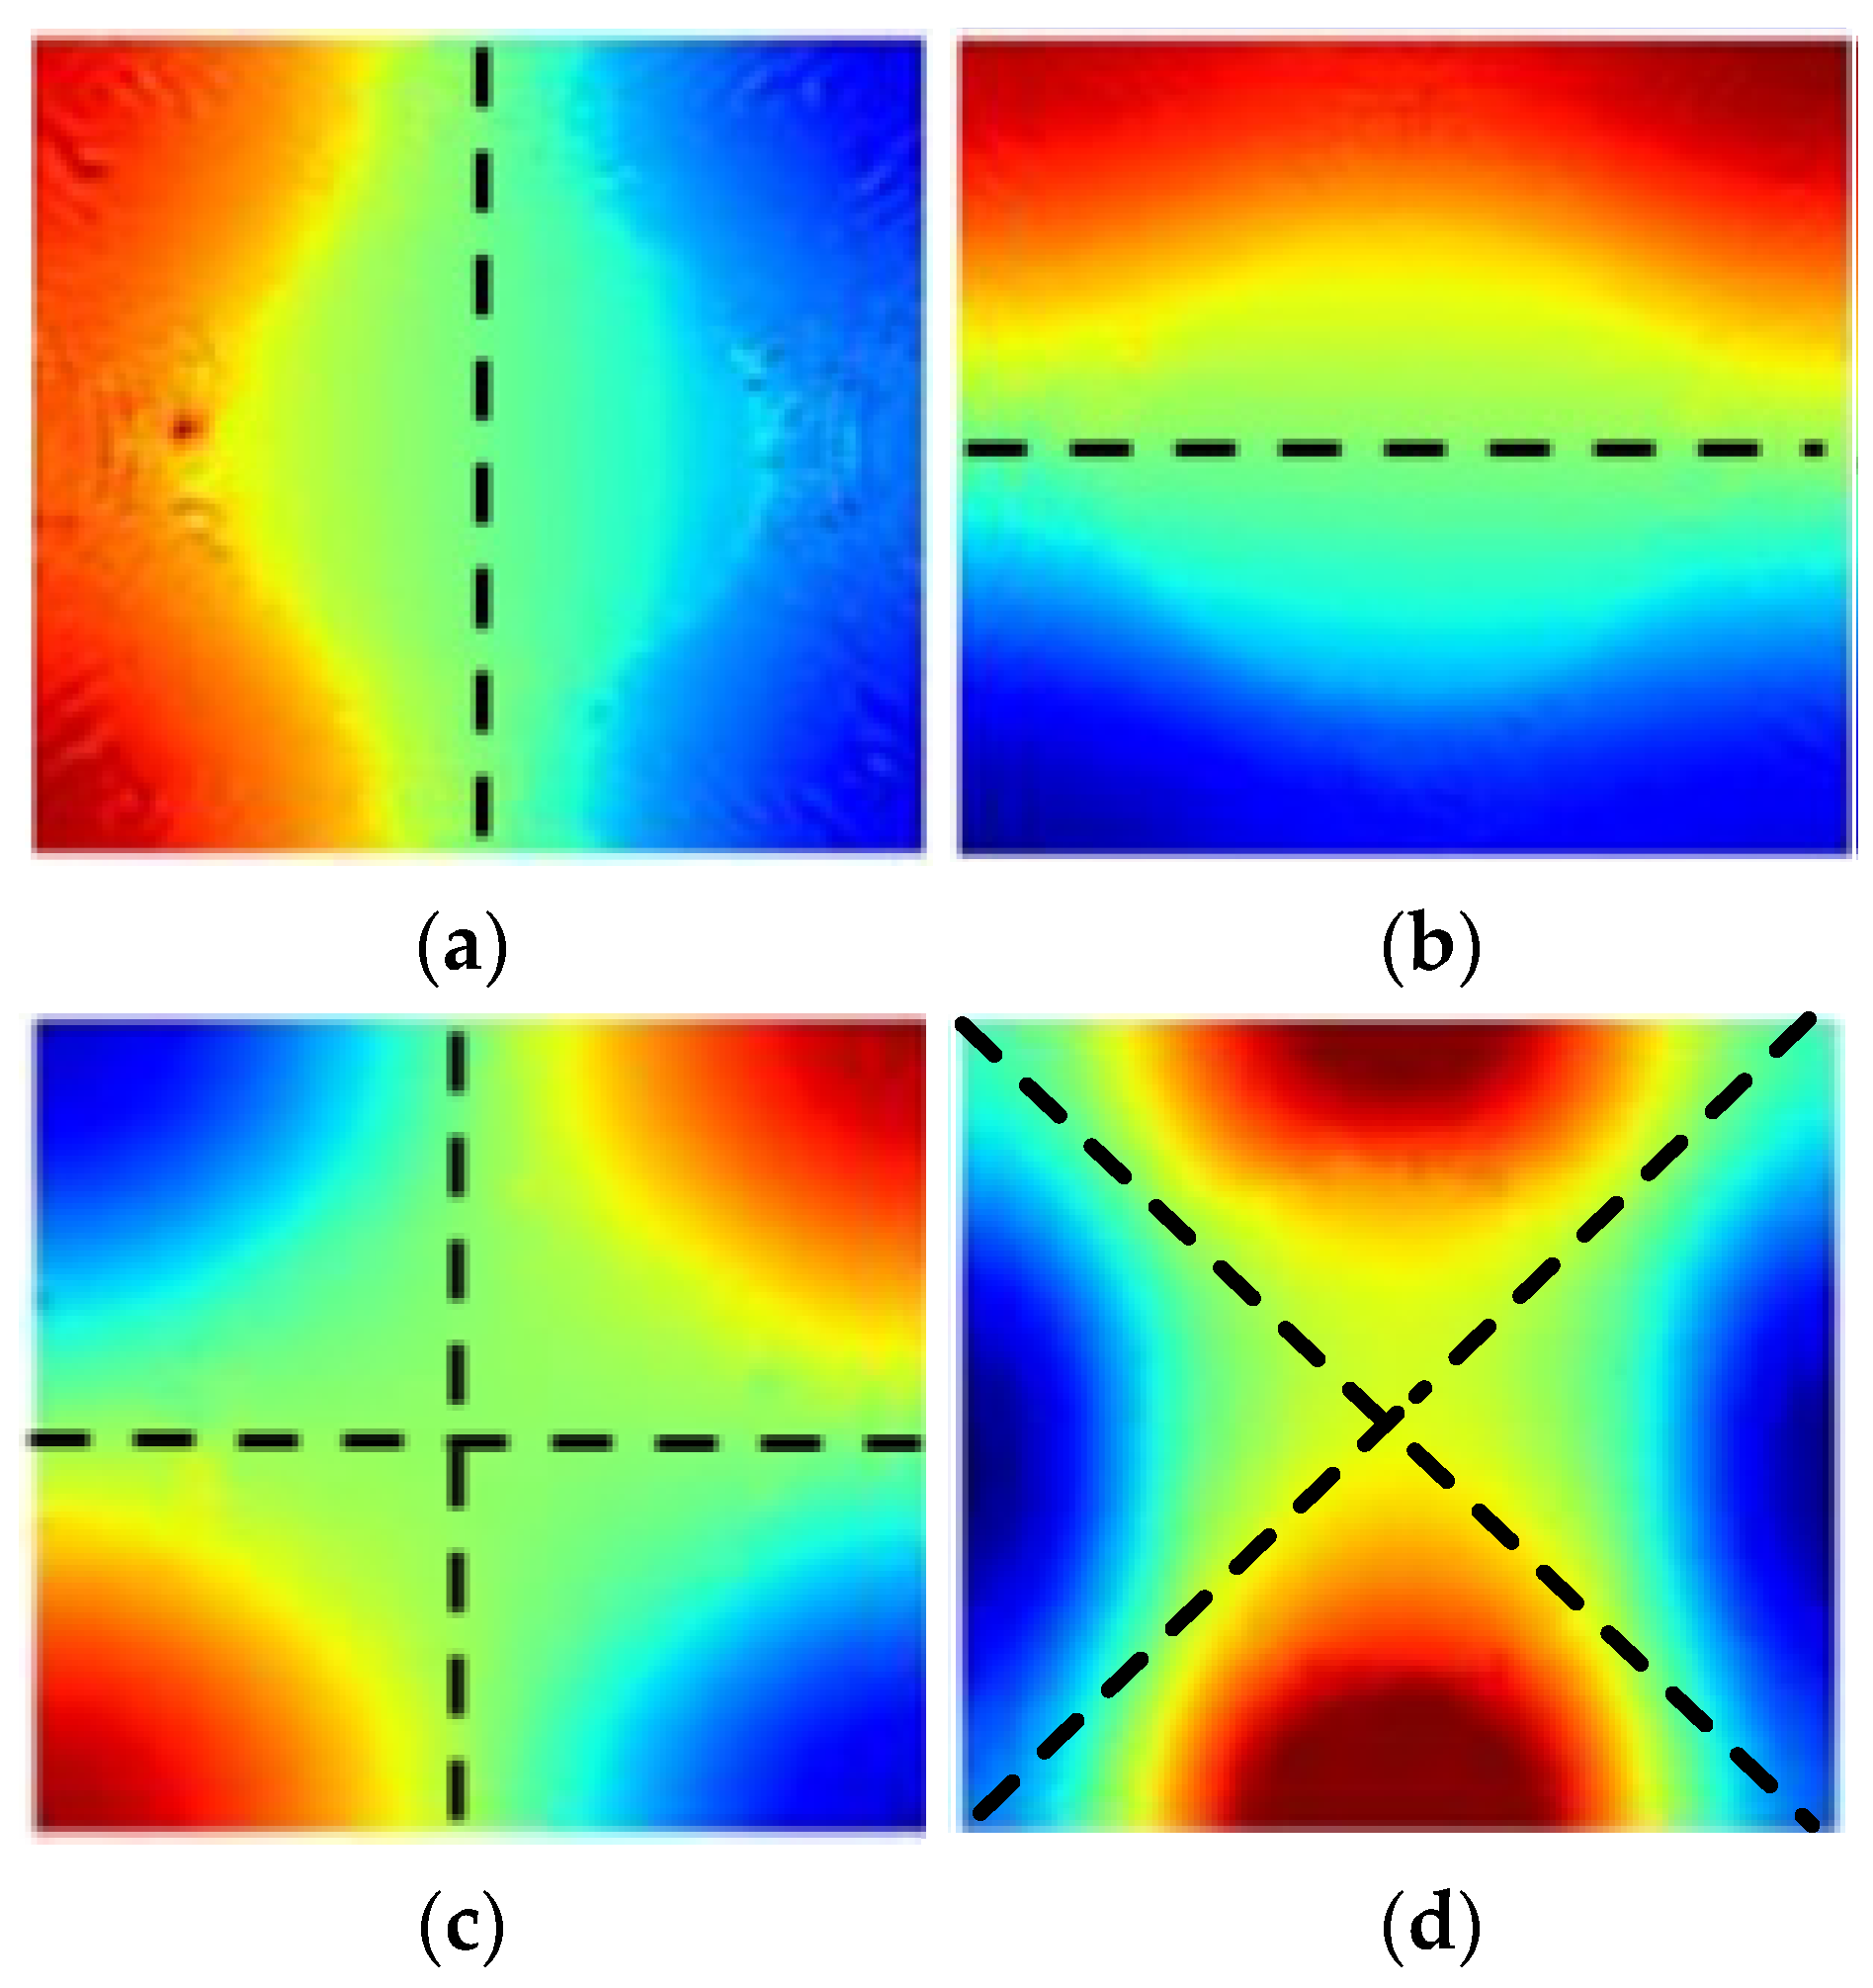
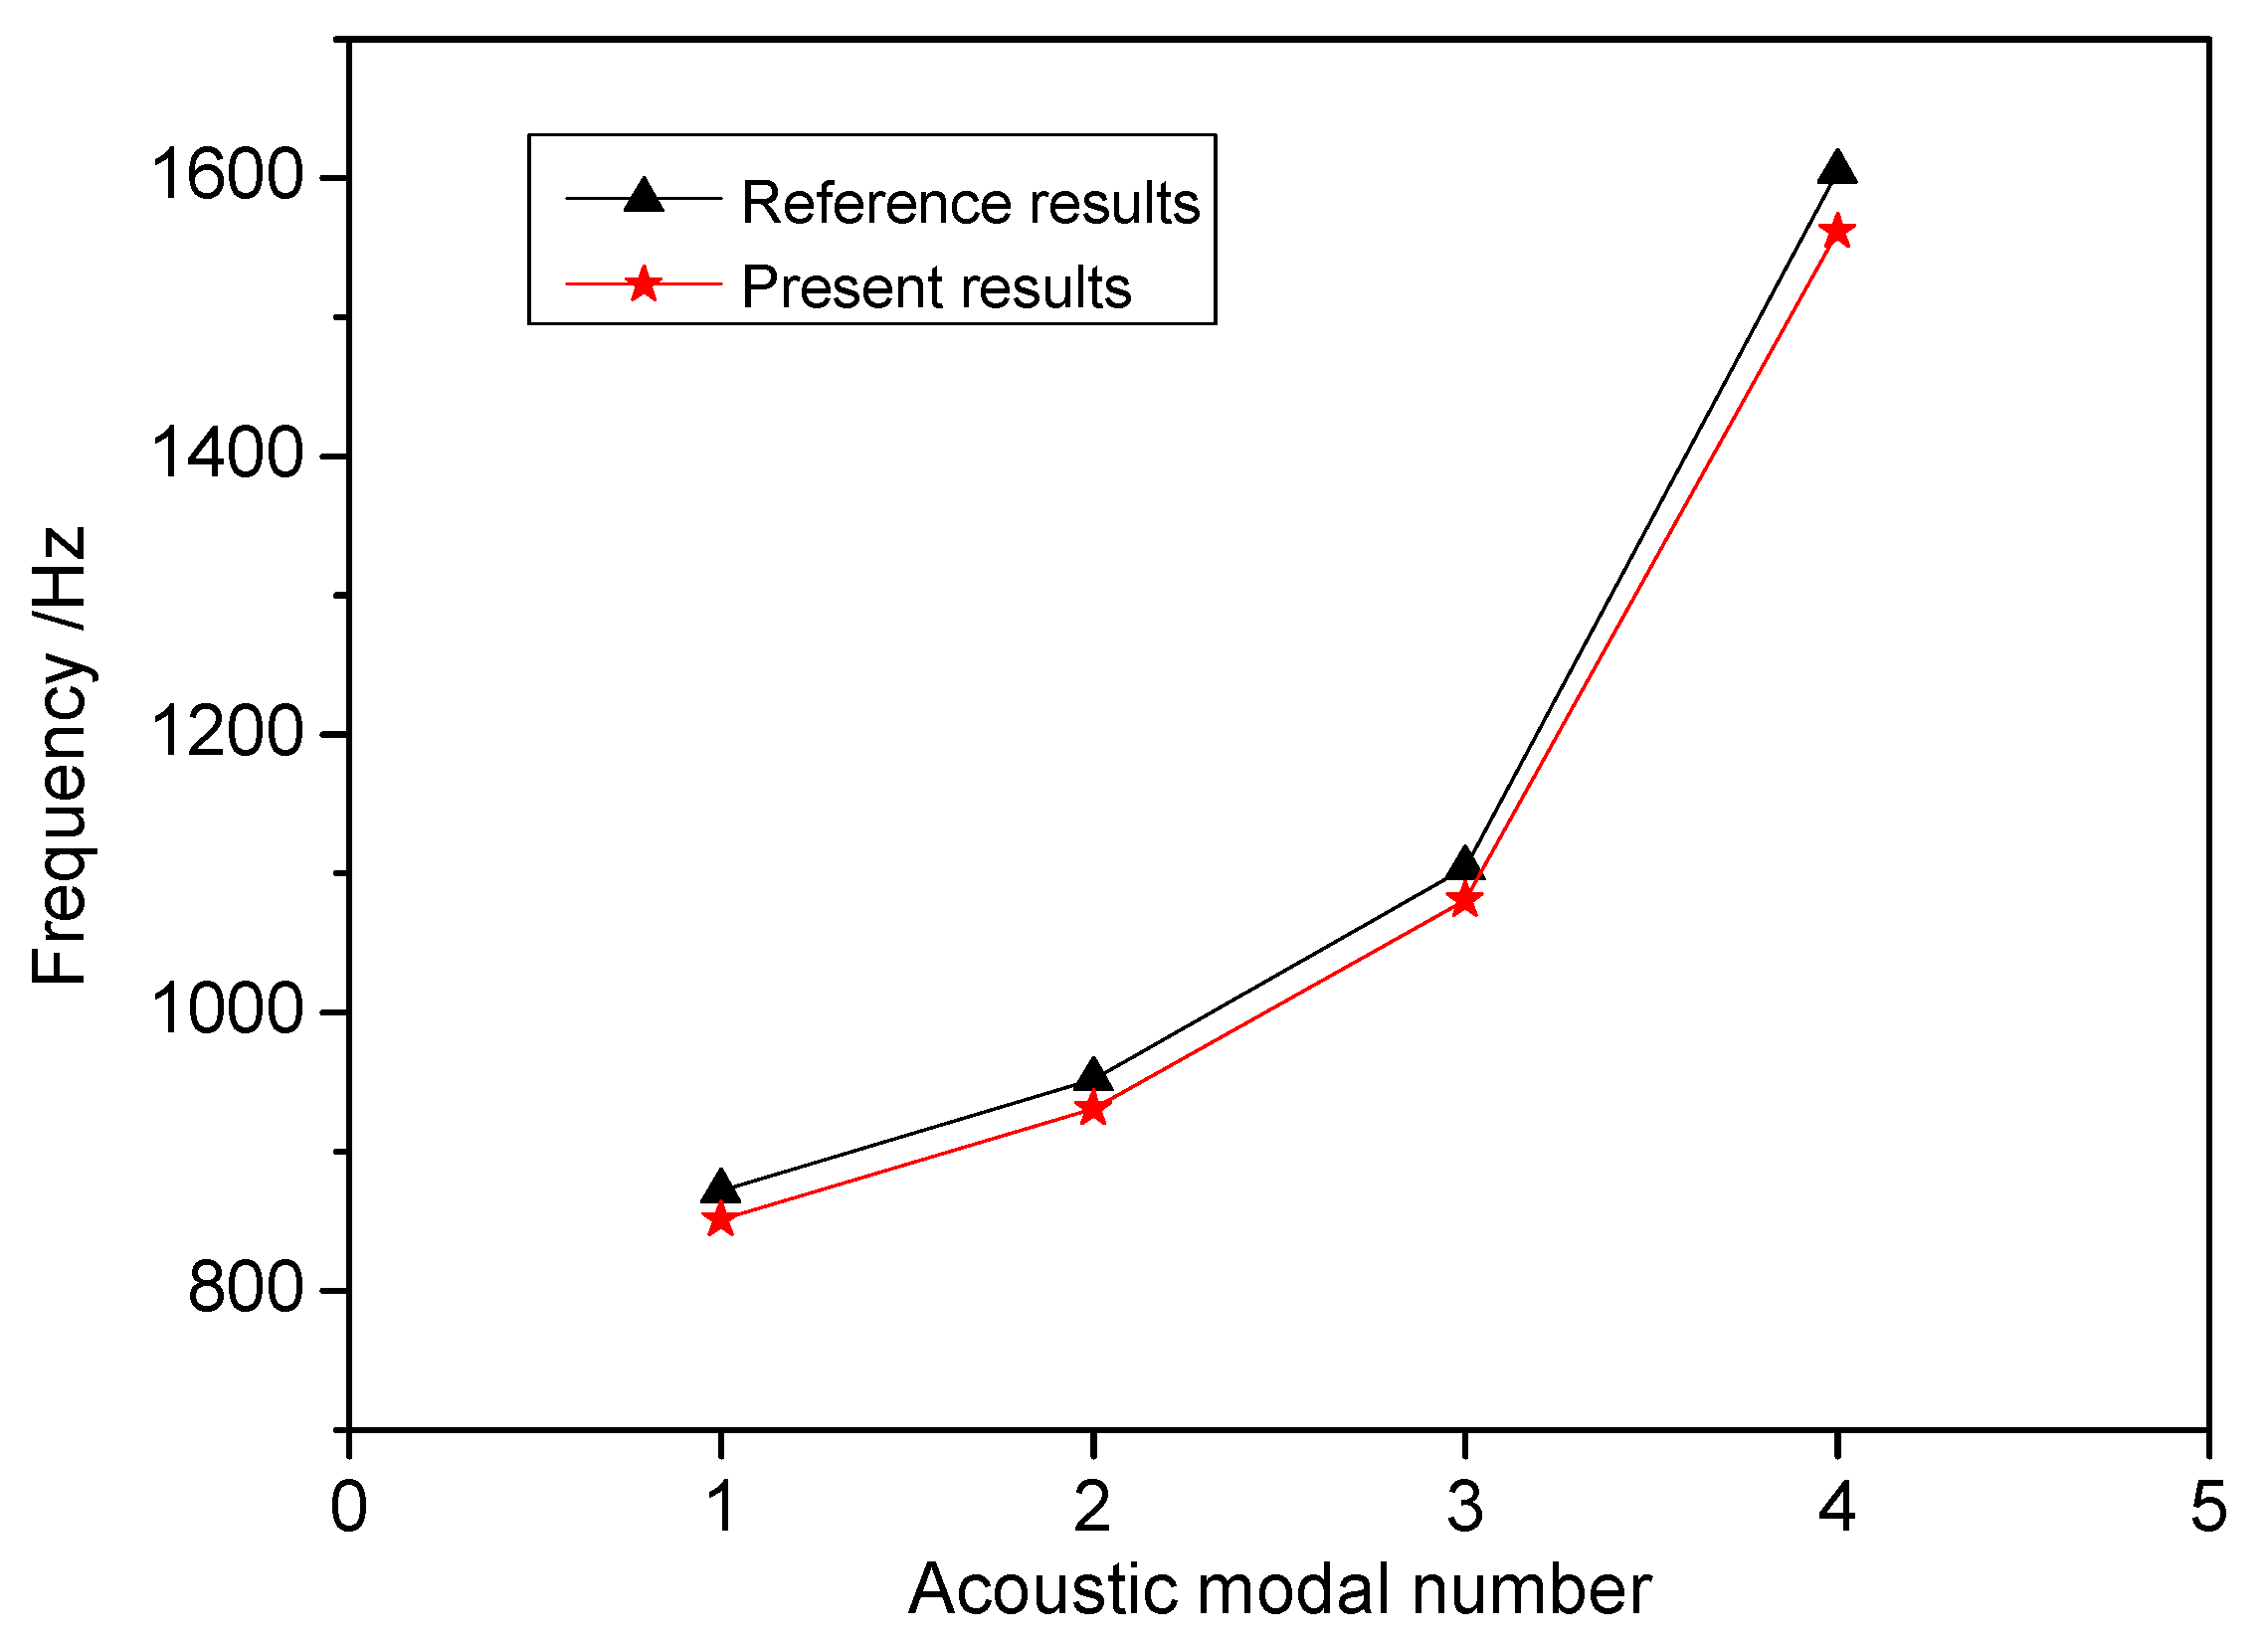
The sound source information is derived from the flow data using the Lighthill acoustic analogy method with the ICFD module in Actran VI software. The sound source information directly extracted with Actran is the time domain sound source, which is converted into a frequency domain sound source through Fourier transform in order to analyze the sound response at different frequencies. The Hanning window is taken as the signal truncation function to reduce the spectral energy leakage from signal truncation. The frequency domain sound source obtained which is present on the flow field grid needs to be mapped to the sound field grid by means of interpolation. The linear interpolation may lead to information loss because of the differences in the acoustic grid and flow field grid, while the integral interpolation method can retain all the information. Therefore, the sound source information on the flow field grid is transferred to the acoustic mesh with the method of integral interpolation in this paper. Figure 15 shows the acoustic modal distribution in the rectangular cavity at the inlet velocity of 83 m/s, the experimental results correspond to those present in the literature [32,33]. The sound information in the model is presented in Figure 16. Acoustic modal frequency calculation results and calculation errors are shown in Table 2 and Figure 17.
It is evident that the distribution of the first four-order acoustic modes in the rectangular cavity calculated with the method in the present paper are in line with the corresponding results in the literature. The calculated results of the acoustic modal frequency values of each order show better consistency with the experimental results, and the value of the maximum calculation error is 2.7%. Therefore, it is feasible to use the calculation method in the present paper to obtain the sound characteristics induced by the wake vortex of the plate under different inlet velocities.
5. Investigation on High-Intensity Sound in a Simplified Compressor Model

The built-in plate pipeline model based on the Parker model is established to investigate the characteristics and mechanisms of the noise of the simplified compressor model with the method based on acoustic analogy. The special “frequency-locked phase-locked” characteristic is captured and the mechanism of its onset is analyzed.

5.1. Computational Model and Parameter Settings

The study of the high-intensity noise phenomenon in the compressor through experiments has significant cost, so it is necessary to develop suitable numerical calculation models and methods. There are many influencing factors in the compressor, including the changing pipe geometry, various loads, and so on, which leads to a significant difficulty in building numerical compressor models to study the high-intensity noise phenomenon. Therefore, a pipe model with a locked plate is established in which a single plate is taken as a simplified blade in a compressor. The model of Welsh, which is used to study the sound induced by the plate wake in rectangular pipes, is taken as a reference to investigate the sound characteristics resulting from the wake vortex of the plate. Welsh conducted a sound experiment in a low-speed wind tunnel. Additionally, the rectangular plate was locked in the center of the wind tunnel. The cross-sectional dimension of the wind tunnel was 244 mm × 244 mm, the spanwise dimension and chord length of the plate were 244 mm and 192 mm, respectively, and the thickness was 12 mm. The plate worked at an adjustable velocity range of 0–40 m/s [10]. Flow display technology was adopted to monitor the motion law of the plate wake vortex under different inlet velocities. The link between frequency and SPL corresponding to the flow velocity was obtained, and the propagation of the sound wave when high-intensity sound occurred was captured in the pipe. The above test with sufficient and reliable results has been widely cited in research on such issues. Therefore, this model is used as the research object in present paper, and the structure diagram of the established computational model is shown in Figure 18.
The walls of the numerical model are all set to no-slip boundary conditions, the inlet and outlet boundary conditions are in line with rectangular cavity model, and the entire model is selected as the sound source extraction region. A structured grid is chosen for the flow field calculation grid with a minimum grid size of 0.5 mm, a maximum grid size of 2 mm, and the grid growth rate near the plate is set to 1.2 to resize the grid around the plate. The other parts of the pipe are set to 3 mm. The calculation model of the plate wake flow field is shown in Figure 19. The unstructured grid is chosen for the acoustic field calculation grid with a maximum grid size of 8 mm. Acoustic non-reflection regions are added outside the inlet and outlet of model, i.e., free propagation domain 1 and free propagation domain 2. The other walls of the model are set to acoustic hard walls. The sound field calculation model is shown in Figure 20.
Initially, the steady flow field calculation is implemented and then the results are used for the initialization of the transient flow. The RNG k ε turbulence model is selected for the steady flow field with 100 iterations, and the standard wall is selected to address the flow around the wall. The LES turbulence model is selected for transient flow field calculations, and the transient equations are second-order implicit. The transient calculation time step is 0.00025 s to gain the sound source information of 0–2000 Hz. The number of time steps is 400 with 20 iterations in each time step.

5.2. Plate Wake Vortex Characteristics

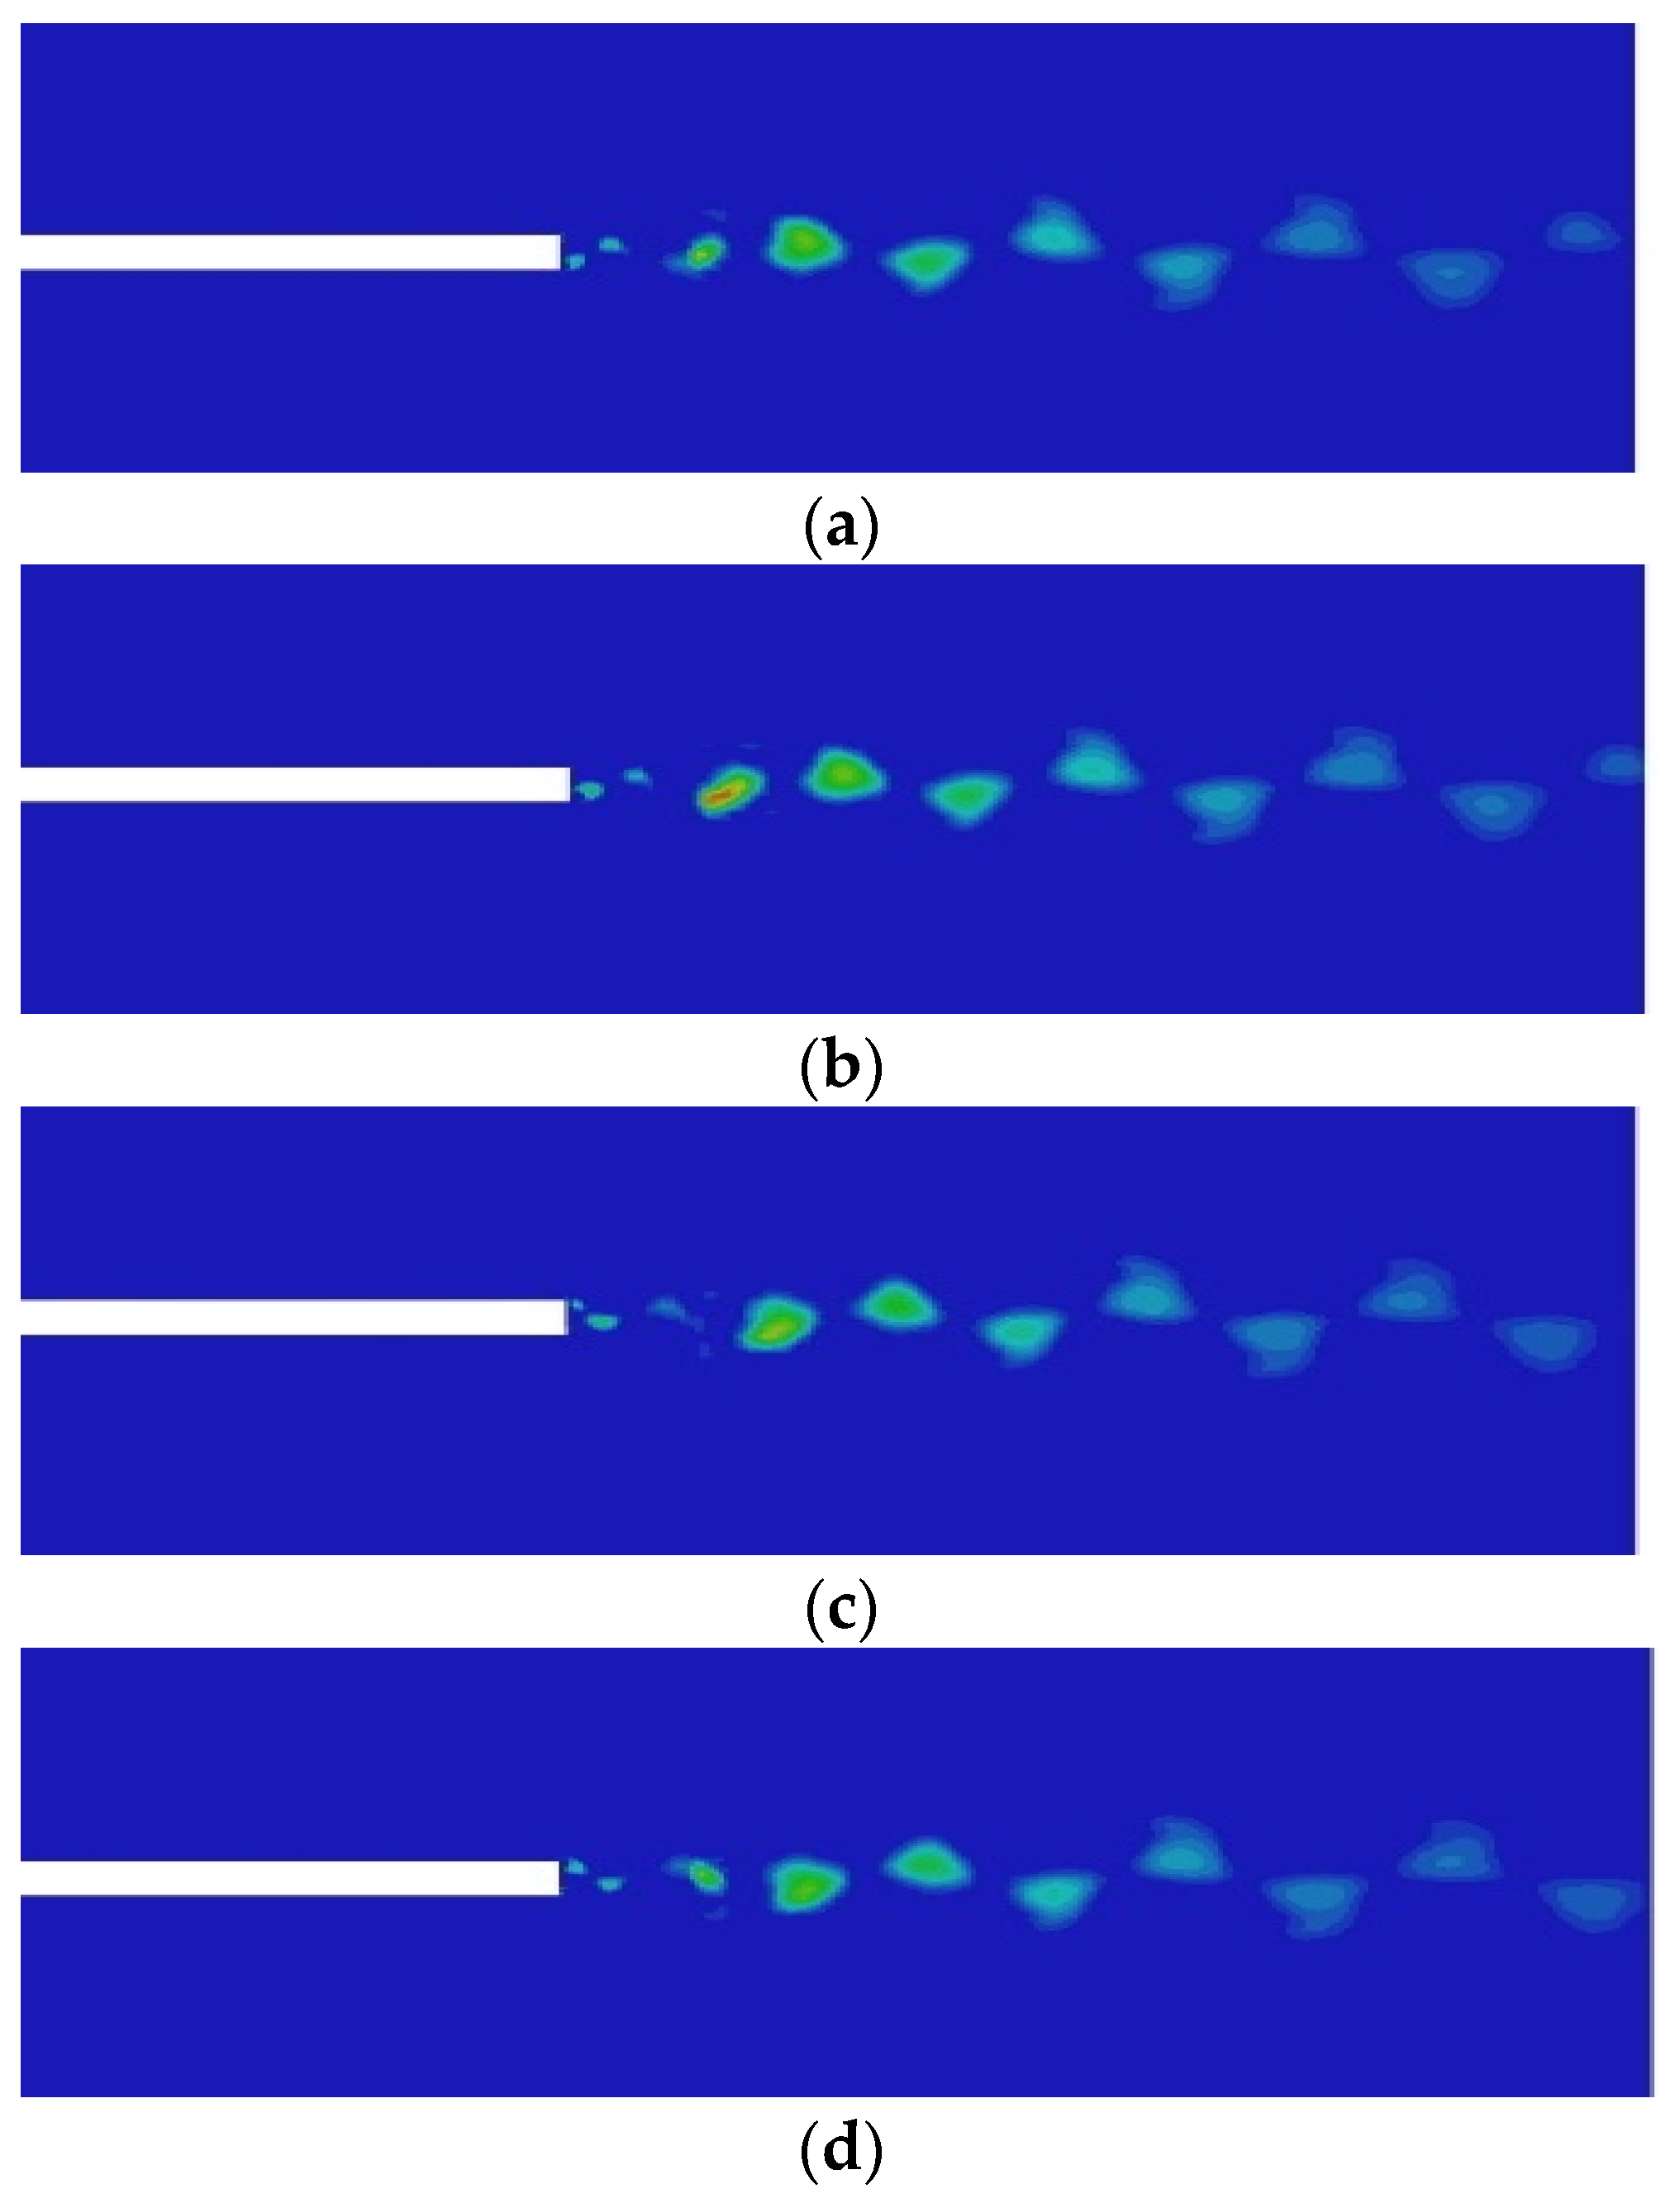
The flow characteristics of the plate wake under different inlet velocities are obtained and calculated, and the movement of the plate wake vortex at a flow velocity of 29 m/s is shown in Figure 21. The motion law of the corresponding plate wake vortex is present in reference [10].
It can be seen from Figure 21 that shedding vortex layers are generated on both side surfaces of the plate for the function of the tangential flow in the rectangular pipe. Vortex shedding layers with an asymmetrical form develop from the main flow to downstream and gradually roll up larger scale vortices, presenting a typical Karman vortex street structure. The motion characteristics of the plate wake vortex captured with the calculation method in this paper agree excellently with the corresponding experimental results in reference [10].

5.3. Phenomenon of the Frequency-Locked Phase-Locked System

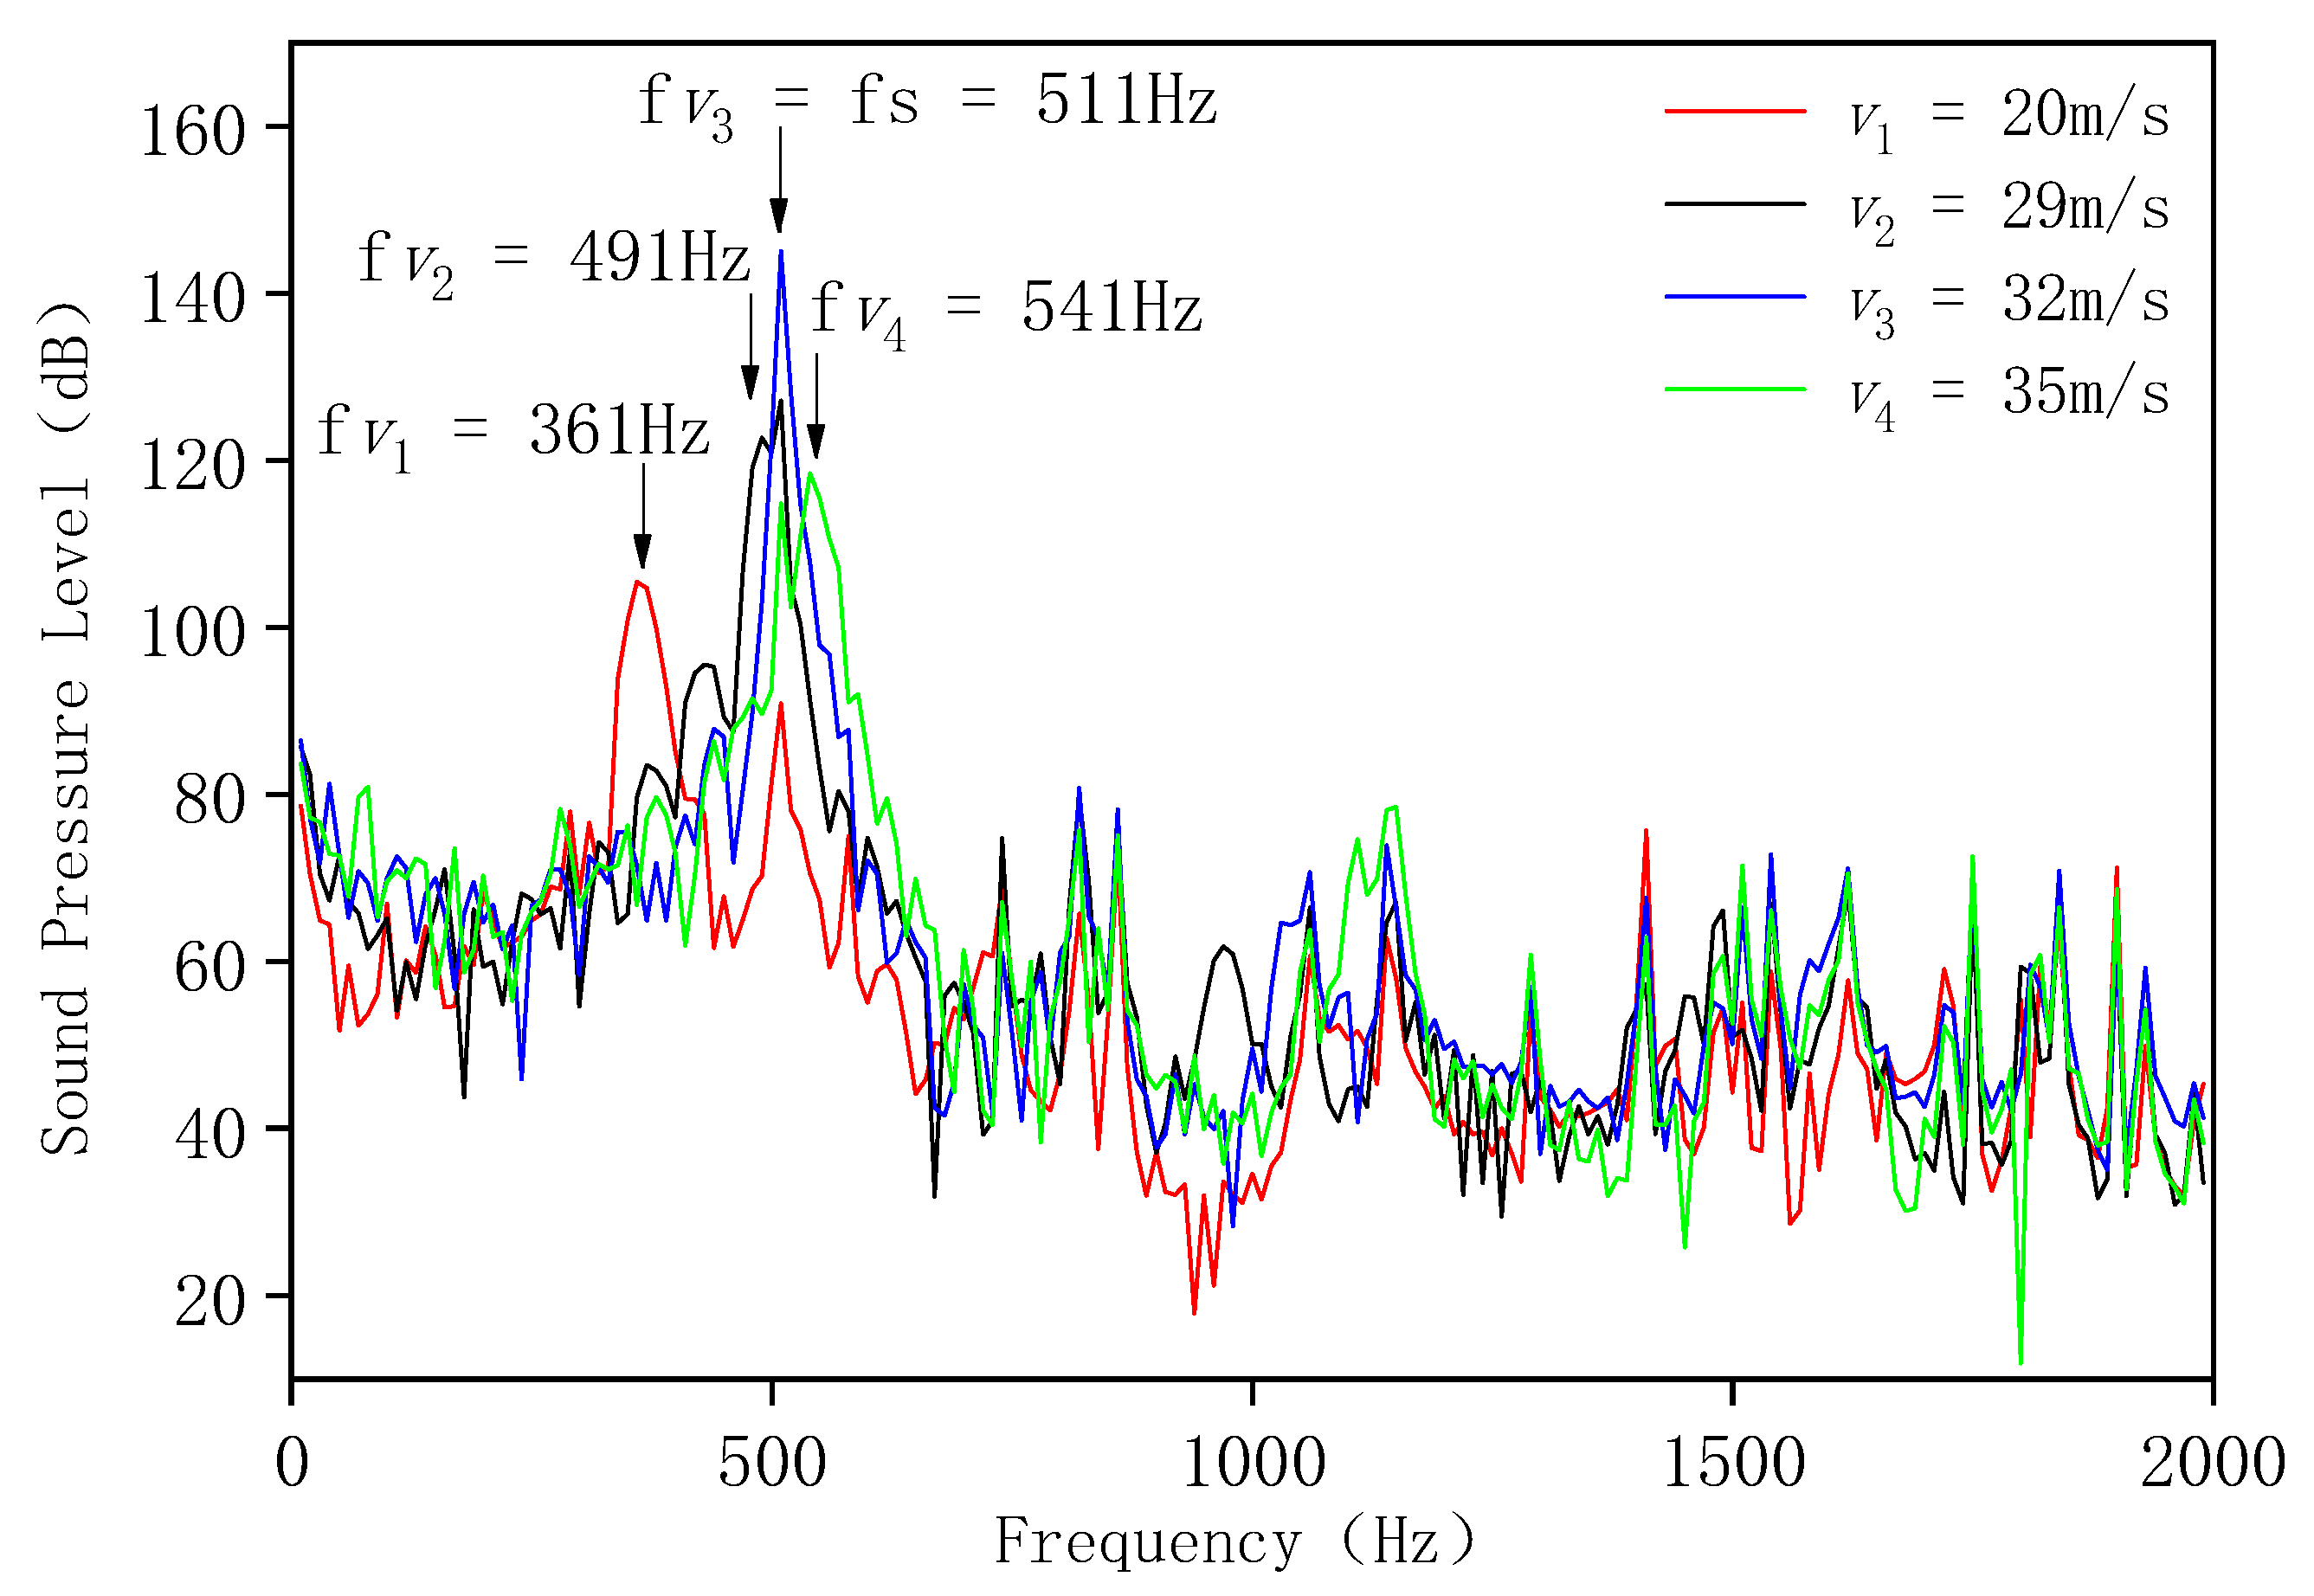
The experimental results given by Welsh show that wake vortex frequency of the plate increases linearly with the velocity. The SPL in the pipe increases sharply over the velocity range of 28–30 m/s, and the phenomenon of high-intensity sound occurs in the pipe at this time. The frequency corresponding to high-intensity sound is 530 Hz, and SPL corresponding to this frequency is 145 dB. Additionally, the frequency of high-intensity sound stays constant at that velocity range, which is the phenomenon of the frequency-locked characteristic. The internal sound pressure spectrum of the pipe in the velocity range of 20–35 m/s is obtained by calculation, and the representative results of these are shown in Figure 22 at the velocities of 20 m/s, 29 m/s, 32 m/s and 35 m/s. The position of the sound pressure monitoring point is just above the middle of the plate and near the pipe wall, which is the same location as the measurement point in the experiment by Welsh.
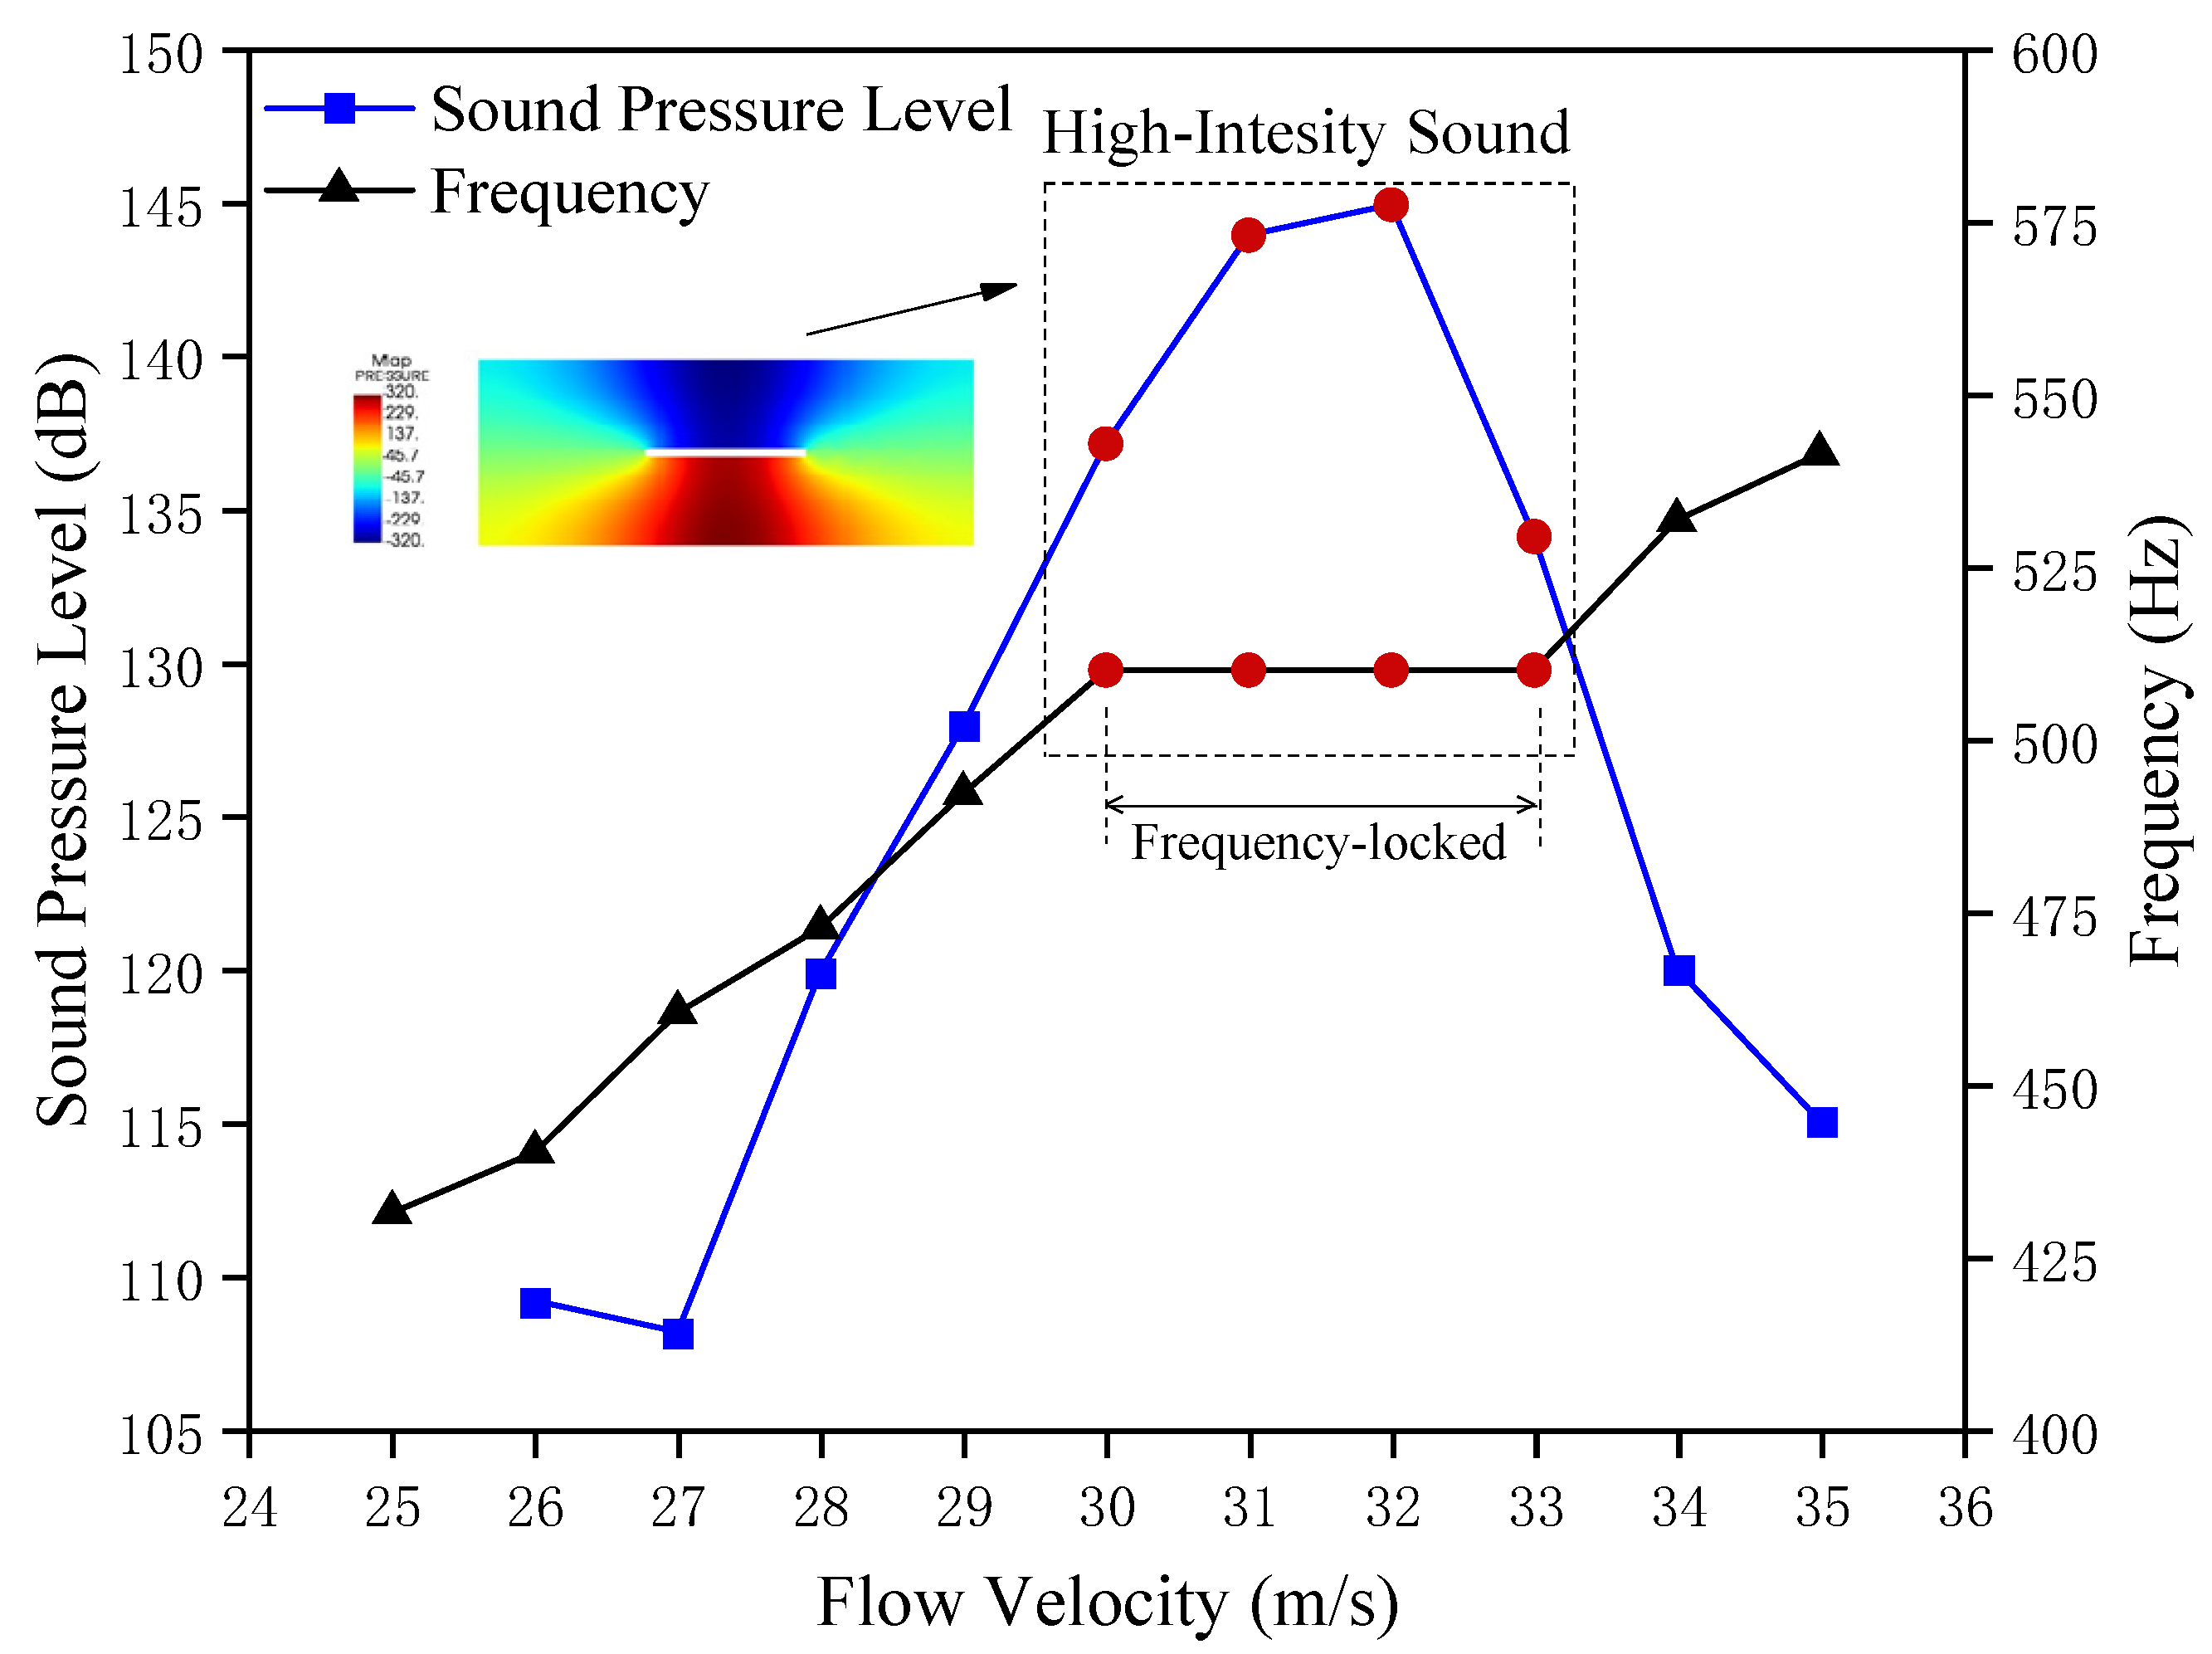
f v , which is the frequency of the vortex, and f s , which is the frequency of the acoustic mode, presented in Figure 22, have pure tone and high amplitude. Additionally, f v dominates in the frequency spectrum as increasing velocities and harmonic components present themselves. The acoustic modal frequencies, i.e., the pure tone component f s = 511 Hz, which is 3.6% different from the pipeline acoustic modal frequency 530 Hz given by Welsh, can be excited under discrete velocities. The wake vortex frequency increases close to the acoustic modal frequency of the pipeline with increasing flow velocity, which is dominant in the sound pressure spectrum in the pipe, and the SPL increases sharply. The SPL reaches up to 145 dB at the inlet velocity of 32 m/s, and the high-intensity sound occurs in the pipe at the same time. The vortex frequency grows sharply to beyond the acoustic mode frequency as flow velocity continues to increase and the SPL is greatly reduced. Figure 23 shows the evolution rhythm of character frequency and the SPL with increasing velocity, as well as the sound pressure distribution in the pipe with the frequency corresponding to high-intensity sound.
Figure 23 shows that the pure tone component f v , which is the frequency of the vortex, increases linearly as flow velocity increases. The velocity range where high-intensity sound occurs is 30–33 m/s, i.e., the frequency-locked area at character frequency 511 Hz. These characteristics are in line with the typical features of the Karman vortex street, so the vortex of plate is the source of the high SPL component. This also shows that the Strouhal number ( St = f v d / V , where f v is the frequency of vortex, d is the thickness of plate, and V is the flow velocity upstream of the plate) of the model always keeps constant at this flow velocity range, St = f v d / V = 0.212 , which is approximately consistent with the corresponding results in the literature [10]. The dark blue and dark red color of the sound pressure distribution in Figure 21 are high sound pressure regions, and the sign before the sound pressure value represents the phase. The sound pressure amplitudes on both sides of the plate are equal with the opposite phase of 180°. The sound pressure distribution, when high-intensity sound appears in the model, presents the β mode form of the Parker model.

6. Conclusions

(1)
An experiment in a multistage high-speed compressor was conducted to synchronously investigate the phenomenon of high-level vibration on R1 with high noise. Different testing positions of the casing were set to monitor the casing pressure and vibration status of R1. The noise spectrum of R1 was characterized as discrete multi-tone at the time that the occurrence of abnormal vibration appeared. Characteristic frequency gradually increased with the increasing rotational speed, and there was a phenomenon that characteristic frequency kept constant with discrete rotor speed. The evolution of the displaced blade vibration and the sound pressure of the characteristic frequency against the rotor speed showed synchronicity; several peak frequencies around character frequencies with an equal space of about 166 Hz matched with the rotating speeds of the rotors, which shows that there was a certain relation between frequency and the vibration of the rotor blades. The assumption that rotational noise sound is the reason for the vibration of rotor blades was made, and its accuracy was verified through theoretical calculation;
(2)
The mechanisms and characteristics of sound induced by shedding vortices in the pipeline based on acoustic analogy are proposed. A rectangular cavity pipeline model was established to analysis the distribution characteristics of the vortex system and the acoustic mode distribution in the pipeline under flow conditions. The flow was separated at the leading edge of the rectangular cavity, a large-scale vortex was generated and developed in the cavity until it reached the rear edge of the cavity, and then this flowed to the circular pipe. The vortices were mainly concentrated in the rectangular cavity region. The calculated results of the acoustic modal frequency values of each order were in line with the experimental results, and the value of the maximum calculation error was 2.7%, which verified the applicability of the numerical method;
(3)
A simplified compressor model based on a duct model with a locked plate was established to study the characteristics and mechanisms of high-intensity sound with the acoustic analogy method. The motion laws of the wake vortices of the plate were obtained, presenting a typical Karman vortex street structure. The shedding vortex frequency gradually increased with the flow velocity, and there was a frequency-locked area at a special range of flow velocity which was similar to the features of the experimental results in the compressor. The acoustic modal frequency, i.e., the pure tone component f s = 511 Hz, was 3.6% different from the corresponding frequency of 530 Hz given by Welsh. The maximum value of sound pressure level was up to 145 dB at the inlet velocity of 32 m/s, and the high-intensity sound appeared in the pipe at the same time and remained in a limit velocity range of 30–33 m/s. The sound pressure distribution, when high-intensity sound appears in this model, presents the β mode form of the Parker model.

Author Contributions

Conceptualization, F.Z. and B.C.; methodology, F.Z.; software, B.C.; validation, F.Z. and H.L.; formal analysis, F.W. and Y.S.; investigation, H.L. and Y.S.; resources, F.W., H.L. and Y.S.; data curation, Y.S. and F.W.; writing—original draft preparation, F.Z. and B.C.; writing—review and editing, F.Z. and B.C. All authors have read and agreed to the published version of the manuscript.

Funding

This research was supported by the China Aviation Development Shenyang Engine Research Institute for the experimental test of compressor noise. Additionally, it was supported by the Basic Research Project of Science and Technology Department of Liaoning Province (No. JYT2020009), the Scientific Research Foundation for Introduced Scholars of Shenyang Aerospace University (No. 21YB01), the Liaoning Natural Science Foundation Guiding Plan of China (No. 2019-ZD-0237), and the National Science and Technology Major Project (No. J 2019-II-0006-0026).

Institutional Review Board Statement

Not applicable.

Informed Consent Statement

Not applicable.

Data Availability Statement

Not applicable.

Conflicts of Interest

The authors declare no conflict of interest.

References

  1. Hellmich, B.; Seume, J.R. Causes of acoustic resonance in a high-speed axial compressor. J. Turbomach. 2008, 130, 031003–031011. [Google Scholar] [CrossRef]
  2. Ziada, S.; Oengoren, A.; Vogel, A. Acoustic resonance in the inlet scroll of a turbo-compressor. J. Fluids Struct. 2002, 16, 361–373. [Google Scholar] [CrossRef]
  3. Department of Defense Handbook. In Engine Structural Integrity Program (ENSIP); United States Air Force, MIL-HDBK-1783B; Department of Defense: Washington, DC, USA, 2004.
  4. Zhao, F.; Yan, M.; Jing, X.; Wang, D.; Sha, Y.; Liu, Y. Physical Model for Acoustic Resonance in the Annular Cavity Structure. Chin. J. Aeronaut. 2020, 33, 3228–3237. [Google Scholar] [CrossRef]
  5. Parker, R. Resonance effects in wake shedding from parallel plates: Some experimental observations. J. Sound Vib. 1966, 4, 62–72. [Google Scholar] [CrossRef]
  6. Parker, R. Resonance effects in wake shedding from parallel plates: Calculation of resonant frequencies. J. Sound Vib. 1967, 5, 330–343. [Google Scholar] [CrossRef]
  7. Parker, R. Resonance effects in wake shedding from compressor blading. J. Sound Vib. 1967, 6, 302–309. [Google Scholar] [CrossRef]
  8. Parker, R.; Griffiths, W. Low frequency resonance effect in wake shedding from parallel plates. J. Sound Vib. 1968, 7, 371–379. [Google Scholar] [CrossRef]
  9. Clements, R.R. An inviscid model of two-dimensional vortex shedding. J. Fluid Mech. 1973, 57, 321–336. [Google Scholar] [CrossRef]
  10. Welsh, M.; Stokes, A.; Parker, R. Flow-resonant sound interaction in a duct containing a plate, part 1: Semi-circular leading egde. J. Sound Vib. 1984, 95, 305–323. [Google Scholar] [CrossRef]
  11. Thompson, M.; Hourigan, K.; Welsh, M. Prediction of vortex shedding from bluff bodies in the presence of a sound field. Fluids Dyn. Res. 1988, 3, 349–352. [Google Scholar] [CrossRef]
  12. Tan, B.; Thompson, M.; Hourigan, K. Sources of acoustic resonance generated by flow around a long rectangular plate in a duct. J. Fluid Struct. 2003, 18, 729–740. [Google Scholar] [CrossRef]
  13. Courtiade, N.; Ottavy, X. Experimental study of surge precursors in a high-speed multistage compressor. J. Turbomach. 2013, 135, 061018. [Google Scholar] [CrossRef] [Green Version]
  14. Cooper, A.J.; Peake, N. Trapped acoustic modes in aeroengine intakes with swirling flow. J. Fluid Mech. 2000, 419, 151–175. [Google Scholar] [CrossRef]
  15. Han, L.; Li, P.Y.; Yu, S.J.; Chen, C.; Fei, C.W.; Lu, C. Creep/fatigue accelerated failure of Ni-based superalloy turbine blade: Microscopic characteristics and void migration mechanism. Int. J. Fatigue 2022, 154, 106558. [Google Scholar] [CrossRef]
  16. Han, L.; Wang, Y.B.; Zhang, Y.; Lu, C.; Fei, C.W.; Zhao, Y.J. Competitive cracking behavior and microscopic mechanism of Ni-based superalloy blade respecting accelerated CCF failure. Int. J. Fatigue 2021, 150, 106306. [Google Scholar] [CrossRef]
  17. Li, H.; Bu, S.; Wen, J.R.; Fei, C.-W. Synthetical modal parameters identification method of damped oscillation signals in power system. Appl. Sci. 2022, 12, 4688. [Google Scholar] [CrossRef]
  18. Lighthill, M.J. On sound generated aerodynamically I. General theory. Proc. R. Soc. Lond. A 1957, 211, 564–587. [Google Scholar]
  19. Bailly, C.; Candel, S.; Lafon, P. Prediction of supersonic jet noise from a statistical acoustic model and a compressible turbulence closure. J. Sound Vib. 1996, 194, 219–242. [Google Scholar] [CrossRef] [Green Version]
  20. Bailly, C.; Bechara, W.; Lafon, P. Jet noise predictions using a k-epsilon turbulence model. AIAA J. 1993, 4412–4420. [Google Scholar]
  21. Cai, X.; Ladeinde, F. A hybrid LES/RANS calculation of subsonic supersonic hot jet noise. In Proceedings of the ASME Turbo Expo 2007: Power for Land, Sea, and Air, Montreal, QC, Canada, 14–17 May 2007; pp. 1521–1530. [Google Scholar]
  22. Lai, H.; Luo, K. A three-dimensional hybrid LES-acoustic analogy method for predicting open-cavity noise. Flow. Turbul. Combust. 2007, 79, 55–82. [Google Scholar] [CrossRef]
  23. Flemming, F.; Sadiki, A.; Janicka, J. Investigation of combustion noise using a LES/CAA hybrid approach. In Proceedings of the 31st International Symposium on Combustion, Heidelberg, Germany, 6–11 August 2006; pp. 3189–3196. [Google Scholar]
  24. Curle, N. The influence of solid boundaries upon aerodynamic sound. Proc. R. Soc. Lond. A 1955, 231, 505–514. [Google Scholar]
  25. Moin, P.; Mahesh, K. Direct numerical simulation: A tool in turbulence research. Ann. Rev. Fluid Mech. 1998, 30, 539–578. [Google Scholar] [CrossRef] [Green Version]
  26. Fei, C.; Liu, H.; Rhea, P.; Liem, P.R.; Choy, Y.; Han, L. Hierarchical model updating strategy of complex assembled structures with uncorrelated dynamic modes. Chin. J. Aeronaut. 2022, 135, 281–296. [Google Scholar] [CrossRef]
  27. Fei, C.-W.; Li, H.; Lu, C.; Han, L.; Keshtegar, B.; Taylan, O. Vectorial surrogate modeling method for multi-objective reliability design. Appl. Math. Model. 2022, 109, 1–20. [Google Scholar] [CrossRef]
  28. Howe, M.S. Theory of Vortex Sound; Cambridge University Press: Cambridge, UK, 2003. [Google Scholar]
  29. Cheong, C.; Joseph, P.; Park, Y.; Lee, S. Computation of aeolian tone from a circular cylinder using source models. Appl. Acoust. 2008, 69, 110–126. [Google Scholar] [CrossRef]
  30. Inoue, O.; Hatakeyama, N. Sound generation by a two-dimensional circular cylinder in a uniform flow. J. Fluid Mech. 2002, 471, 285–314. [Google Scholar] [CrossRef]
  31. Georgiadis, J.N.; Rizzetta, D.P. Large-Eddy simulation: Current capacity, recommended practices, and future research. AIAA J. 2010, 48, 1772–1784. [Google Scholar] [CrossRef]
  32. Mao, Y.; Hu, Z. Acoustic analogy for multiphase or multicomponent flow. J. Sound Vib. 2018, 140, 021006. [Google Scholar] [CrossRef]
  33. Kameier, F.; Neise, W. Rotation blade flow instability as a source of noise in axial turbomachines. J. Sound Vib. 1997, 2032, 833–853. [Google Scholar] [CrossRef]
  34. Ziada, S.; Bolduc, M.; Lafon, P. Flow-excited resonance of diametral acoustic modes in ducted rectangular cavities. AIAA J. 2017, 55, 3817–3830. [Google Scholar] [CrossRef]
  35. Bolduc, M. The Aerodynamic Excitation of Trapped Diametral Acoustic Modes in Rectangular Ducted Cavities. Ph.D. Thesis, McMaster University, Hamilton, ON, Canada, 2015. [Google Scholar]
Figure 1. Measuring points for sound pressure in compressor casing.
Applsci 12 06865 g001
Figure 2. Measuring points for rotor blade vibration.
Applsci 12 06865 g002
Figure 3. Time series of the character frequency noise signal at the four measuring points.
Applsci 12 06865 g003
Figure 4. Sound pressure spectrum derived above R1.
Applsci 12 06865 g004
Figure 5. Evolution rhythm of noise and blade vibration with rotor speed.
Applsci 12 06865 g005
Figure 6. Sound pressure spectrum at different rotating speeds.
Applsci 12 06865 g006
Figure 7. Evolution rhythm of characteristic frequencies and SPLs with rotor speed.
Applsci 12 06865 g007
Figure 8. Sound pressure spectrum near frequency 1410 Hz.
Applsci 12 06865 g008
Figure 9. Rotating sound source frequency corresponds to different circumferential modal numbers.
Applsci 12 06865 g009
Figure 10. Schematic diagram of experimental device of rectangular cavity pipe model and sound pressure measurement positions.(a) is a schematic diagram of the cross-section of the device. (b) is a schematic diagram of the position of the microphone measuring point and the direction of the flow velocity (1,2,3 and 4 represent the position of the microphone).
Applsci 12 06865 g010aApplsci 12 06865 g010b
Figure 11. Flow field calculation model of rectangular cavity pipeline.
Applsci 12 06865 g011
Figure 12. Sound field calculation model of rectangular cavity pipeline.
Applsci 12 06865 g012
Figure 13. Flow chart of numerical simulation.
Applsci 12 06865 g013
Figure 14. Distribution of flow vortices in rectangular cavity under different inlet velocities.(a) and (b) represent the working condition with flow velocity of 60 m/s and 83 m/s respectively.
Applsci 12 06865 g014aApplsci 12 06865 g014b
Figure 15. Distribution of acoustic modes in the rectangular cavity at an inlet velocity of 83 m/s. (ad) represent acoustic mode of first mode, second mode, third mode and fourth mode respectively.
Applsci 12 06865 g015
Figure 16. Sound pressure spectrum in the rectangular cavity at an inlet flow velocity of 83 m/s.
Applsci 12 06865 g016
Figure 17. Calculation results of acoustic modal frequency of the rectangular cavity at an inlet velocity of 83 m/s.
Applsci 12 06865 g017
Figure 18. Dimension of numerical model.
Applsci 12 06865 g018
Figure 19. Plate model for flow field.
Applsci 12 06865 g019
Figure 20. Plate model for sound field.
Applsci 12 06865 g020
Figure 21. Movement of plate wake vortex at different times. (ad) represent the movement of wake vortex in the time of 0.1325 s, 0.0135 s, 0.014 s and 0.01425 s respectively.
Applsci 12 06865 g021
Figure 22. Sound pressure spectrum at discrete flow velocities.
Applsci 12 06865 g022
Figure 23. Evolution rhythm of acoustic frequency and SPL with flow velocities.
Applsci 12 06865 g023
Table 1. Geometric dimensions of rectangular cavity.
ShapeW/HH/mmW/mm
Square cavity1.0254254
Rectangular cavity 10.95254241.3
Rectangular cavity 20.9254228.6
Table 2. Calculation results of acoustic modal frequency of the rectangular cavity at an inlet velocity of 83 m/s.
ContentsFirst
Mode
Second
Mode
Third
Mode
Fourth
Mode
Reference results872 Hz952 Hz1104 Hz1605 Hz
Present results851 Hz931 Hz1081 Hz1562 Hz
Error2.4%2.2%2.1%2.7%
Publisher’s Note: MDPI stays neutral with regard to jurisdictional claims in published maps and institutional affiliations.