
Monitoring and Analysis of Deformation Evolution Law of Fault Activation Caused by Deep Mining in Shizishan Copper Mine, China


Abstract
:1. Introduction
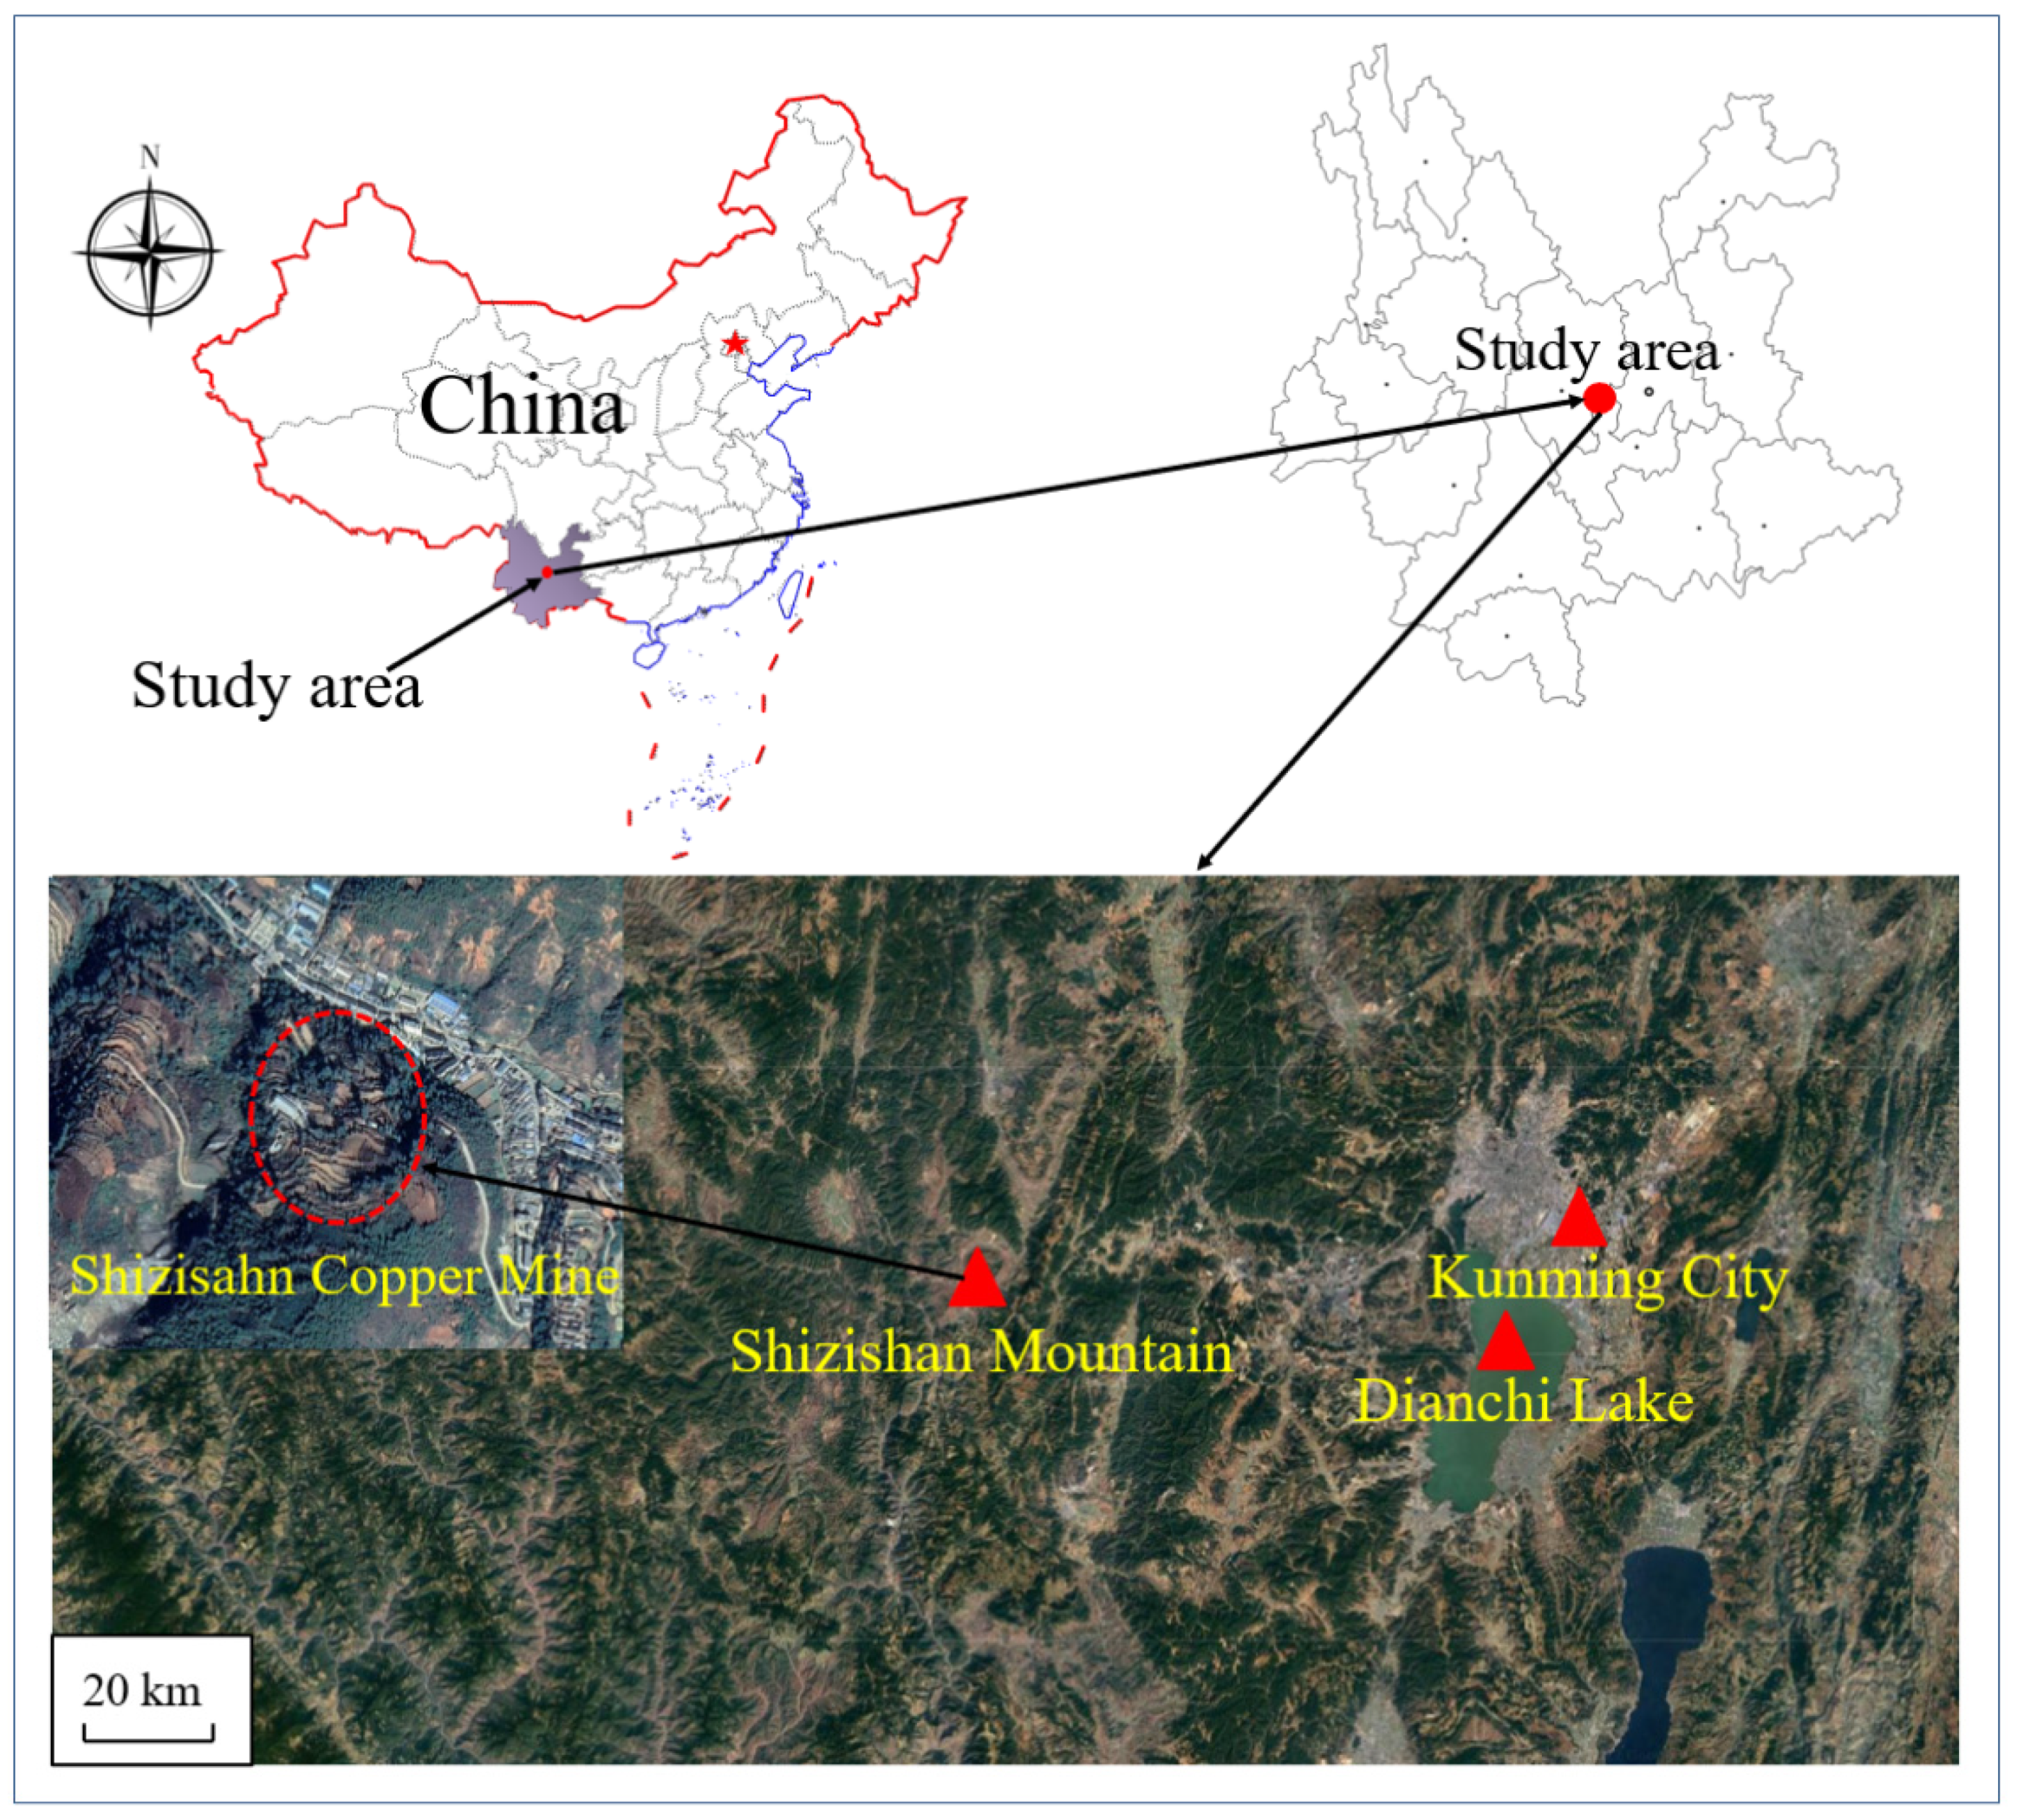
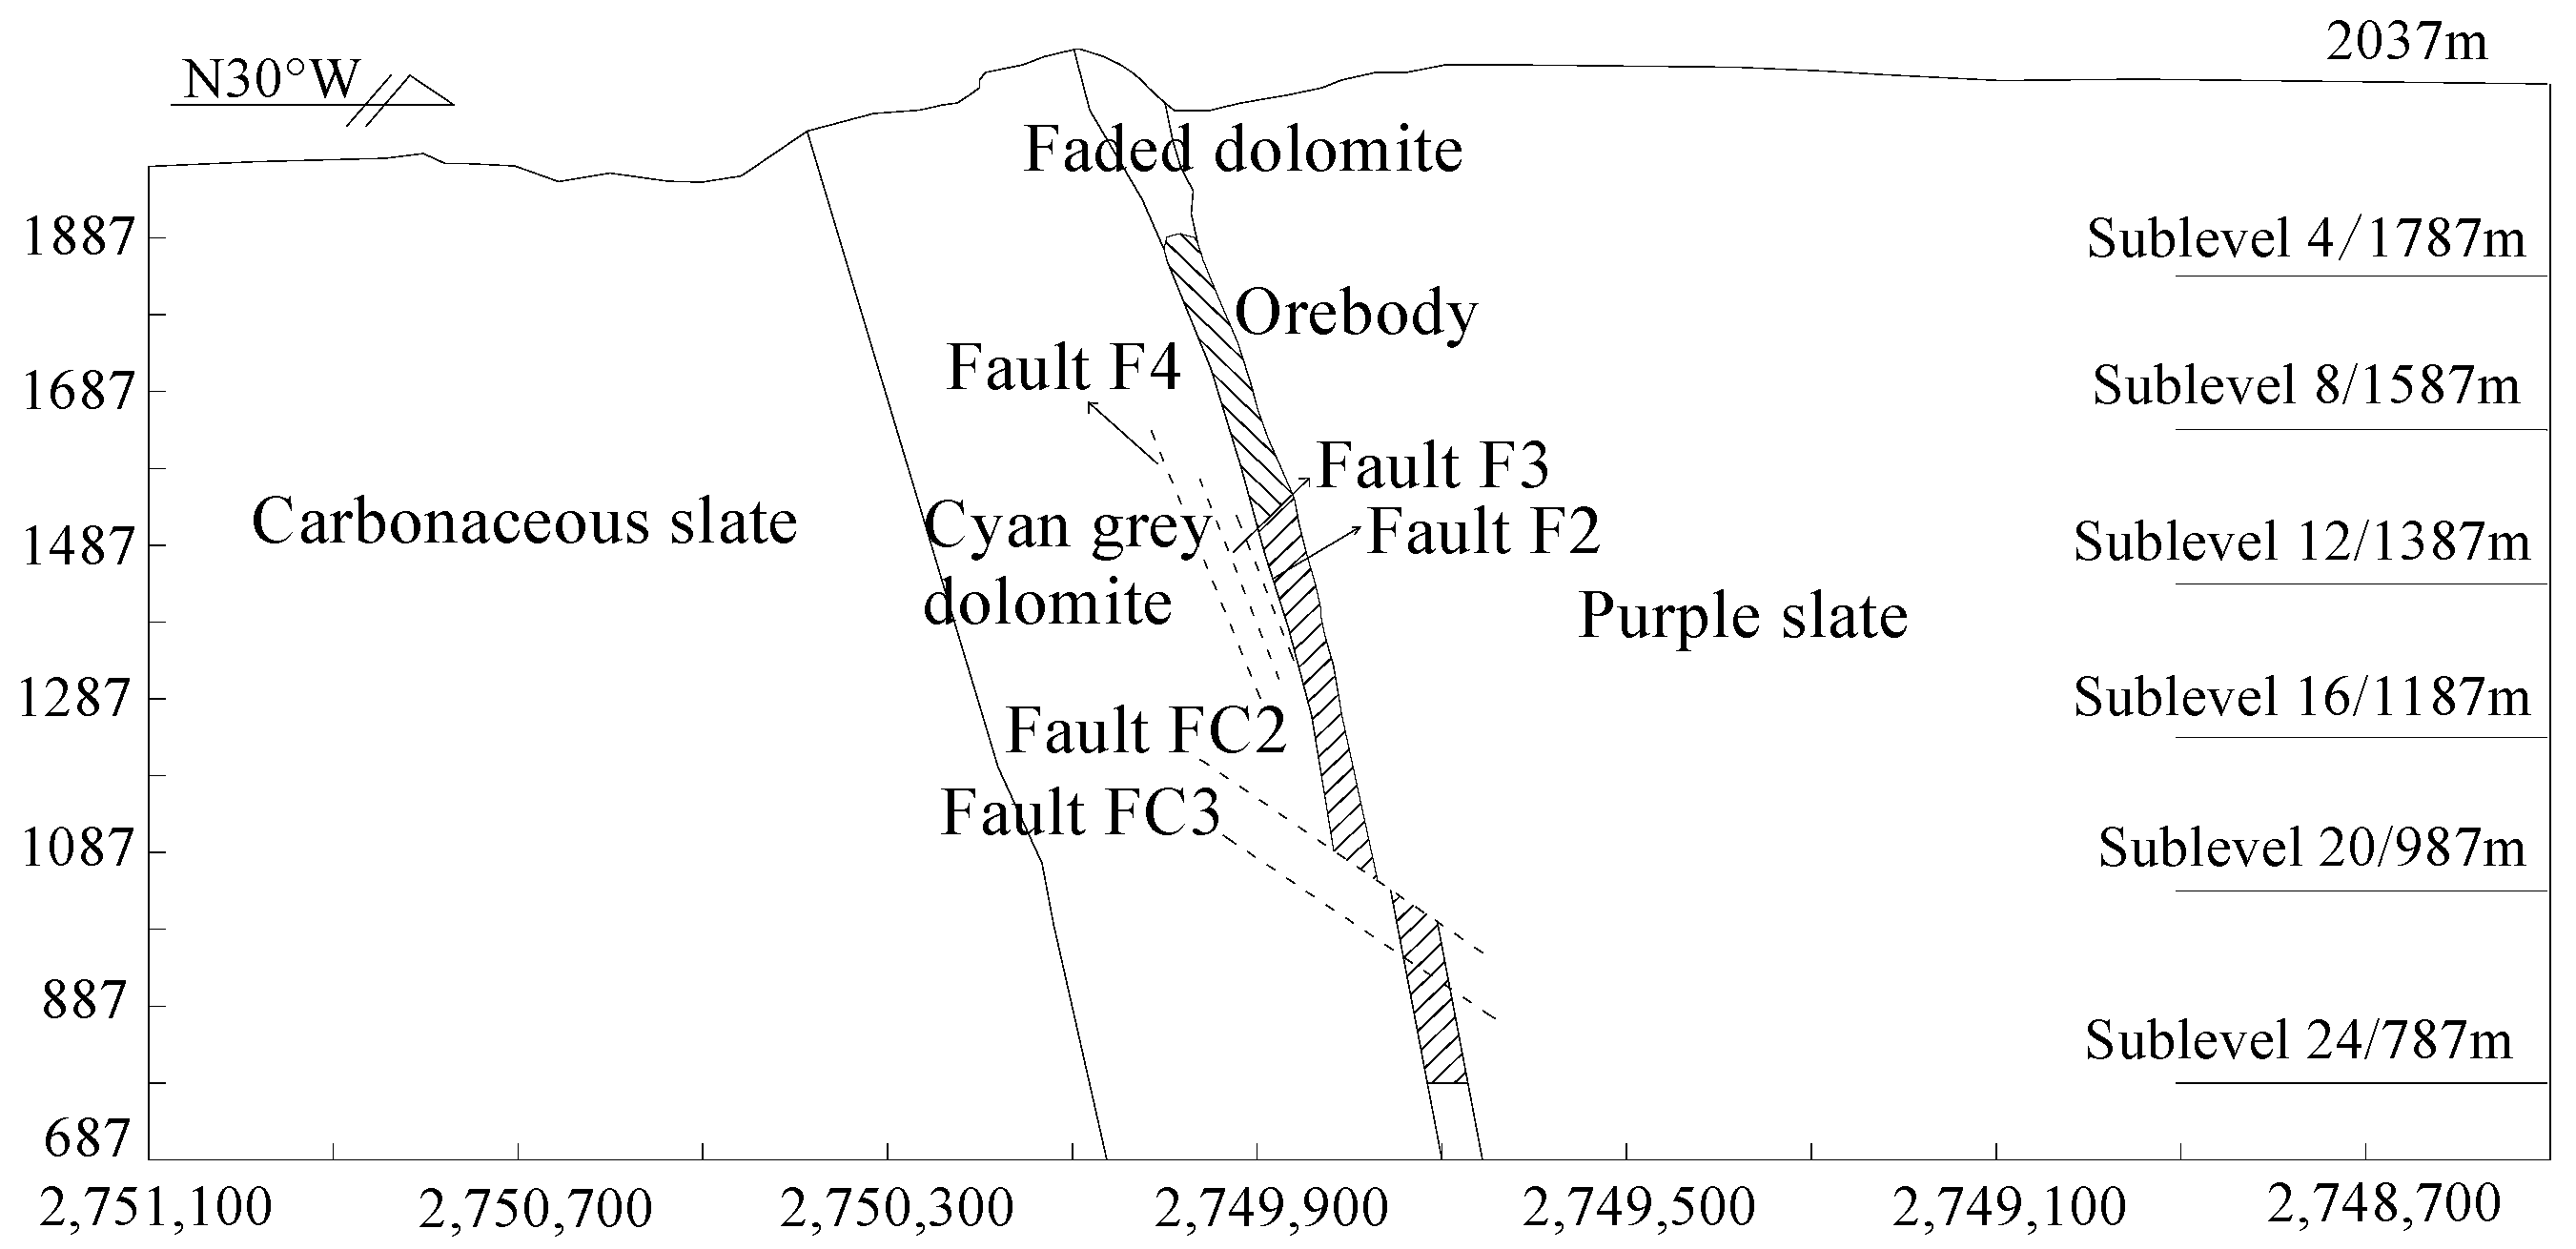
2. Engineering Geology of Mining Area
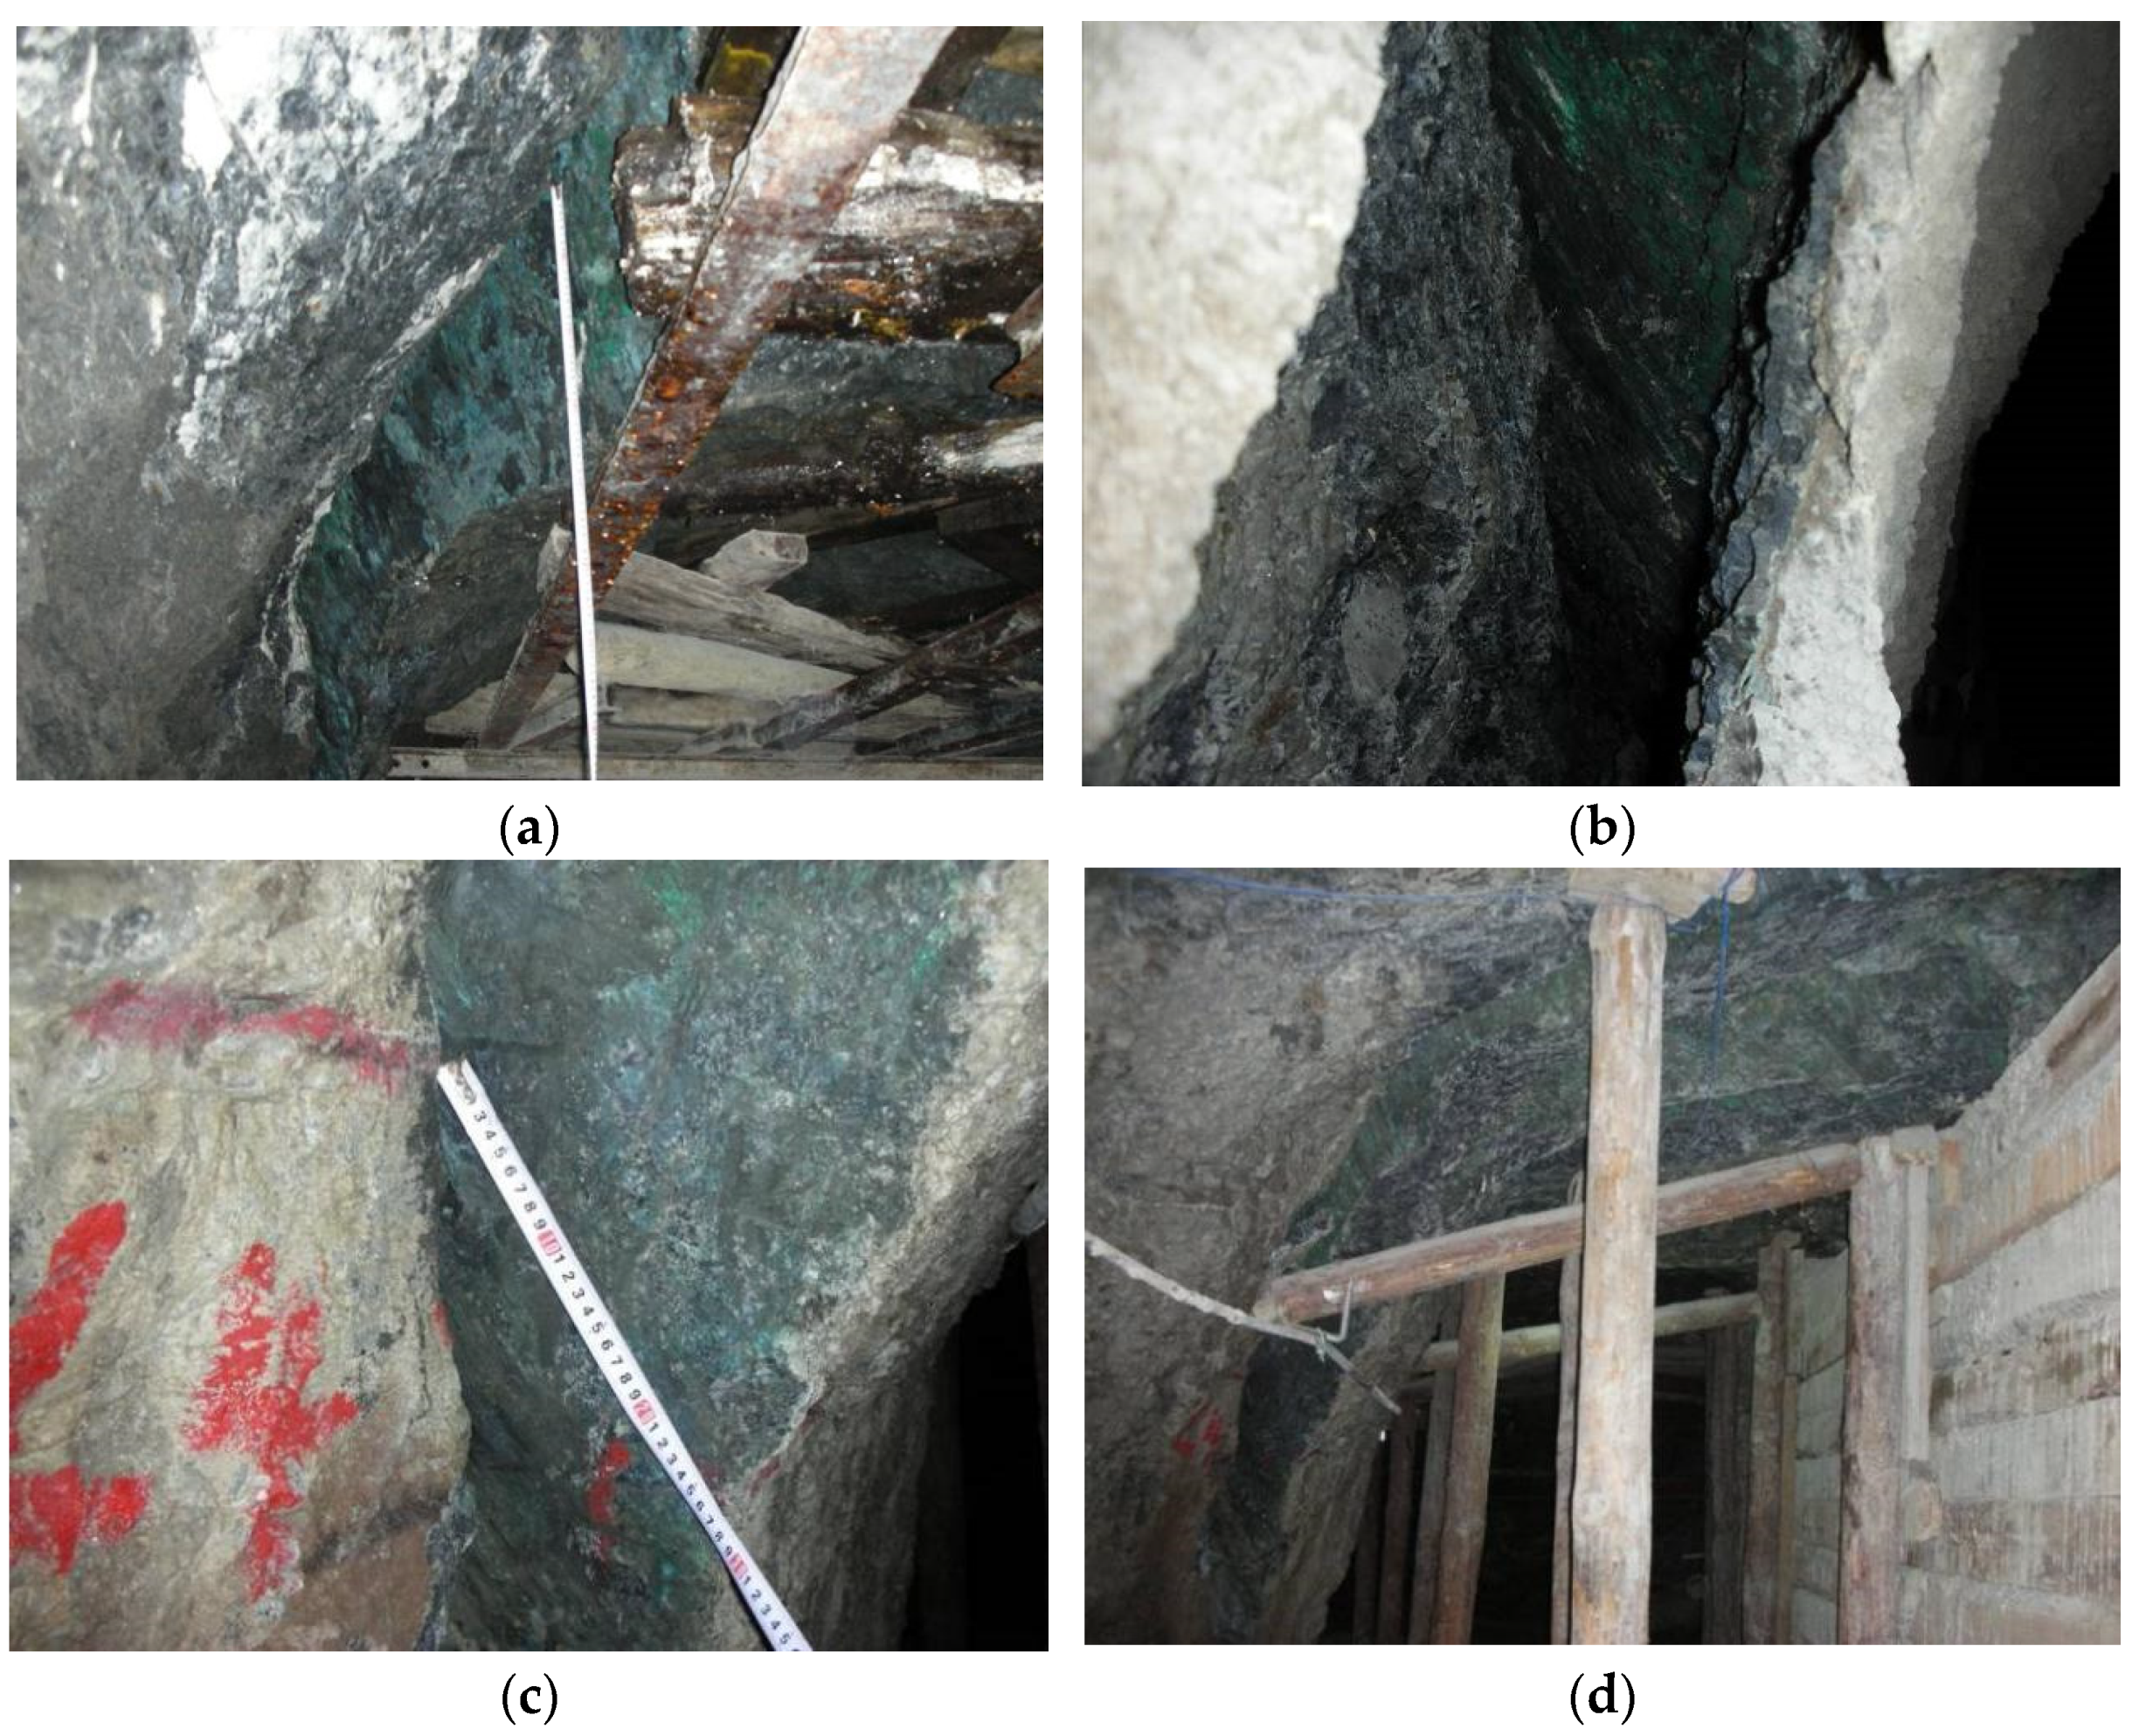
3. Field Survey of Fault Activation Slip in Mining Area
4. Design of Fault Activation Slip Monitoring System
4.1. Monitoring Content
4.2. Monitoring Method
4.2.1. Monitoring Method of Fault Displacement Change
- (1)
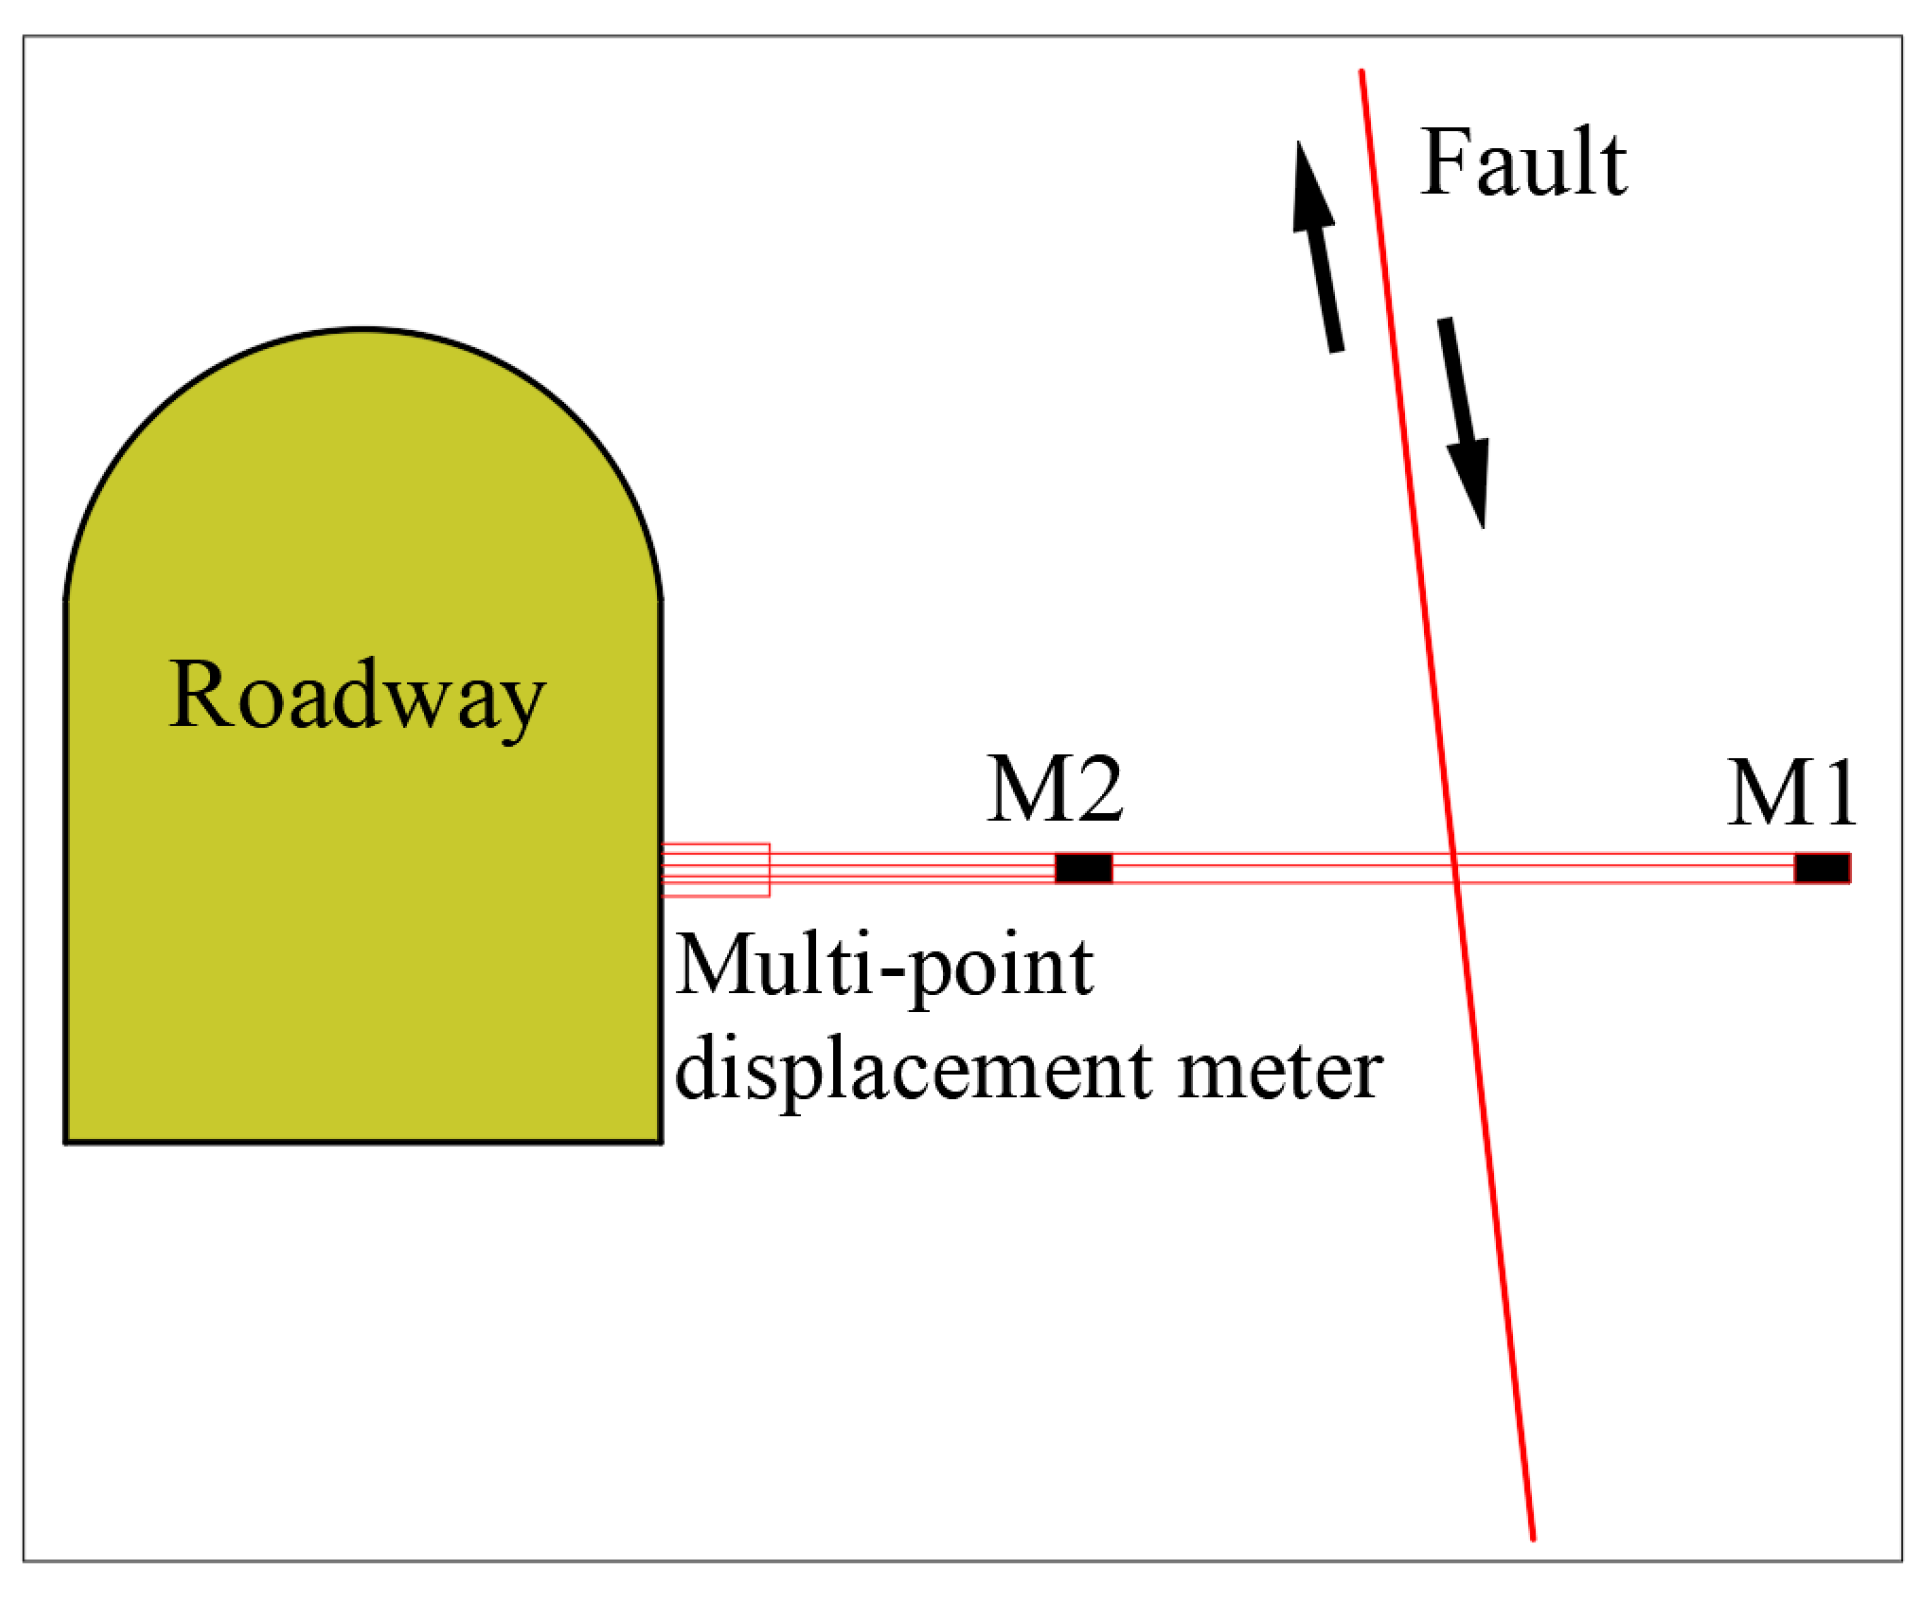
- Multipoint displacement monitoring method
- (2)
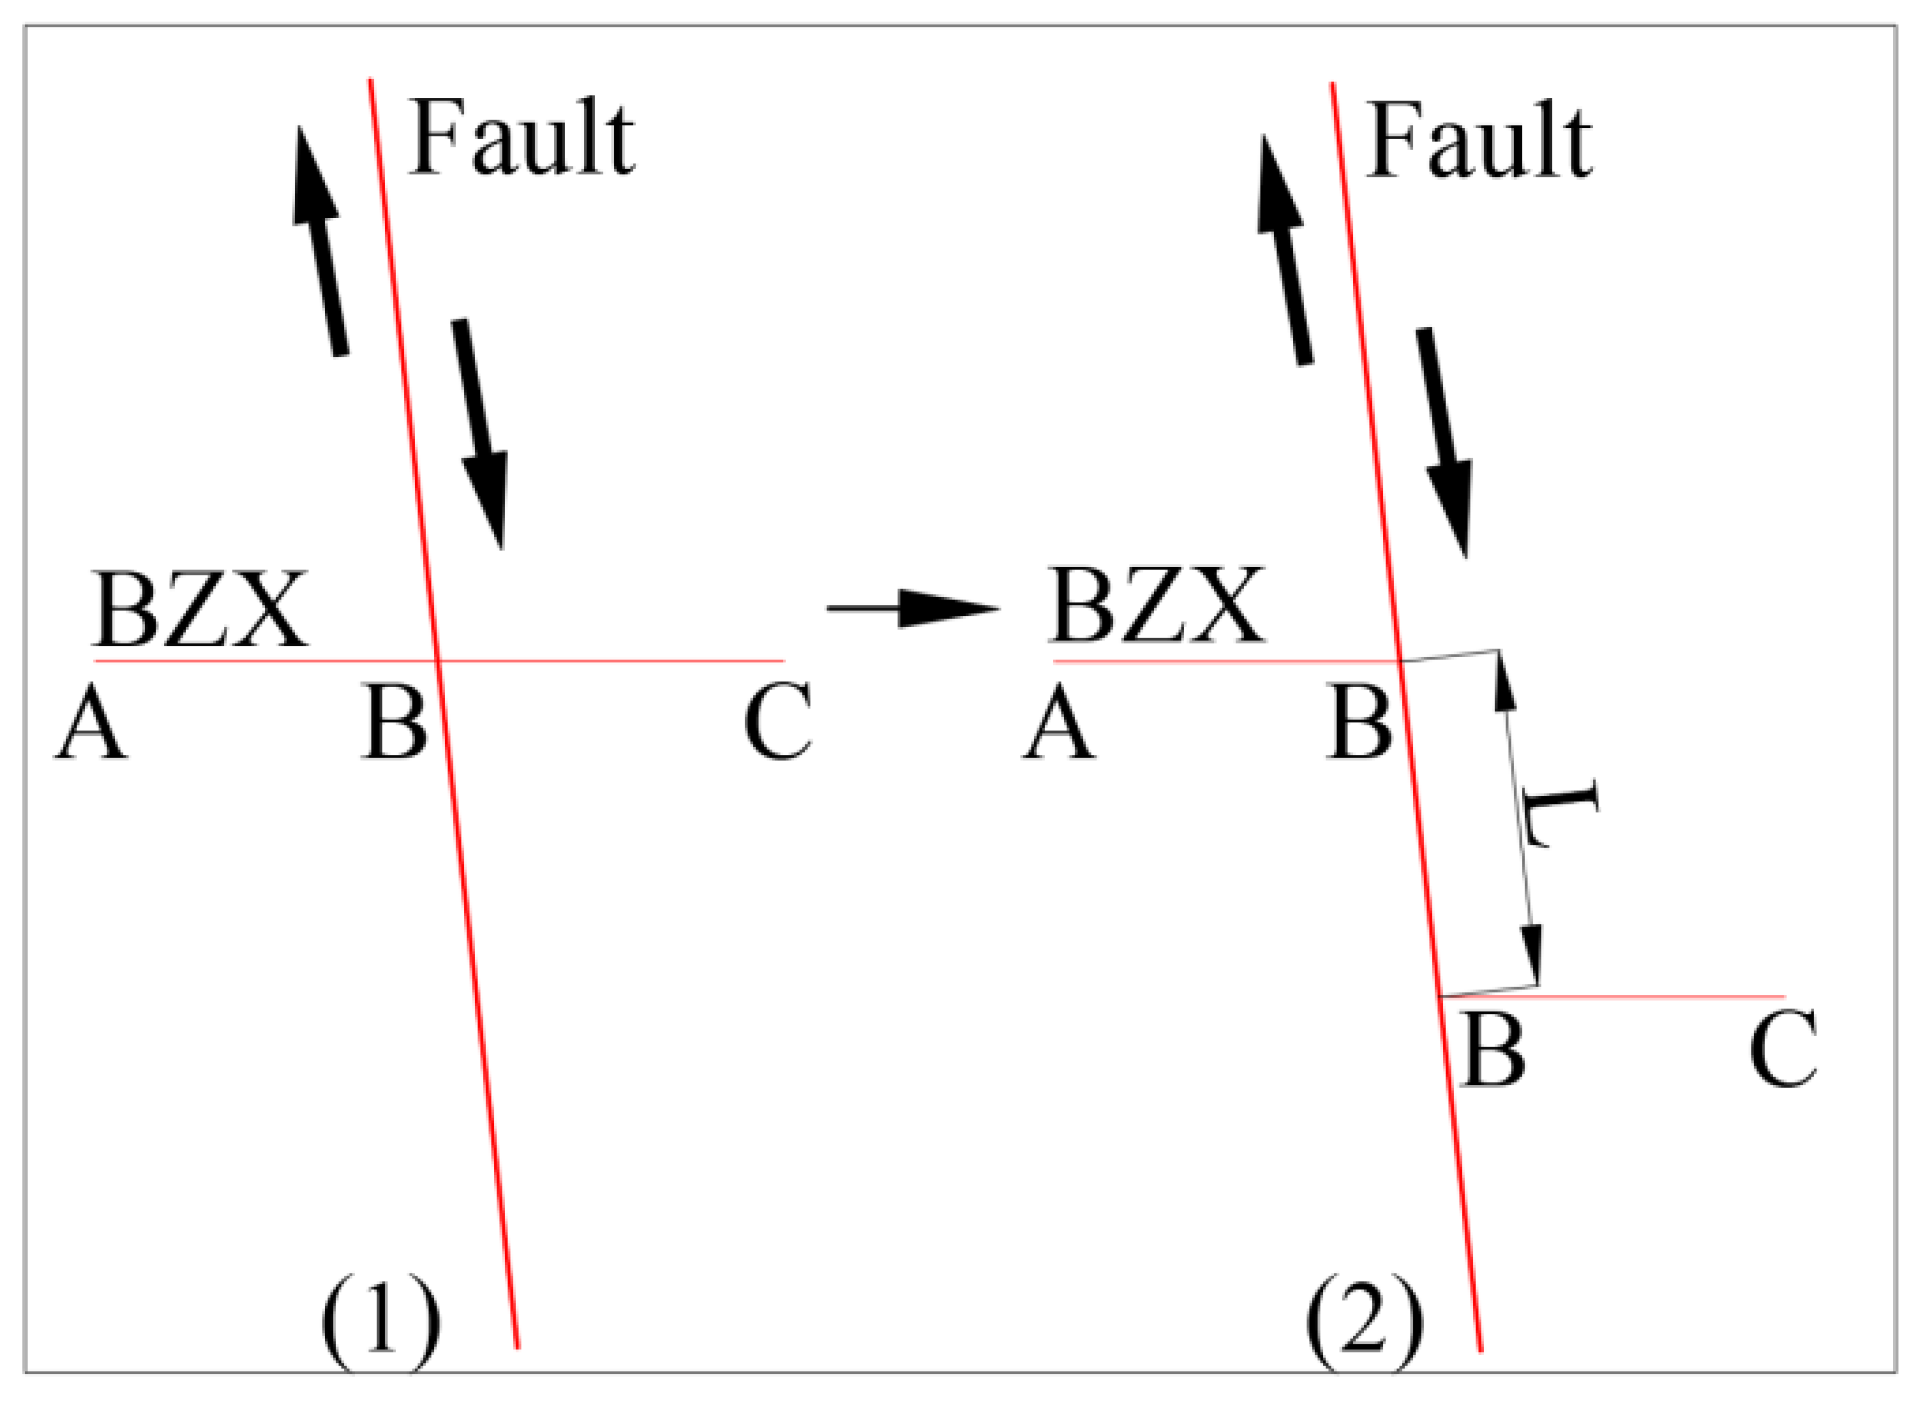
- Mark line observation method
4.2.2. Monitoring Method of Fault Stress State
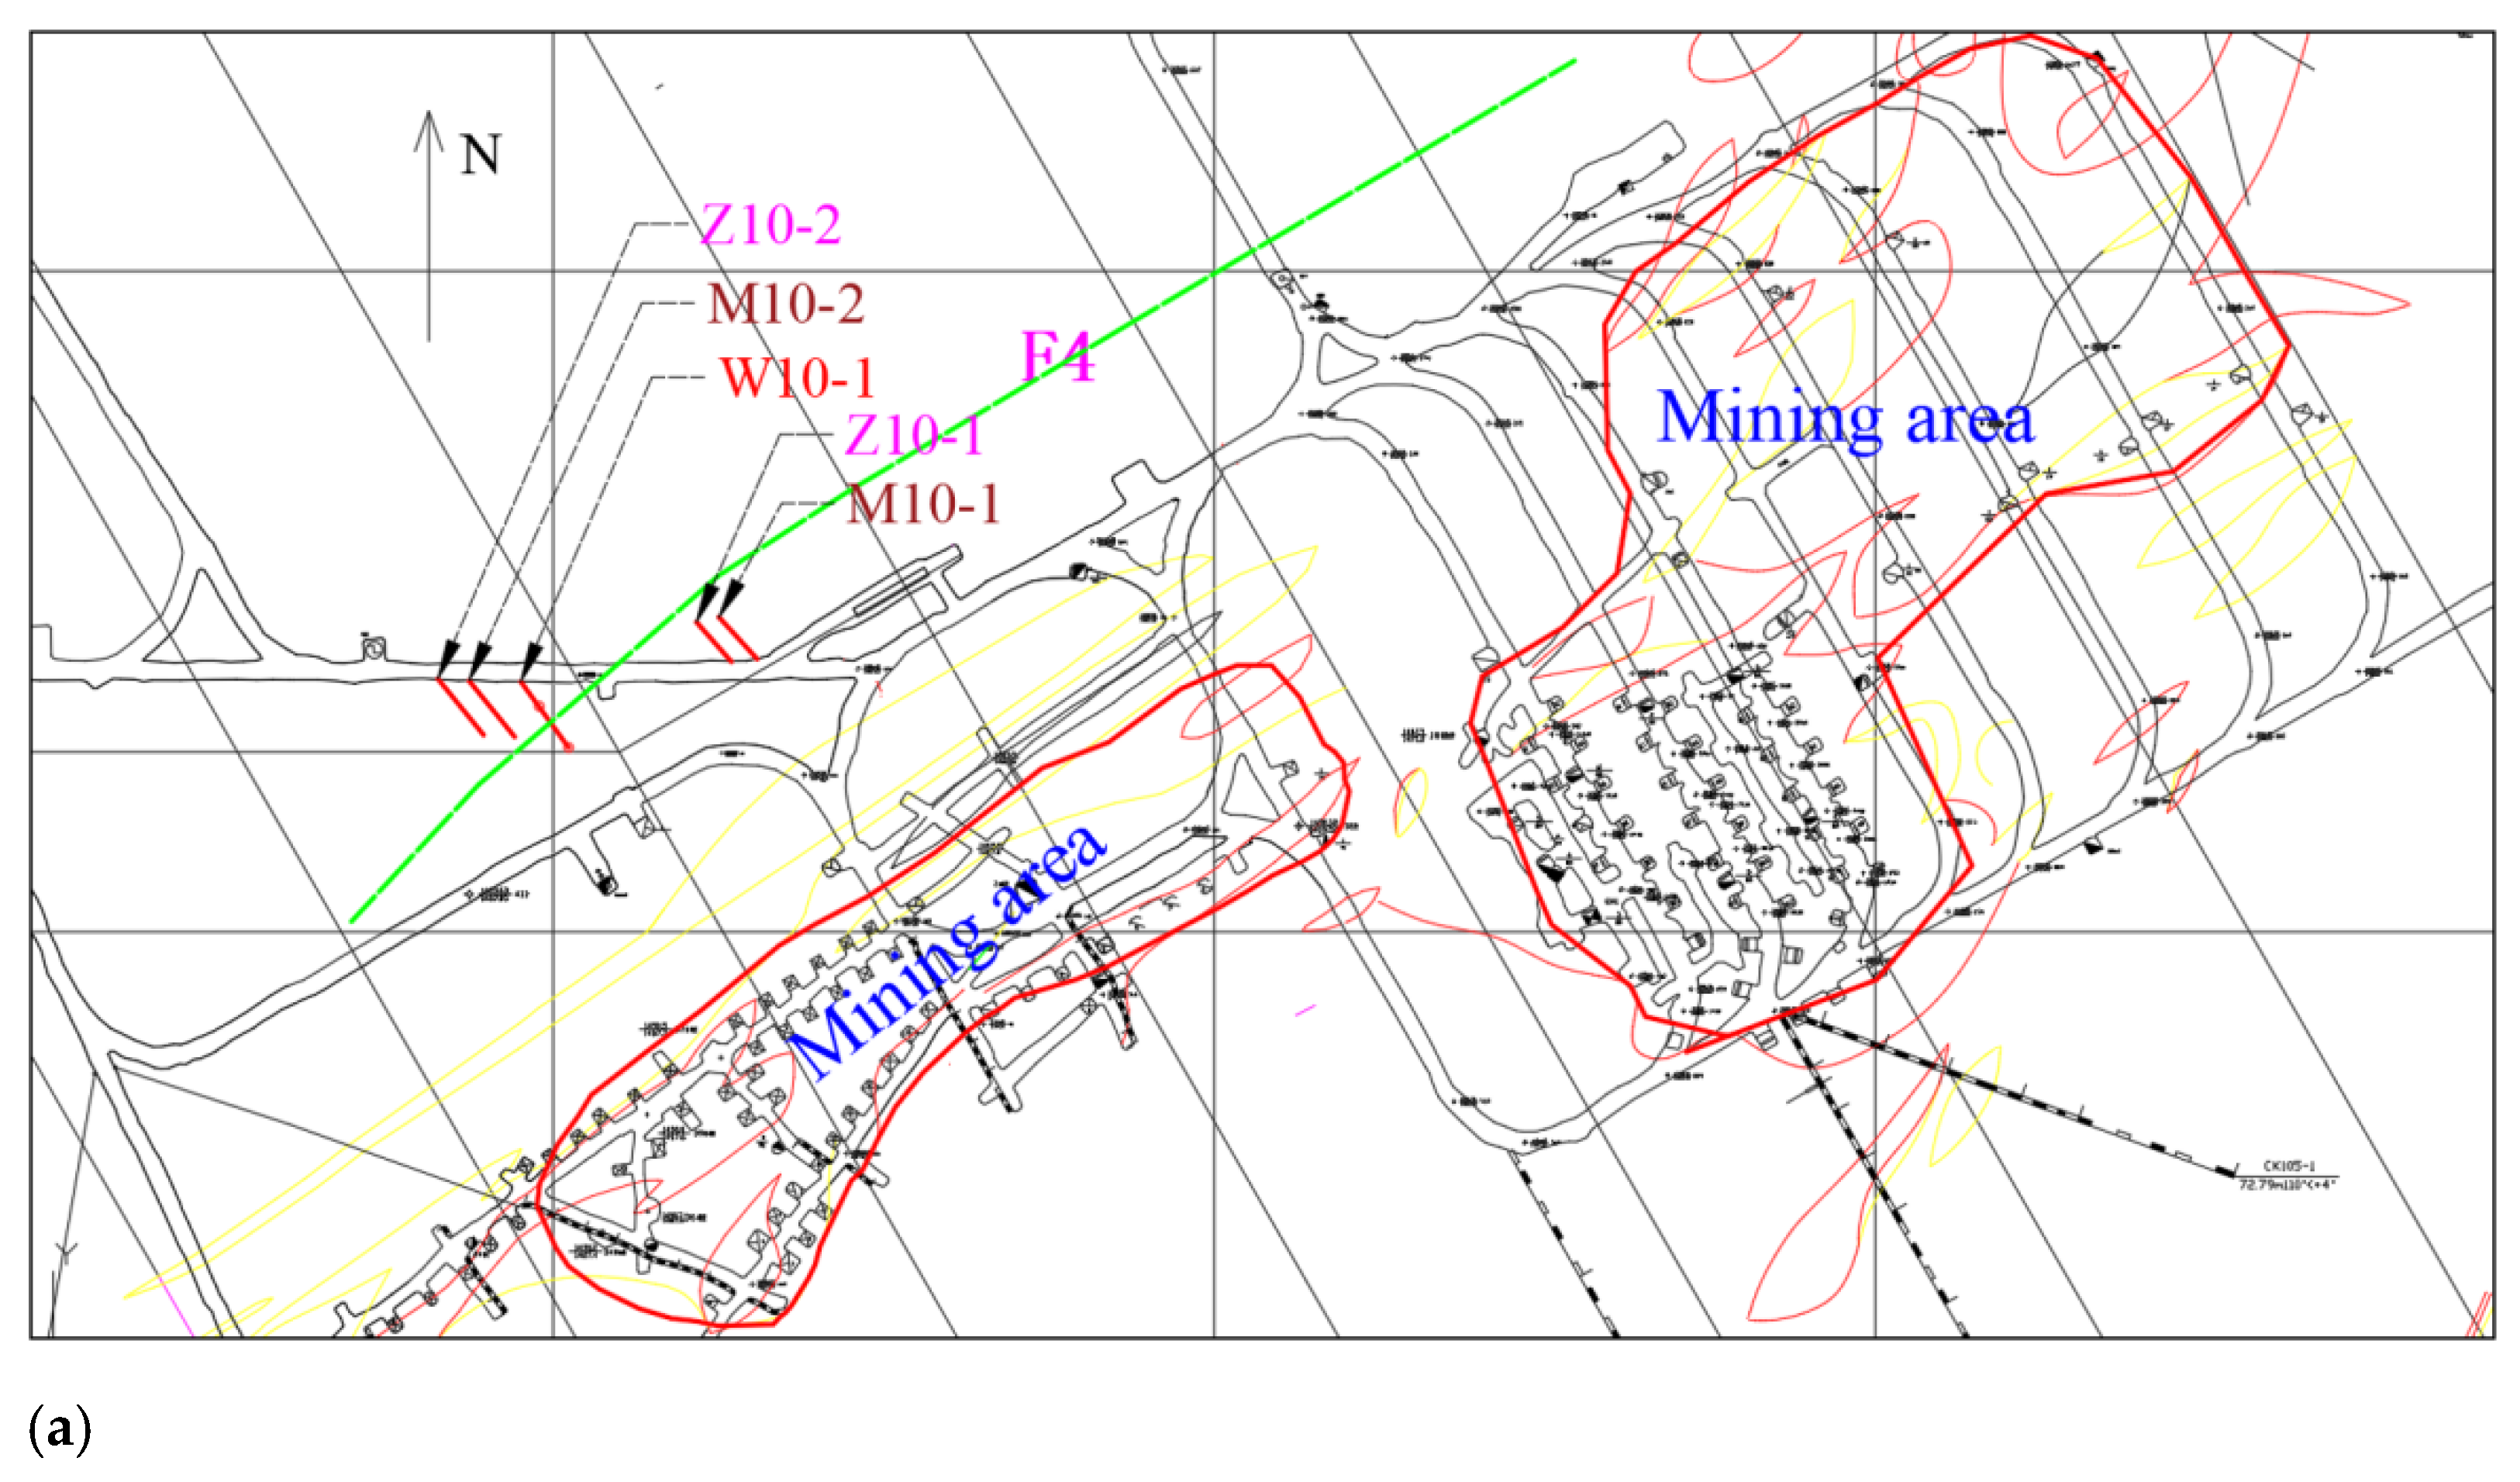
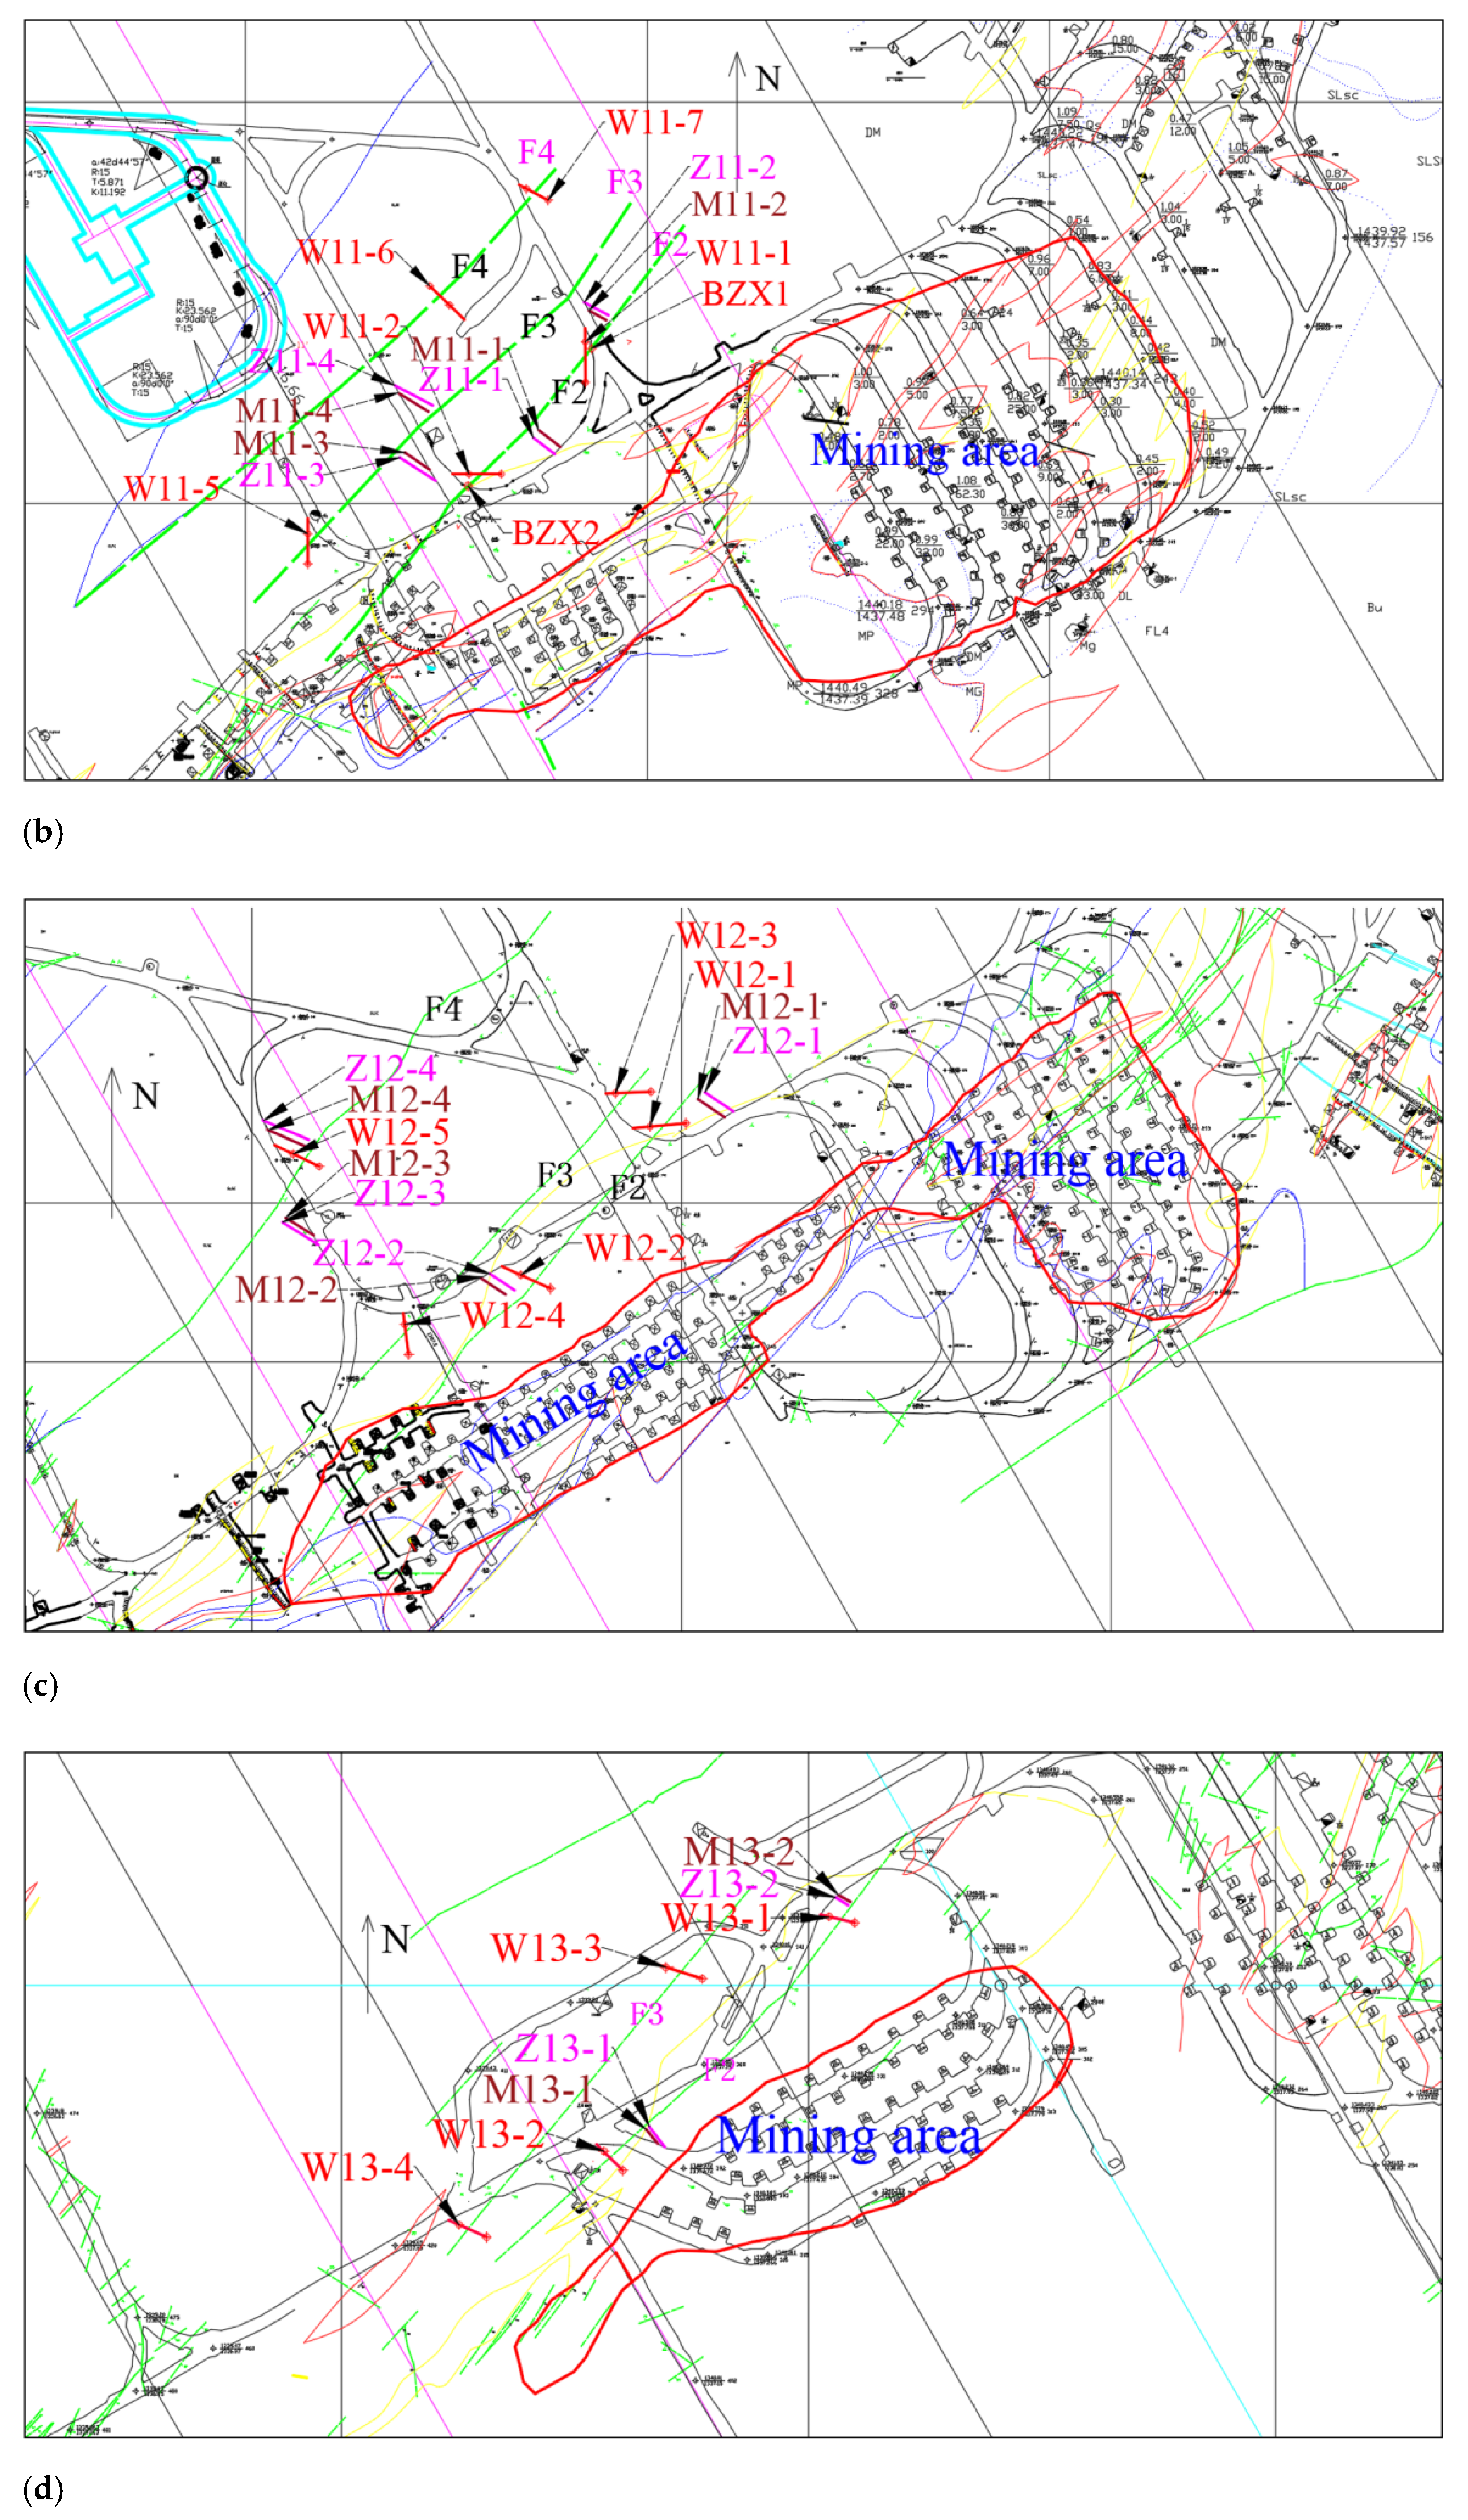
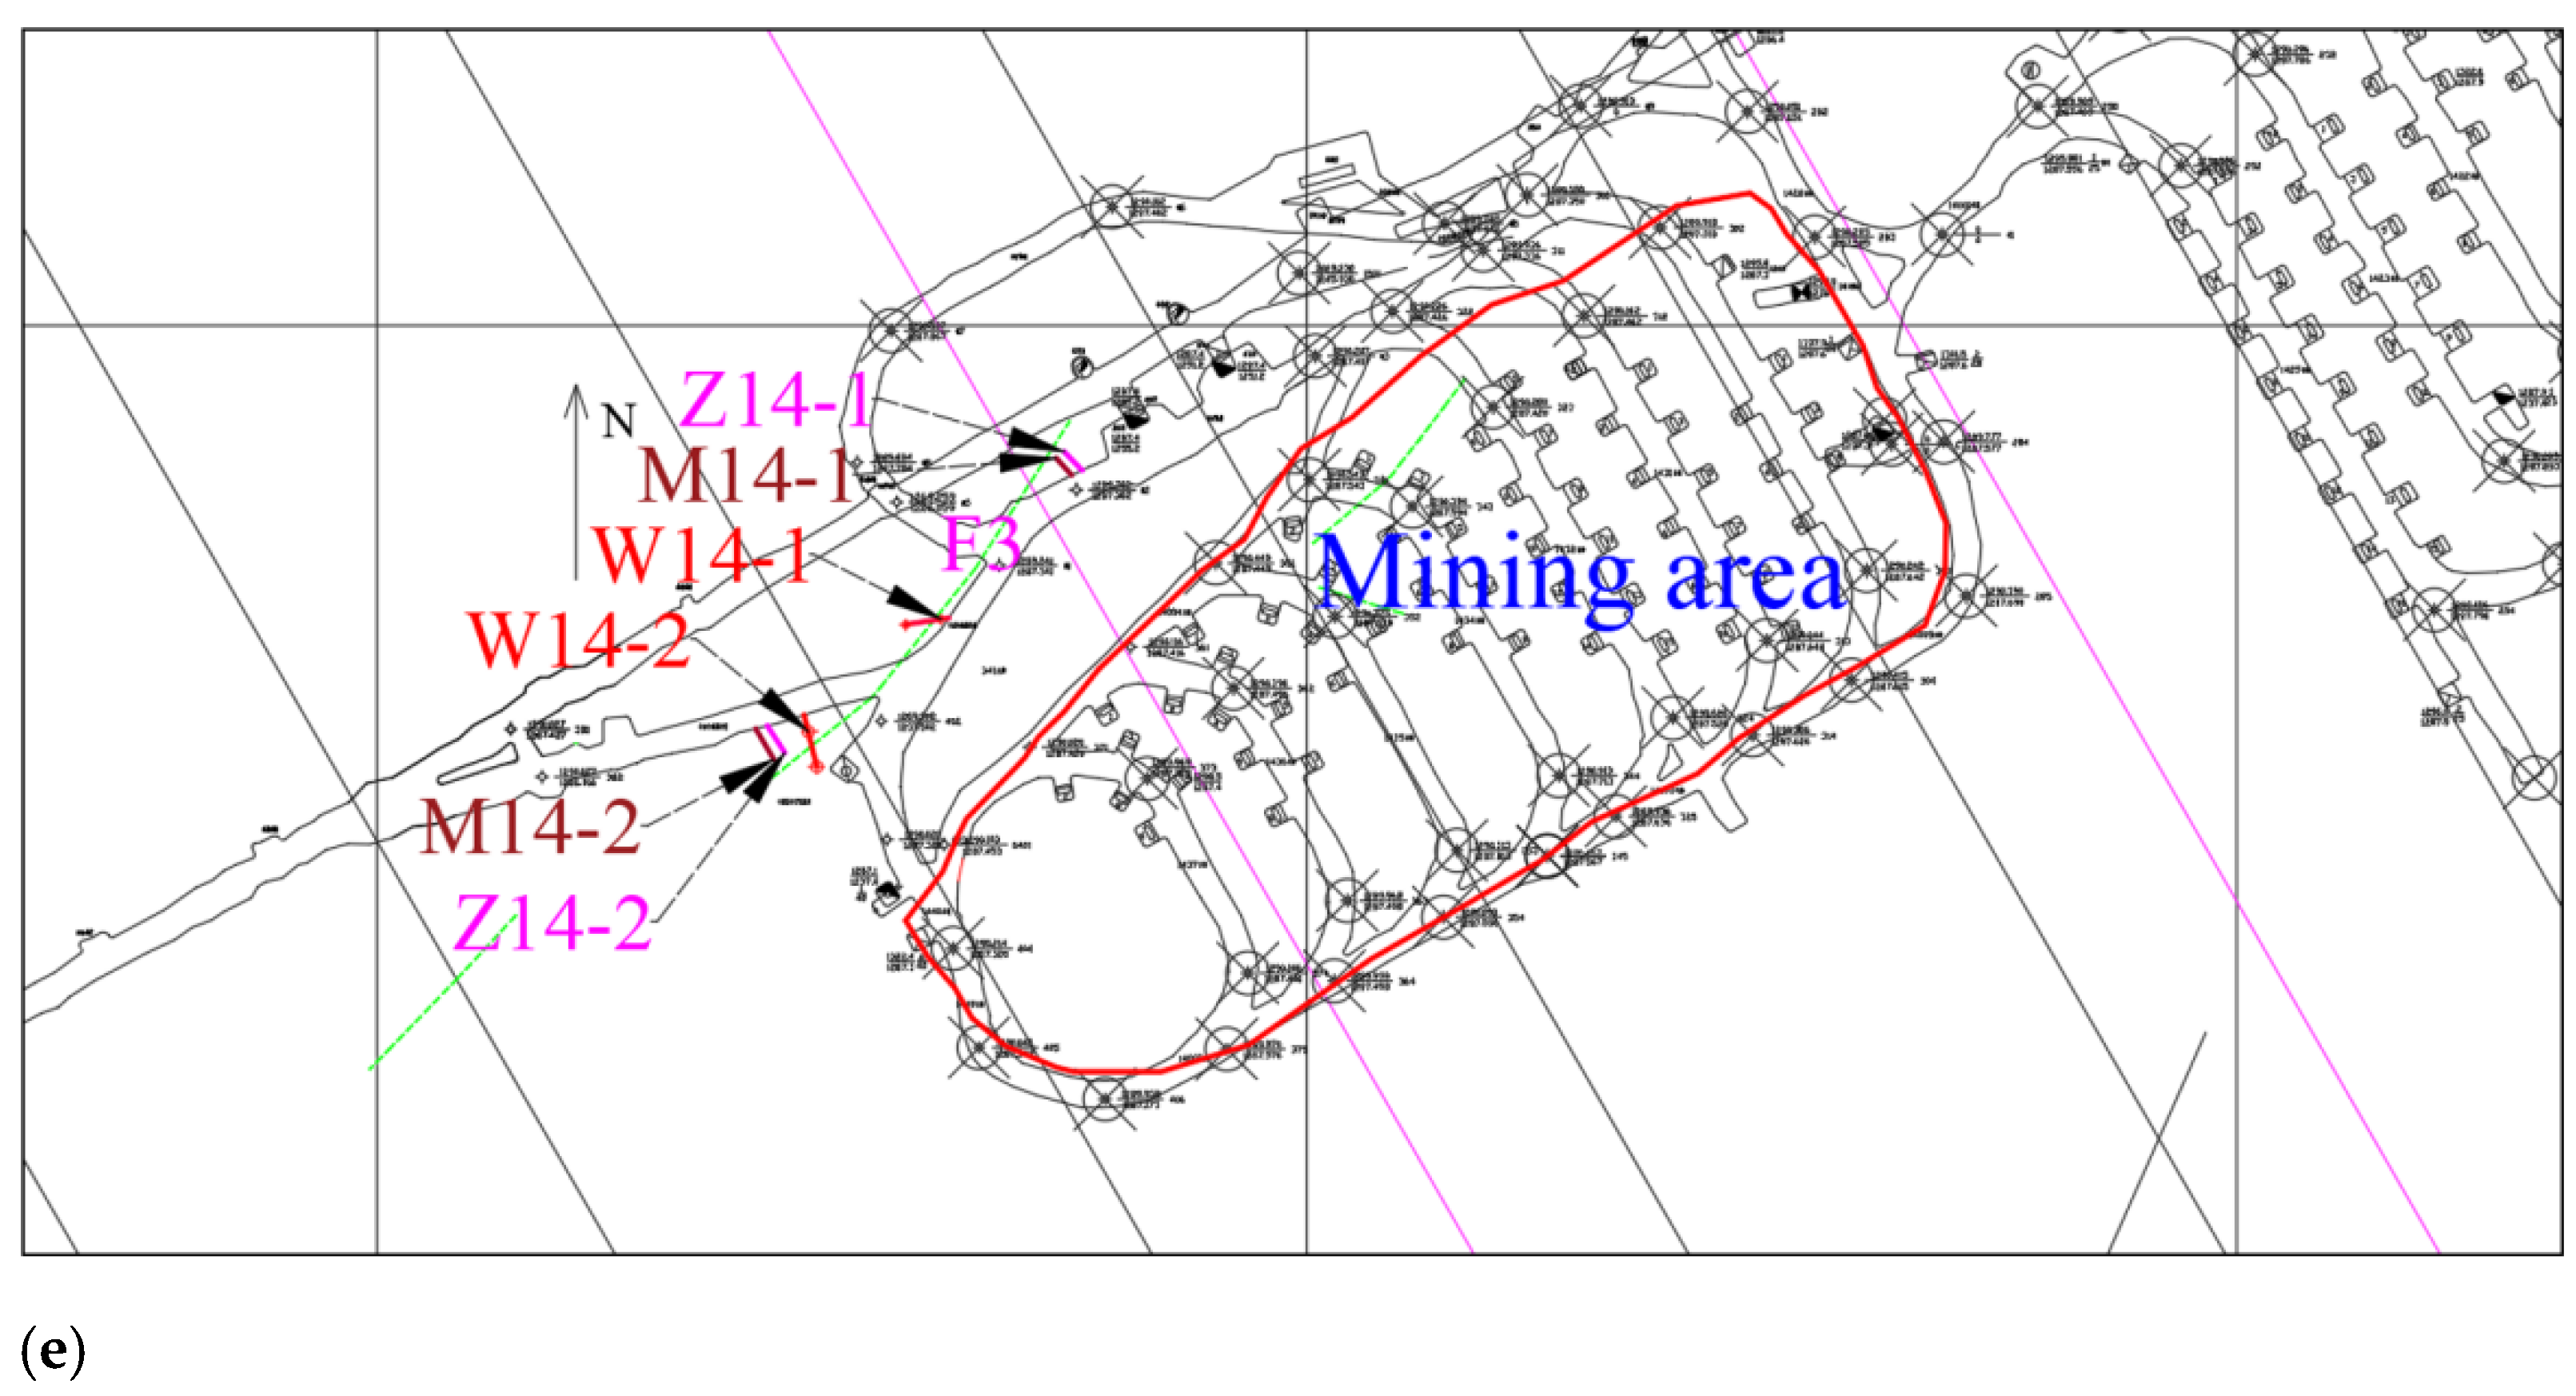
4.3. Layout of Monitoring Points
5. Monitoring and Activation Law Analysis of the Fault Activation Slip
5.1. Displacement Analysis
5.1.1. Calculation Formula of Multipoint Displacement Meter
5.1.2. Analysis of Displacement Monitoring Data
- (1)
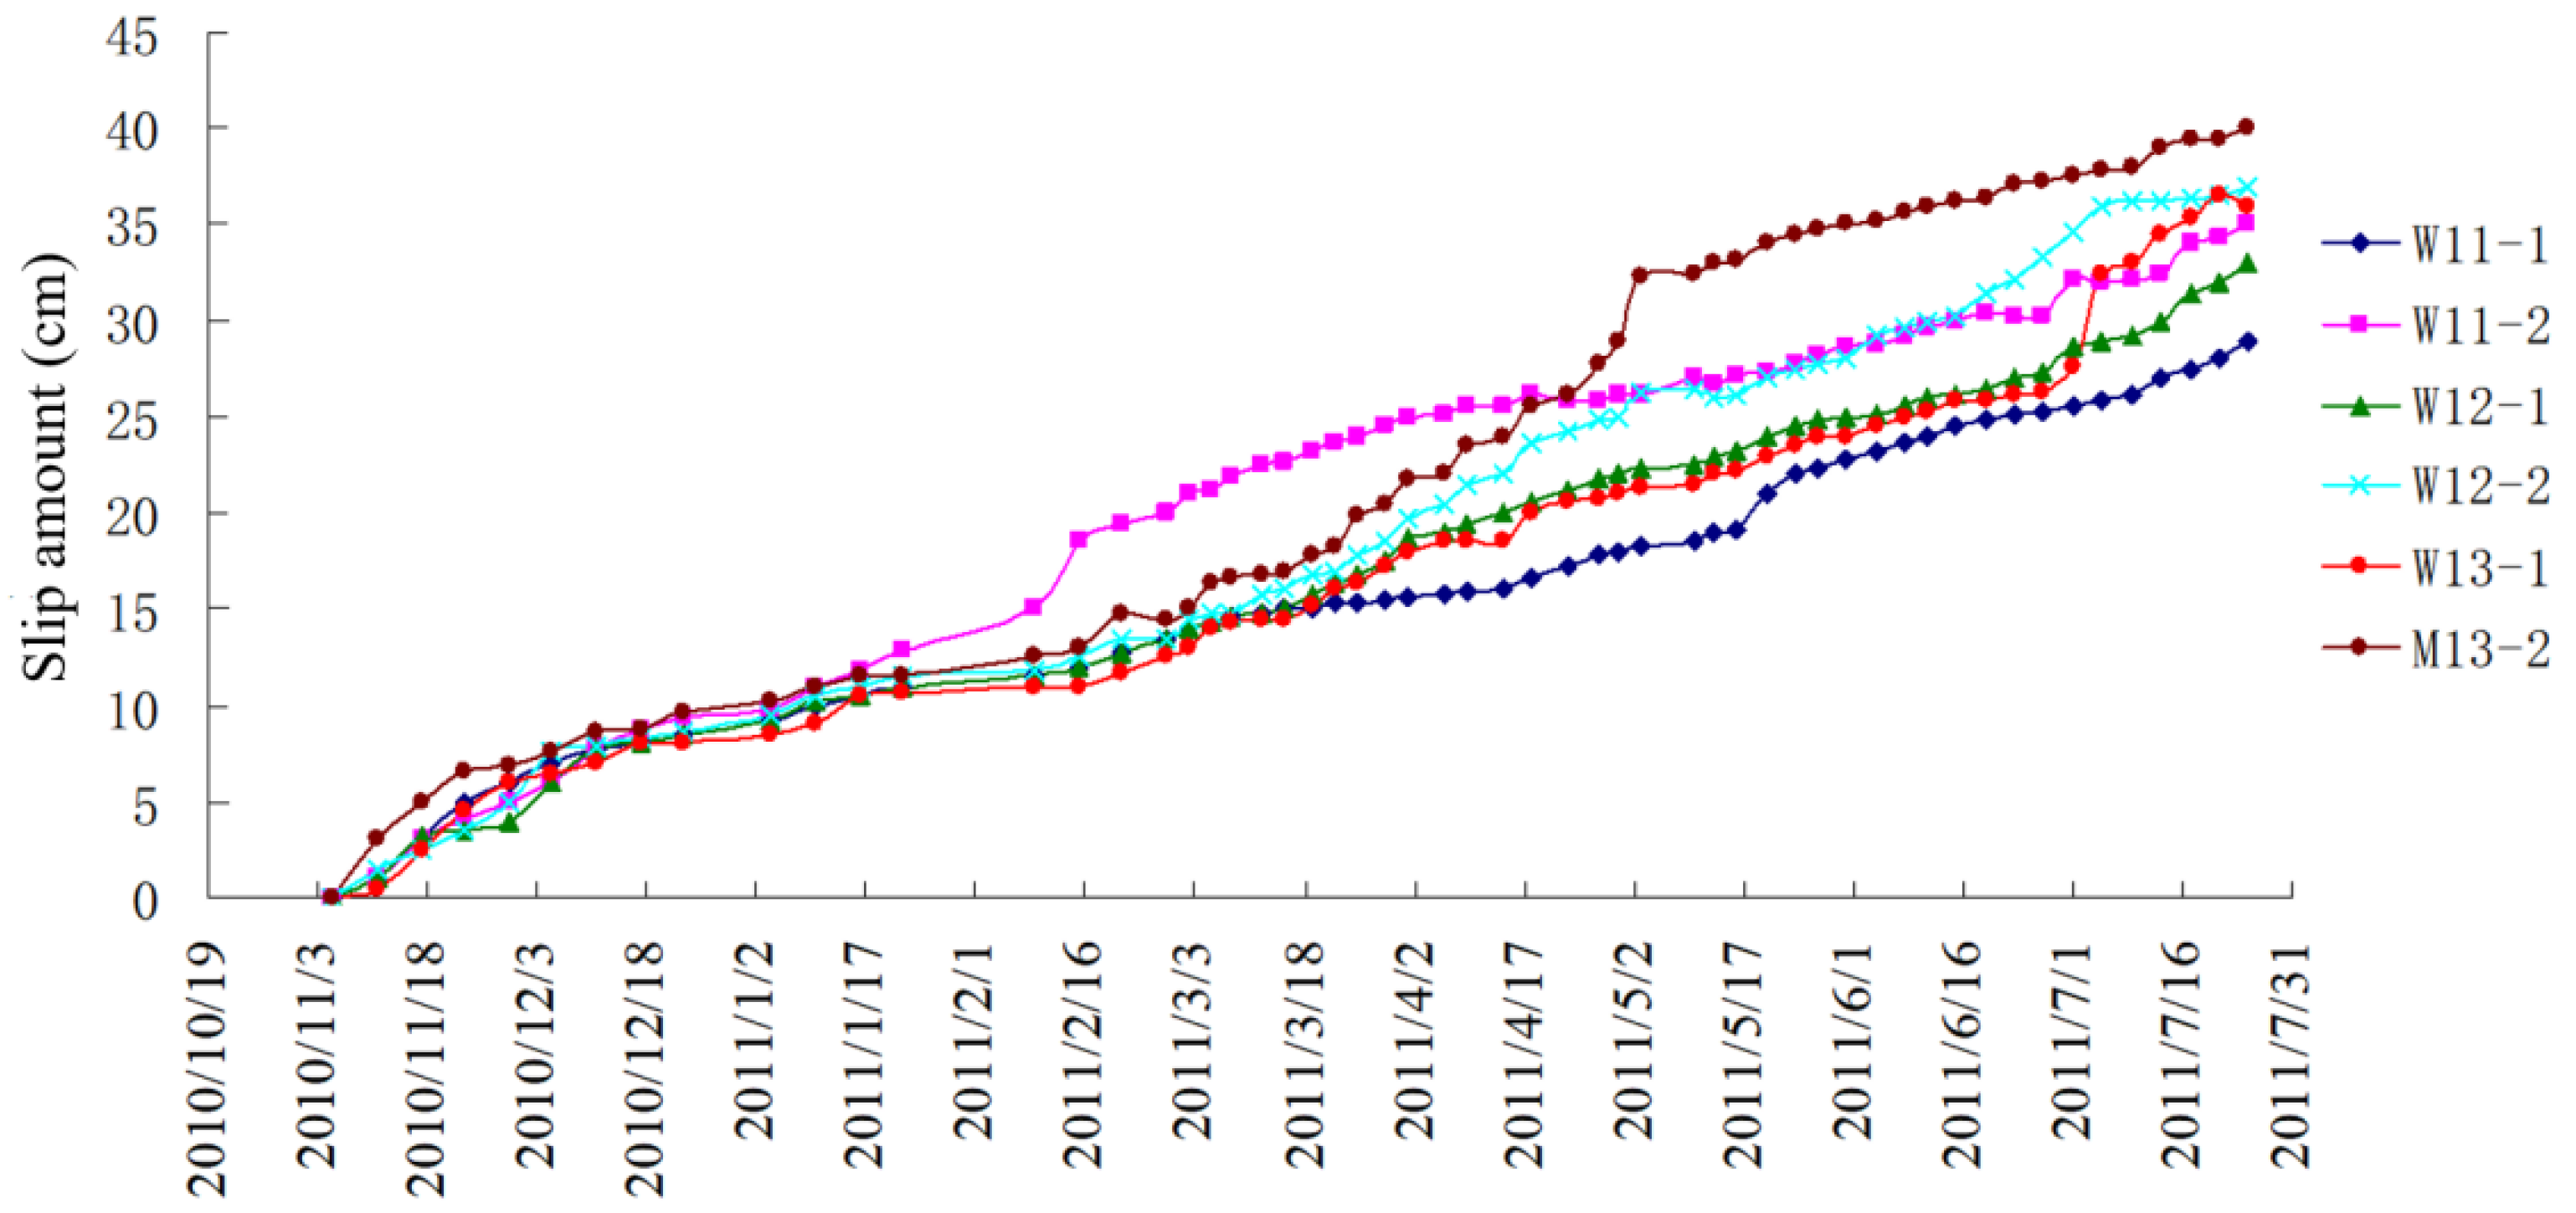
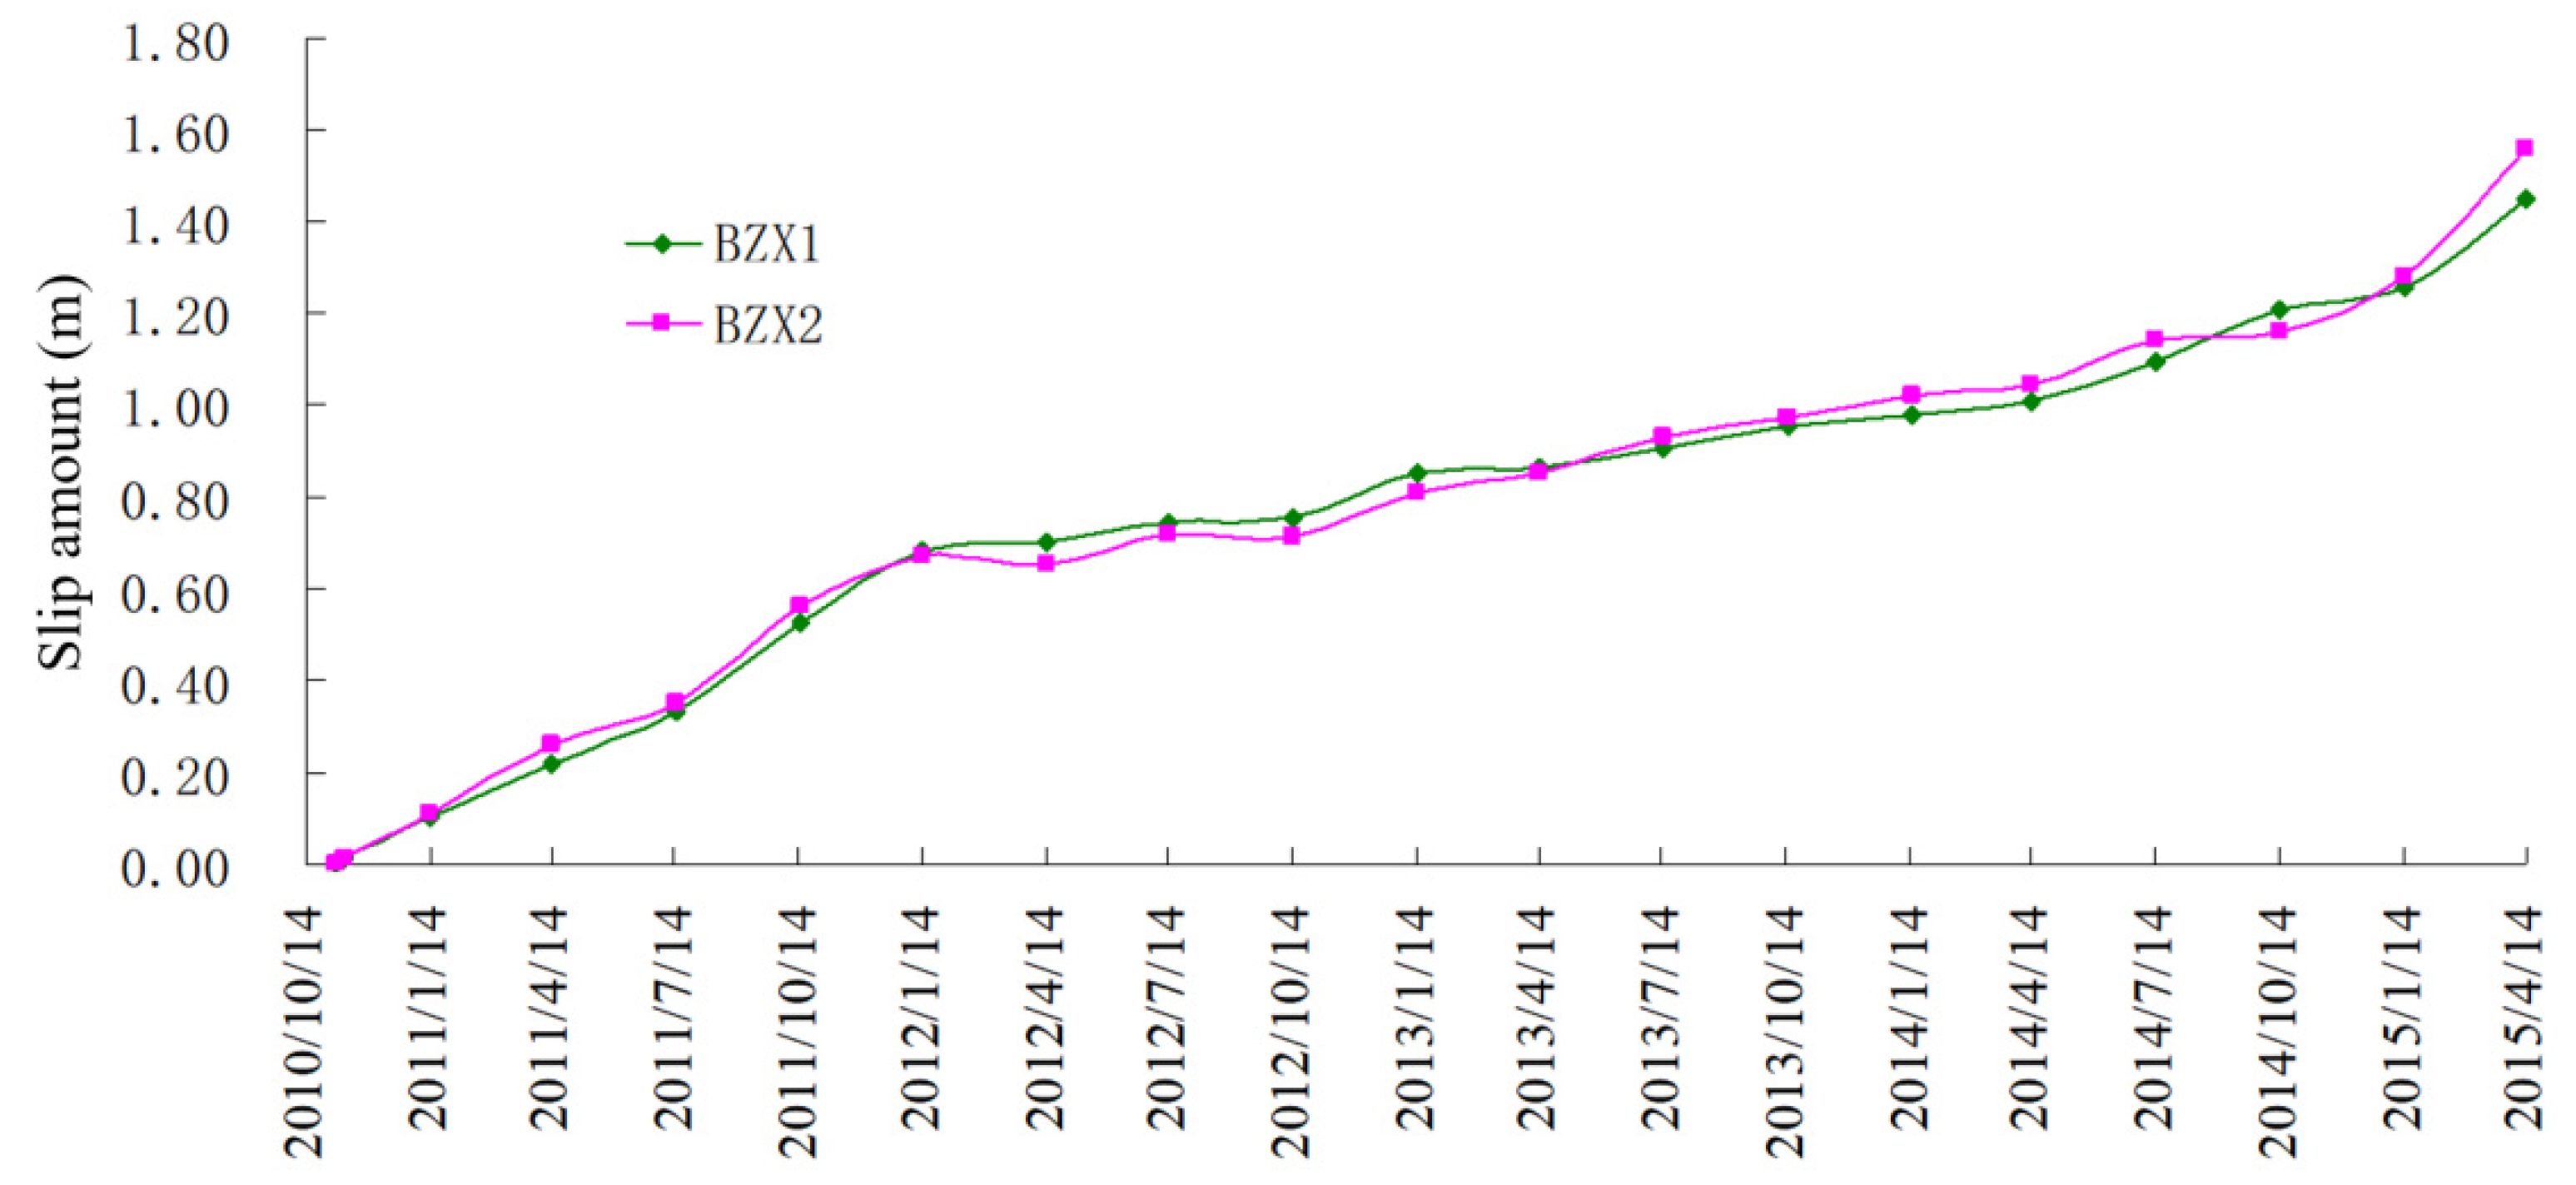
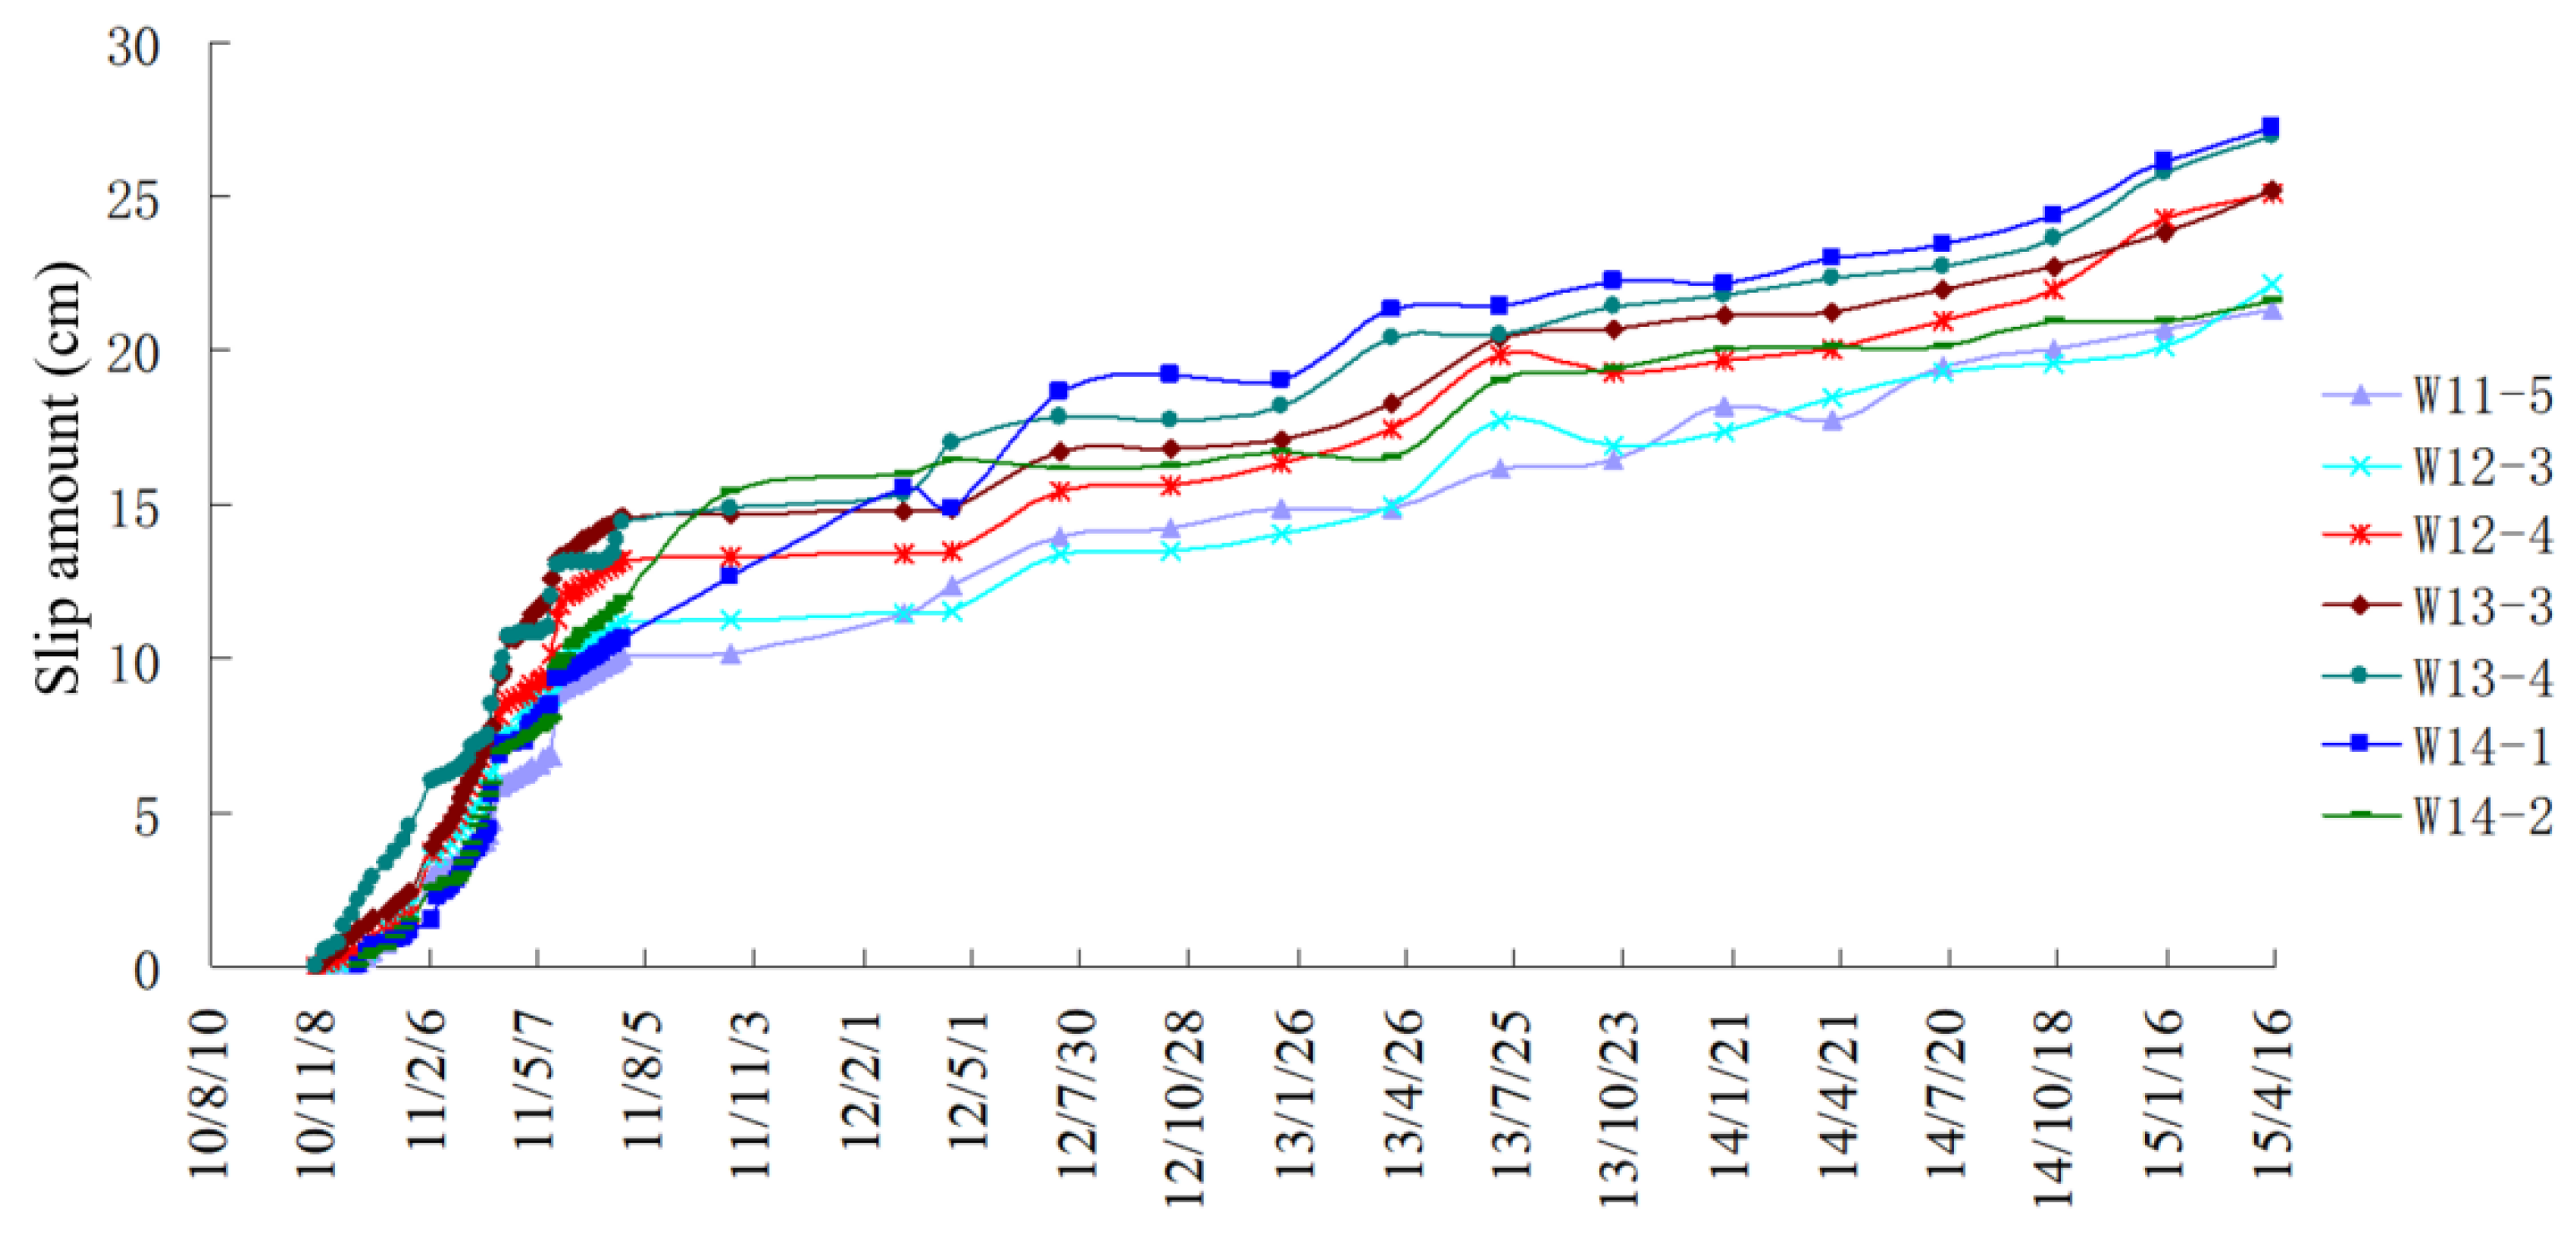
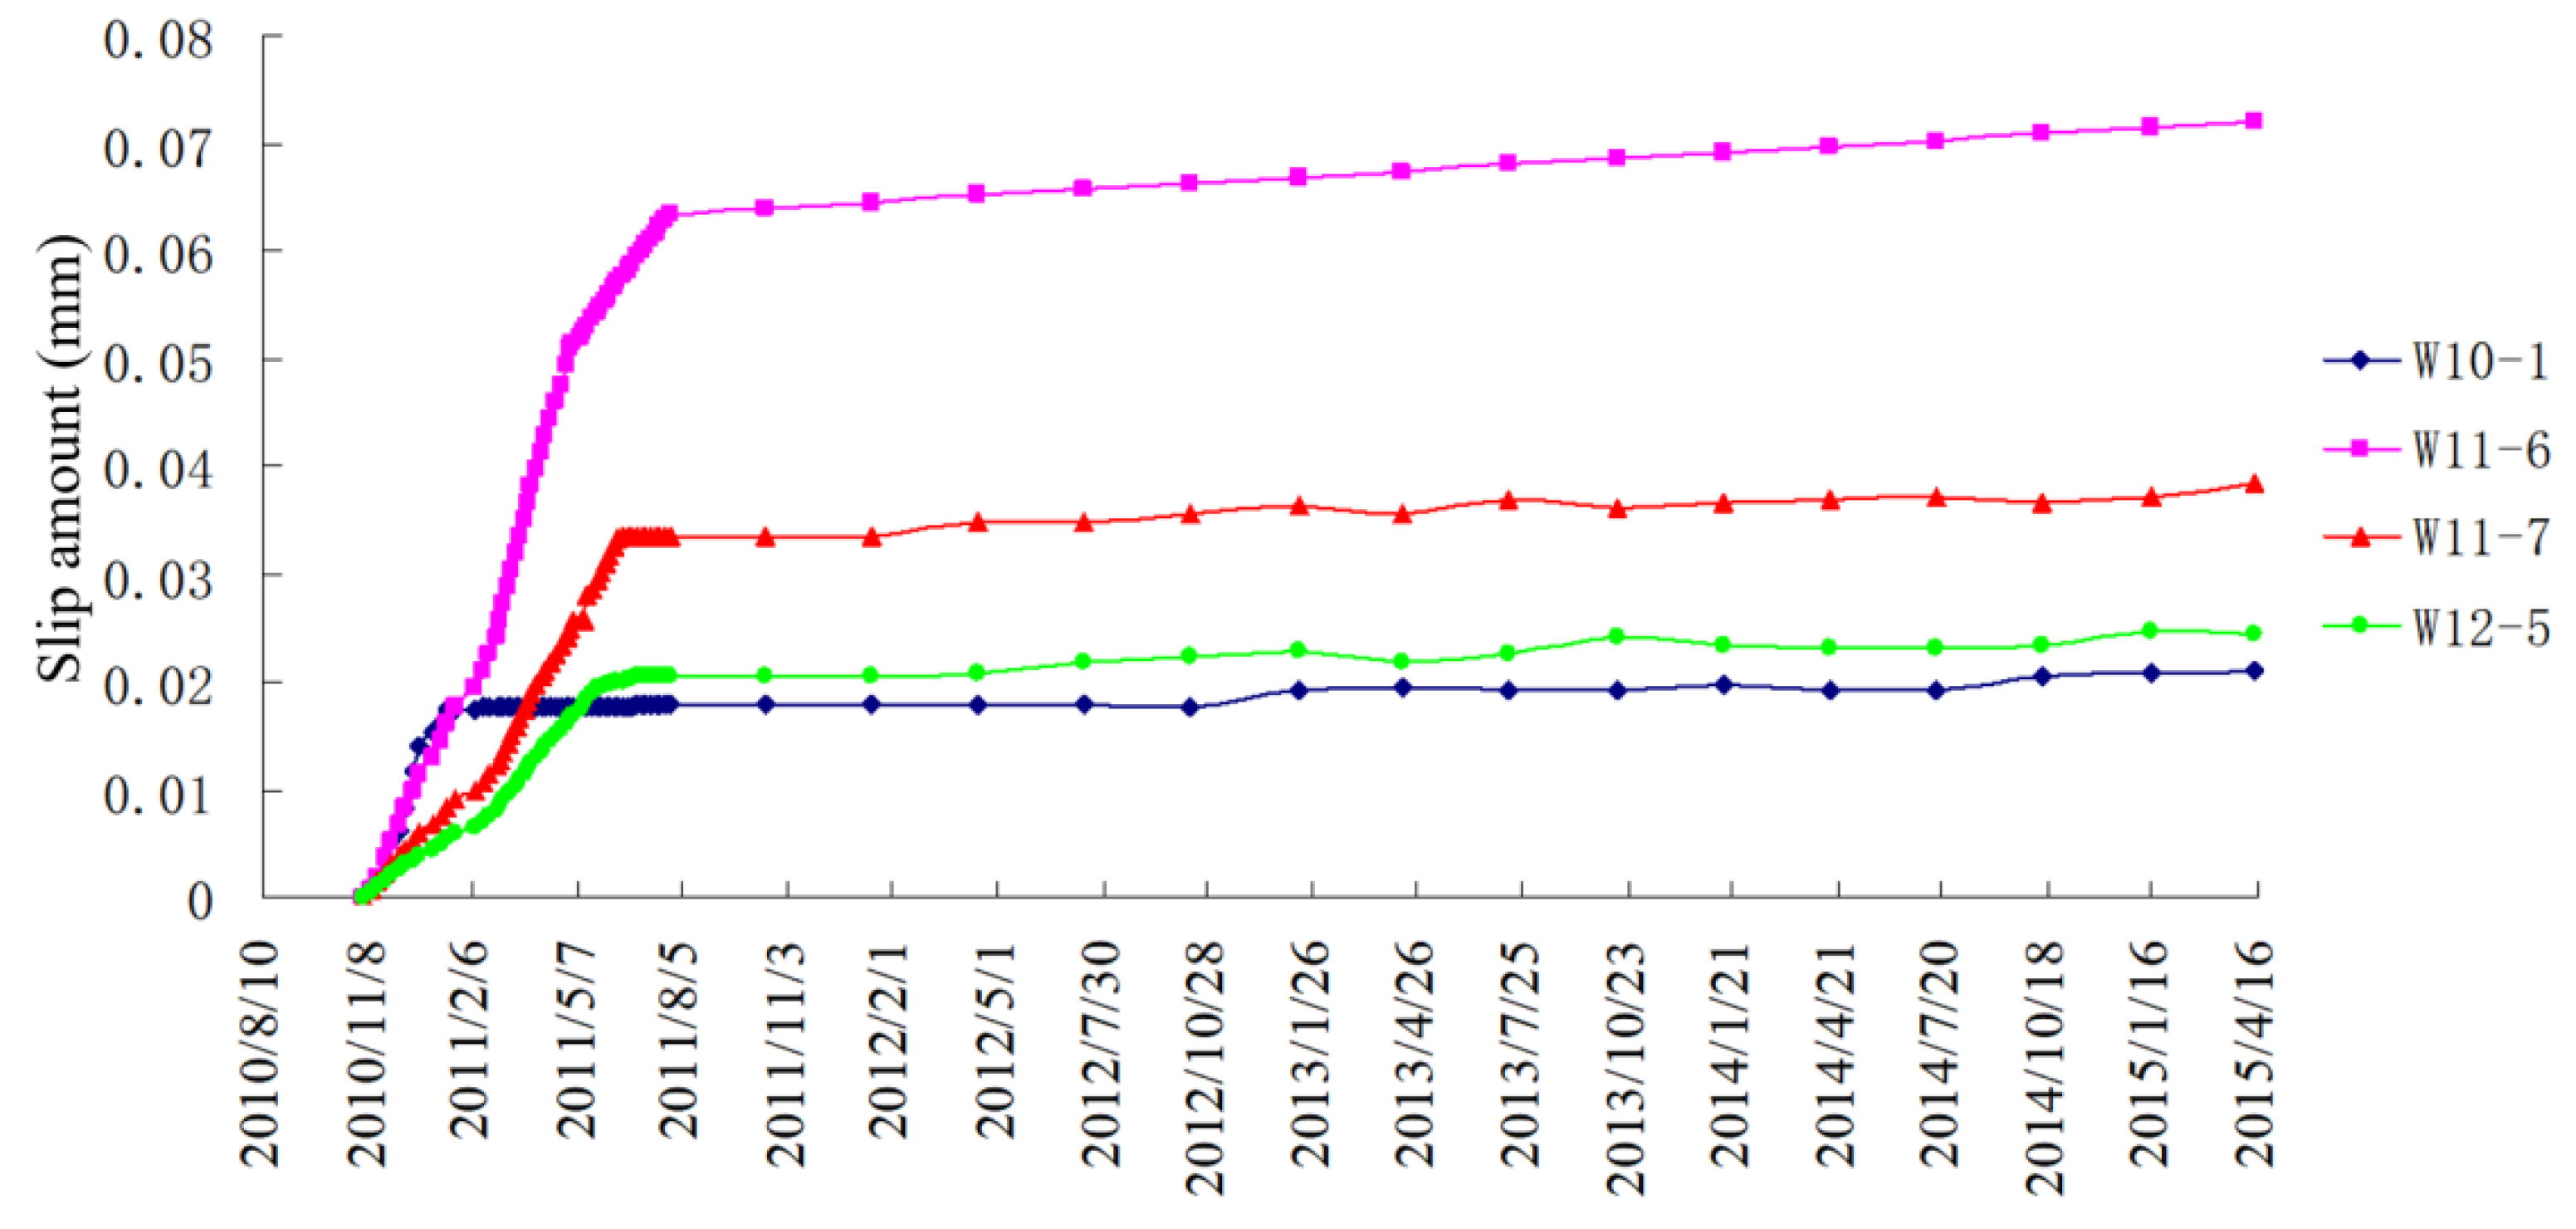
- As of 25 July 2011, the cumulative displacement of each measuring point for monitoring fault F2 is: W11-1 is 291.2 mm, W11-2 is 332.3 mm, W12-1 is 350.4 mm, W12-2 is 374.1 mm, W13-1 is 385.3 mm, and W13-2 is 400.5 mm. During the monitoring period, the average cumulative movement of fault F2 is 355.6 mm, and the average movement rate is 1.36 mm/d. As of 14 April 2015, the fault F2 mark line monitoring, cumulative fault slip of measuring point BZX1 is 1.45 m, and the cumulative fault slip of measuring point BZX2 is 1.56 m. The cumulative slip of each measuring point of fault F3 is: W11-5 is 21.33 cm, W12-3 is 22.13 cm, W12-4 is 25.16 cm, W13-3 is 25.188 cm, W13-4 is 27.00 cm, W14-1 is 27.26 cm, and W14-2 is 27.27 cm. The displacement values of each measuring point used for monitoring fault F4 are as follows: W10-1 is 0.021 mm, W11-6 is 0.024 mm, W11-7 is 0.038 mm, and W12-5 is 0.072 mm.
- (2)
- From the trend of the slip–time curves of the three faults, the moving rate of fault F2 is relatively large. After the fault activation under the influence of deep mining, the cumulative slip is the largest, reaching 1.56 m. Fault F3 has also activated and slipped under the influence of mining, and the cumulative displacement of the measuring point with a large slip is 27.27 cm. The measuring point with the largest displacement of fault F4 is W11–6, and the displacement is 0.072 mm. The displacement value is small and within the normal error range, indicating that fault F4 has not been activated.
- (3)
- According to the monitoring results, during the same monitoring time, the monitoring displacement of the multipoint displacement meter in the lower sublevel is greater than that in the upper sublevel, and the displacement of the measuring point near the goaf is greater than that far away from the goaf, indicating that the movement of the fault propagates from the bottom to the top. From nearby to far away from the goaf, the fault activation sequence is from fault F2 to fault F3, and then to fault F4. In general, for fault F2, at the same monitoring time, the displacement of the measuring point on the west side of the fault is greater than that on the east side of the fault. For example, the displacement of measuring point W11-2 is greater than that of W11-1, the displacement of measuring point W12-2 is greater than that of W12-1 and the displacement of measuring point W13-2 is greater than that of W13-1, indicating that, in the process of moving the hangingwall of fault F2 to the goaf, there is also a rotation along the right direction of the fault. The main reason is that the west side is closer to the mining area.
- (4)
- From the monitoring results, the dislocation displacement of fault F2 and fault F3 has a sudden increase during the monitoring time; it is especially obvious in the monitoring data of fault F2. Compared with the observation time of the large displacement change and stope blasting time, it can be learned that the point of time of the sudden increase in the large displacement is the large blasting time or a short time after blasting. This indicates that large underground blasting has a certain influence on fault activation dislocation.
5.2. Stress Analysis
5.2.1. Analysis of Monitoring Results of the Bolt Stress Meter
- (1)
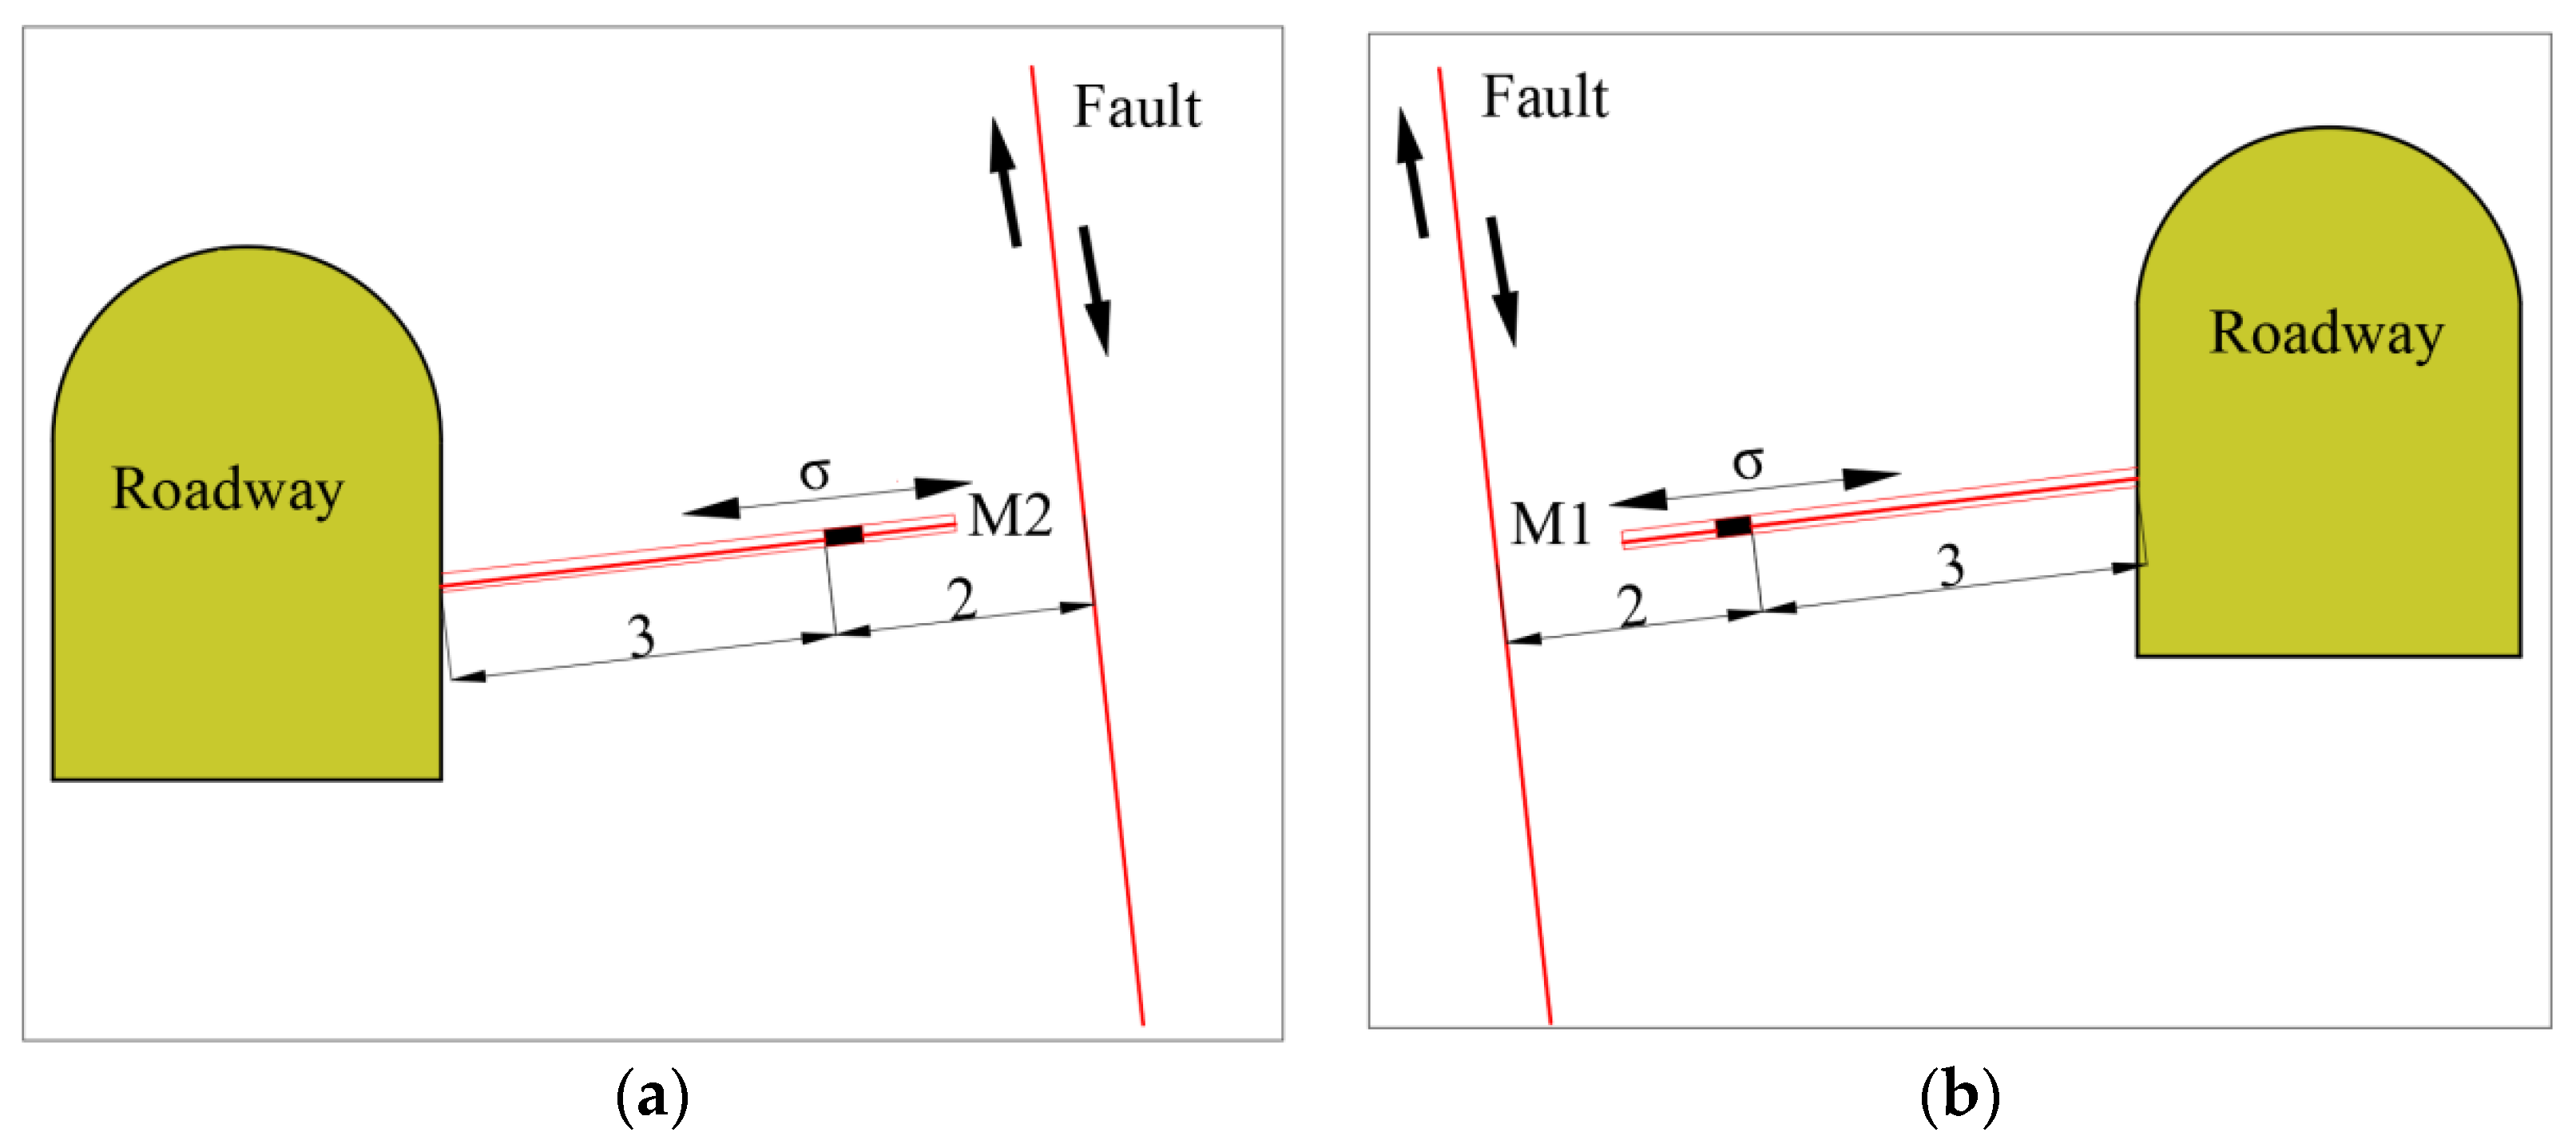
- Computing formula
- (2)
- Analysis of monitoring results of the bolt stress meter
- (1)
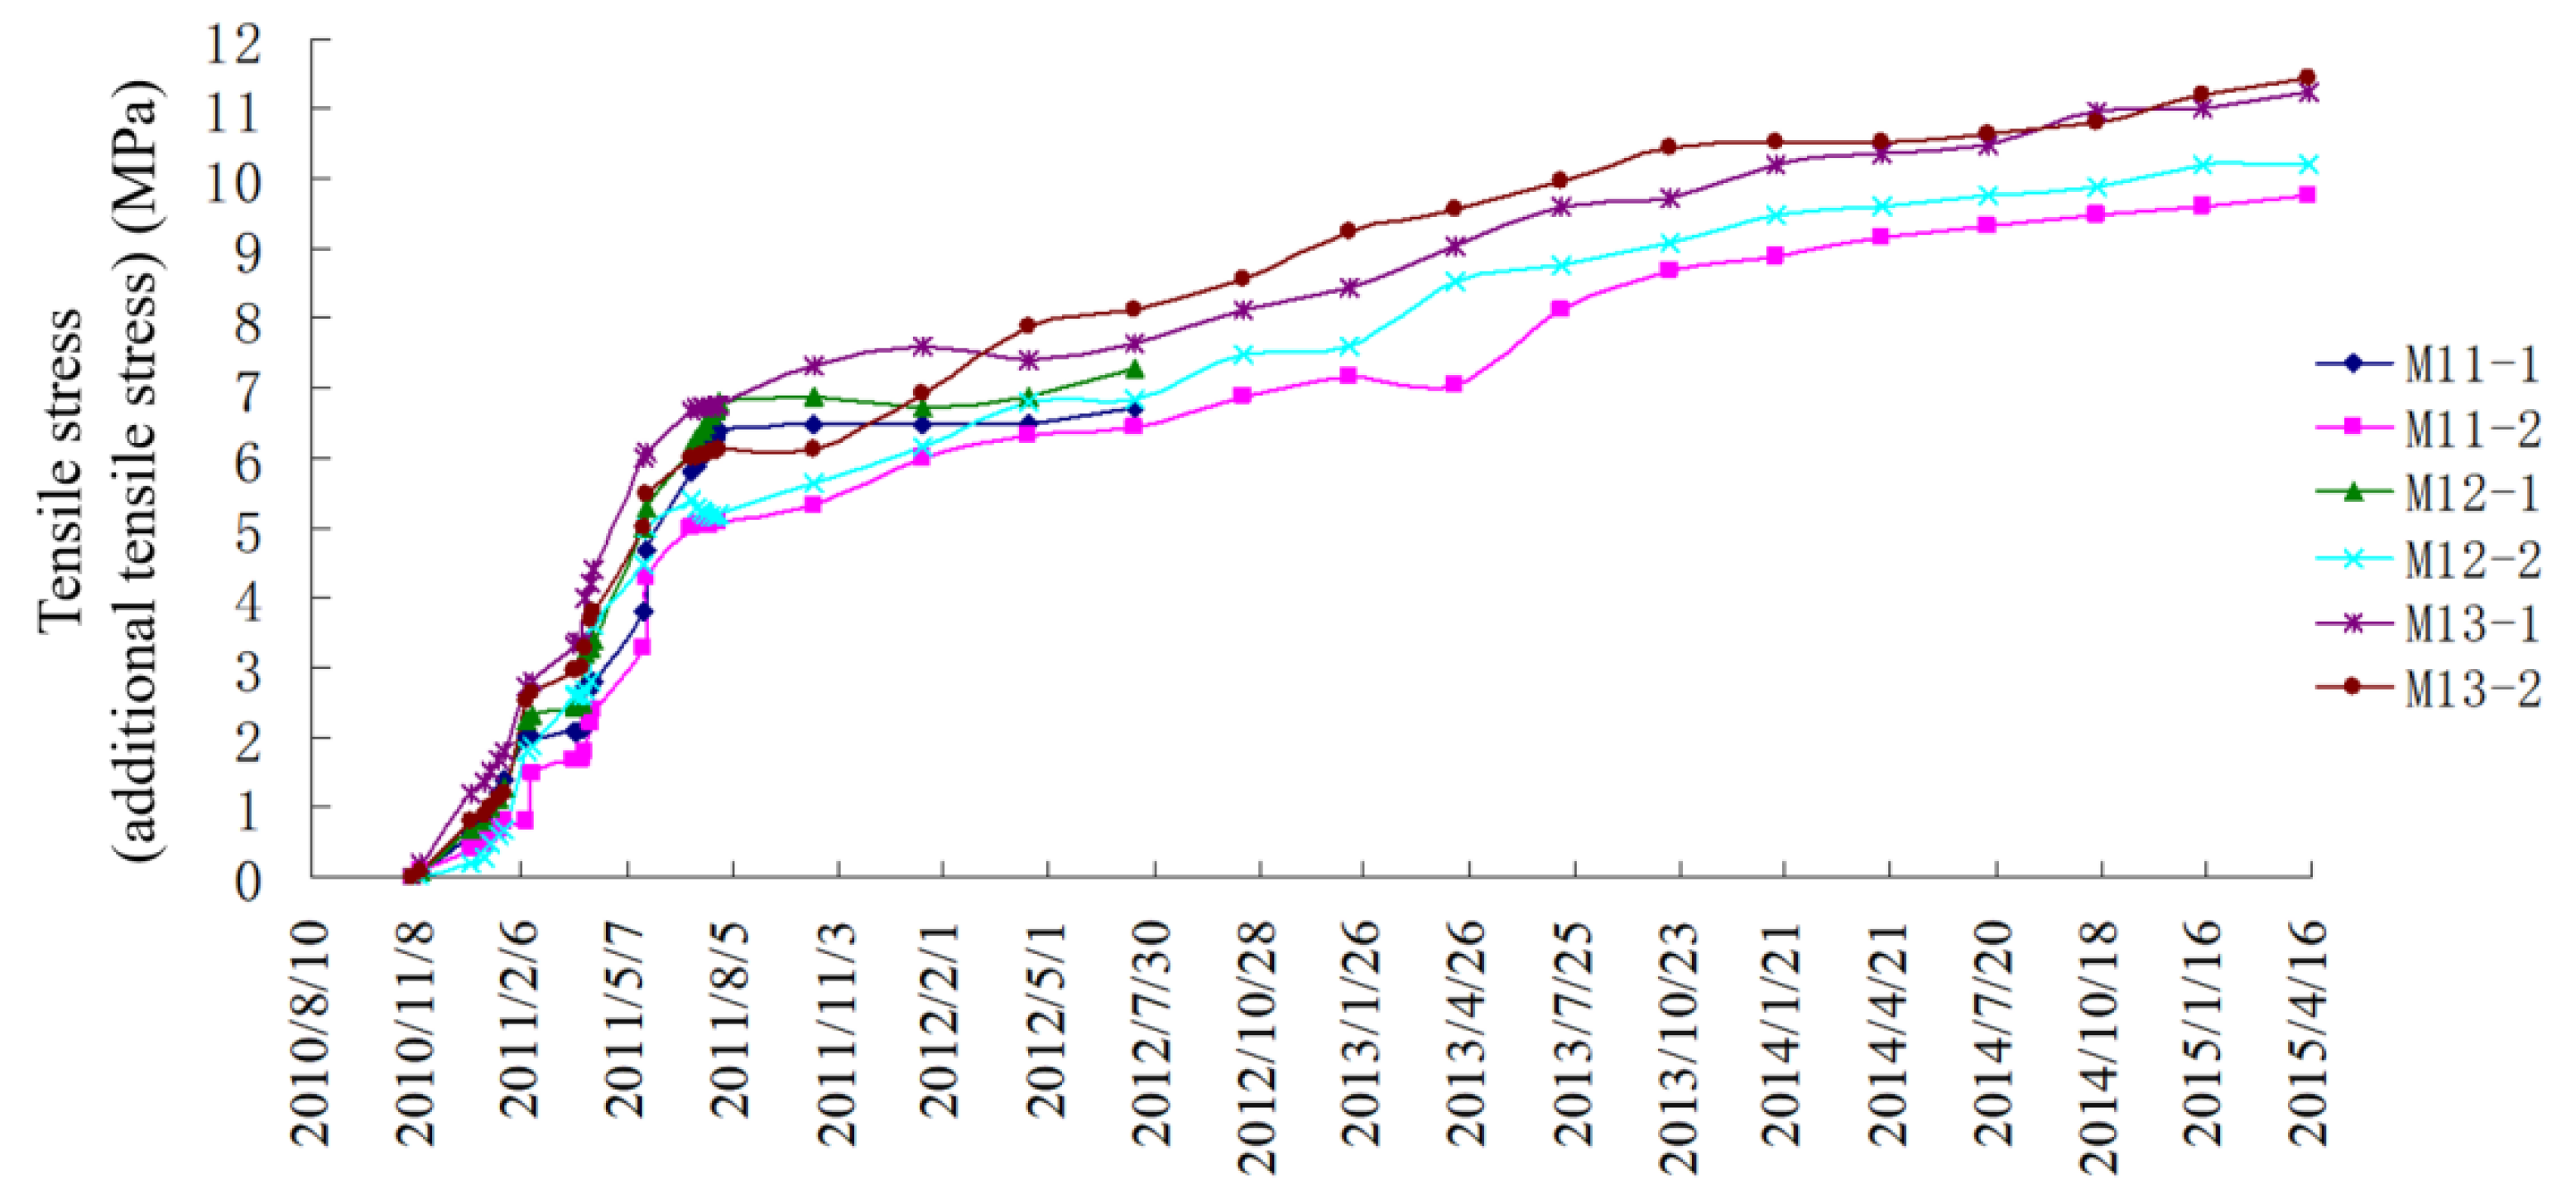
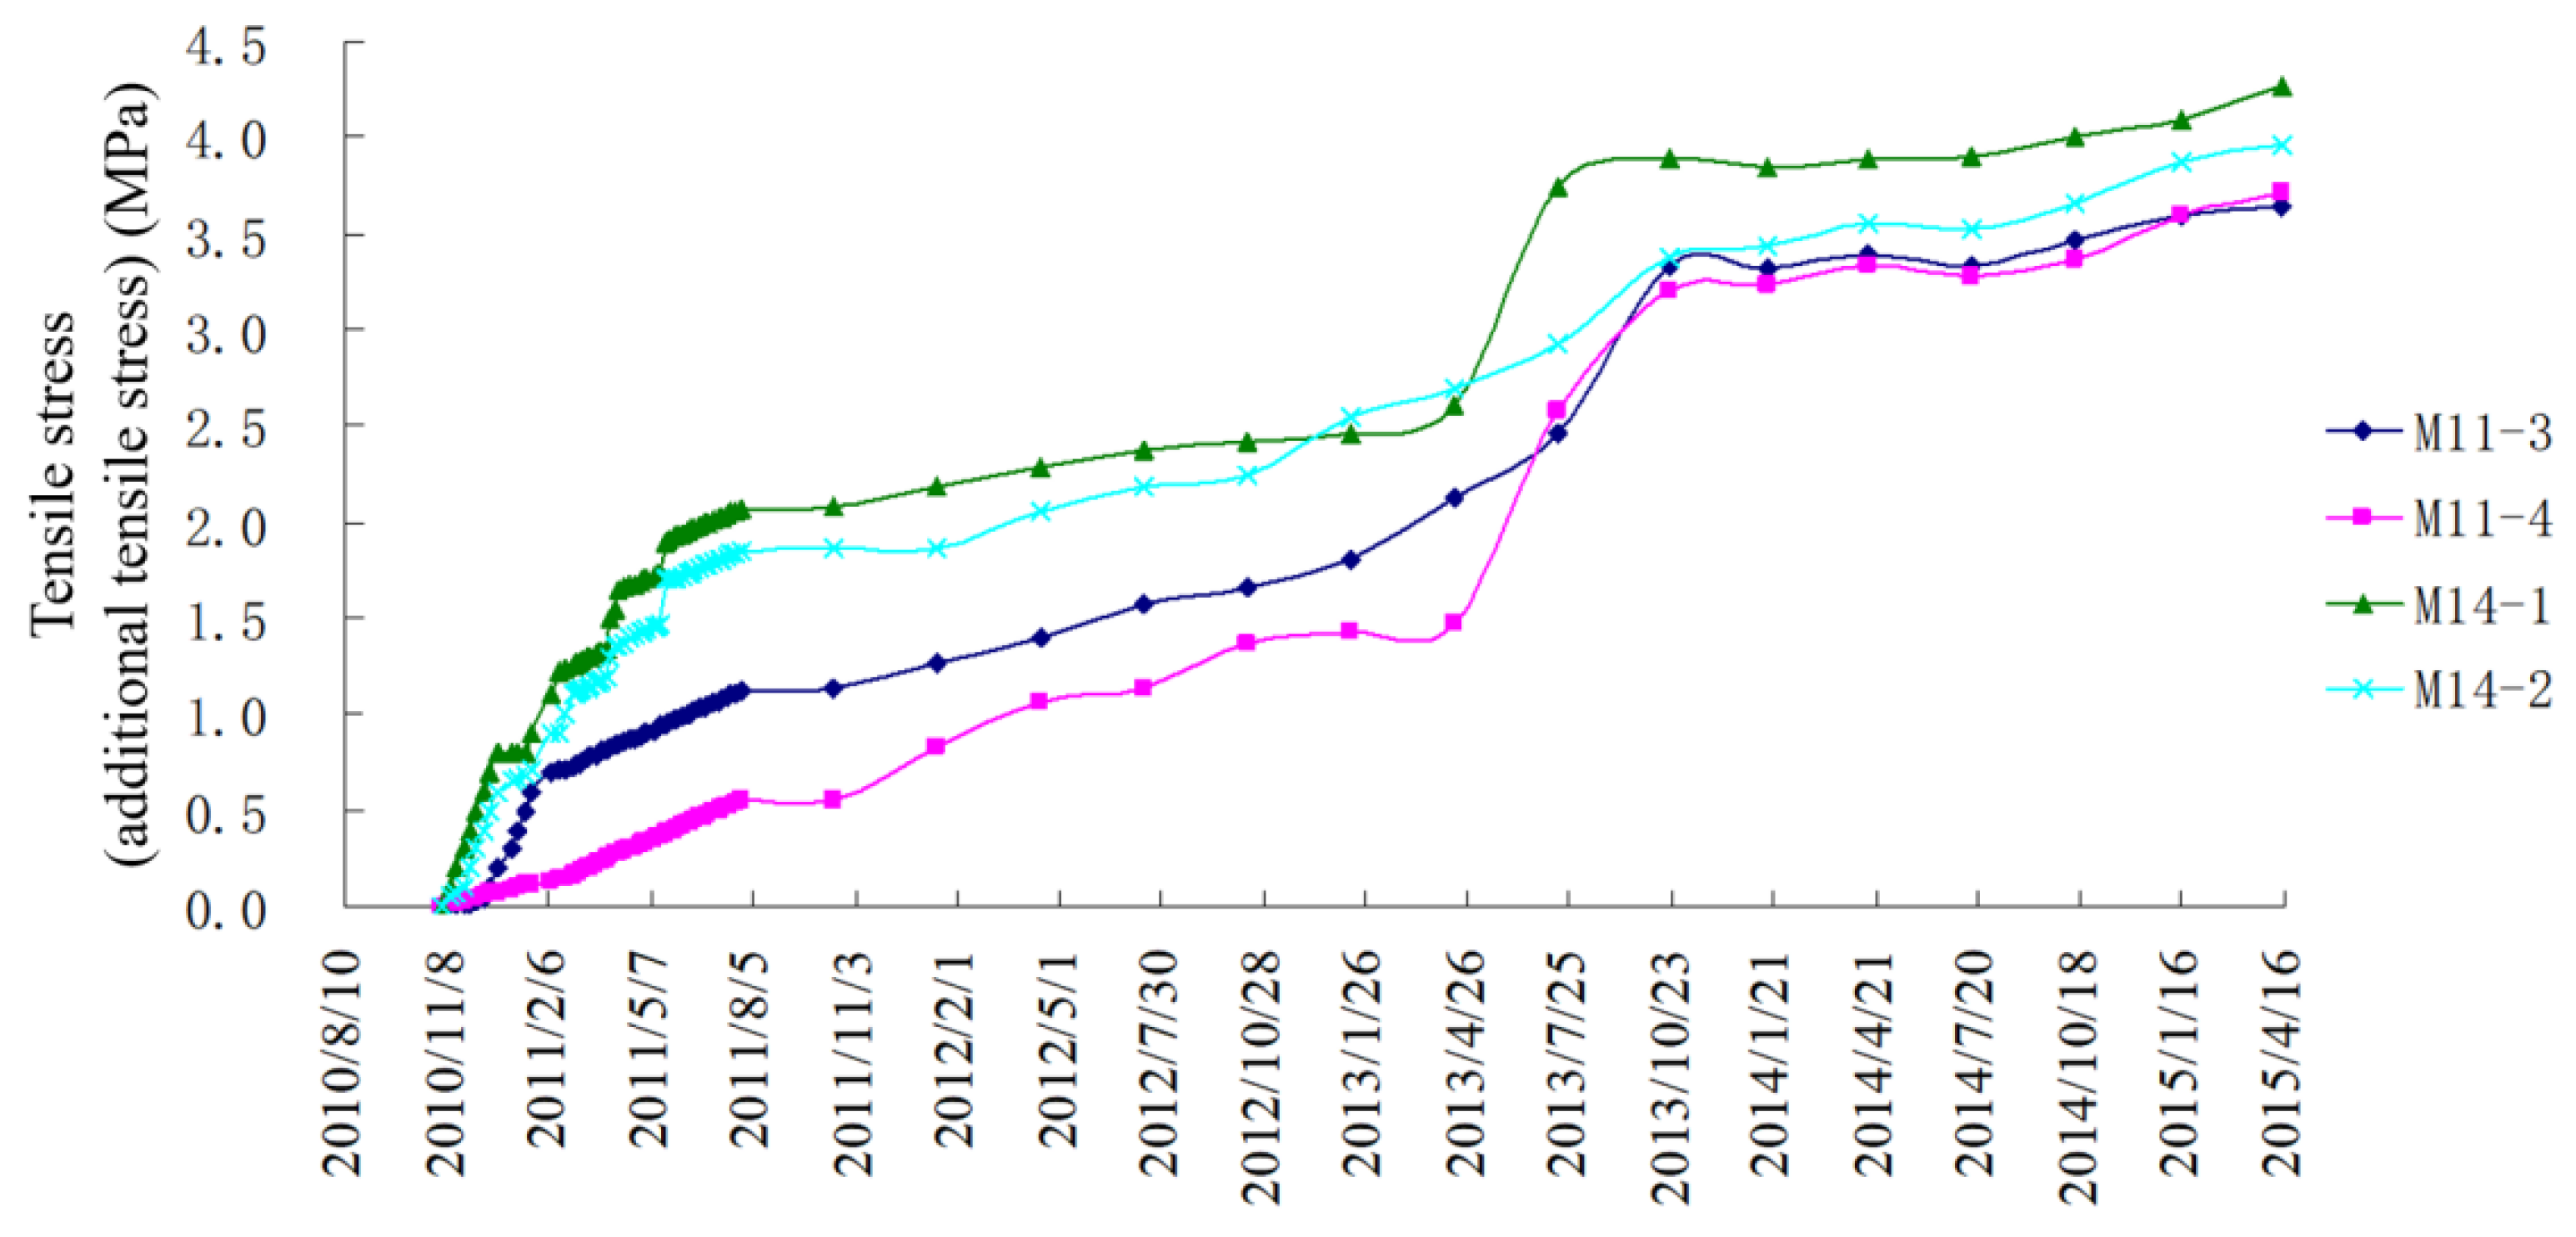
- As of 14 April 2015, the stress values of each measuring point used to monitor fault F2 are as follows: M11-2 is 9.77 MPa, M12-2 is10.20 MPa, M13-1 is 11.24 MPa, and M13-2 is 11.44 MPa. Due to the damage near measuring points M11-1 and M12-1, the readings of these two measuring points are those as of 14 July 2012. During the monitoring period, the average tensile stress of the hangingwall of fault F2 perpendicular to fault plane 2 m is 6.65 MPa, and the average tensile stress of the footwall of fault F2 perpendicular to fault plane 2 m is 5.46 MPa. The stress values of each measuring point for monitoring fault F3 are: M13-3 is 3.64 MPa, M13-4 is 3.72 MPa, M14-1 is 4.27 MPa, and M14-2 is 3.96 MPa. The stress of each measuring point of fault F4 is within the initial error range, and the change is small.
- (2)
- The calculation shows that, with the continuous deep mining, the additional tensile stress of the surrounding rock of the hangingwall and footwall of faults F2 and F3 is vertical to the fault plane and increases over time; the stress of fault F4 changes little. Through data analysis and the comparison of the changes in the additional tensile stress of each measuring point on the hangingwall and footwall of the fault at the same time, it is found that the additional tensile stress in the hangingwall of the fault is greater than that in the footwall of the fault at the same fault, indicating that the existence of the fault has a certain barrier effect on the stress distribution.
- (3)
- Comparing the three monitoring times with large stress variation values and the large blasting time of the stope, after the large blasting operation was carried out in the stope of sublevel 15 of the footwall of the main orebody, the stress value increases rapidly, indicating that the blasting operation has a great influence on the stress distribution in the fault and surrounding rock. It also indicates that the stress in the orebody and surrounding rock change significantly under the influence of mining, and the ground pressure activity enhances significantly.
5.2.2. Analysis of Monitoring Results of the Borehole Stress Meter
- (1)
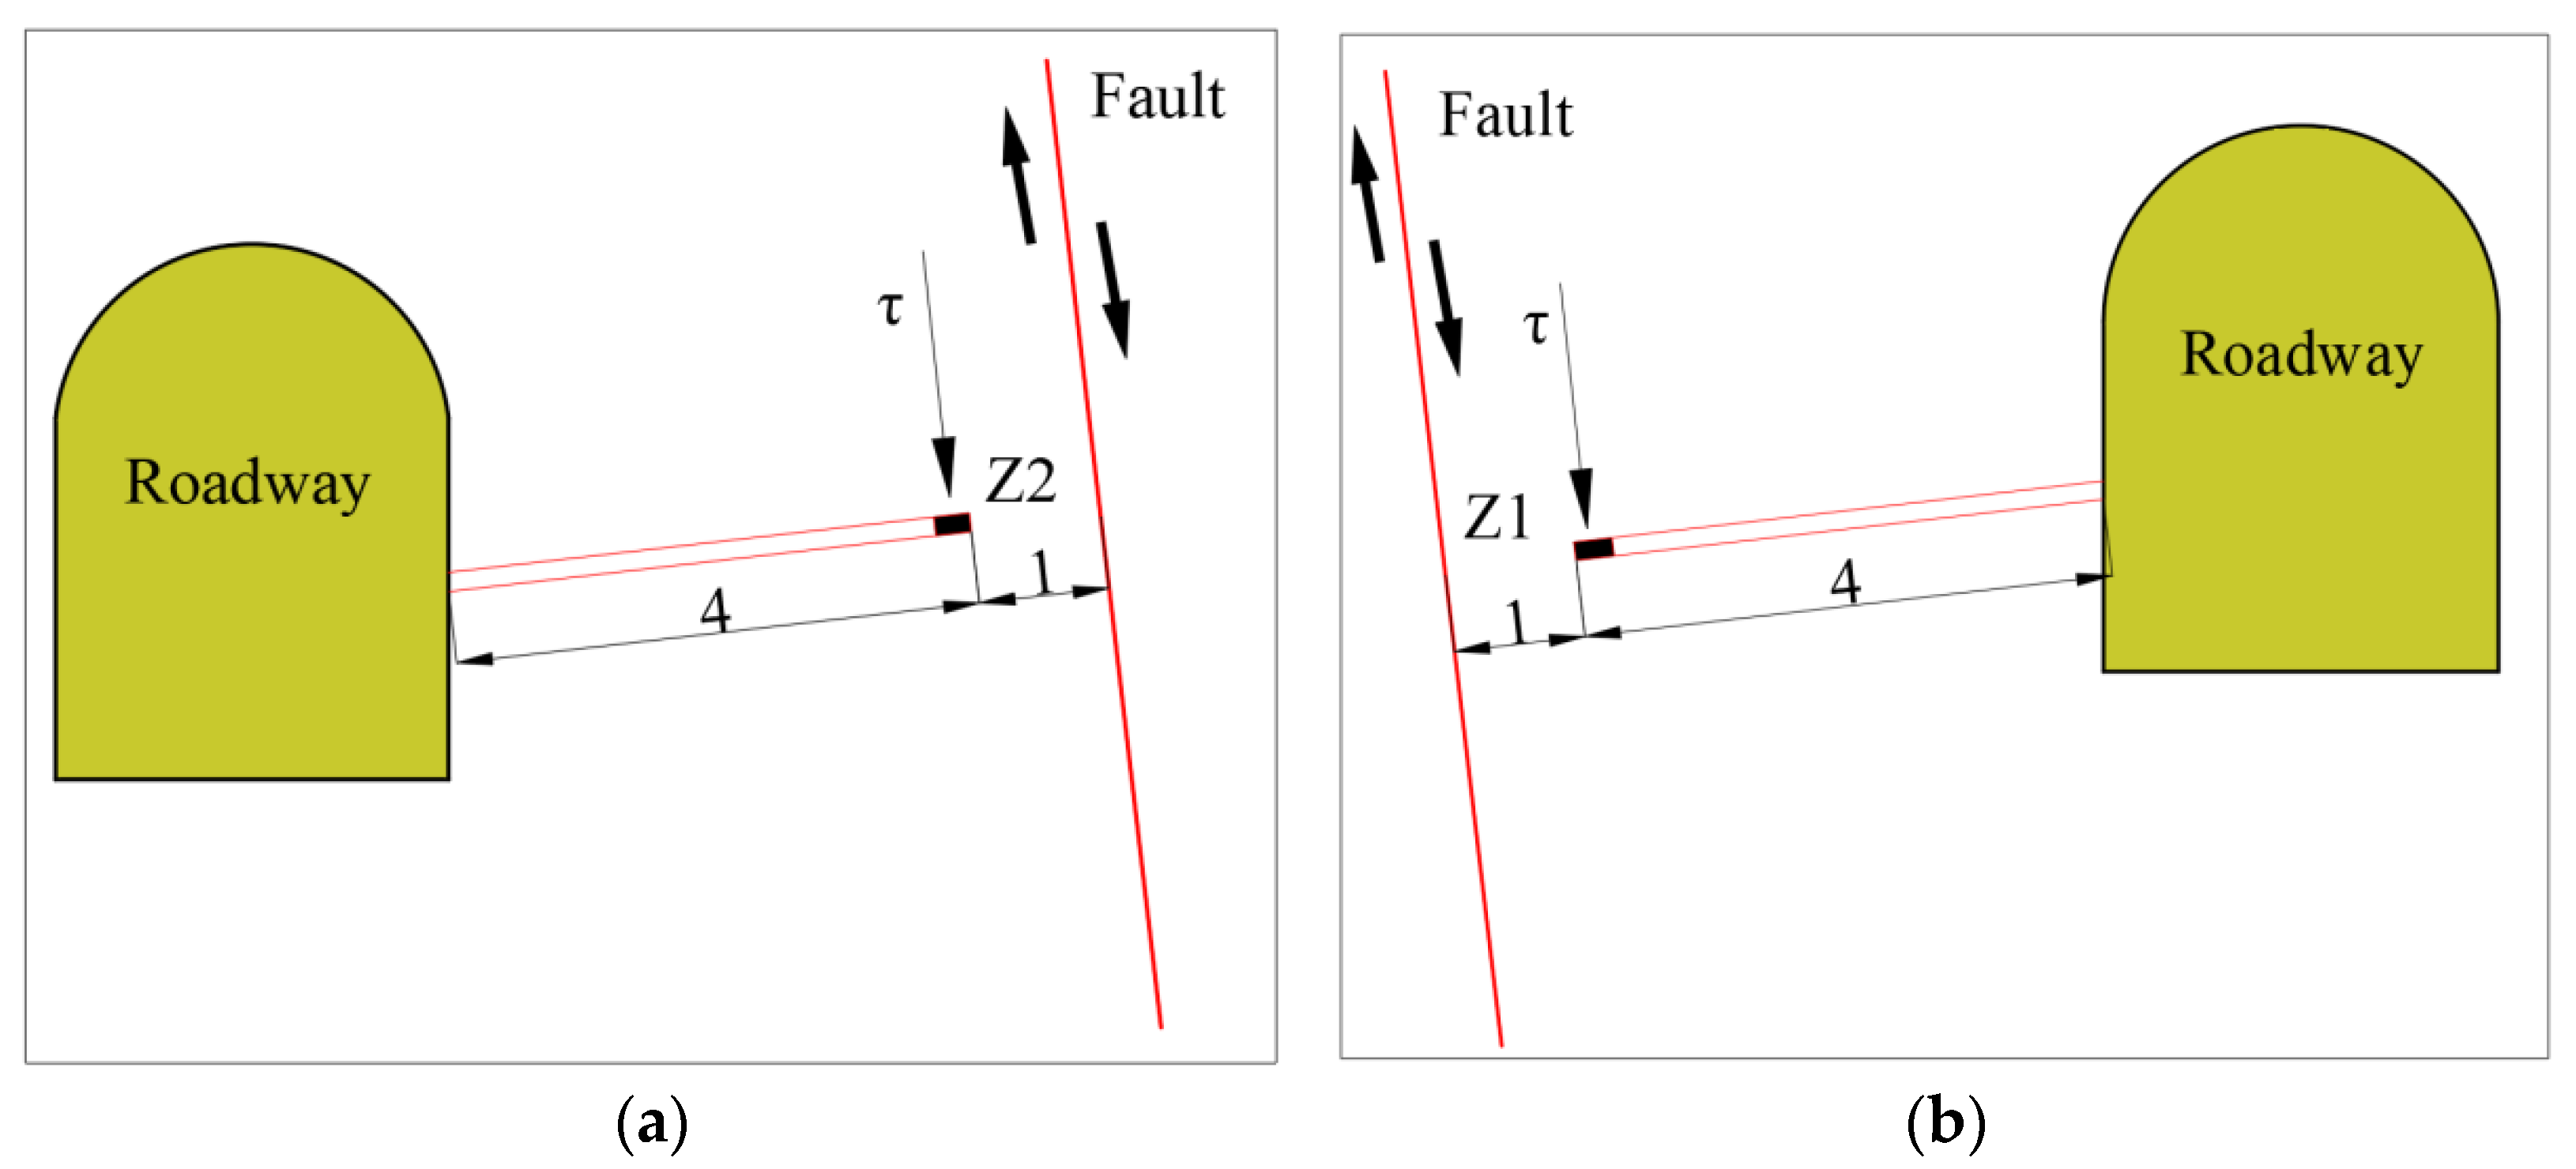
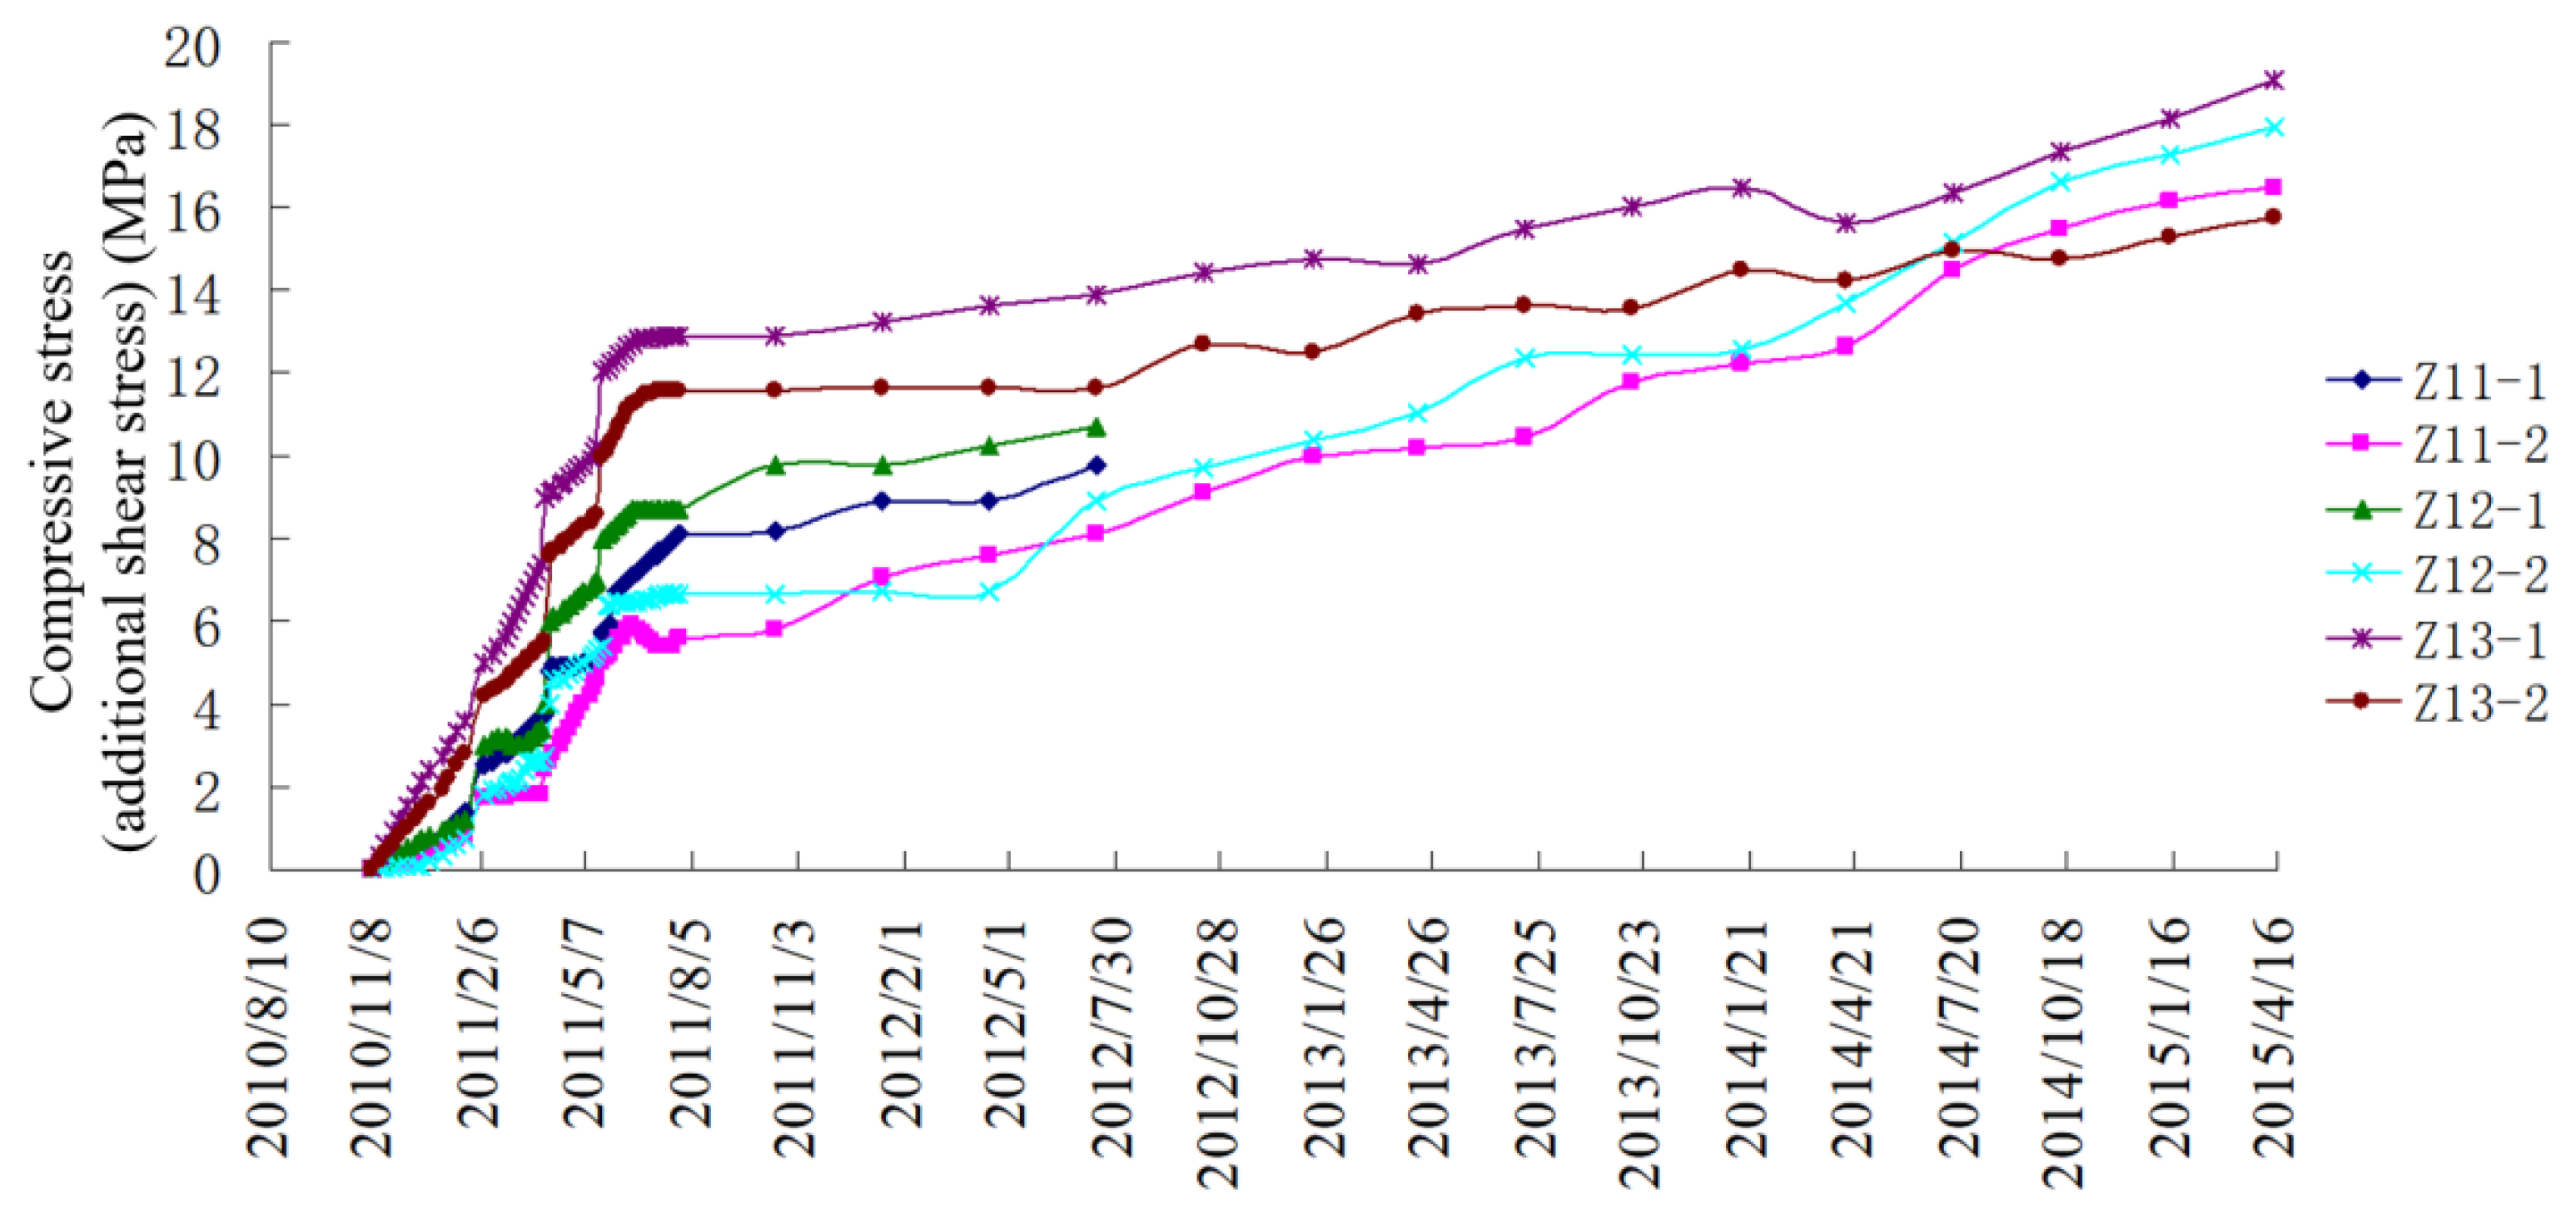
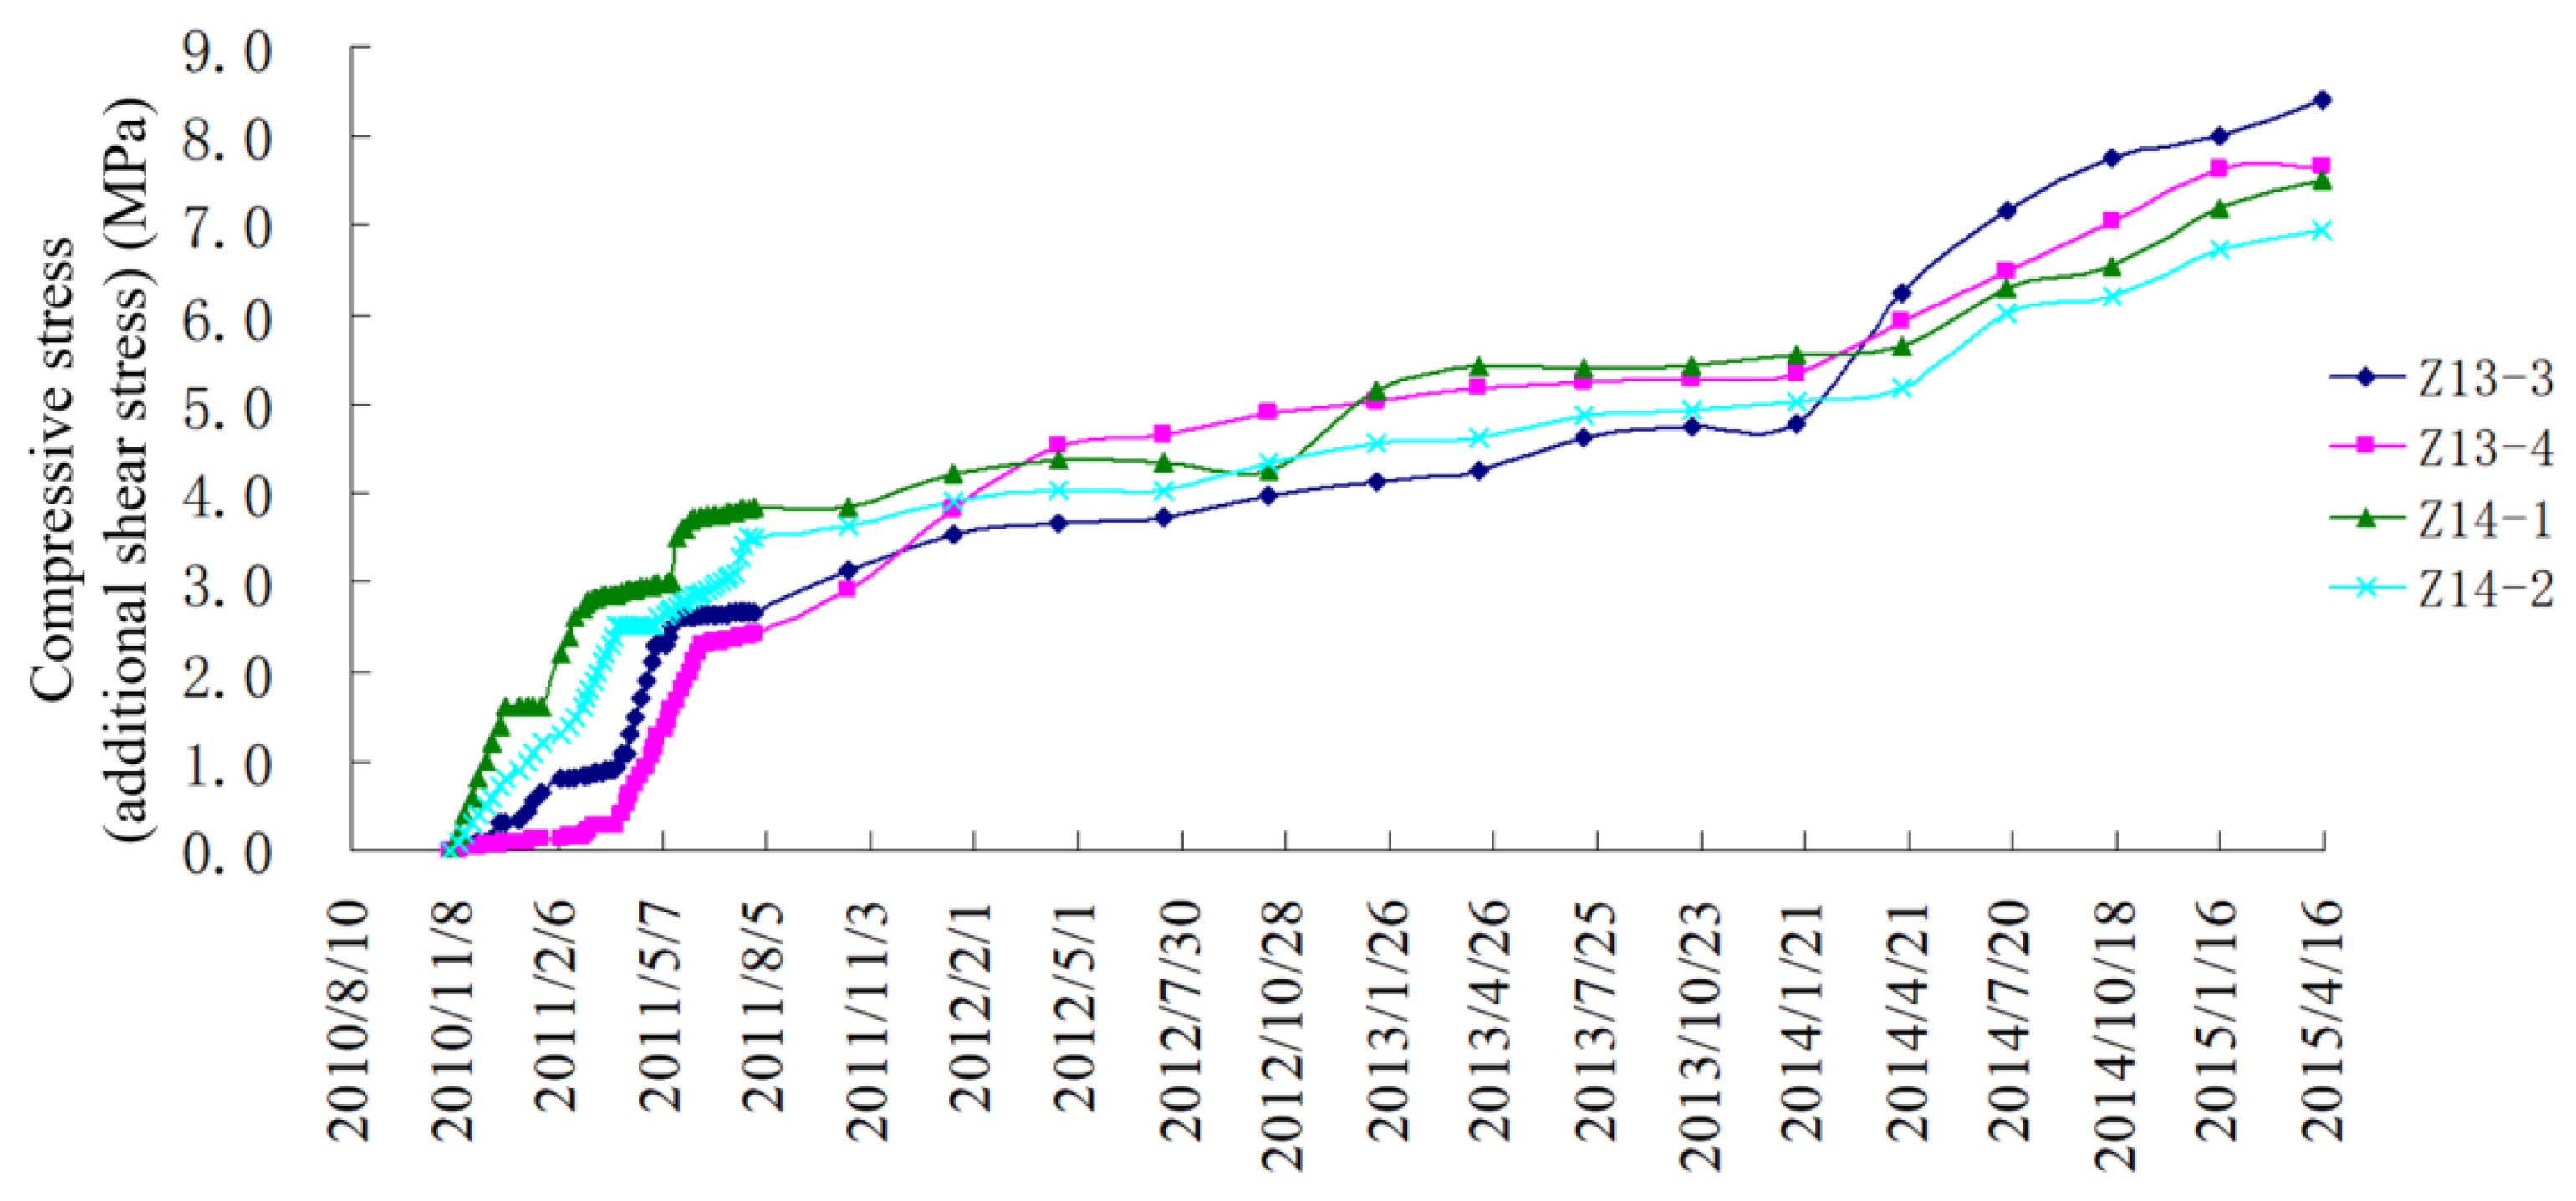
- As of 14 April 2015, the stress values of each measuring point used for monitoring fault F2 are as follows: Z11-2 is 16.50 MPa, Z12-2 is 17.96 MPa, Z13-1 is 19.04 MPa, and Z13-2 is 15.75 MPa. Due to the damage near the measuring point, the readings of Z11-1 and Z12-1 are those as of 14 July 2012. The stress values of each measuring point used for monitoring fault F3 are as follows: Z13-3 is 8.41 MPa, Z13-4 is 7.67 MPa, Z14-1 is 7.50 MPa, and Z14-2 is 6.95 MPa. The stress of each measuring point of fault F4 did not change greatly.
- (2)
- From the calculation results, it can be seen that, with the continuous deep mining, additional shear stress along the fault plane is generated in the surrounding rock of the hangingwall and footwall of fault F2 and fault F3 and increases gradually over time, while the stress of fault F4 changes little and is within the error range. Through data analysis, compared with the change in the additional shear stress of each measuring point in the hangingwall and footwall of the fault at the same time, it is found that the additional shear stress of the hangingwall of the fault is greater than that of the surrounding rock of the footwall of the fault, indicating that the existence of the fault has a certain barrier effect on the stress distribution. The change in the additional shear stress at the monitoring point on the west side of the fault is greater than that on the east side, indicating that the influence of mining on the west side of the fault is greater than that on the east side—the main reason for this is that the mining area in the west is closer to the fault.
- (3)
- Comparing the bolt stress meter and borehole stress meter at the same monitoring position of fault F2, it can be found that the additional shear stress generated by the same monitoring position of the fault is greater than the additional tensile stress within the same time.
- (4)
- Comparing the monitoring time with an abrupt change in the stress value and the large blasting time of stope, it can be found that the stress value increases rapidly after the large blasting operation, indicating that the blasting operation has a certain influence on the additional shear stress along the dip direction of the fault plane.
5.3. Regularity Analysis of Fault Activation Slip Based on Monitoring Results
- (1)
- From the relative relationship between the fault and the location of the mining area and the slip failure of the fault, it can be concluded that fault F2, fault F3, and fault F4 in the footwall of the main orebody are normal faults; that is, the hangingwall of the fault has moved to the goaf or there is a trend to move to the goaf. Under the influence of deep mining, the normal stress on fault F2’s and fault F3’s planes decreases, and the shear strength decreases. When the shear stress is greater than the shear strength, movement and failure to the goaf will occur.
- (2)
- During the mining of the orebody in sublevel 14 and sublevel 15, fault F2 was activated as the mining influence area developed to fault F2. With the passage of time, the slip amount of fault F2 gradually increased, and the cumulative slip amount reached 1.56 m. In the process of mining the orebody in sublevel 16 of the deep part, the mining influence range is spread to fault F3, and fault F3 is also activated. At present, the place with the largest accumulative slip amount is 27.27 cm, and with the continuous downward mining in the deep part, the slip amount is increasing. The monitoring data showed that activation dislocation did not occur at fault F4, indicating that the mining influence range did not reach fault F4.
- (3)
- From the monitoring data results, in the same monitoring time, the monitoring displacement of the multipoint displacement meter in the lower sublevel is greater than that in the upper sublevel, and the displacement of the measuring point near the goaf is greater than that far from the goaf, indicating that the movement of the fault is transmitted from bottom to top, and the distance from the mining area is developed from near to far. The fault activation sequence is from fault F2 to fault F3 and then to fault F4. In addition, for fault F2, at the same monitoring time, the displacement of the measuring point on the west side of the fault is larger than that on the east side of the fault, indicating that the rotation of the hangingwall of fault F2 along the right direction of the fault occurs in the process of moving to the goaf. From the stress–displacement curve with time combined with the large blasting time of the footwall of the main orebody, it can be concluded that blasting vibration has a certain influence on the fault activation.
- (4)
- From the stress monitoring results, when the mining influence range spreads to the fault, additional tensile stress perpendicular to the fault plane and additional shear stress along the dip direction of the fault plane are produced in the surrounding rock of the hangingwall and footwall of the fault and increase with the increase in the mining influence range. At the same monitoring position, the additional shear stress is greater than the additional tensile stress, and the stress change value of the surrounding rock of the hangingwall of the fault is greater than that of the footwall, indicating that the existence of the fault has a certain barrier effect on the propagation of stress. It also shows that, when the influence range of underground mining affects the fault, the increase in additional tensile stress on the fault plane will reduce the shear strength of the fault and increase the slip of the fault. When the shear stress exceeds the shear strength of the fault plane, shear failure occurs on the fault plane, and the rock mass on both sides of the fault loses stability, resulting in small dislocation or overall slip, which is the essence of fault F2’s and fault F3’s activation. From the monitoring results, fault F4 has not yet been activated.
- (5)
- According to the activation slip of the fault, the movement of the surrounding rock of the hangingwall of fault F2 will lead to a decrease in the confinement effect of the surrounding rock of the hangingwall of the fault on the surrounding rock of the footwall. The surrounding rock of the footwall of fault F2 is the surrounding rock of the hangingwall of fault F3. When the confinement effect of the surrounding rock of the hangingwall fault of F2 on the surrounding rock of the footwall is small to enough, the hangingwall of fault F3 will also move in the direction of the goaf, and the movement of fault F3 to a certain extent may also lead to the dislocation of fault F4. Therefore, the footwall of the main orebody is controlled by the dominant fault, and the movement and destruction of the fault conform to the domino effect.
6. Conclusions
- (1)
- When sublevel 14 and sublevel 15 are continuously mined in the deep part of the main orebody, the mining influence range spreads to fault F2, and fault F2 is activated. With the passage of time, the slip increases gradually. In the process of mining the deep orebody of sublevel 16, the mining influence range spreads to fault F3, and fault F3 is also activated. As the deep mining continues downward, the slip amount is increasing. During the monitoring period, fault F4 did not generate activation dislocation.
- (2)
- Within the same monitoring time, the monitoring displacement of the multipoint displacement meter in the lower sublevel is greater than that in the upper sublevel, and the displacement of the measuring point near the goaf is greater than that far from the goaf, indicating that the movement of the fault is transmitted from bottom to top, and the distance from the mining area is developed from near to far. The fault activation sequence is from fault F2 to fault F3, and then to fault F4. Moreover, for fault F2, at the same monitoring time, the displacement of the measuring point on the west side of the fault is larger than that on the east side of the fault, indicating that the hangingwall of fault F2 also rotates along the right direction of the fault in the process of moving to the goaf; the main reason for this is that the west side is closer to the mining area.
- (3)
- When the mining influence range spreads to the fault, additional tensile stress perpendicular to the fault plane and additional shear stress along the dip direction of the fault plane are produced in the surrounding rock of the hangingwall and footwall of the fault. The additional tensile stress increases with the increase in the mining influence range. At the same monitoring position, the additional shear stress is greater than the additional tensile stress, and the stress change value of the surrounding rock of the hangingwall of the fault is greater than that of the footwall, indicating that the existence of the fault has a certain barrier effect on the propagation of stress. When the influence range of underground mining affects the fault, the increase in additional tensile stress on the fault plane will reduce the shear strength of the fault and increase the slip of the fault. When the shear stress exceeds the shear strength of the fault plane, the fault plane will undergo shear failure, and the rock mass on both sides of the fault will lose stability, resulting in small dislocation or overall slip, which is also the essence of fault F2’s and fault F3’s activation.
Author Contributions
Funding
Institutional Review Board Statement
Informed Consent Statement
Data Availability Statement
Conflicts of Interest
References
- Xie, H.P. Research framework and anticipated results of deep rock mechanics and mining theory. Adv. Eng. Sci. 2017, 49, 1–16. [Google Scholar]
- Kong, P.; Jiang, L.S.; Shu, J.M.; Wang, L. Mining stress distribution and fault-slip behavior a case study of fault-influenced long wallcoal mining. Energies 2019, 12, 2494. [Google Scholar] [CrossRef] [Green Version]
- Lei, G.W.; Yang, C.H.; Wang, G.B.; Chen, S.W.; Wei, X.; Huo, L. The development law and mechanical causes of fault influenced zone. Chin. J. Rock Mech. Eng. 2016, 35, 231–241. [Google Scholar]
- Luo, H.; Li, Z.H.; Wang, A.W.; Xiao, Y.H. Study on the evolution law of stress field when approaching fault in deep mining. J. Chin. Coal Soc. 2014, 39, 322–327. [Google Scholar]
- Lyu, P.F.; Bao, X.Y.; Lyu, G.; Chen, X.H. Research on Fault Activation Law in Deep Mining Face and Mechanism of Rockburst Induced by Fault Activation. Adv. Civ. Eng. 2020, 2020, 8854467. [Google Scholar]
- Hu, X.Y.; Wang, L.G.; Lu, Y.L.; Yu, M. Analysis of insidious fault activation and water inrush from the mining floor. Int. J. Min. Sci. 2014, 24, 477–483. [Google Scholar] [CrossRef]
- Ścigała, R.; Szafulera, K. Linear discontinuous deformations created on the surface as an effect of underground mining and local geological conditions-case study. Bull. Eng. Geol. Environ. 2020, 79, 2059–2068. [Google Scholar] [CrossRef]
- Yu, Q.H.; Zhang, H.X.; Zhang, Y.J.; Deng, W.N.; Zhang, G.Y. Analysis of fault activation mechanism and influencing factors caused by mining. J. Chin. Coal Soc. 2019, 44, 18–30. [Google Scholar]
- Zhang, N.B.; Zhao, S.K.; Deng, Z.G.; Li, H.T.; Wang, Y.; Qin, K. Mechanical instability mechanism of thrust fault under static and dynamic loading. J. Min. Safety Eng. 2019, 36, 1186–1192. [Google Scholar]
- Yin, Y.Q.; Li, P.E.; Di, Y. Instability and jumping phenomenon of rock structure. Chin. J. Rock Mech. Eng. 2015, 34, 945–952. [Google Scholar]
- Pan, Y.S. Study on Rockburst Initiation and Failure Propagation. Ph.D. Thesis, Tsinghua University, Beijing, China, 1999. [Google Scholar]
- Islam, M.R.; Shinjo, R. Mining-induced fault reacti-vation associated with the main conveyor belt roadway and safety of the Barapukuria coal mine in Bangladesh: Constraints from BEM simulations. Int. J. Coal Geol. 2009, 79, 115–130. [Google Scholar] [CrossRef]
- Jiang, J.Q.; Wu, Q.S.; Qu, H. Characteristic of mining stress evolution and activation of the reverse fault below thehard-thick strata. J. Chin. Coal Soc. 2015, 40, 115–130. [Google Scholar]
- Sainoki, A.; Mitri, H.S. Effect of slip-weakening distance on selected seismic source parameters of min-ing-induced fault-slip. Int. J. Rock Mech. Min. Sci. 2015, 73, 115–122. [Google Scholar] [CrossRef]
- Cai, W.; Dou, L.M.; Wang, G.F.; Hu, Y.W. Mechanism of fault reactivation and its induced coal burst caused by coal mining activities. J. Min. Saf. Eng. 2019, 36, 1193–1202. [Google Scholar]
- Han, K.M.; Yu, Q.H.; Zhang, H.X.; Li, F.M. Mechanism of fault activation when mining on hanging-wall and foot-wall. J. Chin. Coal Soc. 2020, 45, 1327–1335. [Google Scholar]
- Zuo, J.P.; Chen, Z.H.; Wang, H.W.; Liu, X.P.; Wu, Z.P. Experimental investigation on fault activation pattern under deep mining. J. Chin. Coal Soc. 2009, 34, 305–309. [Google Scholar]
- Liu, C.; Li, S.G.; Cheng, C.; Xue, J.H. Activation characteristics analysis on concealed fault in the excavating coal roadway based on microseismic monitoring technique. Int. J. Min. Sci. Technol. 2017, 27, 883–887. [Google Scholar] [CrossRef]
- Loginov, G.N.; Yaskevich, S.V.; Duchkov, A.A.; Serdyukov, A.S. Joint processing of surface and underground microseismic monitoring data in hard mineral mining. J. Min. Sci. 2015, 51, 944–950. [Google Scholar] [CrossRef]
- Kurlenya, M.V.; Serdyukov, A.S.; Azarov, A.V.; Nikitin, A.A. Numerical modeling of wavefields of microseismic events in underground mining. J. Min. Sci. 2015, 51, 689–695. [Google Scholar] [CrossRef]
- Jiang, F.X.; Liu, J.W.; Ye, G.X.; Li, W. Coupling study of microseismic monitoring and numerical simulationfor tectonic activation. Chin. J. Rock Mech. Eng. 2009, 29, 3590–3597. [Google Scholar]
- Shen, B.; Yi, D.; Xun, L.; Mattvan, V.D.W.; Bongani, D.; Lu, C.; Onur, V.; Ismet, C. Monitoring and modelling stress state near major geological structures in an underground coal mine for coal burst assessment. Int. J. Rock Mech. Min. 2020, 129, 104294. [Google Scholar] [CrossRef]
- Ghosh, G.K.; Sivakumar, C. Application of underground microseismic monitoring for ground failure and secure longwall coal mining operation: A case study in an Indian mine. J. Appl. Geophys. 2018, 150, 21–39. [Google Scholar] [CrossRef]
- Cai, W.; Dou, L.M.; Si, G.Y.; Hu, Y.W. Fault-Induced Coal Burst Mechanism under Mining-Induced Static and Dynamic Stresses. Engineering 2021, 7, 306–334. [Google Scholar] [CrossRef]
- Jiao, Z.H.; Zhao, Y.X.; Jiang, Y.D.; Wang, H.; Lu, Z.G.; Wang, X.Z. Fault damage induced by mining and its sensitivity analysis of influencing factors. J. Chin. Coal Soc. 2017, 42, 36–42. [Google Scholar]
- Zhao, S.K. Experiments on the characteristics of thrust fault activation influenced by miningoperation. J. Min. Safety Eng. 2016, 33, 354–360. [Google Scholar]
- Bradley, F.; Nicholas, V.; Mark, S.; Diederichs; Andrew, J.; Hyett; Allan, P. An in situ monitoring campaign of a hard rock pillar at great depth within a Canadian mine. J. Rock Mech. Geotech. 2020, 12, 427–448. [Google Scholar]
- Naruse, H.; Uehara, H.; Deguchi, T.; Fujihashi, K.; Onishi, M.; Espinoza, R.; Pinto, M. Application of a distributed fibre optic strain sensing system to monitoring changes in the state of an underground mine. Meas. Sci. Technol. 2007, 18, 3202–3210. [Google Scholar] [CrossRef]
- Serdyukov, S.; Azarov, A.; Dergach, P.; Duchkov, A. Equipment for microseismic monitoring of geodynamic processes in underground hard mineral mining. J. Min. Sci. 2015, 51, 634–640. [Google Scholar] [CrossRef]
- Guo, Y.H.; Hou, K.P. In-situ Stress Measurement and Prediction Analysis of Rockburst in Deep Mining of Shizishan Copper Mine. Electron. J. Geotech. Eng. 2014, 19, 2513–2524. [Google Scholar]
- Huang, X.; Xu, N.; Wei, W.; Xiao, P.; Dong, L.; Li, B. Instability of an intersecting fault-dyke system during deep rock excavation. Int. J. Rock Mech. Min. 2022, 153, 105087. [Google Scholar] [CrossRef]
- Zhang, C.S.; Liu, N.; Zhu, H.C.; Chu, W.; Wu, J.Y. Time-dependent behavior of crack propagation and evaluation of control effect of jinping deep marble. Chin. J. Rock Mech. Eng. 2013, 32, 1964–1972. [Google Scholar]
- Emilio, B.; Gianpiero, R. Lining structural monitoring in the new underground service of Naples (Italy). Tunn. Undergr. Space Technol. 2016, 51, 152–163. [Google Scholar]
- Zhang, N.B.; Wang, J.D.; Zhao, S.K.; Yang, S.H.; Deng, Z.G.; Ding, C.H. Evaluation of coal bump risk in excavation roadway based on multi-point stress and displacement monitoring system. J. China Coal Soc. 2020, 45, 140–149. [Google Scholar]
- Guo, Y.H. Study on the Regularity, Mechanism and Deformation Forecast of Rockmass Movement Induced by Caving Mining Steep Deposit in High Stress Area. Ph.D. Thesis, Kunming University of Science and Technology, Kunming, China, 2015. [Google Scholar]


| Number of Fault | Trend (°) | Tendency (°) | Dip Angle (°) |
|---|---|---|---|
| F2 | 222 | 132 | 69 |
| F3 | 221 | 131 | 71 |
| F4 | 219 | 129 | 78 |
Publisher’s Note: MDPI stays neutral with regard to jurisdictional claims in published maps and institutional affiliations. |
© 2022 by the authors. Licensee MDPI, Basel, Switzerland. This article is an open access article distributed under the terms and conditions of the Creative Commons Attribution (CC BY) license (https://creativecommons.org/licenses/by/4.0/).
Share and Cite
Guo, Y.; Luo, L. Monitoring and Analysis of Deformation Evolution Law of Fault Activation Caused by Deep Mining in Shizishan Copper Mine, China. Appl. Sci. 2022, 12, 6863. https://doi.org/10.3390/app12146863
Guo Y, Luo L. Monitoring and Analysis of Deformation Evolution Law of Fault Activation Caused by Deep Mining in Shizishan Copper Mine, China. Applied Sciences. 2022; 12(14):6863. https://doi.org/10.3390/app12146863
Chicago/Turabian StyleGuo, Yanhui, and Luo Luo. 2022. "Monitoring and Analysis of Deformation Evolution Law of Fault Activation Caused by Deep Mining in Shizishan Copper Mine, China" Applied Sciences 12, no. 14: 6863. https://doi.org/10.3390/app12146863
APA StyleGuo, Y., & Luo, L. (2022). Monitoring and Analysis of Deformation Evolution Law of Fault Activation Caused by Deep Mining in Shizishan Copper Mine, China. Applied Sciences, 12(14), 6863. https://doi.org/10.3390/app12146863