Abstract
Offshore wind energy development is driven by ongoing research and development to determine technological issues connected with offshore wind turbines. A fundamental design difficulty is the offshore wind turbine foundations. By far, one of the most commonly practiced foundation systems is mono helical pile foundations because of their simplicity and resilience. Most of the studies on mono helical piles were focused on granular soils and few studies were on clayey soils. However, mono helical piles in clayey soils under combined loading remain to be examined. Hence, a series of three-dimensional finite element analyses were carried out to predict the uplift and lateral capacity of the helical pile embedded in soft clay. The numerical model is verified using the results from the analytical results and a small-scale laboratory test. The verified model is used to simulate the helical pile behavior under the combined uplift and lateral loading condition considering the pile with a different number of helical plates. The results of the combined loading analyses reveal that the lateral capacity decreased when the pile was subjected to uplift load, and a maximum reduction of 12% is observed in mono helical piles provided with a single plate for an applied 50% of the ultimate uplift load. The influence of uplift load also increased the bending moment of the helical pile. Finally, it is suggested that the helical piles should be designed considering the aspects for combined loading conditions.
1. Introduction
Helical or screw piles are one of the most versatile and significant foundation types currently being used commercially in the construction field. The helical piles are made up of circular or squared steel shafts, welded with a number of helical plates in a consecutive pattern based on load capacity. The torque and crowd are applied simultaneously to the central shaft while installing, and it helps to transfer the axial load to the helical plates. The ease of installation and adaptability of this pile with minimal site disturbances increases the usage in time and also the helical plate offers more bearing and uplift resistance compared to conventional straight shafted piles. Helical piles will not penetrate in hard soils with the same amount of pitch, as determined by Ghaly et al. [1] and Saeki and Ohki [2]; therefore, it may be necessary to apply downward thrust force to the pile to facilitate pile installation. However, in the onshore reality, the majority of helical pile manufacturers do not take the crowd force into consideration during pile installation [3]. When single and double-helix piles with helix diameters ranging from 152 mm are installed in the field, the downward forces of a minimal range from 4.5 to 17.8 kN throughout the installation process are applied. These piles are widely used as mooring anchors, guyed anchors, solar panel foundations, small commercial buildings, foundations for transmission towers, soil nailing, etc.
Helical piles were first developed and utilized by the Irish engineer Alexander Mitchel in 1836 for offshore lighthouses and ship moorings [4]. Later, these piles had a great influence in the field of engineering and are used for ocean front piers, underpinning, anchoring, and bridges. The usage of this pile offshore declined in the period of the 1890s and 1990s, among other developments of various foundation techniques such as bored piles, ground anchors, and driven piles where the application is more predominantly for onshore construction [4,5]. Helical pile anchors also used as a tension-resistant foundation technique and effectively control the heave or uplift of footing on expansive clay beds [6]. Nowadays, helical piles are well recognized in abundant uses such as offshore mooring systems, underpinning, pedestrian bridges, guy wire anchors, tie-backs while excavating, house foundations, transmission and wind energy towers, and solar panel installations [5]. It is included as deep foundations in the International Building Code 2015 (IBC 2015) (Chapter 18, Section 1810) [7] where geotechnical and structural design specifications are given for tensile and compressive loading conditions.
Much research has been carried out to examine the helical pile behavior under pure compressive, uplift, and lateral loads. Rao et al. [8] and Mooney et al. [9] proposed the first method for evaluating the axial capacity of helical piles in order to design multi-helix helical piles in cohesive soils. The “individual bearing method” and the “cylindrical shear method” are the two most often used methods for estimating the load capacity of multi-helix piles. The results of Rao et al. [8] show that the transition from cylindrical shear failure to individual plate bearing failure occurs at a particular spacing ratio S/D, where S is the inter-helix spacing and D is the diameter of the helical plate, and it is found as greater than 1.5. However, Lutenegger [4] discovered that this transition is mostly reliant on the stiffness and type of the soil, with no discernible S/D between the two modes. In terms of embedment depth (H), Mitsch and Clemence [10], Rao et al. [11], Lutenegger [4], and Perko [5] investigated the deep and shallow failure modes in detail.
Rao et al. [11] carried out an experimental investigation in remolded soft marine clays by placing the model helical anchors at different embedment depths and found that when the embedment depth ratio (H/D) is kept at less than two, it governs the shallow failure mode. They identified deep failure modes as those that govern when the H/D is greater than four. Mitsch and Clemence [10] proposed that helical piles behave similarly to Meyerhof and Adam [12], who recommended a shallow failure mechanism H/D value less than five and a deep failure mechanism afterwards. Additionally, Perko [5] theorized that the transition zone occurs at a shallower embedment depth in fine-grained soils than it does in coarse-grained soils.
Several investigations on the lateral behavior of helical piles have been conducted before, including theoretical and experimental studies [13,14,15], field studies [16,17,18], and numerical studies [19]. Puri et al. [20] established a theoretical model to predict the anchor–soil system’s lateral load deformation when the lateral load and moments are applied to the helical anchor piles. The model is verified by comparing it to field study results. They included the modified Matlock and Reese [21] model into their theoretical model to get lateral deflections at ultimate lateral loads calculated from test data in sands and clays. The lateral capacity of helical screw anchor piles is found to be entirely controlled by the extension shaft at depths larger than three to five times the crucial relative stiffness parameters, R or T. The laboratory test results on helical piles shows that the lateral capacity of the helical piles increased 1.2 to 1.4 times that of conventional straight shafted piles [22]. They also devised an analytical model to determine the lateral load capacity of short stiff piles buried in clay by combining various resistive forces operating on the pile and using a static force equilibrium. The findings of the experiment conducted by Sakr [16] revealed that increasing the shaft diameter of the helical piles improved their lateral resistance, also increasing the top section length and their lateral resistance.
In some situations, the structure supported by helical anchors may be subjected to lateral loads in addition to axial loads due to wind, waves, and currents, etc. Therefore, it is necessary to know the behavior of a helical pile under combined axial and lateral loads. But scarce number of literatures have been found to study the behavior of helical piles under combined loads for the piles embedded in cohesionless or sandy soil [19]. In addition, the conventional straight shafted pile behaviors are well established under combined loading conditions. Somehow the behavior of the conventional pile will change contrarily with the helical piles. Thus, a detailed investigation is necessary to avail the importance of the combined loading behavior of helical piles in cohesive soils.
This paper elucidates the detailed behavioral investigation of a mono helical pile embedded in soft clay under combined uplift and lateral loading using laboratory as well as three-dimensional finite element analysis using Plaxis 3D software.
2. Materials and Methods
In the present study, the helical piles used for the analysis and testing program are made of steel and their respective properties are entered into software for finite element analysis. Through a vast gathering of literature, it is found that the ultimate capacity of a helical pile (both uplift and lateral loading conditions) is dependent upon several parameters. The significant design parameters include spacing ratio, embedment depth ratio, number of helical plates, and soil condition [23]. Considering all the parametric influences on the design of helical pile, the analyzing sequence is formed in order to reduce the repetition of work that has already been done. The model helical piles are made at a steel fabrication shop; a circular plate with a thickness of 2 mm is cut and molded into a helical shape, and then welded to a steel circular solid rod of grade Fe 415 with the requisite diameter. Four such helical piles were used in this study with same shaft diameter (d) of 14 mm, helical plate diameter (D) of 40 mm, helical pitch (p) of 8 mm, and the length of pile (L) is 510 mm. The casted four helical piles with dimensions are shown in Figure 1. The helical plates were spaced at a spacing ratio (S/D of 3.75, 1.875, and 1.25, where S = spacing between the helices for a pile having 2, 3, and 4 numbers of helical plates), respectively. The different embedment depth ratios (H/D), i.e., 4, 6, and 8.75 were used. The overview of the testing program considering various parameters is given in Table 1.
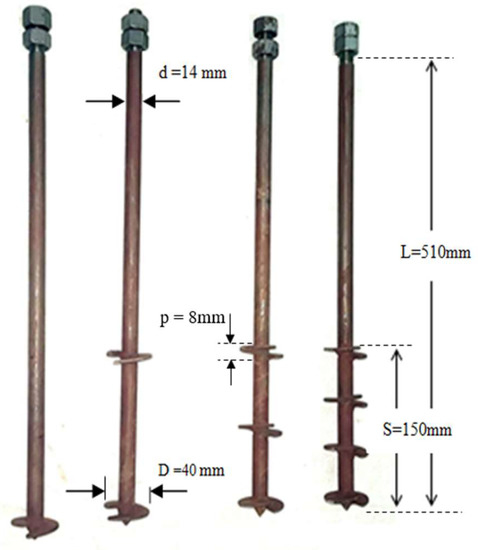
Figure 1.
Casted helical piles with dimensions.

Table 1.
Overview of testing program.
2.1. Theoretical Investigation
2.1.1. Uplift Capacity of Helical Pile
The equations for the axial capacity of helical piles were first developed by Mitsch and Clemence [10] for designing multi-helix anchors in cohesionless soil and the same by Rao et al. [8] and Mooney et al. [9] for designing in cohesive soils. For multi-helix helical piles, two types of failure mechanisms were observed, namely the cylindrical failure model and the individual bearing model, as shown in Figure 2a,b, respectively, for uplift loading conditions.
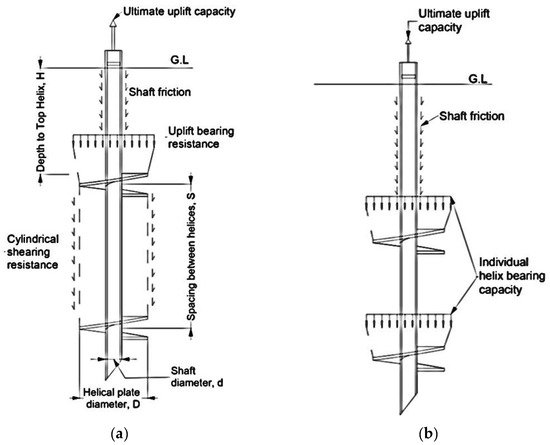
Figure 2.
Mode of failure mechanism under uplift loading: (a) Cylindrical shear failure, and (b) Individual bearing failure.
The transition between the two failure mechanisms depends on the critical spacing ratio (S/D), which is the ratio of the distance between two helices (S) to the helical plate diameter (D). The equation that Mooney et al. [9] and Rao and Prasad [24] came up with to figure out the uplift bearing capacity when the cylindrical failure mechanism is taken into account is as follows:
where Qu = ultimate uplift/tensile capacity of helical pile; D = diameter of helical plate (m); d = diameter of helical pile shaft (m); Lc = spacing between top and bottom helical plates (m); cu = undrained shear strength of soil (kN/m2); AH = area of helical plate (m2); γ’ = effective unit weight of soil (kN/m3); H = embedment depth to top helix (m); Heff = effective pile length above top helix (m) (Heff = H − D); α = adhesion factor; Nu = uplift bearing capacity factor = , [25,26]; and Sf = spacing ratio factor.
The helical piles undergo individual bearing failure mechanisms when the helical plates are spaced with a spacing ratio of more than 1.5. Thus, the ultimate uplift capacity equation recommended by Rao and Prasad [24] and Nasr [27] is expressed as
where and .
2.1.2. Lateral Capacity of Helical Pile
In addition to the axial forces, the helical piles were subjected to lateral forces also as discussed earlier. One of the helical pile manufacturers Hubbell/Chance [28] said that it is necessary to evaluate the helical pile under lateral loading conditions for a better understanding of these anchors. Several studies on helical anchors were conducted to determine lateral capacity by taking into account size, location of the upper helical plate, and number of plates [13,15,19,22]. From the results obtained, it is found that the helical pile offers 1.2 to 3 times greater lateral resistance than a straight or conventional pile without a helical plate.
Prasad and Rao [22] conducted an experimental investigation to determine the lateral capacity of a helical pile and suggested an equation to derive lateral capacity considering various resisting forces acting on the pile when lateral load is applied. The various forces include lateral resistance from the soil on the shaft of the pile, bearing resistance at the bottom of the helical plate, uplift resistance force on top of the helical plate and frictional resistance at the surface of the helical plate. Considering these forces acting on the helical pile, the equation to determine the lateral capacity of a helical pile having four helical plates is given by
The distance to point of rotation X by moment equilibrium from the ground surface is given by
where,
where, and .
Where, R = radius of helical plate (m); r = shaft radius (m); e = eccentricity of loading from ground surface (m); h1, h2, h3, h4 = height of first (top), second, third, and fourth (bottom) helixes from ground surface respectively in (m); pu1, pu2, pu3, and pu4 = ultimate uplift resistances on helical plates 1, 2, 3, and 4, respectively, and pb1, pb2, pb3, and pb4 = ultimate bearing resistance of four helical plates. Figure 3 shows the various forces acting on a helical pile in remolded clay when subjected to lateral load.
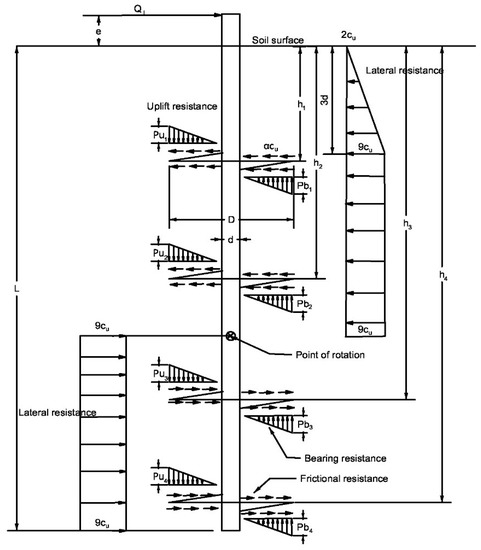
Figure 3.
Helical pile at ultimate lateral load [22].
Similarly, the equations for the helical piles with different numbers of plates are obtained by reducing the above equation accordingly. The results obtained using this equation have good agreement with the results from experimental work, but it is still required to verify them with field investigation results [22]. Later in this paper, the above equation is used to estimate the lateral capacity of a helical pile and is compared with the numerical results for validating purposes.
2.2. Numerical Investigation
Behavioral studies on helical piles using numerical simulations can be found in the various literature. Merifield [29], Bezuijen et al. [30], and Wang et al. [31] performed numerical analysis on helical piles considering a 2D axisymmetric condition for a pile undergoing vertical loading. The material properties and shaft geometry are not considered since the model is taken as a rigid plate. Further, multiple anchors were put to test under vertical and lateral loading conditions using three-dimensional finite element modeling with and without considering the helical shape of the plate [19,32,33]. However, the consideration of helical pile pitch led to a small increase in helical pile capacity by 5% for vertical loading and 1% for lateral loading [19].
The three-dimensional finite element analysis software Plaxis 3D is used to study the helical pile behavior under uplift, lateral, and combined loading conditions. In this study, the soil element is modeled using the real parameters that were obtained from conducting laboratory experiments.
2.2.1. Modeling and Input Data
In numerical analysis, the soil is modeled as a hardening soil model and is composed of 10 node tetrahedral elements. The piles are modeled as a 3D volume element in order to simulate the bending stiffness of the pile shaft. A non-porous linear elastic material is assigned with moment of inertia and stiffness properties, which generates equivalent bending stiffness as the modeled helical pile. The plate element is composed of a 6-node triangular plate element with a low equivalent bending stiffness value of 10−6 times less than the soil volume element and is assigned to the shell of the pile shaft surrounding the soil volume element. This is done to ensure suitability of the connection of helical plates to the pile shaft in Plaxis 3D, shaft geometry, and application of interface elements [19]. The helical plates are modeled as planar considering that the capacity differences are negligibly small when pitch is considered, as discussed earlier. The helical plates are composed of the same 6 node triangular element. The properties of steel and the thickness are given to the helical plate and pile volume. To allow the breakaway condition between the soil and helical pile and to avoid the tension on helical anchors from soil, interface elements are created to simulate soil–structure interaction. The interface parameters were chosen to be equivalent to the surrounding soil while assuming a drained state (effective stress parameters) with the Rinter ≈ 0.65. These values were chosen after doing several analyses with different values for the stiffness of the interface. The element parameters and their purposes used in this study are illustrated in Table 2.
Table 2.
Element parameters and properties to simulate helical anchor model.
2.2.2. Mesh Details
Simulation of helical piles subjected to uplift and lateral loading conditions requires sufficiently large enough model space to minimize boundary effects. According to the previous literature, the normalized model dimensions in the X and Y directions are 20 to 80D, and in the Z direction, ranges between 0.5 and 2L were used to avoid boundary effects. Figure 4 shows the generated mesh with mesh dimensions. It was decided to conduct a mesh independence study (MIS) in order to avoid subjectivity in the determination of model dimensions. The MIS was carried out in order to analyze the relationship between the number of elements and the computed response (for example, predicted resistance). In the current study, a model with X and Y = 25D and Z = 2L is considered for the MIS study. In Plaxis-3D software, the available mesh distribution options say very coarse, coarse, medium, fine, and very fine mesh responses were computed and compared. As a result, no significant benefit is achieved from very fine meshing compared to fine mesh, so the fine element distribution option was chosen for all analyses, along with local refinement for the pile geometry (local element refinement factor = 0.125) to gradually reduce the element size near the pile geometry in order to obtain accurate results [19].
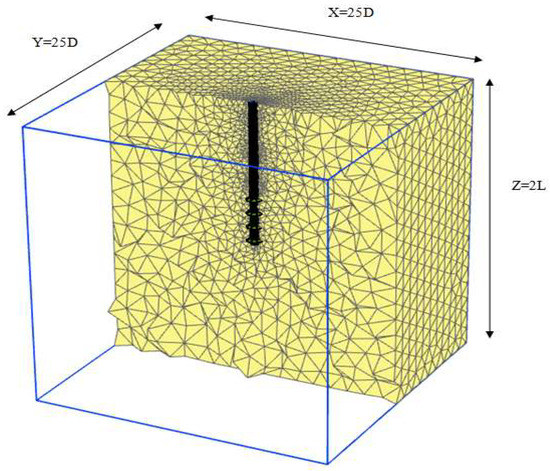
Figure 4.
Generated Mesh with mesh dimensions.
2.2.3. Analysis Procedure
In the field situations where a small deformation is considered to indicate failure, a standard finite element analysis was used for onshore foundations and excavation problems based on serviceability limits. For this kind of behavior, a conventional Eulerian finite element approach is used to solve the small deformations for a constant volume. Lagrangian approaches are typically used in other applications where large or substantial deformations are expected, such as reinforced embankments (e.g., using geosynthetics) or offshore applications, and in particular for the failure situations addressed here. The Lagrangian formulation is accessible in Plaxis 2018 by enabling the updated mesh option, and this was the method used in this investigation. Figure 5a,b show an example of the differences between computed results with and without an updated mesh for uplift and lateral capacity of the helical pile type SHP-4-8.75, respectively. For uplift loading, small difference is observed, and for lateral loading, the result starts to diverge at large deformation. Since the failure criteria affects the interpreted capacity from the numerical analysis. The updated mesh analysis is carried out in this work assuming the system undergoes large deformation under failure conditions.
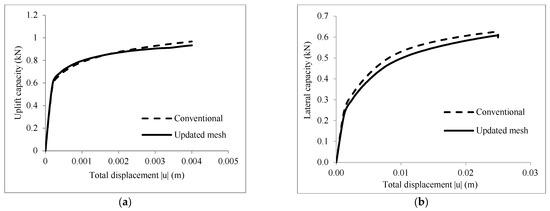
Figure 5.
Conventional analysis (Eulerian) vs. Update mesh analysis (Lagrangian) under (a) Uplift loading; and (b) Lateral loading.
For the numerical simulations, an elastic perfectly plastic constitutive soil model was utilized in conjunction with Tresca yielding criteria. This model was chosen because of its simplicity, ability to address yielding around the anchor, and limited computational complexity, as well as interaction between the shaft and plates. Thus, lateral and pullout anchor capacities, which are reliant on deformation are somewhat dependent on the simulated elastic stiffness also [34].
2.2.4. Simulated Loading Procedure
The loading procedure is carried out in the analysis is of two methods. In the first method, the helical pile is subjected to individual simulation under either pure uplift load or pure lateral load. The first method consists of three phases in staged construction. In the first phase, the initial stresses were activated, that is geostatic stress for soil, generating the Ko consolidation where Ko = 1 − sinϕ. In the second phase the pile geometry and interfaces are activated. The third phase involves load application; either uplift or lateral load is applied separately by means of displacement control and the ultimate uplift and lateral capacity are found. The failure criterion to determine the ultimate uplift capacity (Qu) was based on the load taken by the pile to displace the pile head by 10% of the equivalent helical plate diameter (D = 40 mm) (i.e., 4 mm) [19]. The same procedure is followed to determine ultimate lateral capacity (Ql), where the failure criteria is defined as the half of the load that causes the pile head to displace 25 mm from its original position [7].
The second method of loading consists of four phases in which combined loading is applied. The first two phases are the same as in the previous method. In the third phase, the point load is applied by means of a percentage of the obtained uplift capacity, say 25% and 50%. In the fourth phase, the uplift load is kept constant, and the lateral load is applied as displacement control. The same kind of approach is found in previous literature [19,35,36].
2.2.5. Modeling Limitations
Some restrictions must be noted for the modeling circumstances that have been established. Displacement of the anchor head during the loading process might alter the load inclination angle. However, this movement is thought to be insignificant because the load inclination angle is governed primarily by the water depth and line length, rather than anchor head displacements. Direct installation consequences, such as soil disturbance caused by the plates being cut and moved by the shaft, were not taken into consideration in this study. Such impacts are especially significant in sensitive soils, according to research by Weech and Howie [37] and Bagheri and El Naggar [38], which also demonstrated that decreasing the undrained shear strength to its residual value is reasonable. Consequently, if the undrained shear strength is assumed to be residual, installation effects will be taken into consideration in some way. Pore water dissipation after installation was not taken into consideration, which may have resulted in an underestimation of the overall capacity [37]. In this experiment, immediate breakaway or separation at the anchor–soil interface was reproduced under perpendicular tension loads, but in reality, some suction from this cohesive material may be present throughout the early phases of loading. As a result of this partial suction, the overall resistance may rise for small displacements, which the soil model may account for with a constant modulus. However, such effects are not taken into consideration because failure is expected under large deformations.
2.3. Experimental Investigation
2.3.1. Material Used and Test Setup
- Soil: The soft clay soil obtained from Kalathur lake situated near Ocheri in the Vellore district of Tamil Nadu, India, is used for the present study. The properties of the soft clay are: liquid limit (LL) = 52%, plastic limit (PL) = 27%, plasticity (Ip) = 25%, and undrained shear strength (cu) at the consistency (Ic) of 0.5 = 7.5 kN/m2. The soil is classified as clay with high compressibility (CH) type as per the Indian standard classification system.
- Helical pile: Model helical pile material and dimensions are chosen in accordance with similitude regulations. The size of model helical piles should be carefully scaled down in comparison to the size of the prototype. Nevertheless, owing to the difficulties in fabricating a scaled-down size of model helical pile for a given size of prototype, the size of the model pile in the current work is set based on the sizes that are available on the market. The model is made of the steel solid circular rod having a shaft diameter of 14 mm and a helical plate diameter of 40 mm with a 2 mm plate thickness and a pitch of 8 mm, cut and welded to the shaft as mentioned earlier. It has been decided to use the scaling law given by Wood et al. [39] in this investigation:where n = scale factor, Em = elasticity modulus of model pile, Ep = elasticity modulus of prototype pile, Im = moment of inertia of model pile, and Ip = moment of inertia of prototype pile. For an assumed prototype the hollow helical pile was made of steel having an outer shaft diameter (d) of 100 mm, a thickness of 10 mm, and helical plate diameter (D) of 285 mm, assuming d/D ratio = 2.85, which is the same as the model pile, the scaling factor is estimated as 4.53. All other parameter considerations are discussed earlier.
2.3.2. Test Setup and Loading Procedure
A 1 g small-scale laboratory test is carried out to test the suitability of the numerical model. The experiments were conducted on helical piles having an H/D ratio of 8.75 and 6. In addition, the spacing ratio S/D is varied as 3.75, 1.875, and 1.25 for helical piles having a number of helical plates of 2, 3, and 4, respectively. Other details are mentioned in Table 1. According to Mooney et al. [9], by keeping the diameter of the test tank at approximately six times the anchor diameter, boundary effects could be eliminated completely for uplift loading. Considering the elimination of boundary effects, a test tank dimension of 1 m × 1 m × 1 m is used. The soft clay bed is prepared following the procedure adopted by Rao and Prasad [24]. All tests were carried out on a soil bed with a water content of 39%, corresponding to a consistency index of Ic ((LL − water content)/(LL − Ip)) of 50%. The undrained shear strength (cu) of the prepared soft clay bed is measured at various depths after each test by using vane shear test apparatus by collecting random samples, and the value is found to be an average of 7.5 kN/m3. The soil taken from the field is kneaded thoroughly and soaked by adding water to the soil mixing tank. The kneaded soil is covered with polythene sheets in order to avoid evaporation and loss of moisture content. The wet soil with higher water content makes the filling job easy and is placed in layers of 50 mm thick. Initially, each layer is manually placed by hand packing and then pressed with a template to remove the entrapped air. Because of the high water content, a legitimately homogeneous soft clay bed could be formed. The homogeneity of the prepared clay bed is confirmed by testing a few random samples to determine water content, unit weight, and undrained shear strength at different levels while placing the sample after the test. The average test results show a water content of 39 ± 3%, a unit weight of 17 ± 0.5 kN/m3, and an undrained shear strength of 7.5 ± 0.3 kN/m3.
Once the clay bed has been prepared, the helical pile is installed in place by screwing it slowly into the remolded clay bed with sufficient downward force until it reaches the required embedded depth. It is necessary to drive the pile in such a way that its rate of advancement is equal to or greater than the pitch of the helical plate (which is 8 mm per rotation) [40]. Random samples were taken from the test tank and tested in triaxial testing assembly. It is found that the sample takes a time interval of 24–36 h for 95% equilibration of pore pressures. Thus, the setup is left for three days before testing the helical pile. During the process, the clay bed is covered with polythene sheets in order to reduce the loss of moisture content.
The loading method is carried out in accordance with AC 358: Acceptance Criteria for helical pile foundation systems and devices [41]. The procedure E: constant rate of uplift test, as specified in ASTM D3689-07 [42], is used for the uplift test. The uplift load is measured using a 20 kN capacity load cell that is mounted with the ram attached to the static pullout test apparatus. A constant uplift rate of about 1 mm/min is applied and the pullout is carried out until the pile withdrawal reaches 15% of the anchor diameter or until the pile withdrawal stops, whichever occurs first. The ultimate lateral capacity of helical pile is found by adopting the loading procedure followed by Mittal et al. [13]. The lateral load is imposed by adding cast iron weights over a load hanger attached to the free end of the pile using steel wire. Observations of lateral displacement were made until there was no further increase in lateral deflection in response to the applied force. In both cases, the displacement is measured using a set of Hottinger Baldwin Messtechnik (HBM) made displacement transducers (WA-200 mm) and an average value is taken. QuantumX: the universal and distributable data acquisition system is used to record accurate real time data. Figure 6a–d depict a schematic view of the experimental setup and measurement arrangements.
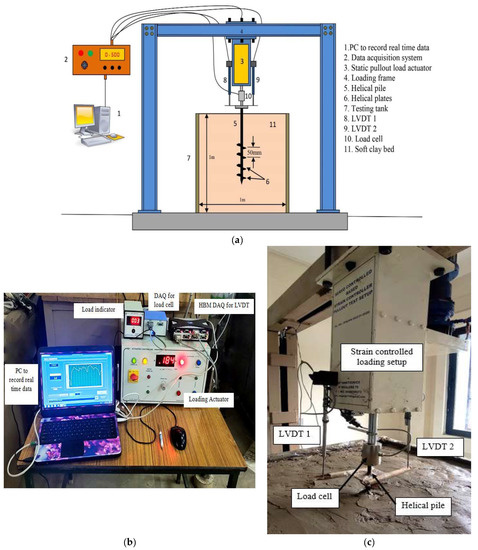
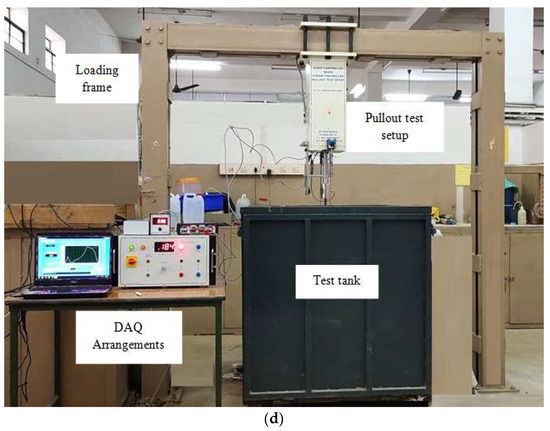
Figure 6.
(a) Schematic view of the experimental setup (Uplift loading); (b) Data Acquisition Arrangements (DAQ); (c) Completed test installation of Helical pile and LVDT arrangements prior to Loading; and (d) Pictorial view of the Experimental Test Setup-Uplift loading.
3. Results and Discussions
The assumptions made within the 3D finite element analysis software were validated against results from a theoretical model and a 1 g small scale experimental investigation. In this section the results and comparison of simulated results with analytical and experimental results are discussed.
3.1. Effect of Installation
The installation of helical piles is accomplished by imparting torque to the shaft. Making substantial shear stresses in the soil by turning the helices causes significant soil disturbance and alteration of the soil’s structural characteristics [37,43]. Several studies discussed the disturbance that was caused to soil as piles were driven into the ground. Trofimenkov and Maruipolshii [44] compared the results of the uplift and compression capacity of a single helix pile and found that the disturbed zone of soil above the helix and close to the installation path increased the compressive capacity by 1.4 to 1.5 times its equivalent uplift capacity. Furthermore, Ali [45] reported that after a certain critical embedment depth ratio, the failure mode under the uplift and compressive loads remains similar. This is due to the fact that the soil bed is made of remolded clay and the strength loss due to installation disruption was negligible.
The advancement of the pile shaft into the earth and the rotation of the helical plates are responsible for the cause of the soil disturbance, while the disturbance caused due to shaft advancement is expected to be greater than the helical plate penetration. The helix plates disrupt soil by cutting spirally at intervals corresponding to the pitch spacing, shearing, and displacing the soil traversed by the helix vertically and laterally. From the previous laboratory studies on model helical anchors installed in remolded clay beds [9,22,24], it is observed that the strength of remolded clay soil does not change significantly. As a result, the installation effects of remolded clay materials are difficult to differentiate.
Thus, the soil disturbance caused due to the pile installation and the shearing from helices is not considered in this study, assuming that the loss in strength due to installation is negligible in remolded clay materials. Furthermore, the remolded undrained shear strength is used to figure out capacities and make numerical evaluations.
3.2. Results of the Parametric Study
The concepts of studying the effects of varying different parameters for single helical piles are already well established and found in much literature, as discussed earlier. Still, for this study to validate the predicted FEA results with the analytical data results and experimental results, a comparison was made by varying the embedment depth ratio and the spacing ratio of the helical pile. However, the pile shaft diameter, helical plate diameter, pitch of the helical plate, and length of the pile are kept constant for all the cases. The load–displacement curve obtained from the numerical analysis for the helical pile subjected to uplift and lateral loads is depicted in Figure 7 and Figure 8, respectively.
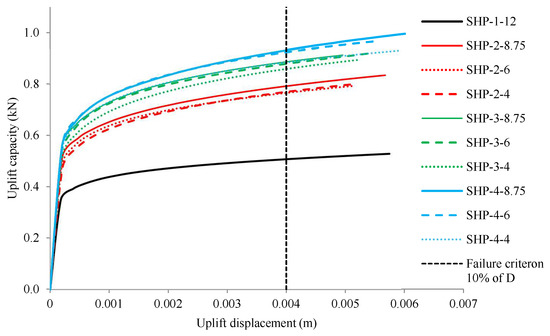
Figure 7.
Load–displacement curve for uplift capacity of helical pile.
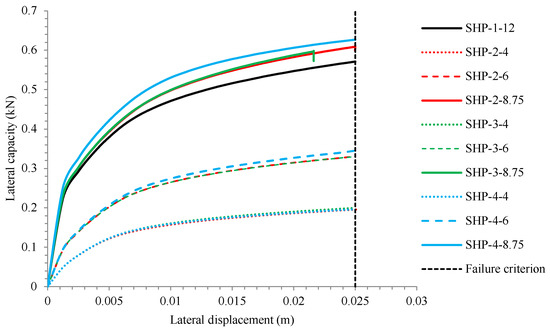
Figure 8.
Load–displacement curve for lateral capacity of helical pile.
The load–displacement behavior seen in all of the repetitions appears to be consistent. As previously discussed, the ultimate uplift capacities are defined as the load that causes an uplift displacement of 10% of the helical plate’s diameter, that is 10% of 40 mm (4 mm). The ultimate lateral capacities are measured as half of the load that causes the pile head to displace laterally by about 25 mm from its original position. From Figure 8 and Figure 9 it is clear that the capacities are significantly increased with an increase in embedment depth ratio and number of helical plates. Experimental investigations conducted by Rao et al. [8] for the uplift capacity and Prasad and Rao [22] for the lateral capacity for a pile embedded in marine clay also obtained a similar behavior. However, the influence of soil consistency, moisture content, and soil strength also affect the tensile and lateral capacity, which is kept constant in this study.
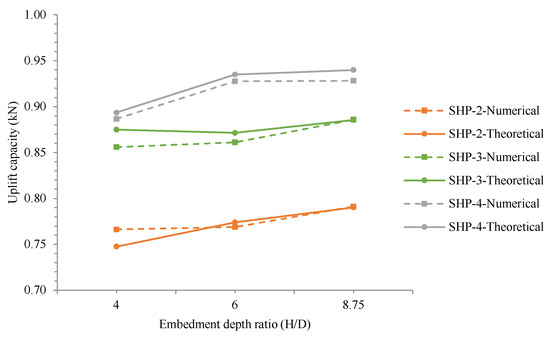
Figure 9.
Comparison between theoretical and numerical results—Uplift loading.
The results of uplift and lateral capacity for a helical pile obtained using theoretical, numerical, and experimental investigations are given in Table 3.
Table 3.
Theoretical, numerical, and experimental results of uplift and lateral capacity.
Figure 9 and Figure 10 show the comparison between theoretical and numerical results for the uplift and lateral capacities, respectively. It is observed that in the case of uplift loading, the increase in the embedment depth ratio has less effect on capacity increase. In addition, the model underpredicts the capacity in most cases. However, in the case of lateral capacity the model over-predicts the capacity values while comparing them with the theoretical results.
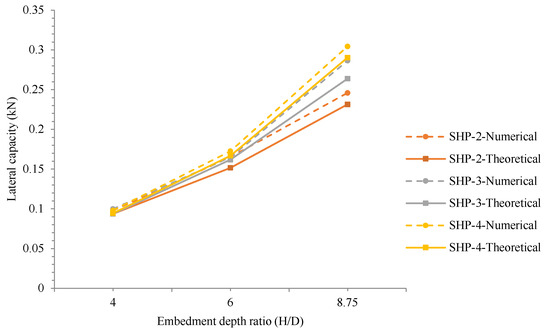
Figure 10.
Comparison between theoretical and numerical results—Lateral loading.
The maximum percentage variation is found to be 5% and 8% in the cases of uplift and lateral tests, respectively. In the case of lateral loading, the embedment depth ratio and the number of plates influence the capacity values significantly. In addition, increasing the eccentricity of loading decreases the lateral capacity substantially. When comparing the lateral capacity of the four-plated helical pile to that of the one-plated helical pile, a maximum of a 48% increase is observed. The reason behind this may be that increasing the number of helical plates increases the bearing resistance and uplift resistance, which leads to an increase in capacity. Figure 11a,b show the comparison of the load–displacement curve for experimental and numerical results of uplift loading.
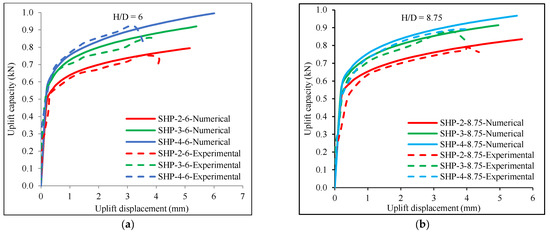
Figure 11.
Comparison between Experimental and Numerical results—Uplift loading, (a) H/D = 6; and (b) H/D = 8.75.
Figure 12 shows the load–displacement curve obtained experimentally for helical piles subjected to lateral loads. A similar behavior is seen from the load–displacement behavior graph for all pile types.
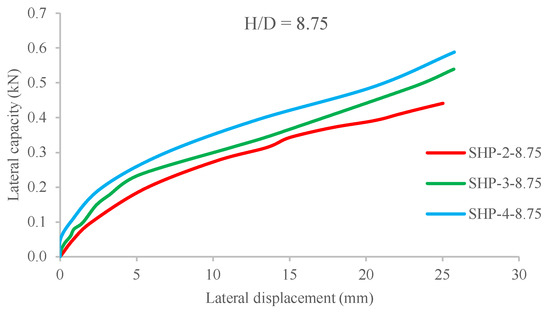
Figure 12.
Load–displacement curve for Lateral loading—Experimental.
Figure 13 shows a typical displacement contour of a fully embedded helical pile under uplift load. It is clear that the piles having a spacing ratio of less than two, that is SHP-3 and SHP-4, seem to fail forming a cylindrical failure mechanism. The failure contours also seem to be the same as observed in previous research [8,32,43]. As seen from Table 3, there is a close covenant between the numerical model assumed here against theoretical results and experimental results analyzed here. It is also noticed from Figure 14 that the capacity ratios between experimentally obtained capacity and theoretically obtained capacity have a close agreement with the capacities obtained from the proposed numerical model. In the majority of all cases, the differences in calculated and experimental capacity values are found to be within 10% of the predicted values, which is suitable for design purposes.
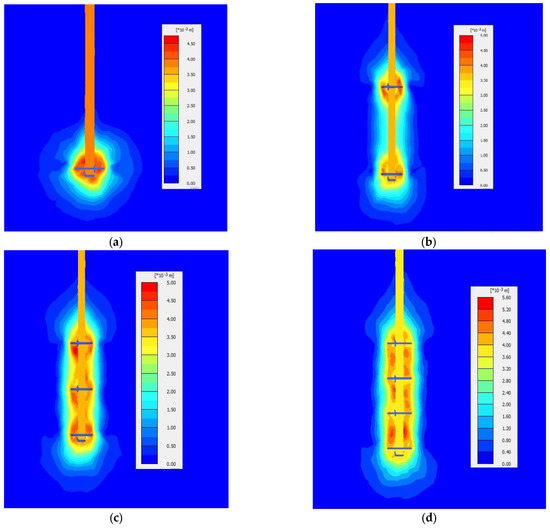
Figure 13.
A typical displacement contour of a fully embedded helical pile under uplift load is shown in cross section. (a) SHP-1-12; (b) SHP-2-8.75; (c) SHP-3-8.75; and (d) SHP-4-8.75.
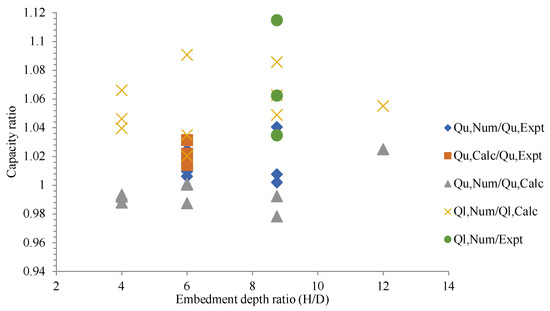
Figure 14.
Capacity ratio vs. Embedment depth ratio.
3.3. Results of Combined Loading
As the proposed model predicts the capacity with a good agreement, with the same model the combined loading analysis is carried out. The lateral response of the helical pile subjected to uplift loading is studied in the first case and later the uplift response to the laterally loaded helical pile is studied. In both cases, combined loading analyses are conducted on fully embedded piles only and the findings are reported below.
3.3.1. Uplift Loading Effect on Lateral Capacity of Helical Pile
A series of numerical analyses were done on a fully embedded single helical pile in order to study the influence of uplift load on the lateral capacity of the helical piles. The spacing ratio and the number of helices are varied and the embedment depth ratio is kept constant. The numerical analysis is carried out by applying a simultaneous lateral load and uplift load on the helical pile. Figure 15 shows the effect on lateral capacity when the helical pile is subjected to uplift loading as Q = 0, 0.25 Qu,ult, and 0.5 Qu,ult. It is evident that the lateral capacity decreases when the helical pile is subjected to uplift load. Al-Baghdadi et al. [19] reported the same for multi-plate helical piles embedded in cohesionless soil subjected to combined loads.
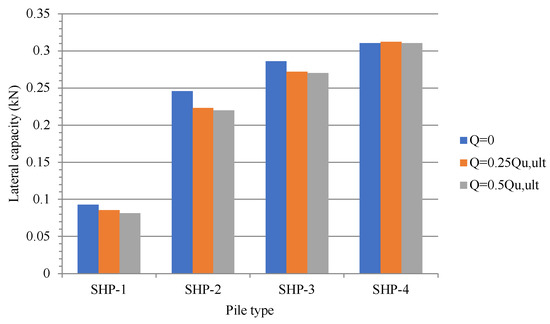
Figure 15.
Effect of uplift loading on lateral capacity of helical pile.
The ultimate lateral capacity of the helical pile constructed as per IBC [7] for the analyzed piles under different loading conditions and the measured values are presented in Table 4. It is seen from the table that the greater the magnitude of uplift load applied, the greater the percentage decrease. When the pile SHP-1 having a lateral capacity of 0.0928 kN is subjected to 25% and 50% uplift loads, there is a nearly 8% and 12% reduction in lateral capacity, which is 0.0854 kN and 0.0814 kN, respectively. Furthermore, increasing the number of helical plates from SHP-1 to SHP-4, the percentage decrease almost equals zero. Thus, designing a helical pile and choosing the number of helical plates possesses a vital role in the reduction of lateral capacity. As seen from Figure 15, it is clear that the reduction in lateral capacity is recovered as the number of helical plates is increased. From a design viewpoint, this recommends that the inclusion of more helical plates is essential whenever the pile needs to withstand lateral forces with tension loads. The reason for the recovery in lateral capacity due to a further increase in tensile load is explained by Al-Baghdadi et al. [19] as the upward movement of a helical pile tends to increase the radial stress with depth.
Table 4.
Ultimate lateral capacity with and without uplift load.
Figure 16 shows the variation of bending moment with depth for a helical pile subjected to pure lateral, and then under combined lateral and uplift loading. The arrow in the figure represents the direction of loading. It is seen from the result that the uplift capacity induces more bending moment at the core of the shaft. The plastic moment capacity of the pile considered here is Mp = 0.190 kNm (D = 14 mm and steel yield strength, σy = 415 MPa). The maximum bending moment caused by the combine loading is significantly less compared to plastic moment capacity; hence no plastic hinge is formed in this case. It is important to keep in mind that screw piles that are designed to resist lateral movement may need to have bigger cross-sections to be able to withstand more weight. Moment capacity, on the other hand, may be a factor that cannot be ignored when designing screw piles.
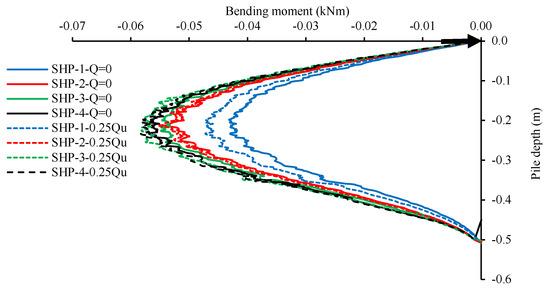
Figure 16.
Variation of BM with depth of pile under pure lateral and combined loading.
3.3.2. Lateral Loading Effect on Uplift Capacity of Helical Pile
To study the effect of lateral load on the uplift capacity of a helical pile, numerical analyses were carried out on fully embedded helical piles. Four helical piles having a different number of plates and spacing ratios were analyzed. Figure 17 shows the comparison on load–displacement curves of helical pile uplift capacities when subjected to pure uplifts and with lateral loads. It is clear that the uplift capacity of a helical pile is enhanced when it is subjected to lateral load. The loading is done in two phases; first the ultimate lateral load calculated previously is applied on the pile head and then the combined uplift load is applied, which is the load required to displace the pile by 4 mm (10% of D). The increment in uplift capacity is also observed by Reddy and Ayothiraman [46] for straight shafted piles embedded in cohesionless soil when subjected to combined uplift and lateral loads.
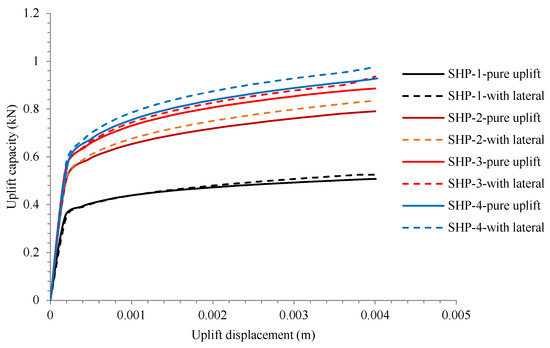
Figure 17.
Effect of lateral loading on uplift capacity of helical pile.
The ultimate uplift capacity is interpreted as per previous studies and IBC [7] for the analyzed helical piles under the lateral load and results after the combined influence of uplift and lateral loading is presented in the Table 5. It is clear that even when the number of helical plates increases, its effect on increasing the uplift capacity is not effective. However, a maximum increase of almost 6% is observed.
Table 5.
Ultimate uplift capacity with and without lateral load.
Figure 18 shows the displacement contours of a cross section at midway of helical piles under combined loading. Compared with Figure 13, the developed failure contour near the pile head, the soil seemed to mobilize with pile movement due to the applied lateral load. This formed the failure surface consistent with the existing cylindrical shear failure surface observed while piles were subjected to uplift load.
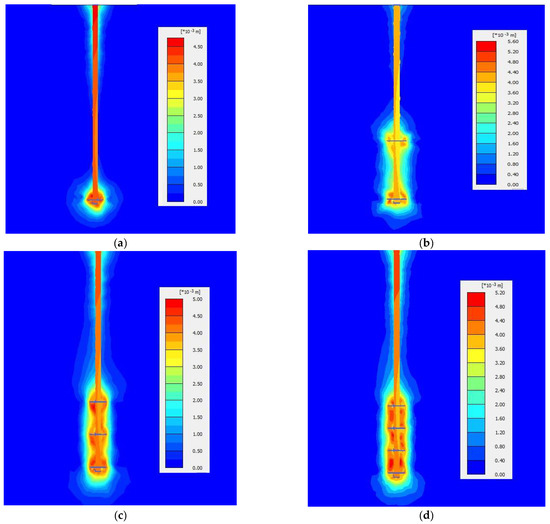
Figure 18.
Variation of displacement contours with different number of plates under combined loading: (a) SHP-1-12; (b) SHP-2-8.75; (c) SHP-3-8.75, and (d) SHP-4-8.75.
3.4. Limitation of the Study
Despite the findings from numerical analyses, the analytical and experimental results concur well. There are various restrictions to consider before utilizing the model in the field. Several proposed methods are available to determine the uplift and lateral capacity of a helical pile. In this study, methods proposed by Mooney et al. [9] and Rao and Prasad [24] were used to calculate the uplift capacity and the method proposed by Prasad and Rao [22] was used to calculate the lateral capacity. The results are compared with the helical pile capacity determined using the predicted results of the numerical model, also some experimental tests are carried out to validate the FEA results. Figure 14 shows the agreement ratio between all the methods used to calculate capacity and compares it with the numerical results. Even though the prediction is good, it is best to only use this model after including the right correlation factors from field testing results. This means taking into account the effects of installation, the sensitivity of the soil, the consistency of the soil at the field, and the adhesion factor. The significant response of a helical pile is greatly affected by combined loads and is primarily dependent on various parameters such as the diameter of the helical pile, the length of the pile, and the varying soil conditions, which are not discussed in this study.
The installation effect is considered negligence as the model is verified for a pile installed in a remolded clay sample. In practice, however, the reduction in soil strength caused by pile installation is more severe in soils near the helices edge than in soil beyond the helix’s edges. As a result, the critical spacing ratio for multi-helix piles installed in natural clay deposits may be exceeded.
4. Conclusions
The 3D finite element analysis is carried out on the helical pile model to study the effect of uplift load on the lateral capacity of helical piles and the effect of lateral load on the tensile capacity of the helical piles. The modeling and numerical analysis was first compared for individual load on a helical pile with the analytical and experimental results and then the validated model is used to study combined loading behavior. From the combined loading analysis of the helical pile embedded in soft clay, the following conclusions are drawn:
- The proposed numerical model made a good prediction of the uplift and lateral capacities of the helical pile and can be employed for field application considering some correlating factors related to in situ soil conditions. Compared with the theoretical results, the predicted results have a maximum percentage variation of 5% and 8% in the case of uplift and lateral capacity, respectively. The results from laboratory tests on remolded clay beds varied within 10% and the proposed model is suitable for design purposes.
- The uplift and lateral capacities increase with the increasing number of helical plates and embedment depth ratio. The reason behind this, as reported by previous literature, is that increasing the number of helical plates increases the bearing resistance and uplift resistance, which leads to an increase in capacity. In the case of lateral loading, their influence on the capacity values is greater. Furthermore, increasing the eccentricity of loading decreases the lateral capacity substantially.
- The lateral capacity of the helical pile decreases when it is subjected to combined uplift loads. However, the magnitude of an applied uplift load has less effect on the decrement of capacity. According to the numerical results, increasing the number of helical plates appears to restore the lateral capacity. As a result, the inclusion of a helical plate should be seen as critical from a design standpoint.
- The combined loading also increases the bending moment at the central core and this increment leads to a limitation in choosing pile geometry while designing helical piles to produce significant lateral resistance.
- The effect on the uplift capacity of a helical pile due to lateral load is to increase the capacity by almost 6%. The observed percentage increase seems less effective at increasing the number of helical plates. From the failure contours of combined loading, it is observed that the soil mobilized near the pile head due to lateral movement of the pile, and that failure contours developed along with the cylindrical shear failure surface.
Author Contributions
The author V.V. contributed in carrying out the experimental investigation and numerical analysis. The corresponding author M.M. reviewed the manuscript. All authors have read and agreed to the published version of the manuscript.
Funding
This research received no external funding.
Institutional Review Board Statement
Not applicable.
Informed Consent Statement
Not applicable.
Data Availability Statement
Not applicable.
Conflicts of Interest
The authors declare no conflict of interest.
References
- Ghaly, A.M.; Hanna, A.M.; Hanna, M.S. Uplift Behavior of Screw Anchors in Sand. J. Geotech. Eng. 1991, 117, 773–794. [Google Scholar] [CrossRef]
- Saeki, E.; Ohki, H. A Study of the screwed pile—The results of installation and loading tests and analysis of penetration mechanism. In Deep Foundations on Bored and Auger Piles; Van Impe, W.F., Ed.; Millpress: Rotterdam, The Netherlands, 2003; pp. 259–266. [Google Scholar]
- Sakr, M. Retracted: Relationship between Installation Torque and Axial Capacities of Helical Piles in Cohesionless Soils. J. Perform. Constr. Facil. 2015, 29, 04014173. [Google Scholar] [CrossRef]
- Lutenegger, A.J. Cylindrical shear or plate bearing?—Uplift behavior of multi-helix screw anchors in clay. In Contemporary Topics in Deep Foundations; American Society of Civil Engineers: Reston, VA, USA, 2009; pp. 456–463. [Google Scholar]
- Perko, H.A. Helical Piles: A Practical Guide to Design and Installation; John Wiley & Sons Inc: Hoboken, NJ, USA, 2009. [Google Scholar]
- Muthukumar, M.; Shukla, S.K. Comparative Study on the Behaviour of Granular Pile Anchors and Helical Pile Anchors in Expansive Soils Subjected to Swelling. Int. J. Geotech. Eng. 2020, 14, 49–54. [Google Scholar] [CrossRef]
- International Code Council (ICC). 2015 International Building Code (IBC). Available online: https://codes.iccsafe.org/content/IBC2015/chapter-18-soils-and-foundations?site_type=public (accessed on 16 May 2022).
- Rao, S.N.; Prasad, Y.V.S.N.; Shetty, M.D. The behaviour of model screw piles in cohesive soils. Soils Found. 1991, 31, 35–50. [Google Scholar] [CrossRef] [Green Version]
- Mooney, J.S.; Adamczak, S.; Clemence, S.P. Uplift Capacity of Helix Anchors in Clay and Silt; American Society of Civil Engineers: Reston, VA, USA, 1985. [Google Scholar]
- Mitsch, M.P.; Clemence, S.P. The uplift capacity of helix anchors in sand. In Uplift Behavior of Anchor Foundations in Soil; American Society of Civil Engineers: Reston, VA, USA, 1985. [Google Scholar]
- Rao, S.N.; Prasad, Y.V.S.N.; Veeresh, C. Behaviour of embedded model screw anchors in soft clays. Géotechnique 1993, 43, 605–614. [Google Scholar] [CrossRef]
- Meyerhof, G.G.; Adams, J.I. The ultimate uplift capacity of foundations. Can. Geotech. J. 1968, 5, 225–244. [Google Scholar] [CrossRef]
- Mittal, S.; Ganjoo, B.; Shekhar, S. Static equilibrium of screw anchor pile under lateral load in sands. Geotech. Geol. Eng. 2010, 28, 717–725. [Google Scholar] [CrossRef]
- Ding, H.; Wang, L.; Zhang, P.; Le, C. Study on the Lateral Bearing Capacity of Single-Helix Pile for Offshore Wind Power. In Proceedings of the ASME 37th International Conference on Ocean, Offshore and Arctic Engineering, Madrid, Spain, 17–22 June 2018; pp. 1–6. [Google Scholar]
- Abdrabbo, F.M.; El Wakil, A.Z. Laterally Loaded Helical Piles in Sand. Alex. Eng. J. 2016, 55, 3239–3245. [Google Scholar] [CrossRef] [Green Version]
- Sakr, M. Performance of Helical Piles in Oil Sand. Can. Geotech. J. 2009, 46, 1046–1061. [Google Scholar] [CrossRef] [Green Version]
- Sakr, M. Lateral Resistance of High Capacity Helical Piles: Case Study. In Proceedings of the 63rd Canadian Geotechnical and 6th Canadian Permafrost Conference, Calgary, AL, Canada, 12–16 September 2010; pp. 402–412. [Google Scholar]
- Elkasabgy, M.A.; El Naggar, M.H. Lateral performance of large-capacity helical piles. In Proceedings of the IFCEE 2015, San Antonio, TX, USA, 17–21 March 2015; American Society of Civil Engineers: Reston, VA, USA, 2015. [Google Scholar]
- Al-Baghdadi, T.A.; Brown, M.J.; Knappett, J.A.; Al-Defae, A.H. Effects of Vertical Loading on Lateral Screw Pile Performance. Proc. Inst. Civ. Eng.—Geotech. Eng. 2017, 170, 259–272. [Google Scholar] [CrossRef] [Green Version]
- Puri, V.K.; Stephenson, R.W.; Dziedzic, E.; Goen, L. Helical anchor piles under lateral loading. In Laterally Loaded Deep Foundations: Analysis and Performance; ASTM International: West Conshohocken, PA, USA, 2008; pp. 194–213. ISBN 9780803102071. [Google Scholar]
- Matlock, H.; Reese, L.C. Generalized solutions for laterally loaded piles. T. Am. Soc. Civ. Eng. 1962, 127, 1220–1248. [Google Scholar] [CrossRef]
- Prasad, Y.V.S.N.; Rao, S.N. Lateral Capacity of Helical Piles in Clays. J. Geotech. Eng. 1996, 122, 938–941. [Google Scholar] [CrossRef]
- Venkatesan, V.; Muthukumar, M. Design Parameters and Behavior of Helical Piles in Cohesive Soils—A Review. Arab. J. Geosci. 2020, 13, 1–14. [Google Scholar] [CrossRef]
- Rao, S.N.; Prasad, Y.V.S.N. Estimation of Uplift Capacity of Helical Anchors in Clays. J. Geotech. Eng. 1993, 119, 352–357. [Google Scholar] [CrossRef]
- Meyerhof, G.G. Bearing Capacity and Settlement of Pile Foundations. J. Geotech. Eng. Div. 1976, 102, 197–228. [Google Scholar] [CrossRef]
- Tappenden, K.M.; Sego, D.C. Predicting the axial capacity of screw piles installed in Canadian soils. In Proceedings of the 60th Canadian Geotechnical Conference, Ottawa, ON, Canada, 21–25 October 2007; pp. 1608–1615. [Google Scholar]
- Nasr, M.H. Performance-based design for helical piles. In Contemporary Topics in Deep Foundations; American Society of Civil Engineers: Reston, VA, USA, 2009; pp. 496–503. [Google Scholar]
- Hubell/CHANCE. ATLAS Technical Design Manual, Edition 3. 2014. Available online: https://hubbellcdn.com/catalogfull/CHANCE%20Technical%20Design%20Manual.pdf (accessed on 16 May 2022).
- Merifield, R.S. Ultimate uplift capacity of multiplate helical type anchors in clay. J. Geotech. Geoenviron. Eng. 2011, 137, 704–716. [Google Scholar] [CrossRef]
- Bezuijen, A.; Wang, D.; Gaudin, C.; Merifield, R.; Hu, Y. Centrifuge model tests of helical anchors in clay. In Physical Modelling in Geotechnics, Two Volume Set; CRC Press: Boca Raton, FL, USA, 2010; pp. 1069–1074. ISBN 9780415592888. [Google Scholar]
- Wang, D.; Merifield, R.S.; Gaudin, C. Uplift behaviour of helical anchors in clay. Can. Geotech. J. 2013, 50, 575–584. [Google Scholar] [CrossRef]
- George, B.E.; Banerjee, S.; Gandhi, S.R. Numerical analysis of helical piles in cohesionless soil. Int. J. Geotech. Eng. 2020, 14, 361–375. [Google Scholar] [CrossRef]
- Kurian, N.P.; Shah, S.J. Studies on the behavior of screw piles by the finite element method. Can. Geotech. J. 2009, 46, 627–638. [Google Scholar] [CrossRef]
- Garcia, L.D.C. Assessment of Helical Anchors Bearing Capacity for Offshore Aquaculture Applications. Master’s Thesis, University of Maine, Orono, ME, USA, 2019; pp. 1–158. [Google Scholar]
- Karthigeyan, S.; Ramakrishna, V.V.G.S.T.; Rajagopal, K. Numerical investigation of the effect of vertical load on the lateral response of piles. J. Geotech. Geoenviron. Eng. 2007, 133, 512–521. [Google Scholar] [CrossRef]
- Karthigeyan, S. Numerical Investigation of the effect of combined loading on the Lateral response of piles in sand. In Challenges and Applications of Mathematical Modeling Techniques in Building Science and Technology (CAM2TBST); Central Building Research Institute: Roorkee, India, 2008; pp. 420–429. [Google Scholar]
- Weech, C.; Howie, J.A. Helical piles in soft sensitive soil—Disturbance effects during pile installation. In Proceedings of the 54th Canadian Geotechnical Conference, Calgary, Alberta, 16–19 September 2001; pp. 281–288. [Google Scholar]
- Bagheri, F.; El Naggar, M.H. Effects of the Installation Disturbance on the Behavior of the Multi-Helix Screw Anchors in Sands. Proc. GeoMontreal 2013, 9, 80–91. [Google Scholar] [CrossRef]
- Wood, D.M.; Crewe, A.; Taylor, C. Shaking table testing of geotechnical models. Int. J. Phys. Model. Geotech. 2002, 2, 1–13. [Google Scholar] [CrossRef]
- Prasad, Y.V.S.N.; Rao, N. Pullout behavior of model pile and helical pile anchors subjected to lateral cyclic loading. Can. Geotech. J. 1994, 31, 110–119. [Google Scholar] [CrossRef]
- AC358—ICC Evaluation Service, LLC (ICC-ES). Available online: https://icc-es.org/acceptance-criteria/ac358-2/ (accessed on 16 May 2022).
- ASTM D3689; Standard Test Method for Individual Piles under Static Axial Tensile Load. ASTM International: West Conshohocken, PA, USA, 2013.
- Papadopoulou, K.; Saroglou, H.; Papadopoulos, V. Finite element analyses and experimental investigation of helical micropiles. Geotech. Geol. Eng. 2014, 32, 949–963. [Google Scholar] [CrossRef]
- Trofimenkov, J.G.; Maruipolshii, L.G. Screw piles used for mast and tower foundations. In Proceedings of the 6th International Conferenceon Soil Mechanics and Foundation Engineering, Montreal, QC, Canada, 8–15 September 1965; University of Toronto Press: Toronto, ON, Canada, 1965; Volume 2, pp. 328–332. [Google Scholar]
- Ali, M.S. Pullout Resistance of Anchor Plates and Anchor Piles in Soft Bentonite Clay. Ph.D. Thesis, Duke University, Durham, NC, USA, 1969. [Google Scholar]
- Reddy, M.; Ayothiraman, K. Experimental studies on behavior of single pile under combined uplift and lateral loading. J. Geotech. Geoenviron. Eng. 2015, 141, 04015030. [Google Scholar] [CrossRef]
Publisher’s Note: MDPI stays neutral with regard to jurisdictional claims in published maps and institutional affiliations. |
© 2022 by the authors. Licensee MDPI, Basel, Switzerland. This article is an open access article distributed under the terms and conditions of the Creative Commons Attribution (CC BY) license (https://creativecommons.org/licenses/by/4.0/).