Abstract
Background: Oro-antral communication (OAC) is a common complication following the extraction of upper molar teeth. The Archer and the Root Sinus (RS) systems can be used to classify impacted teeth in panoramic radiographs. The Archer classes B-D and the Root Sinus classes III, IV have been associated with an increased risk of OAC following tooth extraction in the upper molar region. In our previous study, we found that panoramic radiographs are not reliable for predicting OAC. This study aimed to (1) determine the feasibility of automating the classification (Archer/RS classes) of impacted teeth from panoramic radiographs, (2) determine the distribution of OAC stratified by classification system classes for the purposes of decision tree construction, and (3) determine the feasibility of automating the prediction of OAC utilizing the mentioned classification systems. Methods: We utilized multiple supervised pre-trained machine learning models (VGG16, ResNet50, Inceptionv3, EfficientNet, MobileNetV2), one custom-made convolutional neural network (CNN) model, and a Bag of Visual Words (BoVW) technique to evaluate the performance to predict the clinical classification systems RS and Archer from panoramic radiographs (Aim 1). We then used Chi-square Automatic Interaction Detectors (CHAID) to determine the distribution of OAC stratified by the Archer/RS classes to introduce a decision tree for simple use in clinics (Aim 2). Lastly, we tested the ability of a multilayer perceptron artificial neural network (MLP) and a radial basis function neural network (RBNN) to predict OAC based on the high-risk classes RS III, IV, and Archer B-D (Aim 3). Results: We achieved accuracies of up to 0.771 for EfficientNet and MobileNetV2 when examining the Archer classification. For the AUC, we obtained values of up to 0.902 for our custom-made CNN. In comparison, the detection of the RS classification achieved accuracies of up to 0.792 for the BoVW and an AUC of up to 0.716 for our custom-made CNN. Overall, the Archer classification was detected more reliably than the RS classification when considering all algorithms. CHAID predicted 77.4% correctness for the Archer classification and 81.4% for the RS classification. MLP (AUC: 0.590) and RBNN (AUC: 0.590) for the Archer classification as well as MLP 0.638) and RBNN (0.630) for the RS classification did not show sufficient predictive capability for OAC. Conclusions: The results reveal that impacted teeth can be classified using panoramic radiographs (best AUC: 0.902), and the classification systems can be stratified according to their relationship to OAC (81.4% correct for RS classification). However, the Archer and RS classes did not achieve satisfactory AUCs for predicting OAC (best AUC: 0.638). Additional research is needed to validate the results externally and to develop a reliable risk stratification tool based on the present findings.
1. Introduction
Extraction of the third molars is the most common procedure performed by oral and maxillofacial surgeons [1]. In addition to traditional surgical complications such as bleeding, postoperative pain, infection, and nerve damage, oro-antral communication (OAC) may occur following the extraction of a maxillary molar. In OAC, the soft tissue and the bony barrier between the maxillary sinus and the oral cavity, which is partly only 0.5 mm thick, are perforated, leading to a communication between the oral cavity and the maxillary sinus [2]. Consequently, the fistula may undergo connective tissue epithelialization, which may lead to chronic sinusitis [3]. Research indicates that the surgical removal of the upper third molar in the maxilla may result in the opening of the maxillary sinus in as many as 13% of cases, whereas completely displaced teeth could increase the likelihood of sinus opening by up to 25% [4]. The incidence of OAC is estimated to be between 10% to 23% on average, depending on the surgical procedure and the extent of the impaction [4]. In particular, the prevalence of displaced third molars approaches 24%, which implies a substantial risk of OAC in clinics [5].
On average, it takes 48 to 72 h for epithelial tissue to migrate into OAC. A fistula may become chronic if surgical intervention is not performed within this time [6]. Typically, patients complain of fluid leakage from the nose, altered phonation, reduced suction build-up through the mouth when drinking, unpleasant taste sensations, and pain in the OAC region [7,8,9]. A common complication is maxillary sinusitis. The occurrence is associated with a polymicrobial infection that includes both aerobic and anaerobic bacteria. A combination of antibiotics and surgical intervention may be required to treat this condition [10].
Several methods can be used to diagnose OAC. In order to plan for extraction of the third molar in the maxilla, most commonly, a 2D panoramic slice image is obtained (referred to as panoramic radiography or orthopantomogram) [11]. Along with its high availability, it stands out for its good resolution, low radiation, and low cost, especially when compared to other 3D imaging technologies. Intraoral assessment may provide insight into the presence of a large OAC. In addition, other possibilities include the presence of a visible polyp in the excretory duct of the OAC; the Valsalva test, in which the patient exerts pressure on the maxillary sinus through exhalation, which then results in air leakage through the OAC; the use of imaging techniques (panoramic radiography and CT) to assess any bony defects; and finally probing or insertion of radiopaque materials [3,12]. There are concerns regarding the spread of germs and the potential for iatrogenic extension of an OAC in the latter approach [13]. Low sensitivity and specificity are associated with the low invasive option, while germ spread and potential iatrogenic complications are associated with the invasive option. Therefore, it is important to carefully consider which procedure is the most appropriate.
With advanced artificial intelligence (AI)-based approaches, decision making and problem solving can be automated [14]. The clinical decision process is generated by algorithms using the patterns found in the input data points. The incorporation of artificial intelligence into everyday clinical practice is becoming increasingly important in many medical specialties, as well as dentistry and oral and maxillofacial surgery [15]. A review by Khanagar et al. revealed an increasing interest in AI research in dentistry and oral and maxillofacial surgery [15]. Most of the papers listed in the review focused on the diagnosis of dental caries and other oral pathologies. Alveolar bone loss, the proximity of the third lower molar to the alveolar nerve, or the prediction of orthodontic extractions could be investigated for similar questions as in the present work [15]. The predictive assessment of OAC based on preoperative panoramic radiography has been investigated in our previous study [16]. Here, we found only limited comparability of AI-based results compared to experienced surgeons. Even between different AI algorithms, the results were not consistent. Relying on the prediction of an AI-based algorithm alone can thus not be conclusively recommended based on available evidence. Further studies with larger case numbers, other algorithms, and multicenter center studies might be necessary [16]. Several risk factors can be employed to predict the development of OAC. Besides factors such as age or gender, techniques such as the selected surgical procedure and the practitioner’s experience as well as anatomical conditions can influence the occurrence of OAC. For professionals and automated algorithms, standardized classification systems such as the Archer Classification [17] and the Root Sinus Classification (RS) [18] can be useful due to their reproducibility [19]. The Archer classification is based on the positional relationship of the third molar to the adjacent tooth and its relationship to the maxillary sinus, whereas the RS classification is dependent on the root tips as well as the direct relationship to the maxillary sinus floor (Figure 1) [19].
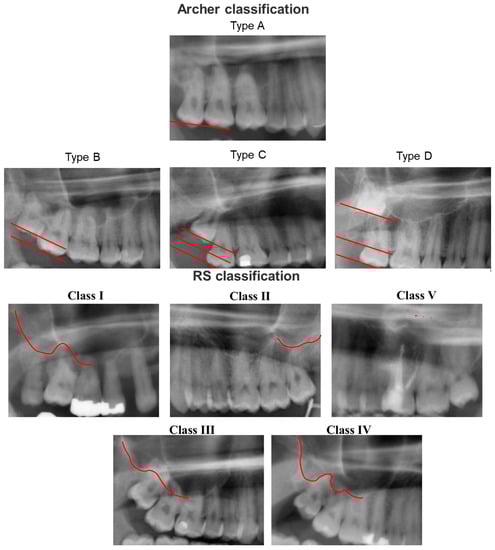
Figure 1.
Archer classification and Root Sinus (RS) classification based on panoramic radiography. Archer classification: Type A: the upper third molar is situated on the same or below the occlusal plane of its neighboring second molar. Type B: the upper third molar is located between the occlusal and cervical lines of the adjacent second molar. Type C: the upper third molar is located between the cervical line and the upper root third of the neighboring second molar. Type D: The third upper molar is located at the level of or above the apical third of the adjacent second molar. RS Classification: Class I: the maxillary sinus is located strictly above the root apex of the maxillary third molar. Class II: the line of the maxillary sinus floor is sharply curved and partially overlapped by the root apex of the maxillary third molar. Class III: the line of the maxillary sinus floor slopes sharply between the maxillary teeth and overlaps most of the roots. Class IV: the line of the maxillary sinus floor meets the root tips and slopes only between the root seats. Class V: the line of the maxillary sinus floor in relation to the root tips of the maxillary third molars cannot be reliably delineated.
Iwata et al. were able to reveal a significant association between OAC and the Archer classes B–D and/or the RS classes III/IV [19]. However, according to the CT examination, only the Archer classification D and the RS classification III, IV were associated with OAC [19]. Analyzing these classifications in panoramic radiographs with the help of an AI-based algorithm could help automate the prediction of OAC in panoramic radiography imaging. In a previous study of our workgroup, the prediction based solely on panoramic radiographs was found unreliable [16]. To the best of our knowledge, no study has utilized an AI-based algorithm to evaluate the predictive value of these classification systems for automated panoramic radiography analysis. Overall, the present study sought to (1) evaluate the feasibility of automatized classification of impacted teeth from panoramic radiographs, (2) determine the distribution of OAC stratified by classification system classes, and (3) evaluate the feasibility of automatized prediction of OAC utilizing established classification systems.
2. Materials and Methods
2.1. Study Design
The present study was conducted in accordance with the Declaration of Helsinki and the Professional Code of Conduct for Physicians of the Bavarian Medical Association in their current versions. As part of this study, all consecutive patients who underwent tooth extractions in the posterior region of their upper jaw at the University Hospital Würzburg between 2010 and 2022 were included. The following criteria were excluded from consideration: malignant diseases around the surgical site, fractures at the surgical site, syndromal anatomical variants, inflammations on the root tip, and chronic/pre-existing OACs. In addition, only images of comparable quality were included. Careful attention was paid to obtaining good positioning of the facial planes and symmetrical alignment of the head while avoiding projection-related enlargements or reductions. Only one type of X-ray machine was used during this period. Externally scanned images were also excluded due to the lack of comparability. A total of 357 patients with extracted teeth and the associated imaging were consecutively included. This study was approved by the Ethics Committee of the University of Würzburg before the start of the study and was authorized under authentication number 2022011702.
Following approval by the ethics committee, data were extracted from the data management system of the University Hospital of Würzburg. The screening was conducted on patients who had tooth extractions in the maxillary posterior region between 2010 and 2022. Patient identification was based on ICD codes. A detailed review of the operation reports for the group of patients who had an OAC following tooth extraction was conducted. The preoperative panoramic radiography was extracted if OAC could be determined clinically through various examinations. Images were anonymized before being processed. As for the control group, all patients who had a posterior extraction were screened and allocated to the control group after reviewing the surgical report in which OAC was not diagnosed or excluded. We extracted the radiographs in the same manner as described above. The included patients had 2nd and 3rd molars in undisturbed occlusion with regard to their dentition. This was necessary in order to be able to give a reliable assignment to the classifications used, Archer and RS. Since the extraction of 3 molars is one of the most common procedures in dentistry and oral and maxillofacial surgery, we have a homogeneous distribution with regard to gender. One study has already shown that there is no significant difference in the probability of OAC occurrence in relation to gender [4]. Furthermore, with a median age of 28 years, this procedure is mainly found in young patients. We were able to confirm this age distribution in our study. As we anonymized the images directly after extraction and focused on the exclusive detection of the probability of postoperative OAC using the classifications, no subgroup analysis of the data was performed. In total, 157 cases were collected in the OAC group and 200 consecutive cases in the control group for analysis. Thereafter, the region of interest for the classification system (upper quadrants) was selected, and images that were not suitable for classification (e.g., lacking the third molar) were excluded. Two experts in oral and maxillofacial surgery subsequently set the ground truth of the RS and Archer clinical classification systems. Disagreements regarding the classifications were resolved by discussion with a third reviewer. The regions of interest were identified and cropped from original panoramic radiographs. The definition of the ROI was performed manually by two annotators in this work. Care was taken to standardize the ROI-defining process and to not allow too much variability due to potential artefacts (e.g., metal artefacts). The final number of classes was as follows: Archer A (n = 126); RS I, II, V (n = 130); Archer B-D (n = 365); RS III, IV (n = 361).
2.2. Machine Learning and Deep Learning Algorithms
Multiple panoramic imaging devices were used to create the original images. The images were randomly distributed into a train, test, and validation set (60%, 20%, 20%). Next, we resized (224 × 224) all dataset images and applied data augmentation techniques to the train dataset images (rotation of ±30 degrees, horizontal flipping, 20–80% brightness). Image augmentation was used to reduce overfitting and improve generalization. A surgeon manually defined the region of interest by delineating the maxilla and the sinuses. Multiple supervised pre-trained machine learning algorithms (VGG16, ResNet50, Inceptionv3, EfficientNet, MobileNetV2), as well as a customized CNN model, were used to evaluate the algorithms’ ability to predict the clinical classification systems RS and Archer. The pre-trained models were used for transfer learning. In transfer learning, all relevant information is gathered, and this knowledge is subsequently transferred to enable solutions to other problems. This way, the panoramic radiography dataset can be used as a basis for a deep learning model with pretrained weights. The models were frozen in a way that we used the basic models and made changes to the final layer only, as these models were designed to handle multiple classes, whereas we needed to solve a binary classification problem. For this, we made the layer non-trainable and built a last fully connected layer. Overall, we flattened our base model’s output to 1 dimension, added a fully connected layer with hidden units and ReLU activation, used a dropout rate, and added a final Fully Connected Sigmoid Layer. The specific characteristics of the models, including each layer, are shown in the code available in the data availability section. We used the RMSProp Optimiser (custom made CNN), Adam optimizer (VGG16, InceptionV2, EfficientNet, MobileNetV2), or SGD optimizer (ResNet50) with binary cross-entropy for loss evaluation. We applied learning rate decay with a minimum learning rate of 1 × 10⁻⁴, a factor of 0.5, while monitoring validation accuracy and early stopping (5 epochs). Steps per epoch were calculated as the sample size for the training set divided (using the integer division operator) by the batch size, where the batch size was 10. Models were trained for 10 epochs. We did not use a grid search, random search, or Bayesian optimization for hyperparameter tuning, but we used a manual search to adjust the parameters until the best metrics were obtained. Grid search and manual search are the most widely used strategies for hyperparameter optimization [20]. Hyperparameter tuning using fine-tuning algorithms was intended to be applied to improve models more precisely in the case where an AUC over 0.75 could be reached for any model. In case no evidence was found that models were suitable to reach higher accuracies, we decided not to perform further hyperparameter tunings in a resource-oriented way, as these fine-tuning techniques are more intended to build precise models to classification tasks rather than exploring the feasibility/exploratory approach of whether a reliable classification is possible or not. The other presented algorithms (custom-made CNN, BoVW approach, MLP, RBNN) were trained exclusively on our dataset without pre-trained weights. The algorithms’ structure and the code are available in the data availability section.
AUC and accuracy were calculated to evaluate each model’s performance. AUC represents the area under the receiver operating characteristic curve (ROC). Accuracy is a metric used in classification problems to determine the percentage of correct predictions. Statistical analyses were conducted in Python and SPSS v26 (IBM, Armonk, NY, USA). Algorithms were built and evaluated in Python using the OpenCV, NumPy, Pillow, Seaborn, Matplotlib, TensorFlow, Keras, and scikit-learn libraries. Specifications for the hardware and software environments were as follows:
- CPU: AMD Ryzen 9 5950X 16-Core Processor;
- RAM: 64 GB;
- GPU: NVIDIA Geforce RTX 3090;
- Python version: 3.10.4 (64-bit);
- OS: Windows 10.
As part of the Bags of Visual Words (BoVW) technique, feature extractions from the input images were saved as BoVWs to prepare for training a model. As a general rule, a keypoint is a particular structure that contains several attributes, such as its coordinates (x, y), the meaningful neighborhood’s size, the angle that specifies its orientation, and the response that defines the strength of the keypoints, etc. Scale Invariant Feature Transform (SIFT) was used to extract the keypoints and descriptors. To create visual vocabularies for the BoVW, all extracted descriptors were clustered using K-Means clustering. The BoVWs were then fed into a support vector machine (SVM) model to predict the Archer and RS classes (Figure 2 and Figure 3).
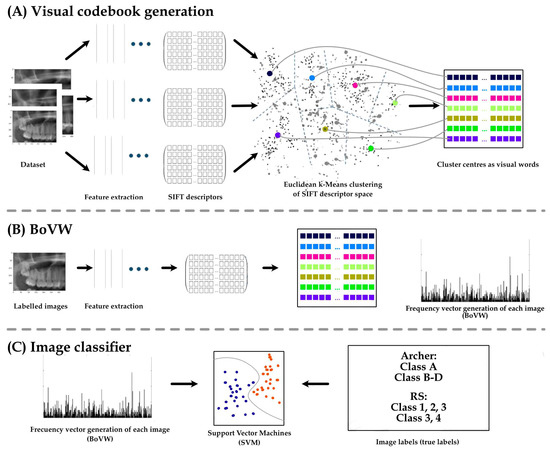
Figure 2.
Application of the Bags of Visual words technique on dental X-rays to predict the RS and Archer class of third molar impaction. Keypoint is detected based on image features. A keypoint is a particular structure that has many attributes such as its (x, y) coordinates, size of the meaningful neighborhood, the angle that specifies its orientation, response that specifies the strength of keypoints, etc. Keypoints and descriptors are then extracted by Scale Invariant Feature Transform (SIFT). All extracted descriptors are then clustered using K-Means to obtain visual vocabularies for the BoVW. Finally, we fed these BoVW into a support vector machine (SVM) model to make the prediction of the Archer and RS classes and to evaluate the model based on the true labels (ground truth).
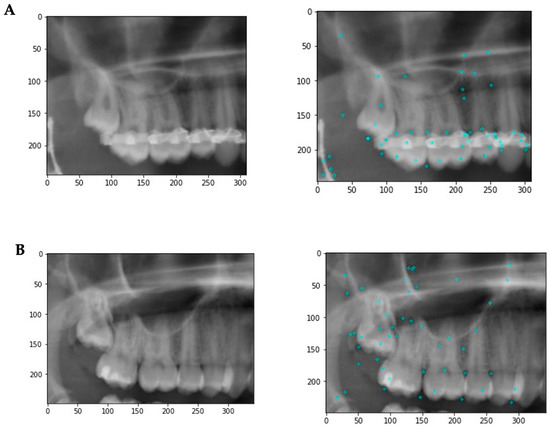
Figure 3.
Example images illustrating some of the image features. (A) Patient has metallic artefacts affecting the keypoint detection and subsequent classification. In addition, other structures such as endodontic fillings, crowns, composite fillings, etc., might affect the classification. (B) A situation with fewer artifacts. The keypoints are more evenly distributed with a focus on the third molar region.
2.3. Association of Archer and RS Classification with Oroantral Communications
Further, we evaluated the association between Archer and RS classification and oroantral communication by utilizing the CHAID algorithm (Chi-square Automatic Interaction Detectors). Finally, we used a multilayer perceptron model (MLP) and radial basis function neural networks (RBNN) to predict OAC from RS and Archer classification.
3. Results
3.1. Machine Learning Performance
The machine learning results for the Archer classification (validation dataset) resulted in an accuracy of 0.250 for ResNEt50, 0.500 for Custom CNN, 0.750 for VGG16, and Inception V3, 0.771 for MobileNetV2 and EfficientNet, and finally 0.729 for BoVW. The AUCs were 0.328 for ResNet50, 0.613 for InceptionV3, 0.807 for VGG6, 0.813 for MobileNetV2 and EfficientNet, with the highest value of 0.902 for Custom CNN (Table 1 and Figure 4).

Table 1.
Model performance of the machine learning algorithms for the Archer classification. Transfer learning algorithms, custom CNN and a Bag of Visual Words technique were investigated. AUC: area under the curve; Accuracy: (TP + TN)/(TP + TN + FP + FN); val: validation dataset; test: test dataset.
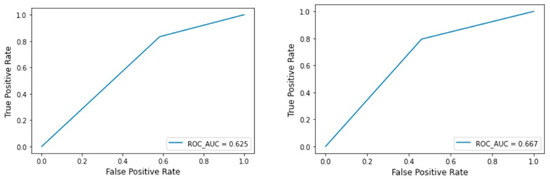
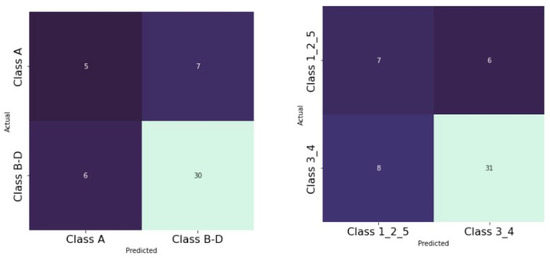
Figure 4.
BOVW technique: ROC curve for the test and validation set of the Archer classification.
The machine learning results for RS classification (validation dataset) showed an accuracy of 0.625 for MobileNetV2 and EfficientNet, 0.708 for Custom CNN, 0.750 for VGG16, InceptionV3, ResNet50, and finally the highest value of 0.792 for BoVW. The AUCs were 0.500 for ResNet50, 0.579 for EfficientNet and MobileNetV2, 0.588 for InceptionV3, 0.656 for VGG16, 0.694 for BoVW and finally the highest value of 0.716 for Custom CNN (Table 2 and Figure 5).
Table 2.
Model performance of the machine learning algorithms for the RS classification. Transfer learning algorithms, custom CNN and a Bag of Visual Words technique were investigated. AUC: area under the curve; Accuracy: (TP + TN)/(TP + TN + FP + FN); val: validation dataset; test: test dataset.
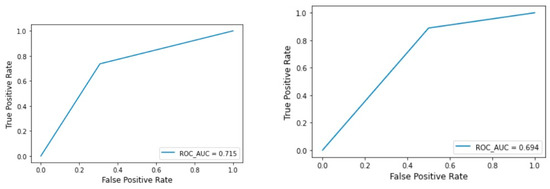
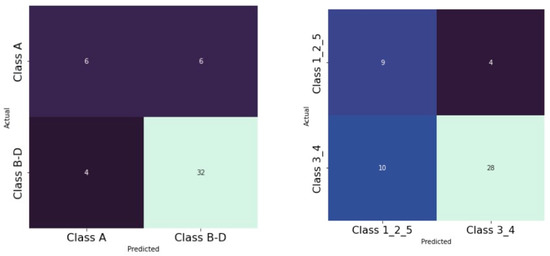
Figure 5.
BOVW technique: ROC curve for the test and validation set of the RS classification.
3.2. Association of Archer and RS Classification with Oroantral Communications
As already described by other authors, we were able to find a significant association between OAC for the Archer groups B–D (Figure 6) as well as for the RS classes III/IV (Figure 7). We found these results for both the test and the validation set.
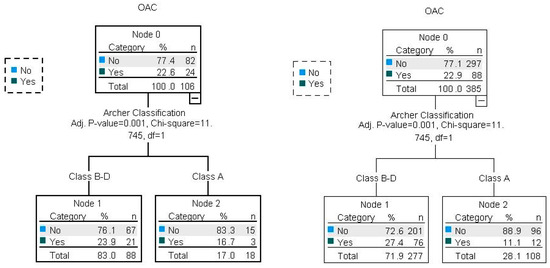
Figure 6.
Illustration of Archer and OAC associations with CHAID decision trees for the test and validation dataset (80/20). Percent correct for the training set: 77.1%; percent correct for the test set: 77.4%.
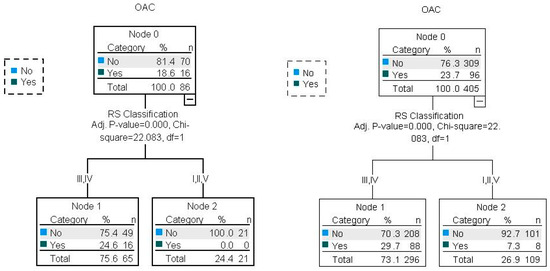
Figure 7.
Illustration of RS and OAC associations with CHAID decision trees for the test and validation datasets (80/20). Percent correct for the training set: 76.3%; percent correct for the test set: 81.4%.
Using multilayer perceptron models (MLP) and radial basis function neural networks (RBNN), the AUC was 0.59 (Figure 8) for the Archer classification and 0.638 (Figure 9) for the RS classification. Using the RBNN, we achieved an AUC of 0.599 for the Archer classification (Figure 10) and an AUC of 0.63 for the RS classification (Figure 11).
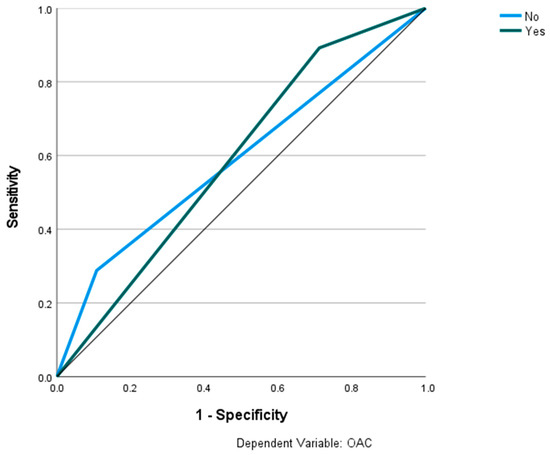
Figure 8.
Prediction of OAC using the Archer classification and MLP. The ROC curves show the predictive capability of the Archer class B–D in predicting OAC. Input layer: Archer classification (2 units). Hidden layer: 2 units; activation function: hyperbolic tangent. Output layer: dependent variable OAC (2 units); activation function: softmax; error function: cross-entropy. Number of units in the hidden layer was determined by the testing data criterion: the best number of hidden units is the one that yields the smallest error in the testing dataset. Train/test/val split: 80/10/10. Percent incorrect predictions on the validation set: 25.5%; percent incorrect predictions on the test set (hold out): 17.9%. AUC: 0.590.
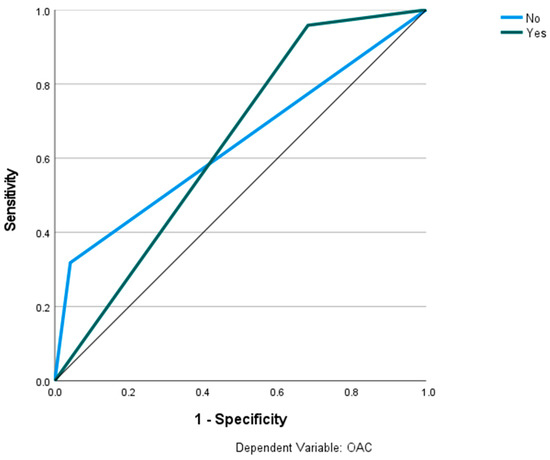
Figure 9.
Prediction of OAC using the RS classification and MLP. The ROC curves show the predictive capability of the RS class III, IV in predicting OAC. Input layer: RS classification (2 units). Hidden layer: 2 units, activation function: hyperbolic tangent. Output layer: dependent variable OAC (2 units), activation function: softmax; error function cross-entropy. Number of units in the hidden layer was determined by the testing data criterion: the best number of hidden units is the one that yields the smallest error in the testing dataset. Train/test/val split: 80/10/10. Percent incorrect predictions on the validation set: 32.7%; percent incorrect predictions on the test set (hold out): 25.8%. AUC: 0.638.
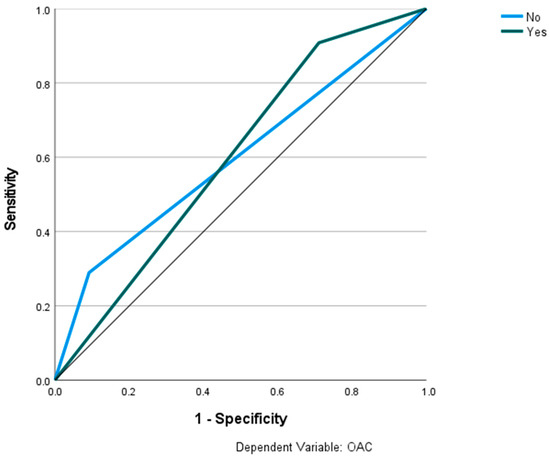
Figure 10.
Prediction of OAC using the Archer classification and RBNN. The ROC curves show the predictive capability of the Archer class B-D in predicting OAC. Input layer: Archer classification (2 units). Hidden layer: 3 units; activation function: softmax. Output layer: dependent variable OAC (2 units); activation function: identity; error function: sum of squares. Number of units in the hidden layer was determined by the testing data criterion: the best number of hidden units is the one that yields the smallest error in the testing dataset. Train/test/val split: 80/10/10. Percent incorrect predictions on the validation set: 29.5%; percent incorrect predictions on the test set (hold out): 27.5%. AUC: 0.599.
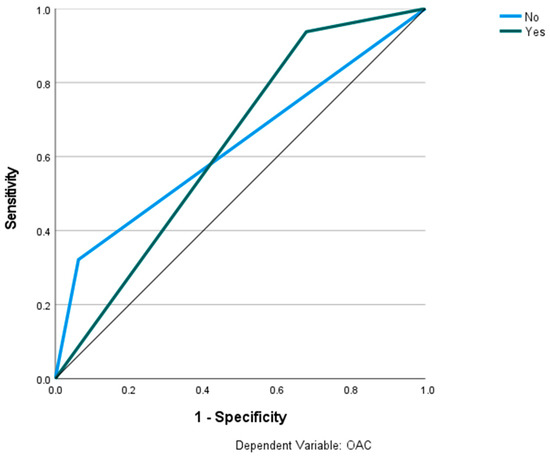
Figure 11.
Prediction of OAC using the RS classification and RBNN. The ROC curves show the predictive capability of the RS class III, IV in predicting OAC. Input layer: RS classification (2 units). Hidden layer: 2 units, activation function: softmax. Output layer: dependent variable OAC (2 units); activation function: identity; error function: sum of squares. Number of units in the hidden layer was determined by the testing data criterion: the best number of hidden units is the one that yields the smallest error in the testing dataset. Train/test/val split: 80/10/10. Percent incorrect predictions on the validation set: 25.5%; percent incorrect predictions on the test set (hold out): 30.2%. AUC: 0.630.
4. Discussion
The present study examined the automated classification of impacted teeth using two classification systems and various artificial intelligence-based algorithms (i.e., machine learning and deep learning techniques). Further, we evaluated the association between the included classification systems and OAC and attempted to predict OAC based on high-risk classes in these classification systems. An assessment of the likelihood of an OAC can optimize operational planning. Therefore, it may be possible to prevent the potentially serious complications that may arise from OACs. A modern precision medicine approach would utilize reliable medical risk stratification algorithms to identify patients at risk in order to plan the closure of an OAC through a suitable incision before the operation takes place. In addition, when anticipating an OAC based on new prediction models, a closer follow-up of those patients might be beneficial to tackle a future problem. This approach would require investigating the data patterns that are currently available. Panoramic radiographs are widely available and well suited for this task. The hidden data patterns within panoramic radiographs are currently being investigated for various diagnostic purposes. Nevertheless, there was a lack of evidence examining its usefulness in OAC diagnosis.
There are two requirements for optimal healing after upper molar teeth extraction, namely the presence of an uninfected maxillary sinus and a wound closure that is free from tension, well vascularized, and has a sufficient area of apposition. A small opening in the OAC that is not infected at the time of surgery may heal spontaneously by depositing a blood clot [6,7,21]. Spontaneous healing may not be possible in the case of openings larger than 3–4 mm on average and a probing depth exceeding 5 mm [22,23]. A surgical approach, which involves immediate closure of an OAC, has been associated with success rates of up to 95 percent, whereas secondary occlusions have been associated with success rates as low as 67 percent [7,23,24]. There is a great deal of innovative research interest in the surgical field with regard to closing an OAC. In addition to buccal advancement flap, rotation flaps with buccal cheek fat, local flap plastics with gingival tissue or substitute materials, and various different local rotation flaps, new techniques such as plated rich fibrin, which induces increased wound healing, are increasingly being discussed in the literature [9,25,26]. As we have found in a prior study, we were unable to obtain satisfactory results when using panoramic radiographs to predict OAC [16]. The object of this study was to identify classification systems that were significantly associated with an increased probability of occurrence of OAC. As Iwata et al. (2020) described, the Archer classification types B, C, D, and RS III/IV are significantly more frequently associated with OAC than Archer type A and RS classification types I, II, and V [19]. Other authors have confirmed these findings [18,27]. We were able to confirm the previously mentioned significant associations between OAC and Archer as well as RS classification in our study, and we presented a clinical decision tree using the CHAID algorithm.
Furthermore, we have used a number of pre-trained machine learning models (VGG16, ResNet50, Inceptionv3, EfficientNet, MobileNetV2), a custom CNN, and the Bag of Visual Words technique to solve a binary classification task. In examining the Archer classification, we were able to achieve accuracies of up to 0.771 for EfficientNet and MobileNetV2, respectively. In terms of AUC, our custom-made CNN achieved values up to 0.902. Comparatively, the detection of the RS classification had an accuracy of up to 0.792 for the BoVW and an AUC of up to 0.716 for our custom-made CNN. Considering all algorithms, the Archer classification was detected more reliably than the RS classification. Tobel et al. (2017) developed AI-based algorithms to predict patient age by analyzing the developmental status of third lower molars. Despite achieving only a 0.51 accuracy, they were able to demonstrate that misclassifications were most likely to occur between adjacent developmental stages [28]. The results indicated that only slight differences in tooth morphology could be difficult to distinguish when using small datasets. According to the BoVW approach, we found that other foreign materials in the panoramic radiography, such as endodontic fillings, implants, etc., can impair diagnostic accuracy. Tobel et al. also demonstrated that practitioners with 5 to 10 years of experience were capable of achieving results similar to the AI algorithms [28]. Our previous study on the prediction of OAC in OPGs was able to confirm this observation [16]. Kim et al. developed similar protocols to predict the existence of inflamed maxillary sinuses. In this study, they achieved an AUC of 0.93 and 0.88 for the two datasets, as well as 0.83 and 0.89 for the practitioners, with a Cohen’s kappa coefficient of 0.82 compared to practitioners [29].
Using multilayer perception models (MLP) and radial basis function neural networks (RBNN), we were able to obtain comparable results in predicting OAC. The Archer classification yielded an AUC of 0.59, whereas the RS classification and the use of RBNN led to a slightly higher AUC of 0.63. However, both values indicate no satisfactory predictive ability. A study published recently found an average accuracy of less than 90% for the use of artificial intelligence in dentistry-related tasks. This may result from the fact that panoramic radiographs contain a great deal of information and may be variable compared to chest X-rays (i.e., various numbers of teeth, fillings, foreign metallic objects) [30]. An example of the popular usage of a large number of open-source database images would be the detection of COVID-19 or pneumonia patterns in 2D chest X-rays. Various studies have demonstrated an accuracy range of 0.829 to 0.990 in solving the binary classification task [31].
There are strengths and limitations associated with this study. Overall, these are the following innovations that we could provide with this work: (1) To the best of our knowledge, this is the first study to determine the diagnostic metrics of the included classification systems utilizing artificial intelligence-based approaches to panoramic radiography. (2) We have included several suitable methods compared to other studies working on different topics in dentistry, allowing others to assess differences in metrics for panoramic radiography classification tasks. Methods can be easily adapted for other classification tasks (e.g., assessing the relationship between lower molars and the alveolar nerve). Our dataset and algorithms can be utilized as a fundament for other AI-based algorithms, statistical models, or other evaluations. (3) It is our follow-up study that evaluates a highly relevant clinical topic: the preoperative prediction of OAC from panoramic radiography. Our work group is the first to investigate this task from panoramic radiography with advanced AI-based methods, to the best of our knowledge. Considering the high number of upper teeth extractions in dentistry and the high prevalence of OAC, our work could have great clinical value. OAC can lead to serious complications for patients. In case more authors are working on this topic and build on the fundament we provided with this work, it might be possible to improve the provided models in the future and introduce a preoperative risk stratification algorithm before tooth extraction. This would be a great step toward precision medicine/dentistry. There are, however, some limitations due to the retrospective nature of the data. The small openings of the maxillary sinuses are not likely to require any intervention under healthy conditions, such that the data may be biased as an unreported case [7]. We carefully reviewed the operative reports in the data collection process to see if an OAC could be clinically confirmed. Conversely, it must be considered that the control group included cases in which no OAC was documented. If an OAC was erroneously not documented, a potential misclassification could have taken place. A more accurate data review would be possible in the context of a prospective study in which a standardized clinical review for an OAC is established. In addition, it might be possible to include CT imaging to assess small OACs in a standardized way in future studies and compare the results with 2D imaging. However, it might be complicated to obtain sufficient sample sizes, as CT imaging is not regularly performed for upper molar tooth extraction. Another potential future improvement could be automatic ROI detection by algorithms. This requires large datasets and separate algorithms detecting the ROIs before further processing. We are currently annotating a large dataset for the automatized detection of the sinus area with a subsequent automatized assessment of the marginal bone loss (unpublished data). The combination of these algorithms could further advance the efforts toward AI-based diagnostic approaches in oral and maxillofacial surgery. Furthermore, we have strictly divided the data into a train, test, and validation dataset, resulting in a smaller number of data for the learning process of the algorithms [32,33]. A limitation of the current study is the small number of data collected and low occurrence of OACs given the large number of data required with the variability of panoramic radiographs [34]. In addition, the manual preparation of the images requires the identification of a region of interest, resulting in variations among studies [28]. Additionally, the process of labeling the region of interest by the algorithm is another potential source of error that requires training with large datasets before such algorithms can be used in clinics [30,35,36]. Despite achieving the goal of defining a section, there might be additional disadvantages depending on the quality of the obtained panoramic radiographs, considering their two-dimensional nature [37,38,39]. There are still many incomprehensible aspects of deep learning theory that have to be addressed. Normally, it is difficult to improve deep learning models in a focused manner due to their interpretation challenges. Therefore, researchers must consider both generalization and optimization. Even deep CNNs using large training data still struggle with the “overfitting” problem, which limits their ability to generalize their results from the training set to unknown test data. As a result, a larger model is typically more accurate [40], but users must choose between accuracy and reasoning speed in practice. In panoramic radiography, noise can both affect how expressive elements are extracted and how implicit knowledge is mined. The difficulties described above make it difficult to apply it successfully in some unique situations, such as medical diagnosis jobs [41], where there are few training data [42]. As of today, a variety of approaches have been developed to overcome the “overfitting” problem with deep CNNs. In order to reduce the complexity of a network, regularization methods can be utilized. A few such methods are Hierarchical Guidance and Regularization (HGR) learning [43] and L2-regularization [44]. Another approach is the extension of the sample dataset by means of data augmentation techniques such as translation [45] and horizontal flipping [46], as well as noise disruption [47]. Furthermore, Dropout [48], DropConnect [49], and GoogleLeNet [50] utilize ensembles of classification nodes in order to reduce reliance on a single network. Other approaches are a few distinctive training techniques, such as carefully planned initiation [51], early stopping [52], and learning rate decay [53].
Zheng et al. have recently proposed a whole-stage data augmentation method that increases the accuracy of deep convolutional neural networks [54]. This method can also be used to generate an implicit ensemble of models without incurring additional training costs. Due to the fact that this framework is widely applicable to all network architectures and techniques for the augmentation of data, it can be used for a wide range of deep learning-based activities.
Jin et al. explored the possibility of diagnosing diseases from uncontrolled 2D facial photographs using deep learning algorithms [55]. As in our study, these researchers incorporated transfer learning into their process. By initializing the weight, they replaced the last fully connected layer of the pre-trained CNN. When optimizing their CNN, the authors used forward propagation to derive activation value from the convolutional layer. In place of manual grid search, they used code-based hyperparameter tuning (random grid search) as a regularization technique. Both have numerous applications in the medical industry [20]. Another technique to optimize the outcome in prediction and classification tasks in the medical field is the combination of several data inputs (e.g., imaging, clinical data, genetic data, etc.) in the form of multi-input mixed data hybrid models [56]. Overall, in the present work, we sought to apply a wide range of regularization (e.g., data augmentation, EarlyStopping, learning rate decay) and optimization (hyperparameter tuning, manual layer engineering) techniques for model development. In our pre-studies, we also applied different ROIs to examine the effect of ROI determination on metrics and chose the ROI with the most representative region in panoramic radiography for upper molar region classification tasks.
A general limitation is the artefacts that may be present in X-ray images, such as osteosynthesis plates, metal restorations, and other affecting factors such as patient positioning that can be a potential source of interference. We have considered these points in the data analysis [57]. Kim et al. demonstrated that the topographical position of root apexes determined by panoramic radiography was significantly different than that determined by a CT image [38]. Bouquet et al. describe similar results for the projection of the root tip into the maxillary sinus [37]. This might be a consequence of the representation of 3D structures on 2D images. In light of these factors, as well as others, several authors recommend the use of 3D imaging to provide additional information regarding the prediction of OAC, although they cannot be recommended generally due to radiation exposure and costs [11,37,58,59]. As a whole, the applicability of the introduced algorithms should be investigated in more detail with a larger number of cases [30]. In the present study, we found superior predictability by considering classification systems rather than solely examining OPGs to predict OAC. Nevertheless, the diagnostic measures are still not suitable for clinical use. By including the classification system in future algorithms, it may be possible to reduce the number of images necessary to train a reliable OAC prediction algorithm. Finally, external validation from large-scale prospective studies is warranted to validate the provided results. In a previous study, we sought to compare experienced practitioners and AI-based approaches in predicting OAC from panoramic radiographs [16]. Our results revealed that the agreement among the practitioners varied greatly. The metrics of the seven different AI algorithms investigated showed substantial differences. However, in direct comparison, similar results were achieved for the AI and the practitioner predictions of OAC from panoramic radiographs. In conclusion, we were not able to predict OAC reliably, neither by the practitioners nor by an AI-based approach utilizing features from panoramic radiographs.
5. Conclusions
The present study examined the automated classification of impacted teeth using two classification systems and various artificial intelligence-based algorithms. The results reveal that impacted teeth can be classified using panoramic radiographs (best AUC: 0.902), and the classification systems can be stratified according to their relationship to OAC (81.4% correct for RS classification). However, the Archer and RS classes did not achieve satisfactory AUCs for predicting OAC (best AUC: 0.638). Additional research is needed to validate the results externally and to develop a reliable risk stratification tool based on the present findings.
Author Contributions
Conceptualization: A.V., S.H. and B.S.; Data curation: A.V.; Formal analysis: A.V., M.V., G.L., A.S., S.G., R.C.B., S.H. and B.S.; Investigation: A.V., M.V., A.S., A.K., S.G., S.H. and B.S.; Methodology: A.V., G.L., R.C.B., S.H. and B.S.; Project administration: A.K. and S.H.; Software: B.S.; Supervision, A.K., R.C.B. and S.H.; Validation: B.S.; Visualization: B.S.; Writing—original draft: A.V. and B.S.; Writing—review and editing: A.V., M.V., G.L., A.S., A.K., S.G., R.C.B. and S.H. All authors have read and agreed to the published version of the manuscript.
Funding
This research received no external funding.
Institutional Review Board Statement
The study was conducted in accordance with the Declaration of Helsinki and was approved by the Institutional Review Board (or Ethics Committee) of the Ethics Committee of the Faculty of Medicine University of Wuerzburg (2022011702), date of approval: Würzburg 17.02.2022.
Informed Consent Statement
Patient consent was waived due to the anonymization of X-ray data.
Data Availability Statement
The raw images are anonymized and available from the corresponding author on reasonable request. The python code and machine learning algorithm structures are available from: https://github.com/Freiburg-AI-Research, (accessed on 1 July 2022).
Conflicts of Interest
The authors declared no conflict of interest.
References
- Deliverska, E.G.; Petkova, M. Complications after Extraction of Impacted Third Molars—Literature Review. J. IMAB 2016, 22, 1202–1211. [Google Scholar] [CrossRef]
- Harrison, D.F. Oro-Antral Fistula. Br. J. Clin. Pract. 1961, 15, 169–174. [Google Scholar] [PubMed]
- Parvini, P.; Obreja, K.; Begic, A.; Schwarz, F.; Becker, J.; Sader, R.; Salti, L. Decision-Making in Closure of Oroantral Communication and Fistula. Int. J. Implant. Dent. 2019, 5, 13. [Google Scholar] [CrossRef] [PubMed]
- Rothamel, D.; Wahl, G.; d’Hoedt, B.; Nentwig, G.-H.; Schwarz, F.; Becker, J. Incidence and Predictive Factors for Perforation of the Maxillary Antrum in Operations to Remove Upper Wisdom Teeth: Prospective Multicentre Study. Br. J. Oral Maxillofac. Surg. 2007, 45, 387–391. [Google Scholar] [CrossRef]
- Carter, K.; Worthington, S. Predictors of Third Molar Impaction: A Systematic Review and Meta-Analysis. J. Dent. Res. 2016, 95, 267–276. [Google Scholar] [CrossRef]
- Hassan, O.; Shoukry, T.; Raouf, A.A.; Wahba, H. Combined Palatal and Buccal Flaps in Oroantral Fistula Repair. Egypt. J. Ear Nose Throat Allied Sci. 2012, 13, 77–81. [Google Scholar] [CrossRef][Green Version]
- Khandelwal, P.; Hajira, N. Management of Oro-Antral Communication and Fistula: Various Surgical Options. World J. Plast. Surg. 2017, 6, 3–8. [Google Scholar]
- Haanaes, H.R.; Pedersen, K.N. Treatment of Oroantral Communication. Int. J. Oral Surg. 1974, 3, 124–132. [Google Scholar] [CrossRef]
- Scattarella, A.; Ballini, A.; Grassi, F.R.; Carbonara, A.; Ciccolella, F.; Dituri, A.; Nardi, G.M.; Cantore, S.; Pettini, F. Treatment of Oroantral Fistula with Autologous Bone Graft and Application of a Non-Reabsorbable Membrane. Int. J. Med. Sci. 2010, 7, 267–271. [Google Scholar] [CrossRef][Green Version]
- Mehra, P.; Jeong, D. Maxillary Sinusitis of Odontogenic Origin. Curr. Allergy Asthma Rep. 2009, 9, 238–243. [Google Scholar] [CrossRef]
- Shaikh, A.H.; Muntaha, S.; Ahmed, S.; Zaidi, S.J.A. Maxillary Sinus Involvement of Maxillary Third Molars: An OPG Study Conducted at Dow International Dental College, Karachi. Prof. Med. J. 2022, 29, 475–481. [Google Scholar] [CrossRef]
- Shahrour, R.; Shah, P.; Withana, T.; Jung, J.; Syed, A.Z. Oroantral Communication, Its Causes, Complications, Treatments and Radiographic Features: A Pictorial Review. Imaging Sci. Dent. 2021, 51, 307–311. [Google Scholar] [CrossRef] [PubMed]
- Pauly, G.; Kashyap, R.R.; Shetty, R.; Kini, R.; Rao, P.K.; Girish, Y.R. Oroantral Fistula: Radiodiagnostic Lessons from a Rare Case. Am. J. Diagn. Imaging 2017, 2, 21–24. [Google Scholar] [CrossRef]
- Bellman, R. Artificial Intelligence: Can Computers Think? Thomson Course Technology: Boston, MA, USA, 1978; ISBN 00878351493. [Google Scholar]
- Khanagar, S.B.; Al-ehaideb, A.; Maganur, P.C.; Vishwanathaiah, S.; Patil, S.; Baeshen, H.A.; Sarode, S.C.; Bhandi, S. Developments, Application, and Performance of Artificial Intelligence in Dentistry—A Systematic Review. J. Dent. Sci. 2021, 16, 508–522. [Google Scholar] [CrossRef]
- Vollmer, A.; Saravi, B.; Vollmer, M.; Lang, G.M.; Straub, A.; Brands, R.C.; Kübler, A.; Gubik, S.; Hartmann, S. Artificial Intelligence-Based Prediction of Oroantral Communication after Tooth Extraction Utilizing Preoperative Panoramic Radiography. Diagnostics 2022, 12, 1406. [Google Scholar] [CrossRef]
- Archer, W.H. Oral and Maxillofacial Surgery; WB Saunders: Philadelphia, PA, USA, 1975; pp. 1045–1087. [Google Scholar]
- Hasegawa, T.; Tachibana, A.; Takeda, D.; Iwata, E.; Arimoto, S.; Sakakibara, A.; Akashi, M.; Komori, T. Risk Factors Associated with Oroantral Perforation during Surgical Removal of Maxillary Third Molar Teeth. Oral Maxillofac. Surg. 2016, 20, 369–375. [Google Scholar] [CrossRef]
- Iwata, E.; Hasegawa, T.; Kobayashi, M.; Tachibana, A.; Takata, N.; Oko, T.; Takeda, D.; Ishida, Y.; Fujita, T.; Goto, I.; et al. Can CT Predict the Development of Oroantral Fistula in Patients Undergoing Maxillary Third Molar Removal? Oral Maxillofac. Surg. 2021, 25, 7–17. [Google Scholar] [CrossRef]
- Bergstra, J.; Bengio, Y. Random Search for Hyper-Parameter Optimization. J. Mach. Learn. Res. 2012, 13, 281–305. [Google Scholar]
- Awang, M.N. Closure of Oroantral Fistula. Int. J. Oral Maxillofac. Surg. 1988, 17, 110–115. [Google Scholar] [CrossRef]
- Schuchardt, K. Treatment of Oro-Antral Perforations and Fistulae. Int. Dent. J. 1955, 5, 159. [Google Scholar]
- Fatani, B.; Fatani, A.; Alomar, A. Oro-Antral Communication and Fistula: A Review of the Literature. Saudi J. Oral Dent. Res. 2020, 5, 575–581. [Google Scholar] [CrossRef]
- Borgonovo, A.E.; Berardinelli, F.V.; Favale, M.; Maiorana, C. Surgical Options In Oroantral Fistula Treatment. Open Dent. J. 2012, 6, 94–98. [Google Scholar] [CrossRef] [PubMed]
- Salgado-Peralvo, A.-O.; Mateos-Moreno, M.-V.; Uribarri, A.; Kewalramani, N.; Peña-Cardelles, J.-F.; Velasco-Ortega, E. Treatment of Oroantral Communication with Platelet-Rich Fibrin: A Systematic Review. J. Stomatol. Oral Maxillofac. Surg. 2022; in press. [Google Scholar] [CrossRef]
- Straub, A.; Brands, R.; Borgmann, A.; Vollmer, A.; Hohm, J.; Linz, C.; Müller-Richter, U.; Kübler, A.C.; Hartmann, S. Free Skin Grafting to Reconstruct Donor Sites after Radial Forearm Flap Harvesting: A Prospective Study with Platelet-Rich Fibrin (PRF). J. Clin. Med. 2022, 11, 3506. [Google Scholar] [CrossRef] [PubMed]
- Lewusz-Butkiewicz, K.; Kaczor, K.; Nowicka, A. Risk Factors in Oroantral Communication While Extracting the Upper Third Molar: Systematic Review. Dent. Med. Probl. 2018, 55, 69–74. [Google Scholar] [CrossRef]
- De Tobel, J.; Radesh, P.; Vandermeulen, D.; Thevissen, P.W. An Automated Technique to Stage Lower Third Molar Development on Panoramic Radiographs for Age Estimation: A Pilot Study. J. Forensic Odontostomatol. 2017, 35, 42–54. [Google Scholar]
- Kim, Y.; Lee, K.J.; Sunwoo, L.; Choi, D.; Nam, C.-M.; Cho, J.; Kim, J.; Bae, Y.J.; Yoo, R.-E.; Choi, B.S.; et al. Deep Learning in Diagnosis of Maxillary Sinusitis Using Conventional Radiography. Investig. Radiol. 2019, 54, 7–15. [Google Scholar] [CrossRef]
- Hwang, J.-J.; Jung, Y.-H.; Cho, B.-H.; Heo, M.-S. An Overview of Deep Learning in the Field of Dentistry. Imaging Sci. Dent. 2019, 49, 1–7. [Google Scholar] [CrossRef]
- Hussain, E.; Hasan, M.; Rahman, M.A.; Lee, I.; Tamanna, T.; Parvez, M.Z. CoroDet: A Deep Learning Based Classification for COVID-19 Detection Using Chest X-Ray Images. Chaos Solitons Fractals 2021, 142, 110495. [Google Scholar] [CrossRef]
- Gianfrancesco, M.A.; Tamang, S.; Yazdany, J.; Schmajuk, G. Potential Biases in Machine Learning Algorithms Using Electronic Health Record Data. JAMA Intern. Med. 2018, 178, 1544–1547. [Google Scholar] [CrossRef]
- England, J.R.; Cheng, P.M. Artificial Intelligence for Medical Image Analysis: A Guide for Authors and Reviewers. Am. J. Roentgenol. 2019, 212, 513–519. [Google Scholar] [CrossRef]
- Weese, J.; Lorenz, C. Four Challenges in Medical Image Analysis from an Industrial Perspective. Med. Image Anal. 2016, 33, 44–49. [Google Scholar] [CrossRef] [PubMed]
- Lee, H.; Park, M.; Kim, J. Cephalometric Landmark Detection in Dental X-Ray Images Using Convolutional Neural Networks. In Proceedings of the Medical Imaging 2017: Computer-Aided Diagnosis, Orlando, FL, USA, 13–16 February 2017; pp. 494–499. [Google Scholar]
- Du, X.; Chen, Y.; Zhao, J.; Xi, Y. A Convolutional Neural Network Based Auto-Positioning Method For Dental Arch In Rotational Panoramic Radiography. In Proceedings of the 40th Annual International Conference of the IEEE Engineering in Medicine and Biology Society (EMBC), Honolulu, HI, USA, 18–22 July 2018; pp. 2615–2618. [Google Scholar]
- Bouquet, A.; Coudert, J.-L.; Bourgeois, D.; Mazoyer, J.-F.; Bossard, D. Contributions of Reformatted Computed Tomography and Panoramic Radiography in the Localization of Third Molars Relative to the Maxillary Sinus. Oral Surg. Oral Med. Oral Pathol. Oral Radiol. Endodontol. 2004, 98, 342–347. [Google Scholar] [CrossRef]
- Kilic, C.; Kamburoglu, K.; Yuksel, S.P.; Ozen, T. An Assessment of the Relationship between the Maxillary Sinus Floor and the Maxillary Posterior Teeth Root Tips Using Dental Cone-Beam Computerized Tomography. Eur. J. Dent. 2010, 4, 462–467. [Google Scholar] [CrossRef]
- Jung, Y.-H.; Nah, K.-S.; Cho, B.-H. Correlation of Panoramic Radiographs and Cone Beam Computed Tomography in the Assessment of a Superimposed Relationship between the Mandibular Canal and Impacted Third Molars. Imaging Sci. Dent. 2012, 42, 121–127. [Google Scholar] [CrossRef] [PubMed]
- Li, D.; Yang, Y.; Song, Y.-Z.; Hospedales, T.M. Deeper, Broader and Artier Domain Generalization. In Proceedings of the IEEE International Conference on Computer Vision, Venice, Italy, 22–29 October 2017; pp. 5542–5550. [Google Scholar]
- Zheng, Q.; Yang, M.; Zhang, Q.; Zhang, X.; Yang, J. Understanding and Boosting of Deep Convolutional Neural Network Based on Sample Distribution. In Proceedings of the IEEE 2nd Information Technology, Networking, Electronic and Automation Control Conference (ITNEC), Chengdu, China, 12–15 December 2017; pp. 823–827. [Google Scholar]
- Gudigar, A.; Chokkadi, S. A Review on Automatic Detection and Recognition of Traffic Sign. Multimed. Tools Appl. 2016, 75, 333–364. [Google Scholar] [CrossRef]
- Zhang, Z.; Xu, C.; Yang, J.; Tai, Y.; Chen, L. Deep Hierarchical Guidance and Regularization Learning for End-to-End Depth Estimation. Pattern Recognit. 2018, 83, 430–442. [Google Scholar] [CrossRef]
- Kendall, A.; Gal, Y. What Uncertainties Do We Need in Bayesian Deep Learning for Computer Vision? In Proceedings of the 31st International Conference on Neural Information Processing Systems, Long Beach, CA, USA, 4–9 December 2017. [Google Scholar]
- Zheng, Q.; Tian, X.; Yang, M.; Wang, H. Differential Learning: A Powerful Tool for Interactive Content-Based Image Retrieval. Eng. Lett. 2019, 27, 202–215. [Google Scholar]
- Kobayashi, T. Flip-Invariant Motion Representation. In Proceedings of the IEEE International Conference on Computer Vision, Venice, Italy, 22–29 October 2017; pp. 5628–5637. [Google Scholar]
- Zhang, K.; Zuo, W.; Chen, Y.; Meng, D.; Zhang, L. Beyond a Gaussian Denoiser: Residual Learning of Deep Cnn for Image Denoising. IEEE Trans. Image Process. 2017, 26, 3142–3155. [Google Scholar] [CrossRef]
- Srivastava, N.; Hinton, G.; Krizhevsky, A.; Sutskever, I.; Salakhutdinov, R. Dropout: A Simple Way to Prevent Neural Networks from Overfitting. J. Mach. Learn. Res. 2014, 15, 1929–1958. [Google Scholar]
- Wan, L.; Zeiler, M.; Zhang, S.; Le Cun, Y.; Fergus, R. Regularization of Neural Networks Using Dropconnect. In Proceedings of the International Conference on Machine Learning PMLR, Atlanta, GA, USA, 17–19 June 2013; pp. 1058–1066. [Google Scholar]
- Szegedy, C.; Liu, W.; Jia, Y.; Sermanet, P.; Reed, S.; Anguelov, D.; Erhan, D.; Vanhoucke, V.; Rabinovich, A. Going Deeper with Convolutions. In Proceedings of the IEEE Conference on Computer Vision and Pattern Recognition, Boston, MA, USA, 7–12 June 2015; pp. 1–9. [Google Scholar]
- He, K.; Zhang, X.; Ren, S.; Sun, J. Delving Deep into Rectifiers: Surpassing Human-Level Performance on Imagenet Classification. In Proceedings of the IEEE International Conference on Computer Vision, Santiago, Chile, 7–13 December 2015; pp. 1026–1034. [Google Scholar]
- Zhang, Q.; Liu, A.; Tong, X. Early Stopping Criterion for Belief Propagation Polar Decoder Based on Frozen Bits. Electron. Lett. 2017, 53, 1576–1578. [Google Scholar] [CrossRef]
- Carpenter, G.A.; Ross, W.D. ART-EMAP: A Neural Network Architecture for Object Recognition by Evidence Accumulation. IEEE Trans. Neural Netw. 1995, 6, 805–818. [Google Scholar] [CrossRef] [PubMed]
- Zheng, Q.; Yang, M.; Tian, X.; Jiang, N.; Wang, D. A Full Stage Data Augmentation Method in Deep Convolutional Neural Network for Natural Image Classification. Discret. Dyn. Nat. Soc. 2020, 2020, 4706576. [Google Scholar] [CrossRef]
- Jin, B.; Cruz, L.; Goncalves, N. Deep Facial Diagnosis: Deep Transfer Learning from Face Recognition to Facial Diagnosis. IEEE Access 2020, 8, 123649–123661. [Google Scholar] [CrossRef]
- Saravi, B.; Hassel, F.; Ülkümen, S.; Zink, A.; Shavlokhova, V.; Couillard-Despres, S.; Boeker, M.; Obid, P.; Lang, G.M. Artificial Intelligence-Driven Prediction Modeling and Decision Making in Spine Surgery Using Hybrid Machine Learning Models. J. Pers. Med. 2022, 12, 509. [Google Scholar] [CrossRef] [PubMed]
- Izzetti, R.; Nisi, M.; Aringhieri, G.; Crocetti, L.; Graziani, F.; Nardi, C. Basic Knowledge and New Advances in Panoramic Radiography Imaging Techniques: A Narrative Review on What Dentists and Radiologists Should Know. Appl. Sci. 2021, 11, 7858. [Google Scholar] [CrossRef]
- Lim, A.A.T.; Wong, C.W.; Allen, J.C. Maxillary Third Molar: Patterns of Impaction and Their Relation to Oroantral Perforation. J. Oral Maxillofac. Surg. 2012, 70, 1035–1039. [Google Scholar] [CrossRef]
- Obayashi, N.; Ariji, Y.; Goto, M.; Izumi, M.; Naitoh, M.; Kurita, K.; Shimozato, K.; Ariji, E. CT Analyses of the Location of the Maxillary Third Molar in Relation to Panoramic Radiographic Appearance. Oral Radiol. 2009, 25, 108. [Google Scholar] [CrossRef]
Publisher’s Note: MDPI stays neutral with regard to jurisdictional claims in published maps and institutional affiliations. |
© 2022 by the authors. Licensee MDPI, Basel, Switzerland. This article is an open access article distributed under the terms and conditions of the Creative Commons Attribution (CC BY) license (https://creativecommons.org/licenses/by/4.0/).