Article

Mechanical Test of Sleeve Grouted Lapping Connectors under Uniaxial Tension and High-Stress Repeated Tension and Compression Loading

1
Department of Disaster Mitigation for Structures, Tongji University, Shanghai 200092, China
2
Shanxi Construction Engineering Group Co., Ltd., Taiyuan 030006, China
3
Shanxi Erjian Group Co., Ltd., Taiyuan 030013, China
*
Author to whom correspondence should be addressed.
Appl. Sci. 2022, 12(13), 6736; https://doi.org/10.3390/app12136736
Submission received: 2 May 2022 / Revised: 6 June 2022 / Accepted: 14 June 2022 / Published: 2 July 2022

Abstract

:

Featured Application

The grouted sleeve lapping connector proposed in this work has many advantages, including low cost, ease of construction, simple grout compaction, and a large diameter of the sleeve, and it can be used in precast concrete structures for resisting earthquakes and wind loads.

Abstract

In this study, uniaxial tension tests and high-stress repeated tension and compression tests were conducted on 32 APC (all vertical members precast in concrete structures) connectors. After high-stress repeated tension and compression, the bearing capacities of the connector specimens improved due to the strengthening of the steel bars, and the ductility of the specimens was reduced due to the further development of cracks between the steel bars and the grout. The residual deformation values of the specimens, namely u0 (uniaxial tension) and u20 (repeated tension and compression), were reduced with the increase in the lapping length of the specimens. The longitudinal compressive strain and hoop tensile strain of the middle section of the sleeve near the steel bar side were reduced under the ultimate load state when the specimens were stretched under uniaxial tension and in the last tension process after repeated loading with the increase in the lapping length. The distribution and development of the longitudinal compression stress of the sleeve were analysed based on the bonding stress of the steel bar and concrete. Finally, the ultimate bonding strength and critical lapping length formulas were proposed, which involved the introduction of a grouting defect coefficient ω.

1. Introduction

Precast concrete structures have the advantages of convenience in construction and environmental friendliness [1]. Recently, the use of precast concrete members has increased [2]. The sleeve grouting connector plays a decisive role in determining whether a precast structure can perform its prescribed function. At present, most sleeve grouting connectors are grouted splice connectors. To fabricate a grouted splice connector, two steel bars are placed and spliced at the centre of the sleeve, and grouting material is poured into the sleeve to fill the volume of the sleeve and left to cure until it reaches its final strength. A sketch of this type of connector is shown in Figure 1a. There have been many studies on grouted splice connectors [3,4,5,6,7]. The results of an experimental study conducted by Ling et al. [8] showed that the bearing capacity of the connector was increased by reducing the inner diameter of the sleeve and increasing the embedded length. Alias et al. [9] showed in an experimental study that the stiffness of the connectors was increased with the increase in the embedded length. Ahmad et al. [10] conducted uniaxial tension tests of connectors with the lapping length and diameter of the sleeve as the research parameters. Eliya et al. [11] proposed that the ultimate bearing capacity of the connector was higher than that of the steel bar when the lapping length was no less than eight times the diameter of the steel bar. Li et al. [12] showed that the existence of internal defects reduced the bearing capacity, rigidity, ductility, and energy dissipation capacity of the connector. Furthermore, there have also been many studies of grouted splice connectors under repeated load [13,14,15,16,17]. Liu et al. [18] carried out tests of grouted splice connectors under uniaxial tension, high stress, and large deformation during repeated tension and compression, and they analysed the effects of the steel bar diameter, sleeve form, and deflection of the steel bar on the mechanical properties of the connectors. Xu et al. [19] found that there was no significant effect on the connector performance under high-stress repeated tension and compression loading. Zhao et al. [20] showed that the peak loads of grouted sleeve connectors were reduced after cyclic loading. Wang et al. [21] carried out tests of grouted sleeve connections under cyclic loading, and the results showed that buckling of steel occurred for all grouted sleeve connections under cyclic loads.
A shear key and notch needs to be set in the inner wall of the grouted splice connector to improve the force transmission performance of the connector, which requires high performance material and accurate casting. Moreover, the sleeve diameter must be small to obtain a larger bearing capacity, so it is difficult to insert steel bars when members are in place. In addition, the grouting material is not easy to compact, which leads to security problems.
Due to the disadvantages of grouted splice connectors, Yu developed a grouted sleeve lapping connector for which the vertical members could be fully prefabricated after the connector was used. Yu named this connector the APC (all vertical members precast in concrete structures) connector [22]. A sketch of the grouted sleeve lapping connector is shown in Figure 1b. To create this connector, two steel bars are lapped and placed in the sleeve while the grouting material is poured in, and the sleeve is used to constrain the steel bars, which greatly improves the bearing capacity of the connector.
Importantly, the grouted sleeve lapping connector is under a strong constraint and the force directions of two steel bars lapped in the sleeve are opposite; thus, the direction of the force that it provides to the sleeve (grouting material) is opposite, and the force is diminished, which is known as the interlock phenomenon (Figure 2). Figure 2 shows the distribution of longitudinal sleeve-grout bond stress in cross section of the sleeve, where the size of symbol “×” and symbol “●” indicate the relative magnitude of stress. In this way, the tensile load of the sleeve is small. Furthermore, the stress mechanism of the grouted sleeve lapping connector was studied in the literature [23]. The results showed that the sleeve was longitudinally stretched at the initial stage of loading, while the sleeve was longitudinally compressed in the late period of the loading process. As a result, the requirements for the material properties of the sleeve are low and the inner wall does not need to be treated. The grouting material can be reinforced by C60 grouting material. In addition, the inner diameter of the sleeve is large, and the maximum particle size of the grouting material can be controlled to be smaller than 4.75 mm. All the above points can lower the cost of the connector.
Comparative tests on the mechanical properties of grouted splice connectors and APC connectors were conducted by Yu et al. [24]; it was shown that the constraint on the grouting material of an APC connector was stronger than that of a grouted splice connector, and the mechanical properties of the APC connector were better than those of the grouted splice connector. The APC connectors have mainly been studied using uniaxial tension tests [23,25] to determine the bearing capacity, load–displacement curves, and hoop and longitudinal strains of the sleeves. Meanwhile, the ductility, residual deformation, and hoop and longitudinal strain of the APC connector under high-stress repeated tension and compression loads have largely gone uninvestigated. The force distribution and constraint mechanism under repeated tension and compression loads need to be studied to fully understand the mechanical properties of connectors. It is also significant to research the bonding performance of connectors under repeated tension and compression loads since bonding plays an important role in resisting earthquake forces and wind loads.
In this study, 32 APC connectors were tested under uniaxial tension and high-stress repeated tension and compression loading. The failure mode, load–displacement curves, ductility, residual deformation, and hoop and longitudinal strain curves were analysed with the lapping length of the steel bar as a variable parameter. Moreover, the mechanical mechanism of the connector under compression was analysed, and an equation for calculating the average bonding stress and critical lapping length was proposed based on the defects of the connector.

2. Experimental Program

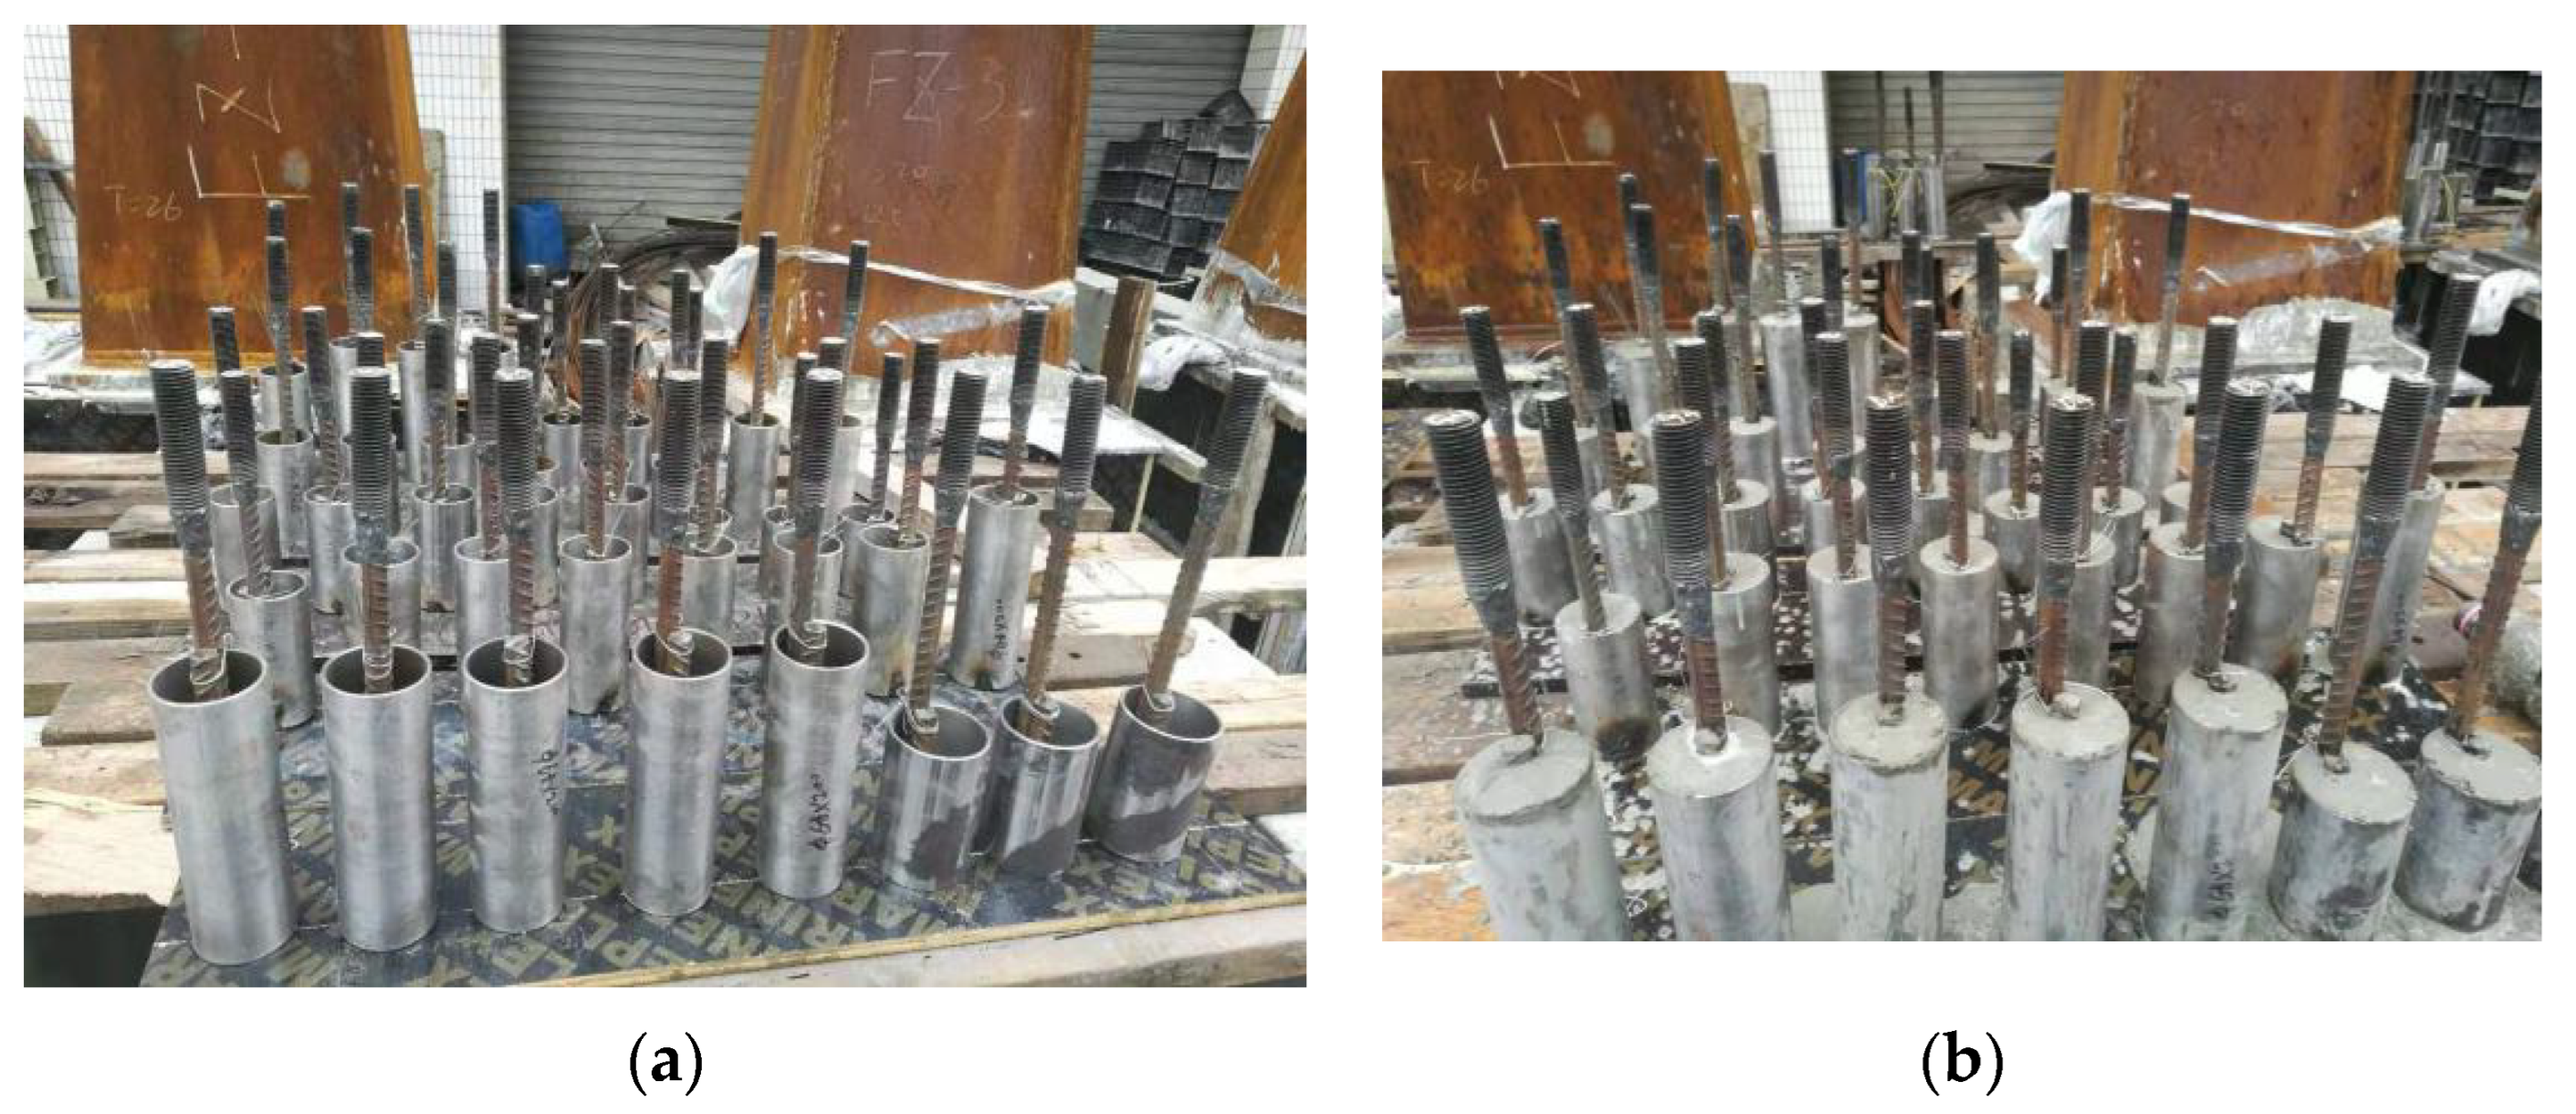
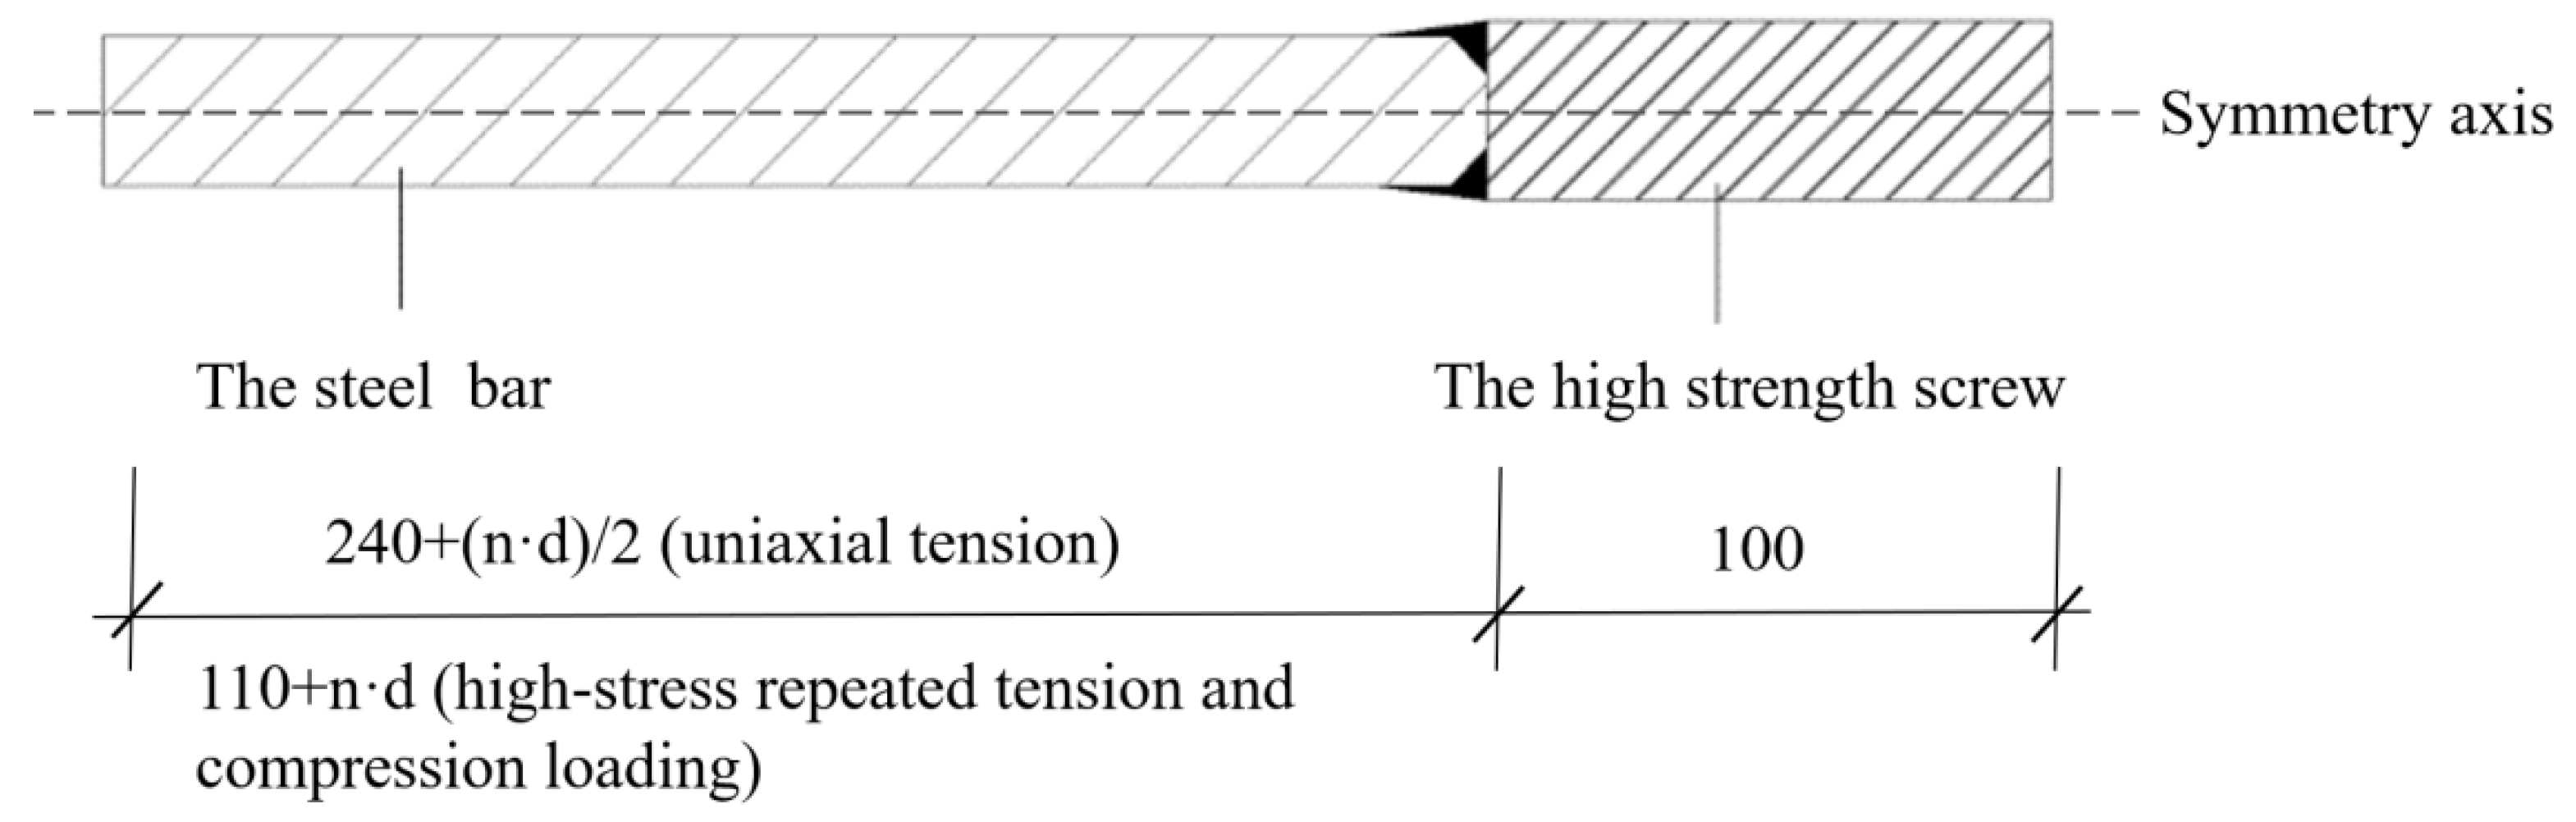
2.1. Design and Production of APC Connector Specimens

In the tests, two overlapping steel bars were in an unfavourable working condition, that is, two steel bars were placed close to each other along the radial direction of the sleeve. The dimensions of the APC connector specimens are shown in Figure 3 (n = 6, 8, 10, 12.5). The production process of the specimens was as follows. First, a reserved steel bar was spot-welded at both ends of a sleeve, and then another steel bar was placed close to the reserved bar. Finally, grouting material was poured into the sleeve. Photographs of the specimens before and after the grouting material was poured are shown in Figure 4. To prevent deflection, a high-strength screw was welded at the end of the steel bar to facilitate the connection with the loading head in the anti-deflection device. A schematic diagram of the high-strength screw is shown in Figure 5.

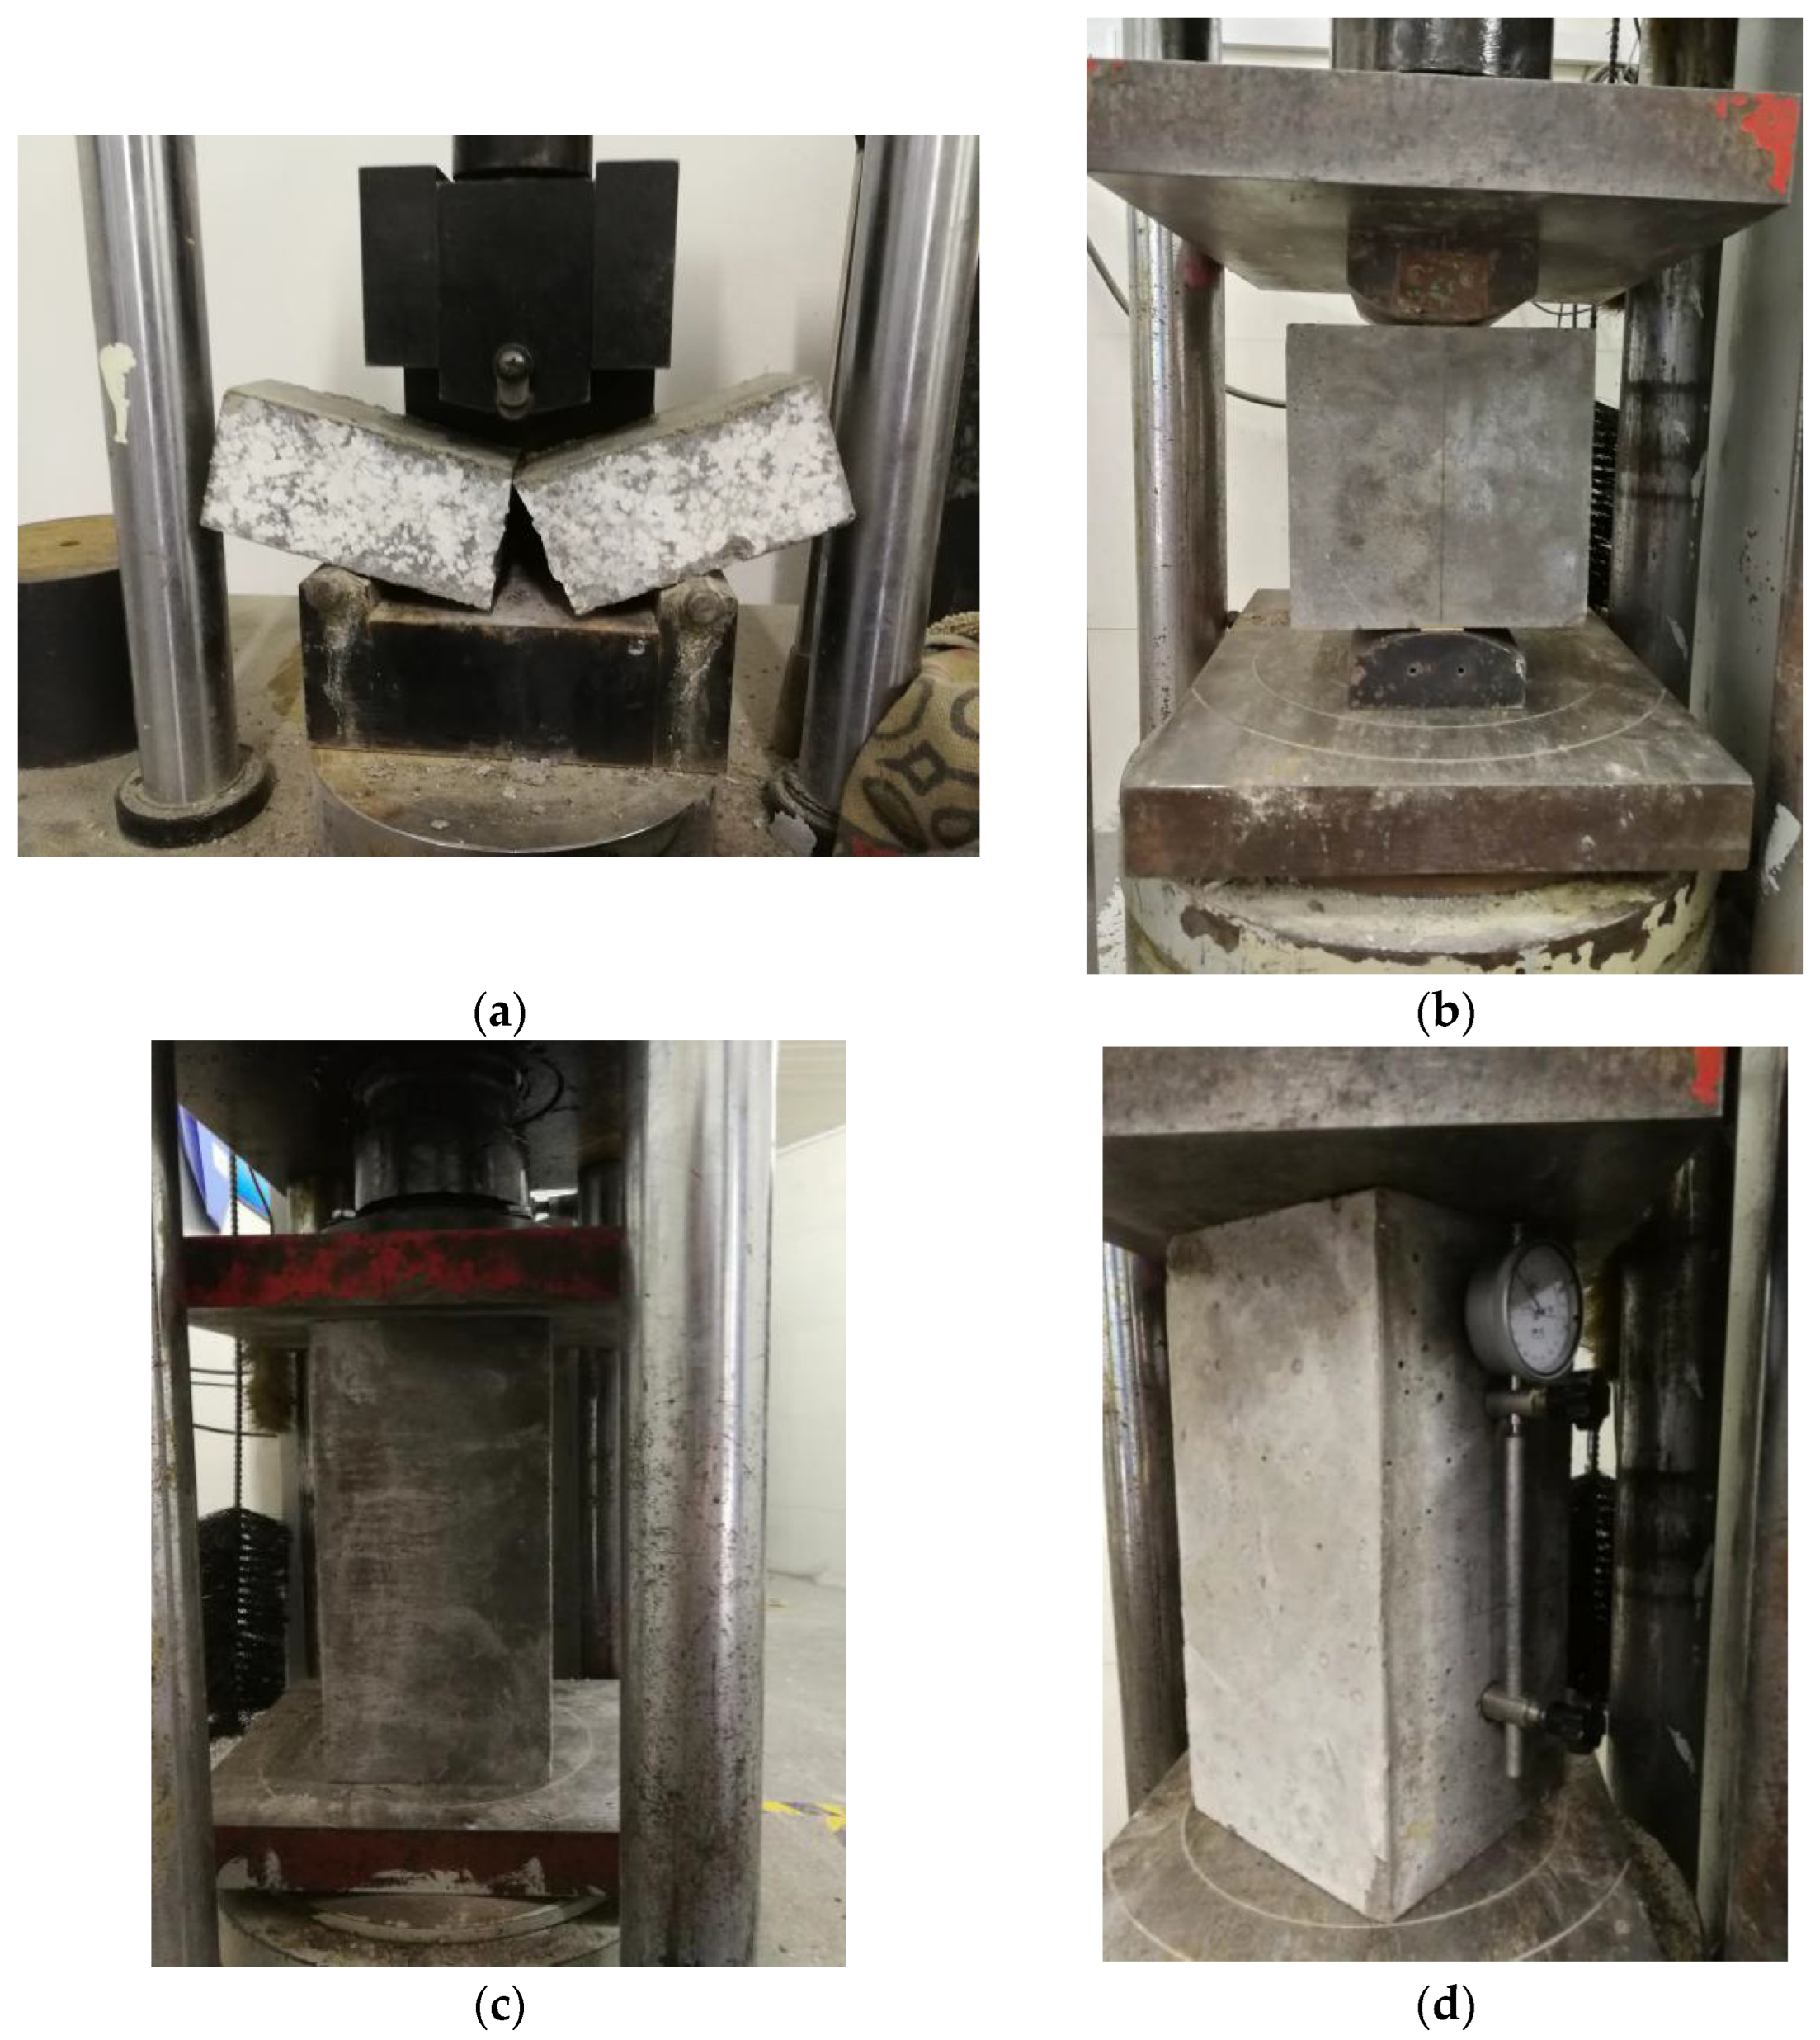
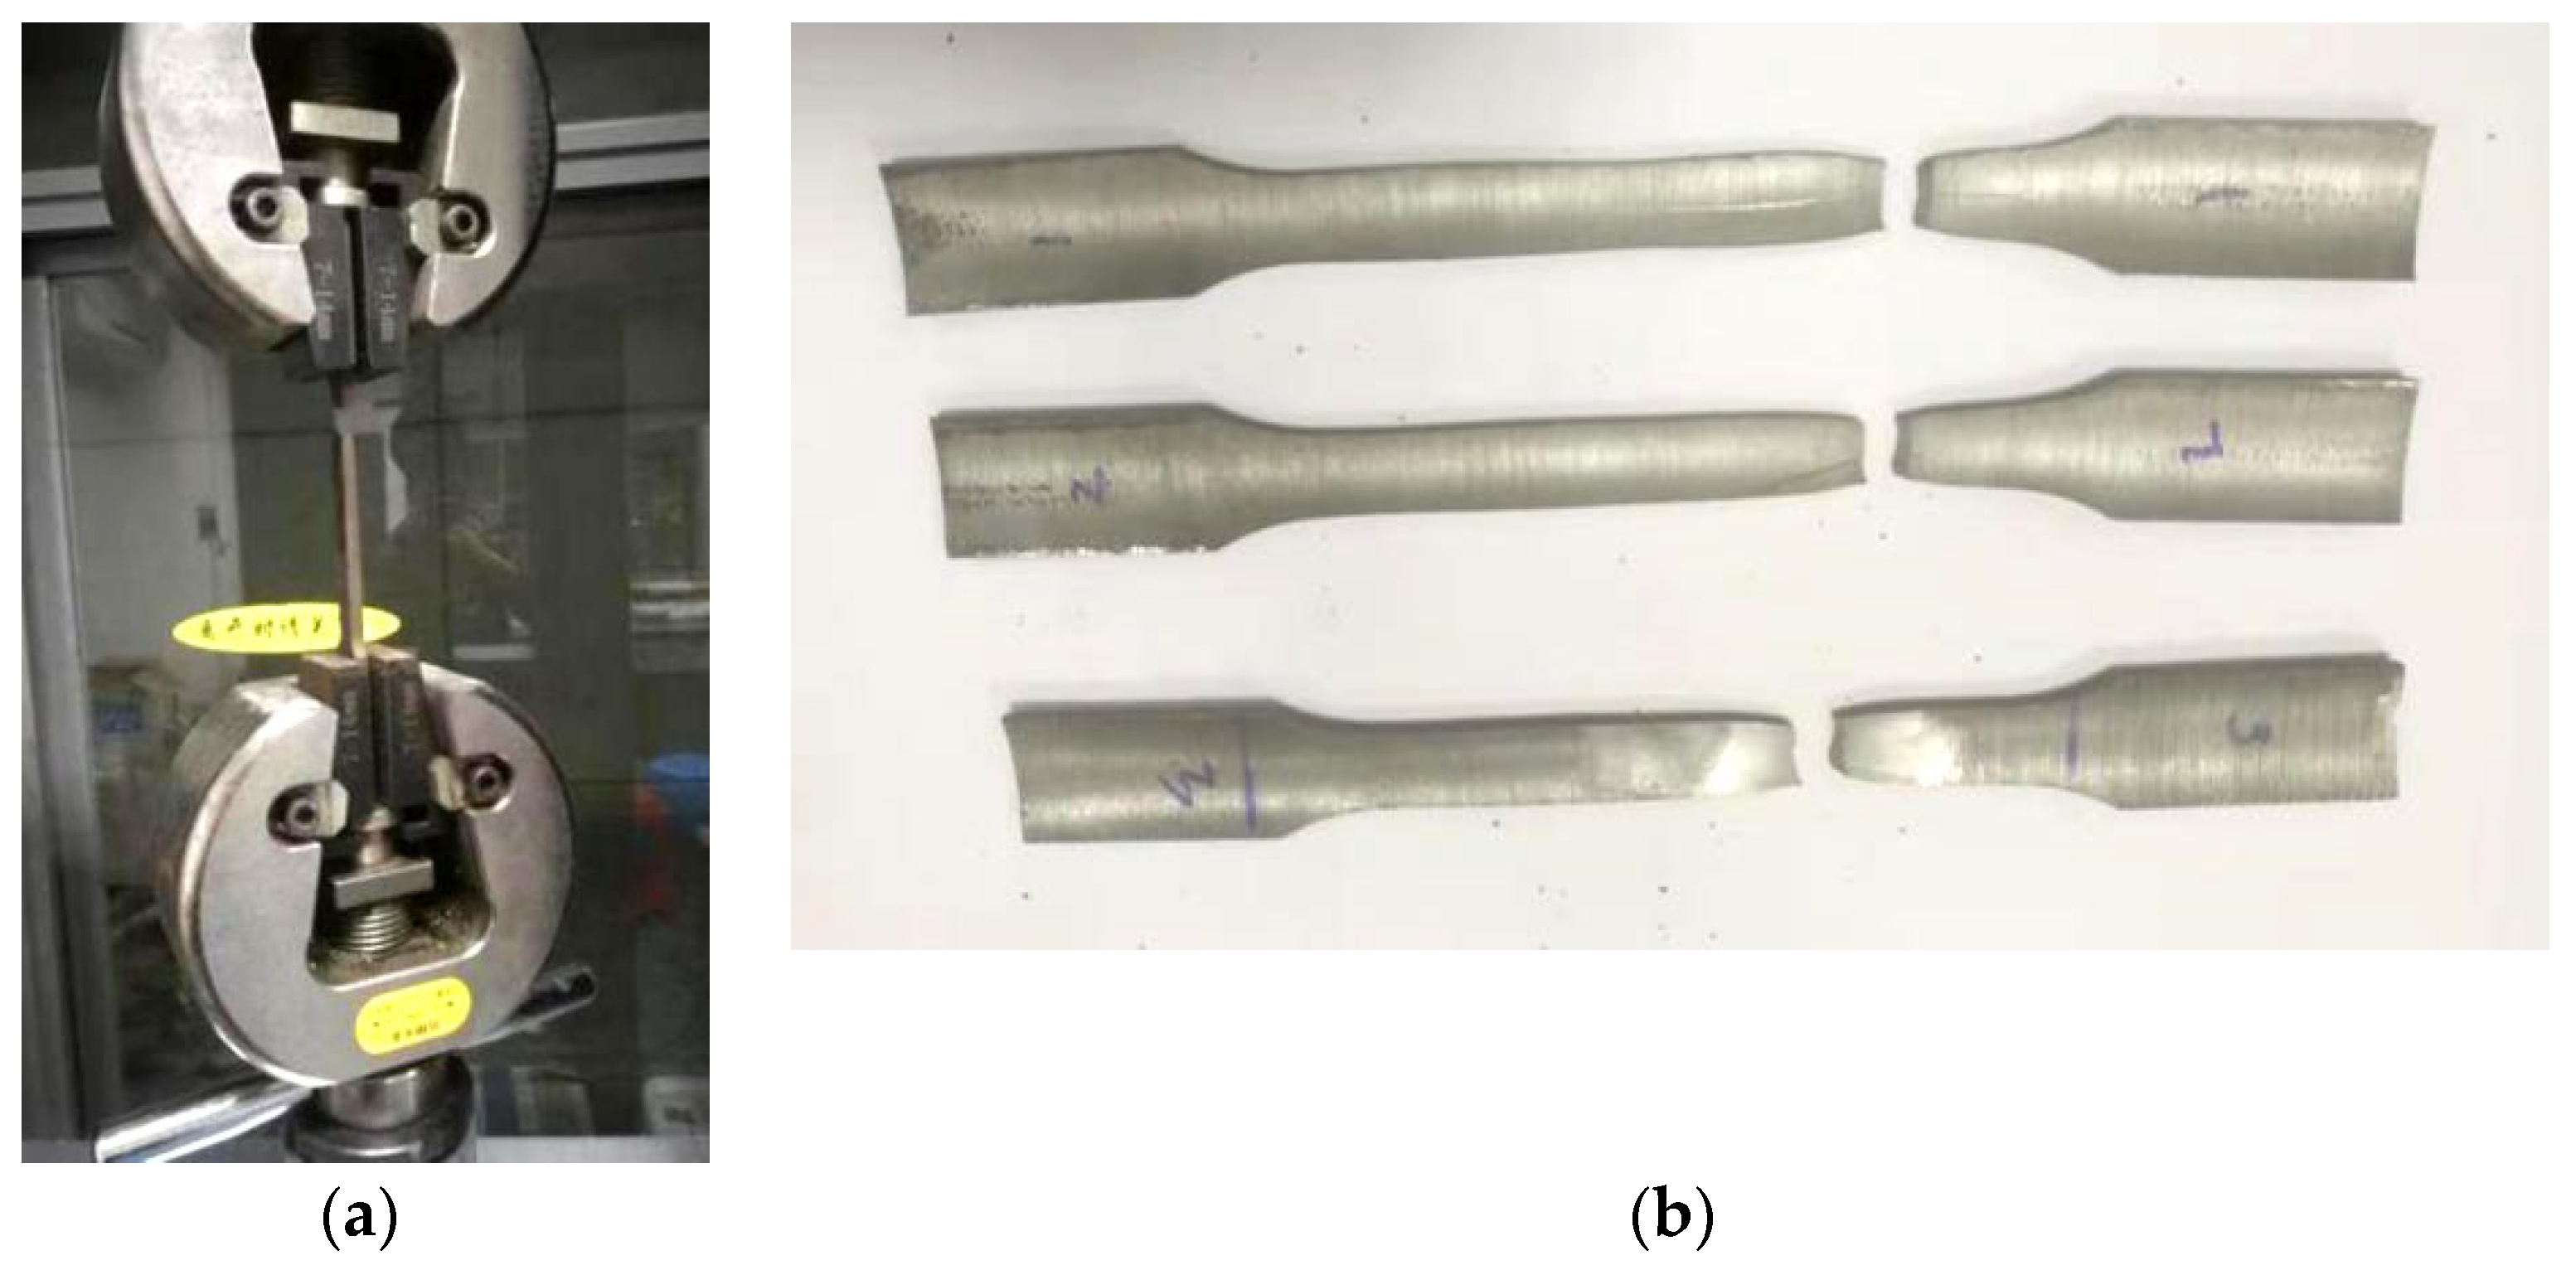
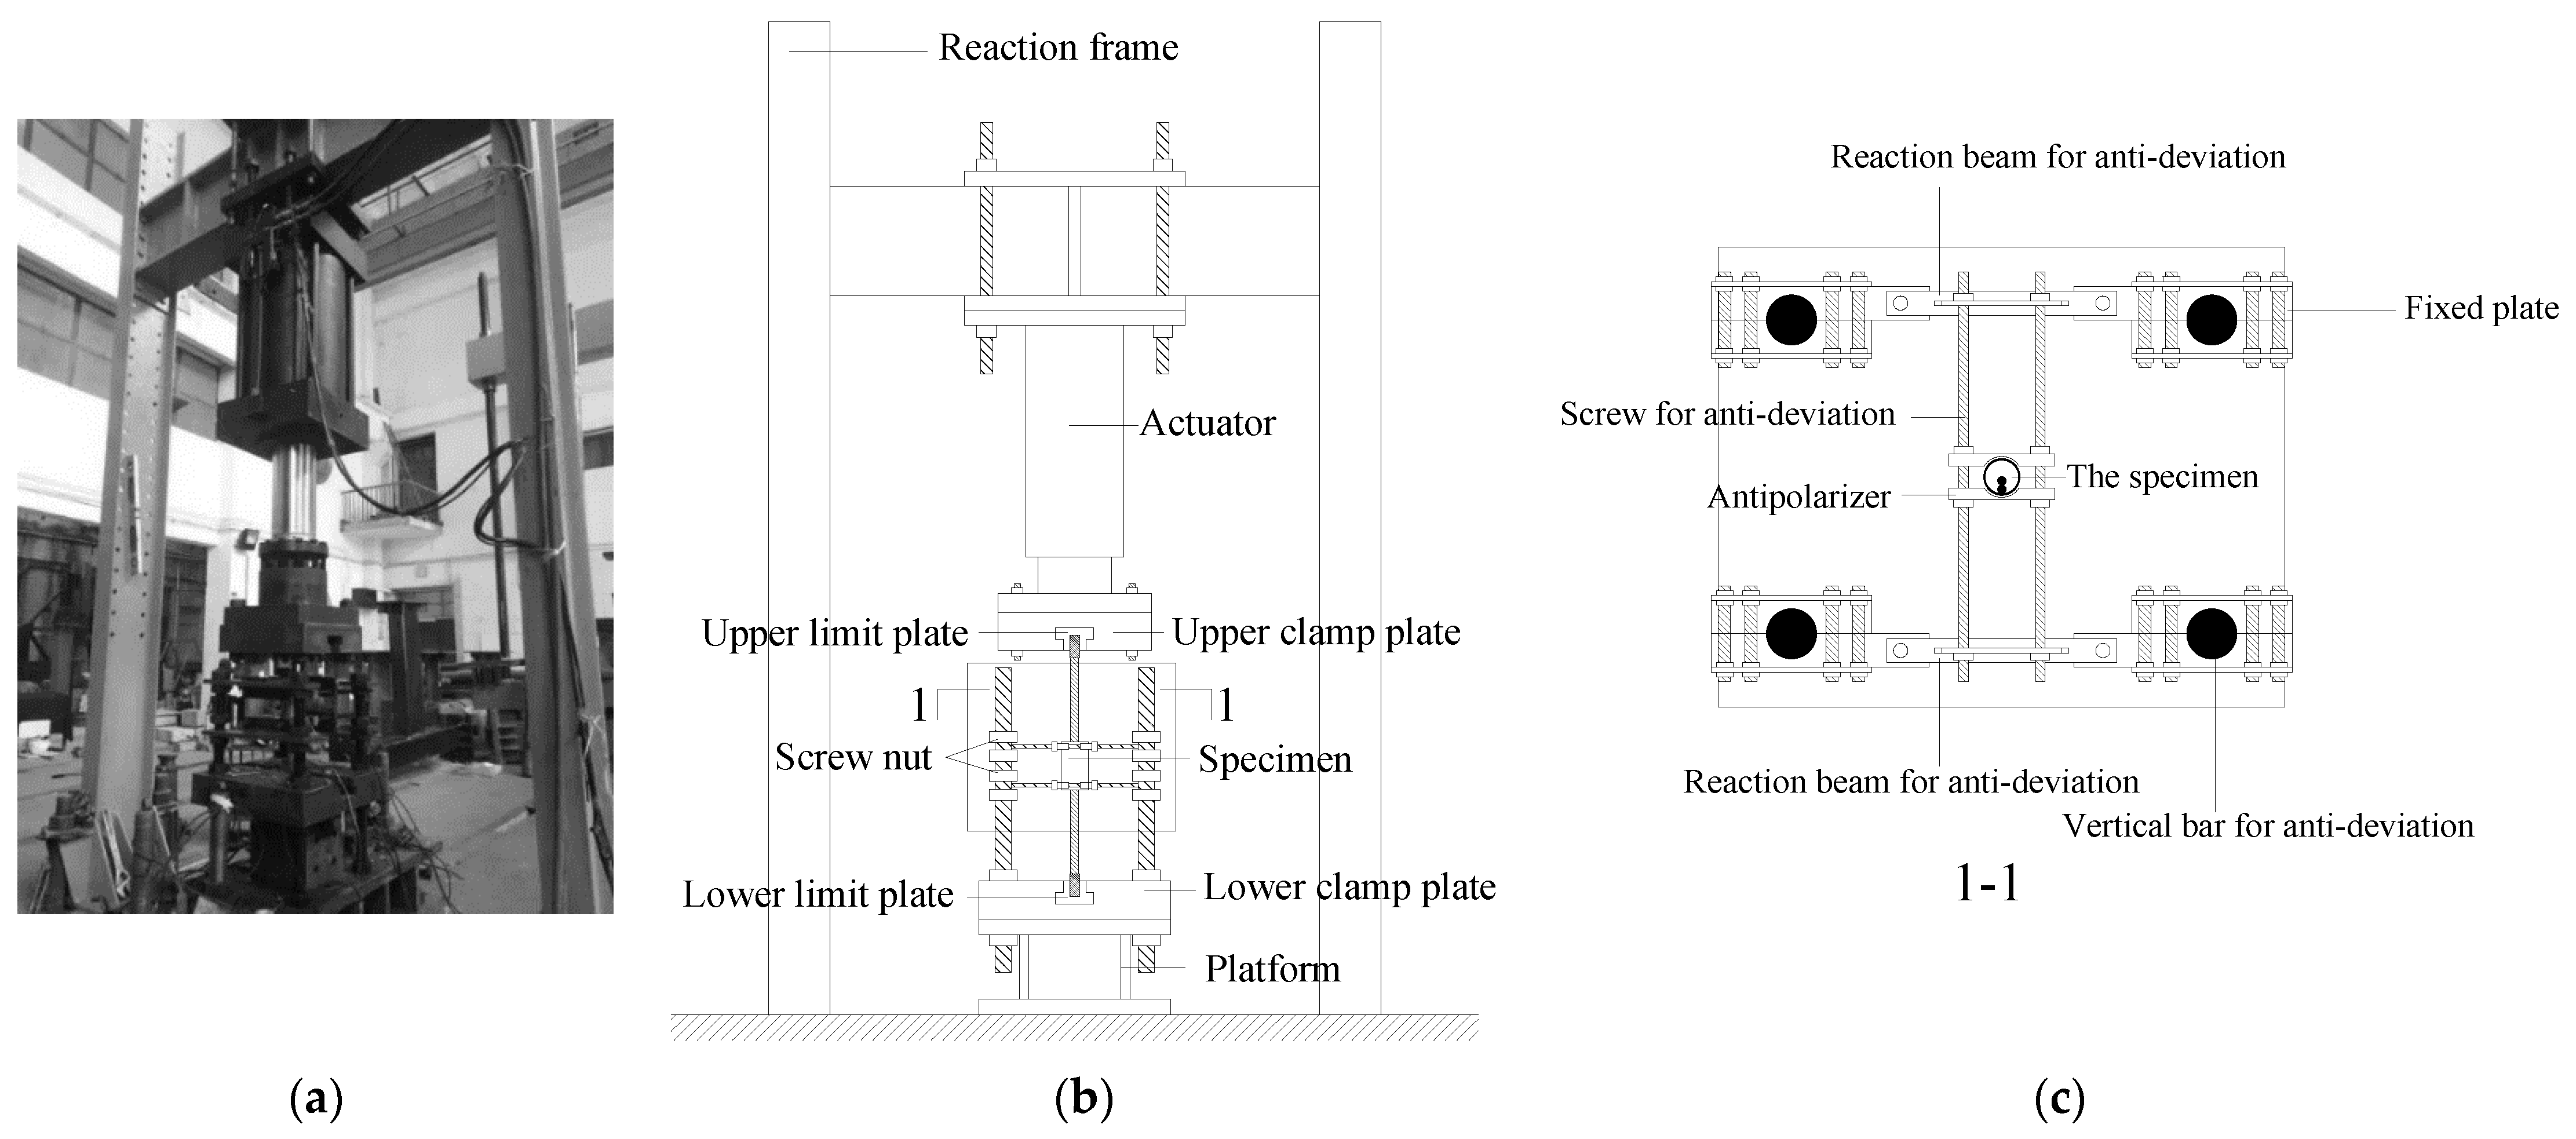
2.2. Material Properties and Experimental Setup

The inner diameter of the sleeve was 62 mm, and its wall thickness was 3 mm. A steel bar with a diameter of 16 mm and a strength grade of HRB400 was used in the tests. The H-40 grouting material was selected as the grouting material, and its elastic modulus was 4.82 × 10⁴ MPa. The rupture and compressive strengths of the grouting material were 7.3 and 74.7 MPa, respectively, after 28 days of curing [26]. The splitting tensile strength [27] of the 150 mm × 150 mm × 150 mm grout test block was 4.12 MPa after 28 days of curing. The axial compressive strength [27] of the 150 mm × 150 mm × 300 mm grout test block was 73.6 MPa after 28 days of curing. Photographs of the test setups are shown in Figure 6.
The sleeve was made of Q235 seamless steel pipe. Uniaxial tension tests of three dog-bone-shaped specimens were carried out, and the yield and ultimate strengths met the requirements of the material according to the specifications [28]. Photographs from the tests are shown in Figure 7, and the material properties determined by the tests are shown in Table 1.
The equipment used for the uniaxial tension and high-stress repeated tension and compression loading tests was a microcomputer-controlled electro-hydraulic servo universal testing machine. The loading equipment for the repeated tension and compression is shown in Figure 8, and the anti-deflection vertical rod, anti-deflection reaction beam, anti-deflection screw, and anti-deflection device were set for effective anti-deflection [29].

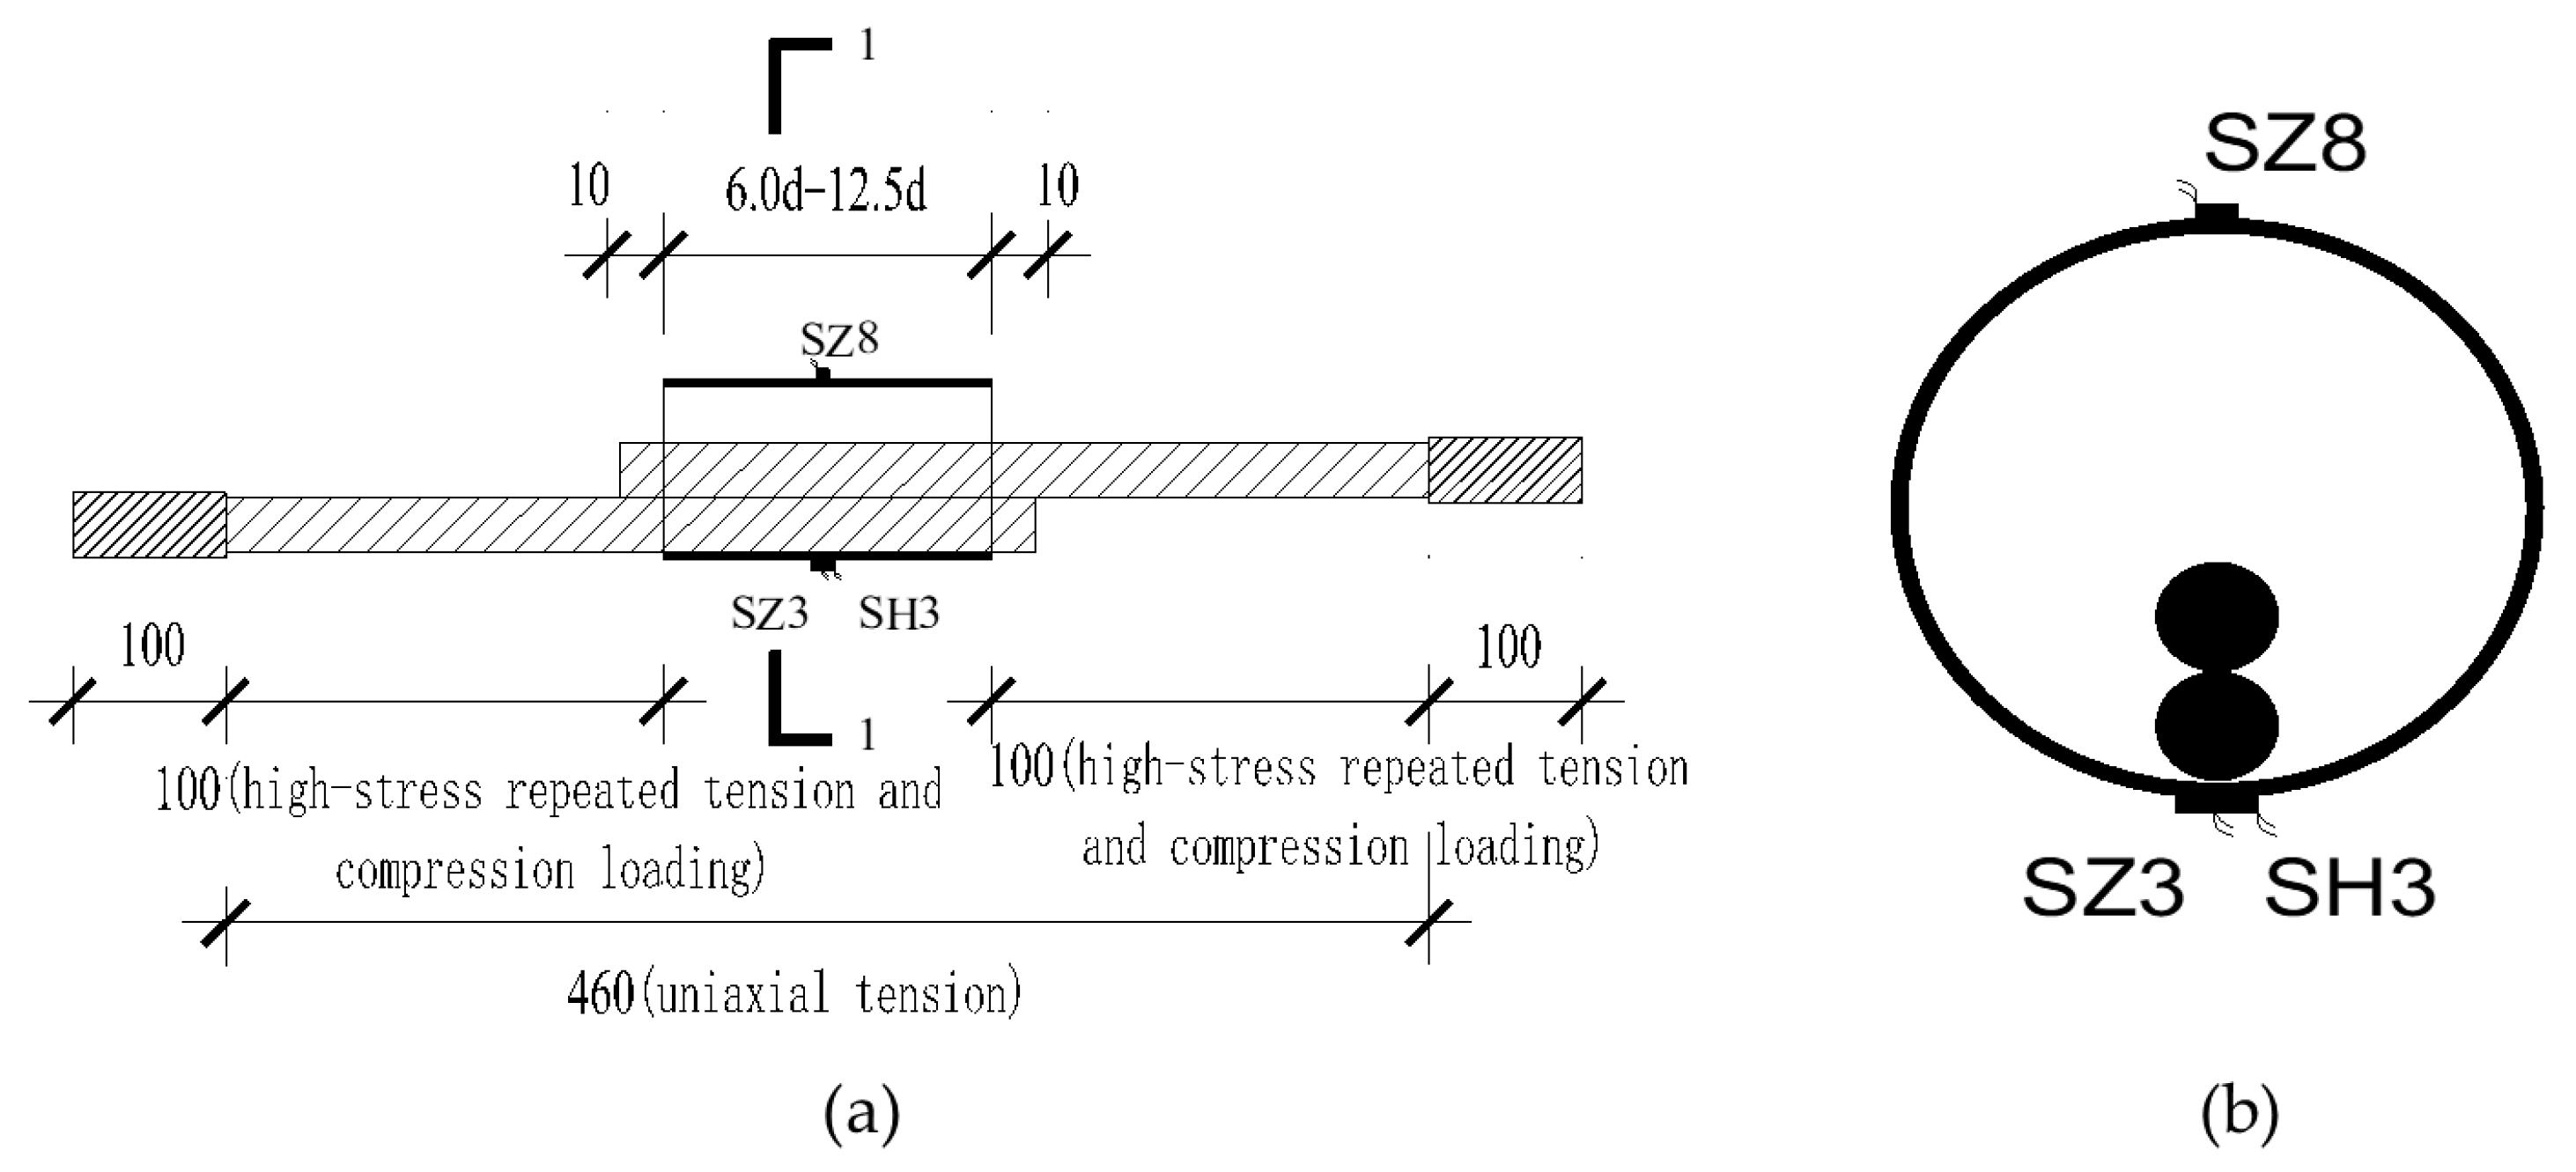
2.3. Scheme and Measurement of the Specimen

The loading scheme was determined according to the literature [30], and the loading stress rate was set at 2 MPa/s and did not exceed 10 MPa/s when measuring the residual deformation values of the specimens. The loading scheme and the limit of residual deformation in the specification are shown in Table 2 in accordance with the grade-I connection standard.
Strain gauges SH3 and SZ3 were installed on the inner wall near the steel bar to measure the hoop and longitudinal strain in the middle section of the sleeve, respectively, and strain gauge SZ8 was installed on the inner wall far from the steel to measure the longitudinal strain in the middle of the sleeve. The locations of the strain gauges are shown in Figure 9.
As shown in Figure 10, two displacement meters were arranged symmetrically on both sides of the steel bar of the specimen to measure the internal displacement within the gauge distance (L1 = L + 4d). Mechanical indices, such as the residual deformation of the connection, were calculated as the average value of the readings of the two displacement meters.

3. Experimental Results and Failure Modes

The failure modes and mechanical properties of each specimen are shown in Table 3.
Under uniaxial tension, the specimens exhibited two failure modes: steel bar tensile failure and steel bar pull out, as shown in Figure 11 and Figure 12, respectively. Under high-stress repeated tension and compression loading, the specimens exhibited three failure modes: steel bar tensile failure, steel bar pull out, and steel bar bending (as shown in Figure 13, bending failure under compression was a process in which the steel bar was bent but the load was not to −0.5 fyk for the first wheel). Because the specimens were tested to failure, repeated loading tests could not be completed. The most common failure modes of the specimens with a lapping length of 6d were steel bar pull out and steel bar bending, the latter of which applies only to specimens under repeated tension and compression loading. As the lapping length increased from 6d to 8d, the failure mode of the specimen changed from steel bar pull out to steel bar tensile failure, and the bearing capacity of the specimen was increased. With a lapping length of 10d, all the specimens were broken via steel bar tensile failure, most of which were broken at the weld. With the lapping length of 12.5d, the steel bar was mostly broken via steel bar tensile failure at the reinforcing base, and the bearing capacity of the specimen was determined by the properties of the reinforcing base.

4. Mechanical Properties

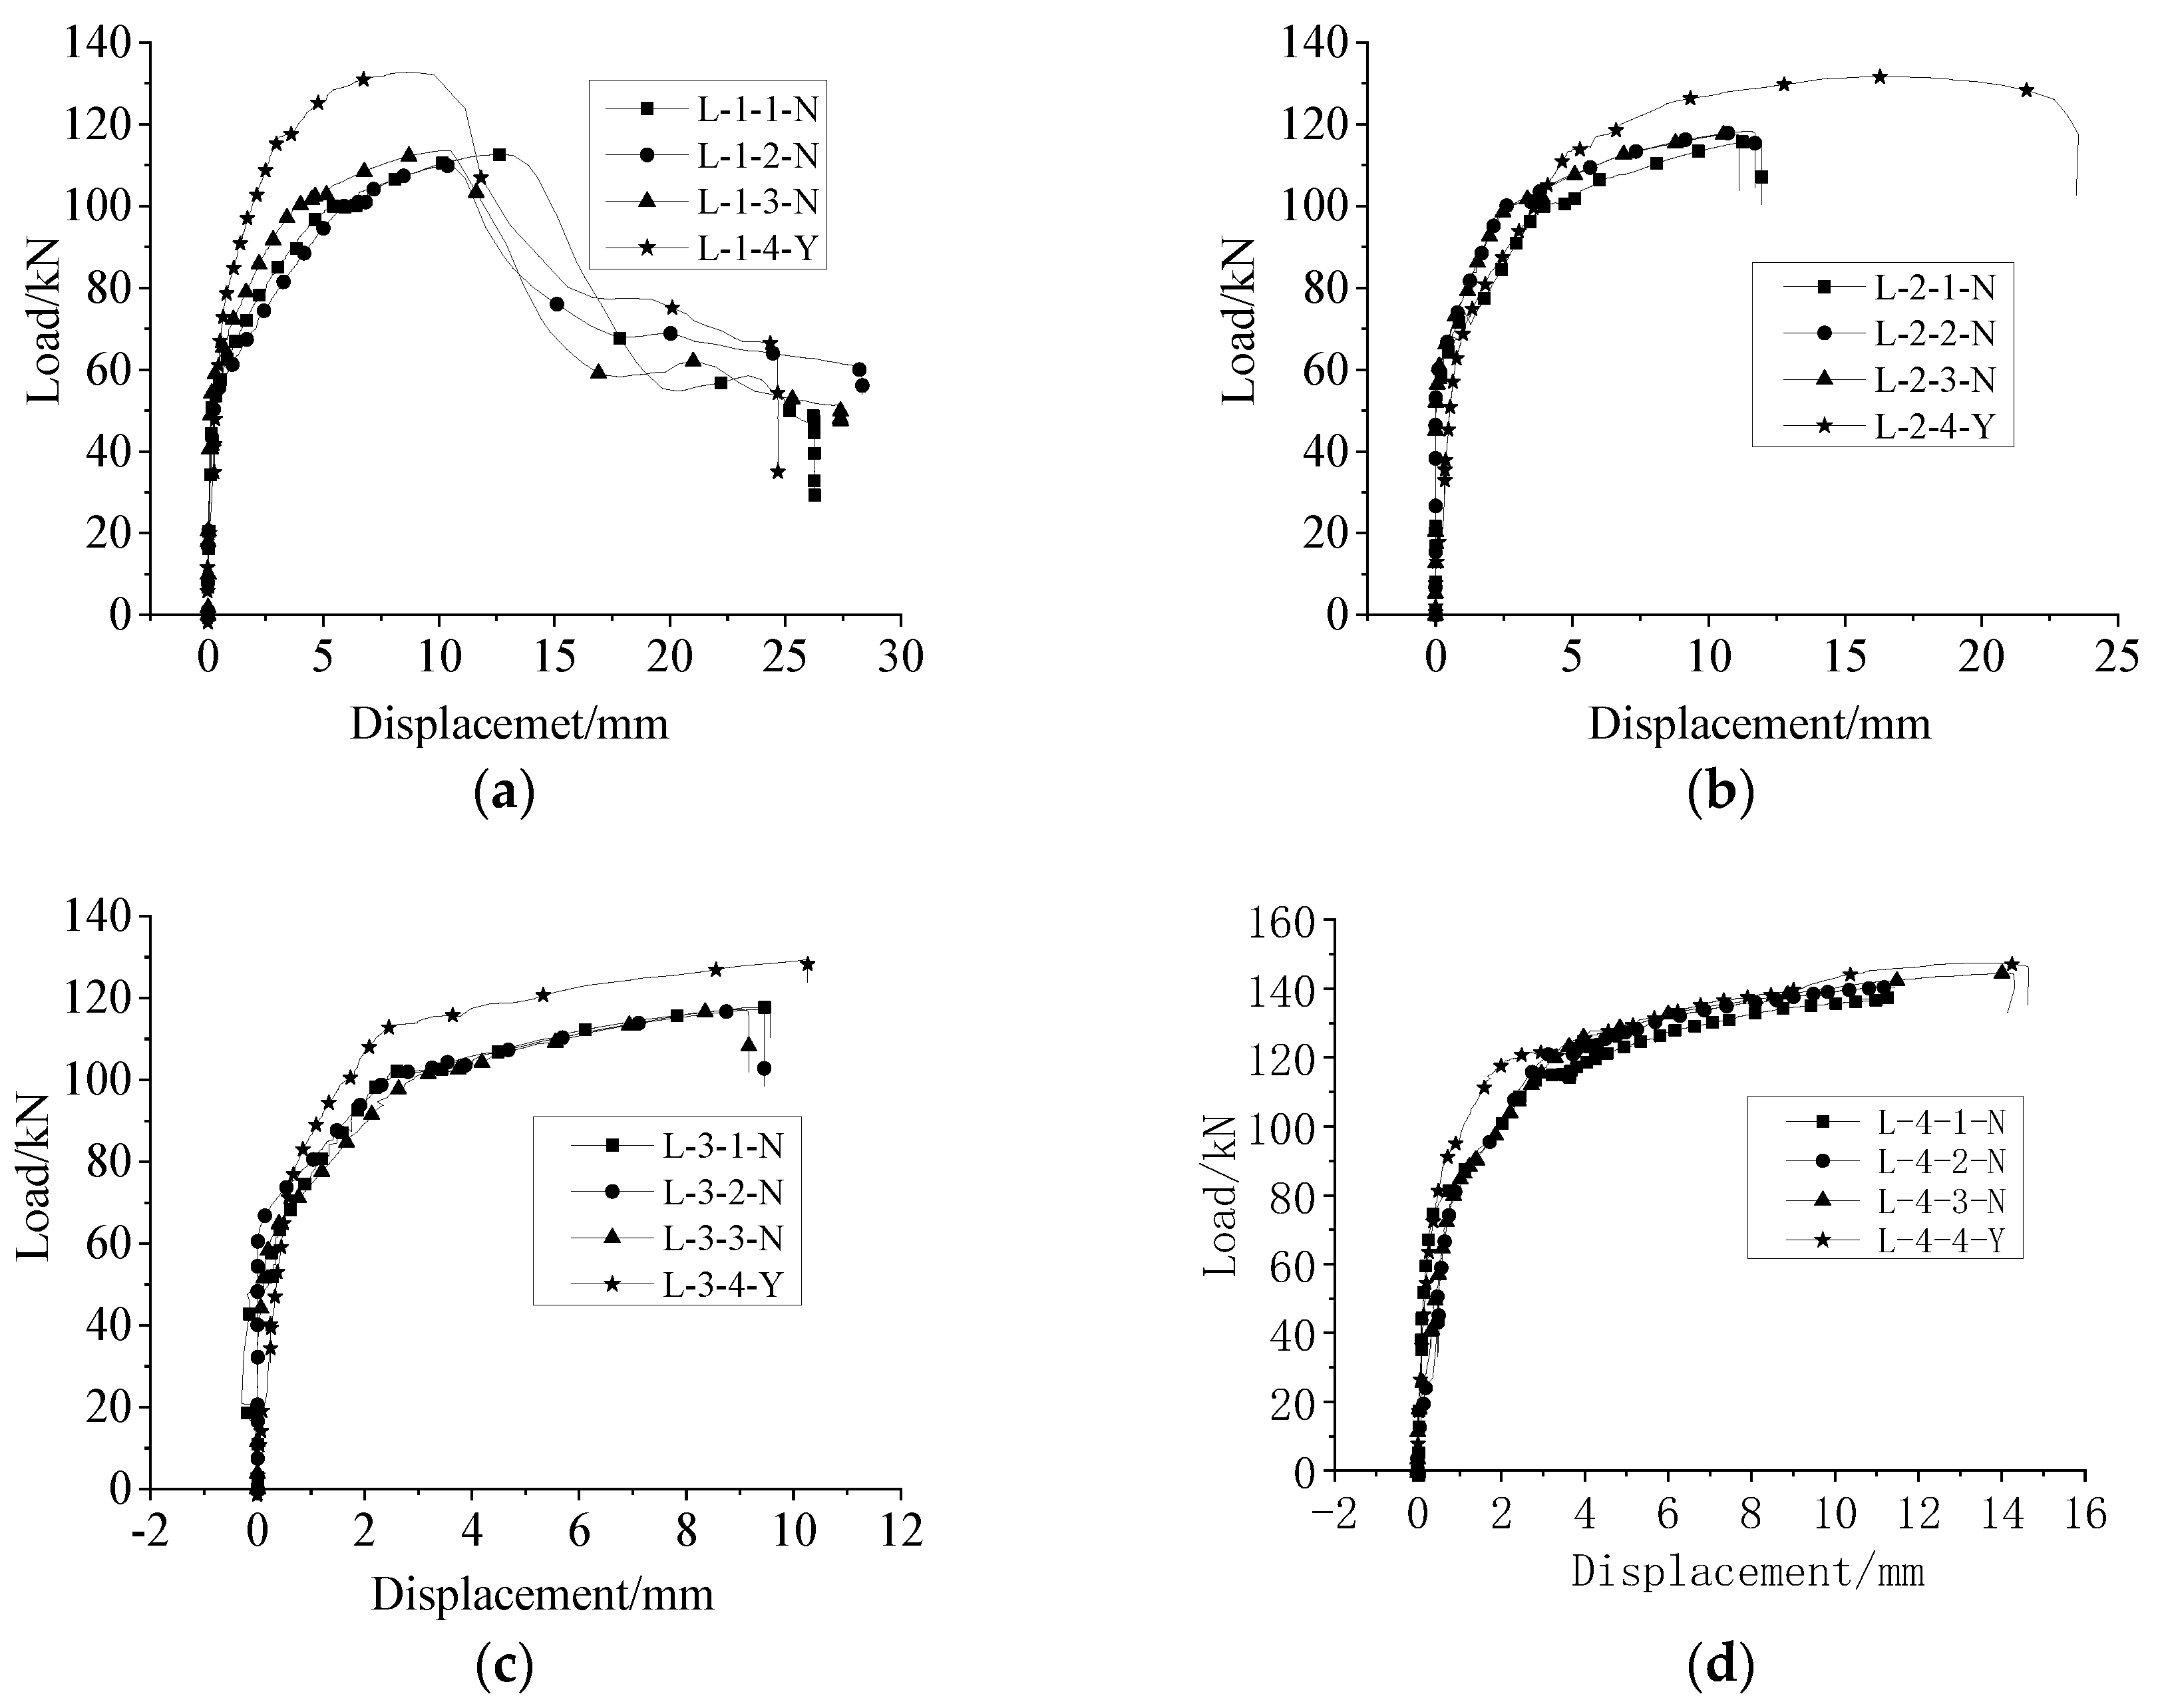
4.1. Load–Displacement Curves

4.1.1. Uniaxial Tension

Figure 14a–d shows the load–displacement curves of each specimen under uniaxial tension. All specimens in the L1 group with a lapping length of 6d were broken via steel bar pull out, and the failure load exceeded the load when the steel bar yielded. The load–displacement curve included a rising section, falling section, and residual section, which fully reflected the whole process of bonding and sliding. The specimens in groups L2–L4 with lapping lengths of 8d, 10d, and 12.5d were broken via steel bar tensile failure, and each load–displacement curve included a rising section and a falling section (no residual section). Compared with the specimens of group L1, the falling section of the curve was shorter, because the steel bar was broken immediately after the contraction of steel. The bearing capacities of the specimens without anti-deflection measures were lower than those of the specimens with anti-deflection measures. This was because, without anti-deflection measures, the strength was not maximized, and the force distribution of the sleeve was more complex.

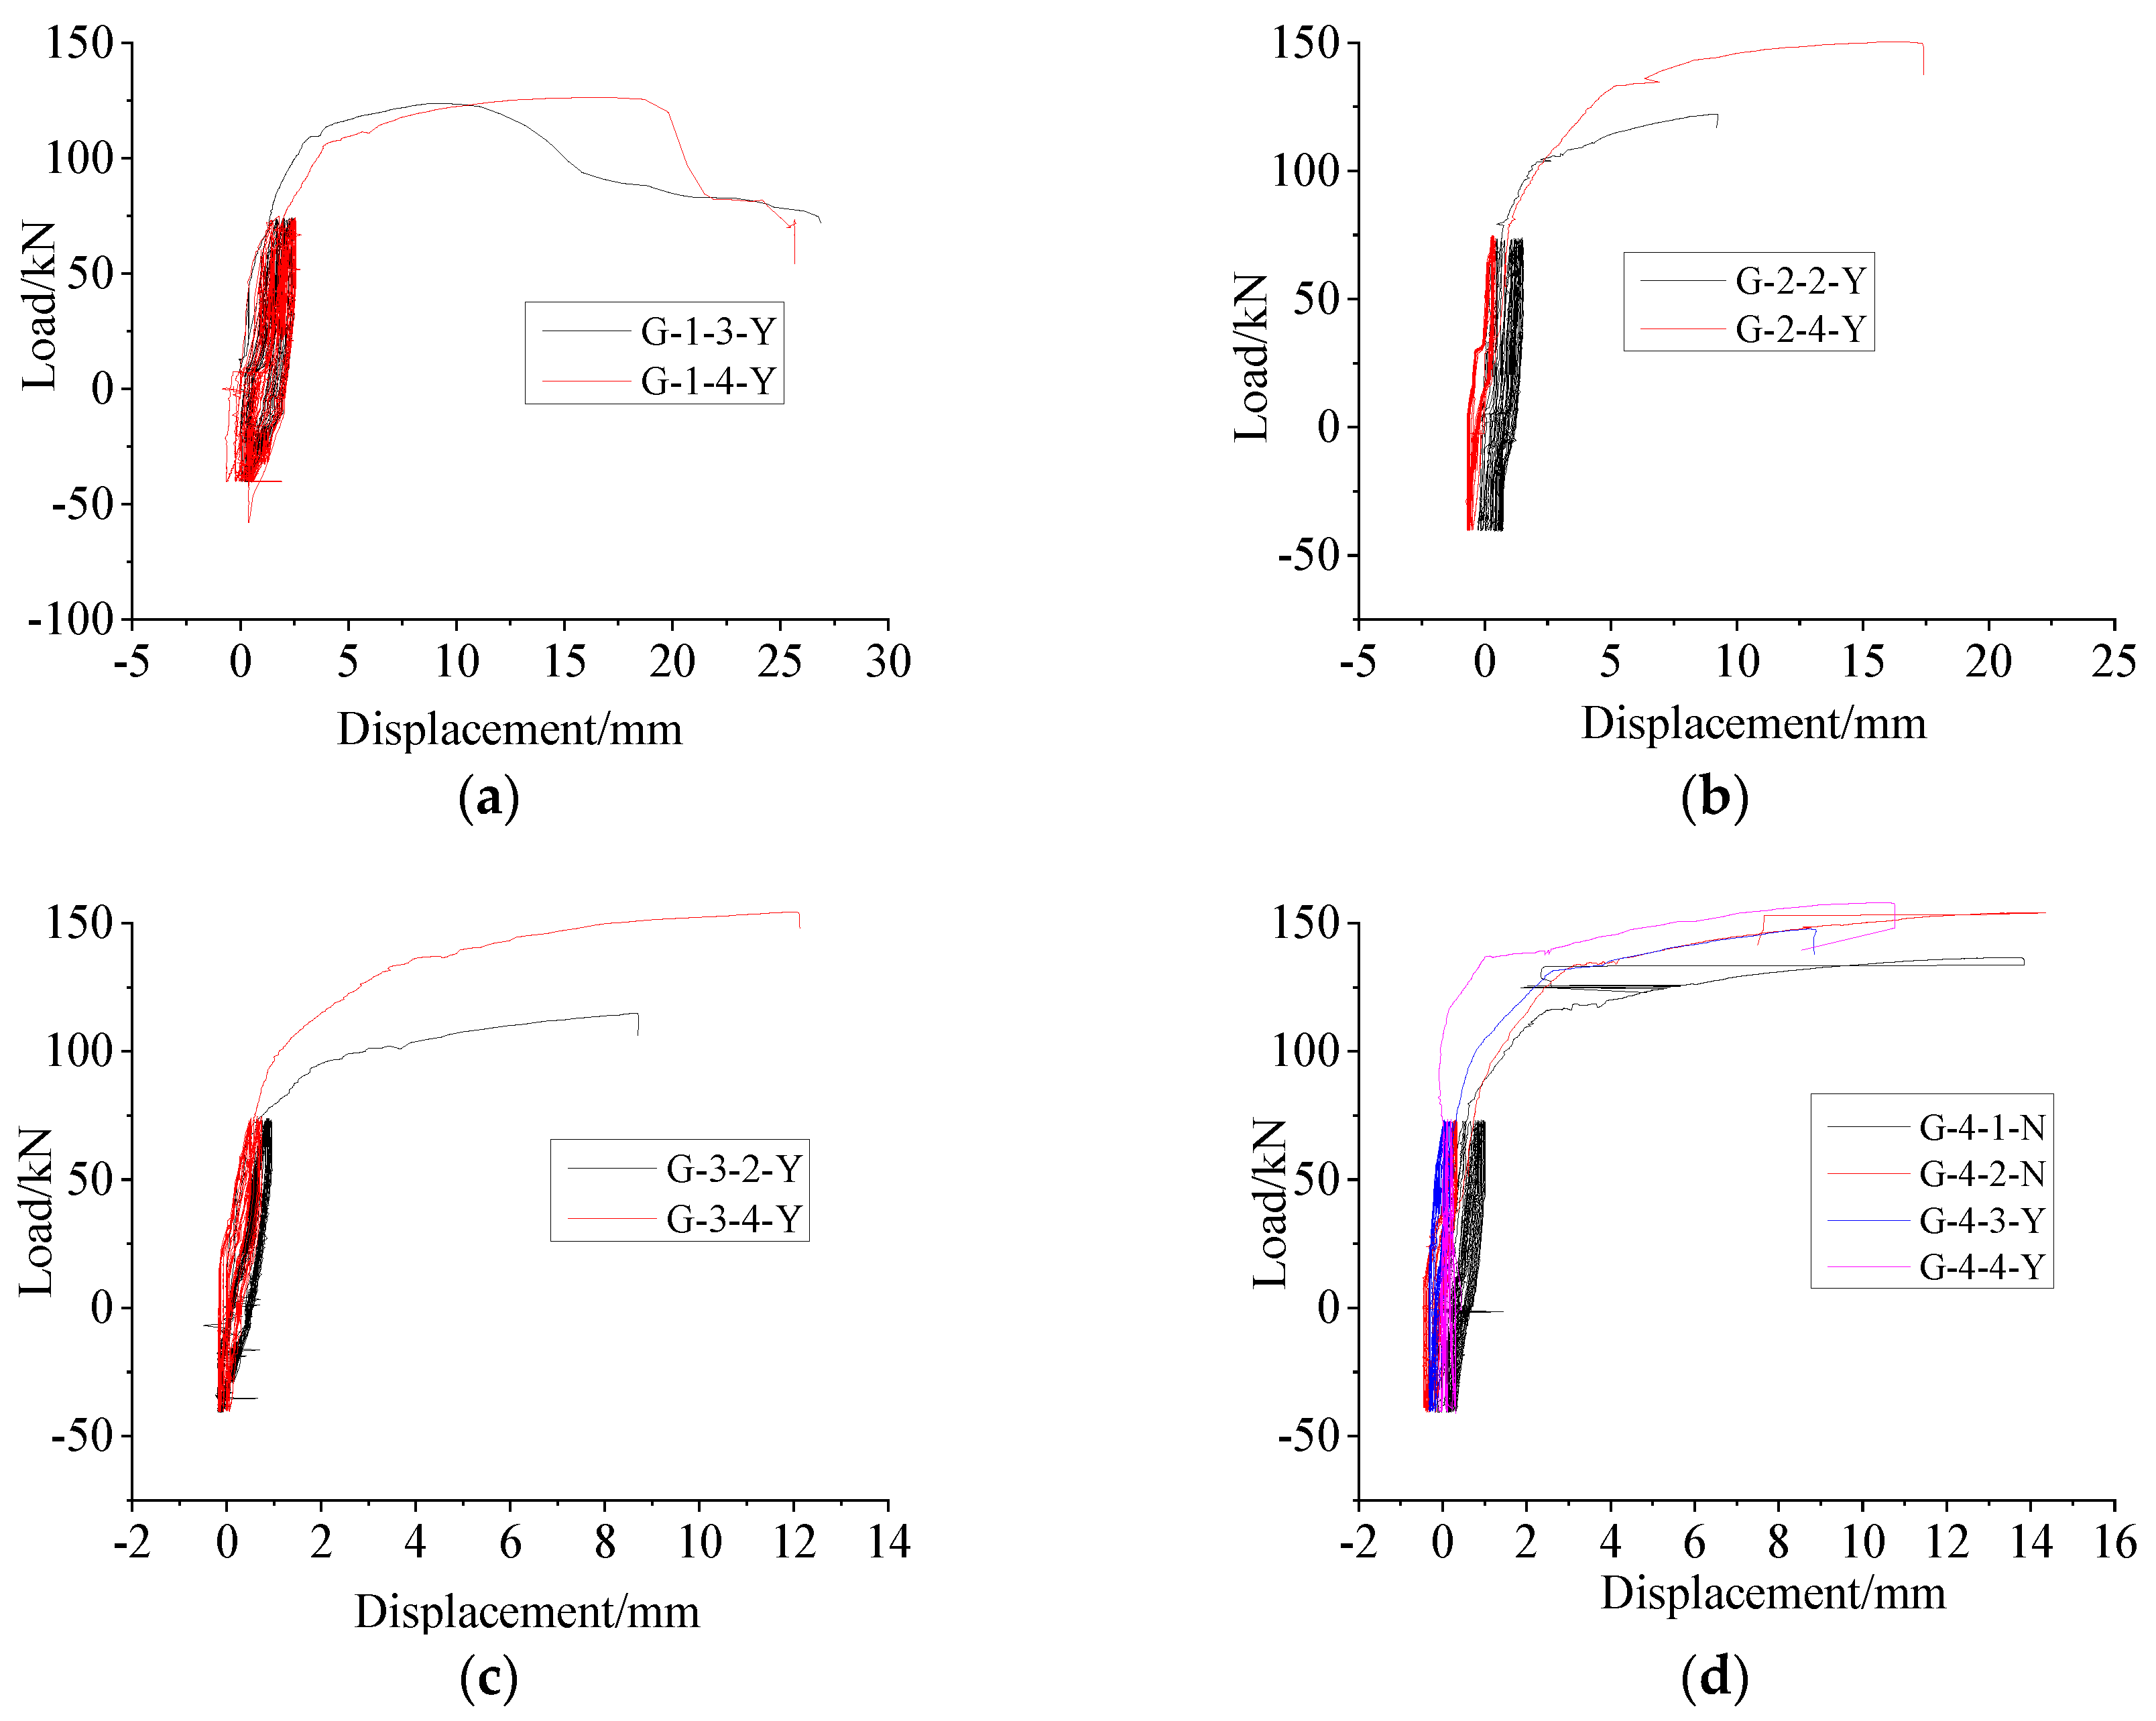
4.1.2. High-Stress Repeated Tension and Compression

Figure 15a–d shows the load–displacement curves of each specimen within the gauge distance (L + 4d) under high-stress repeated tension and compression loading. The repeated tension and compression loading of the specimens was less than the load when the steel bar yielded. The load–displacement curve was a line before the yield of the steel, and the yield platform was not evident after the yield of the steel, because the part within distance of the displacement measurement scale was mostly the sleeve. The steel bar section was short, with a lapping length of only 4d, so the deformation of the sleeve was very small after the yield of the steel bar. The load–displacement curve of the connection with anti-deflection measures was slightly less than that of the connection without anti-deflection measures. This indicated that the deformation of the connection with anti-deflection measures was smaller in the loading process because the deflection of the connection and the separation of the steel bars were restrained by the anti-deflection measures.

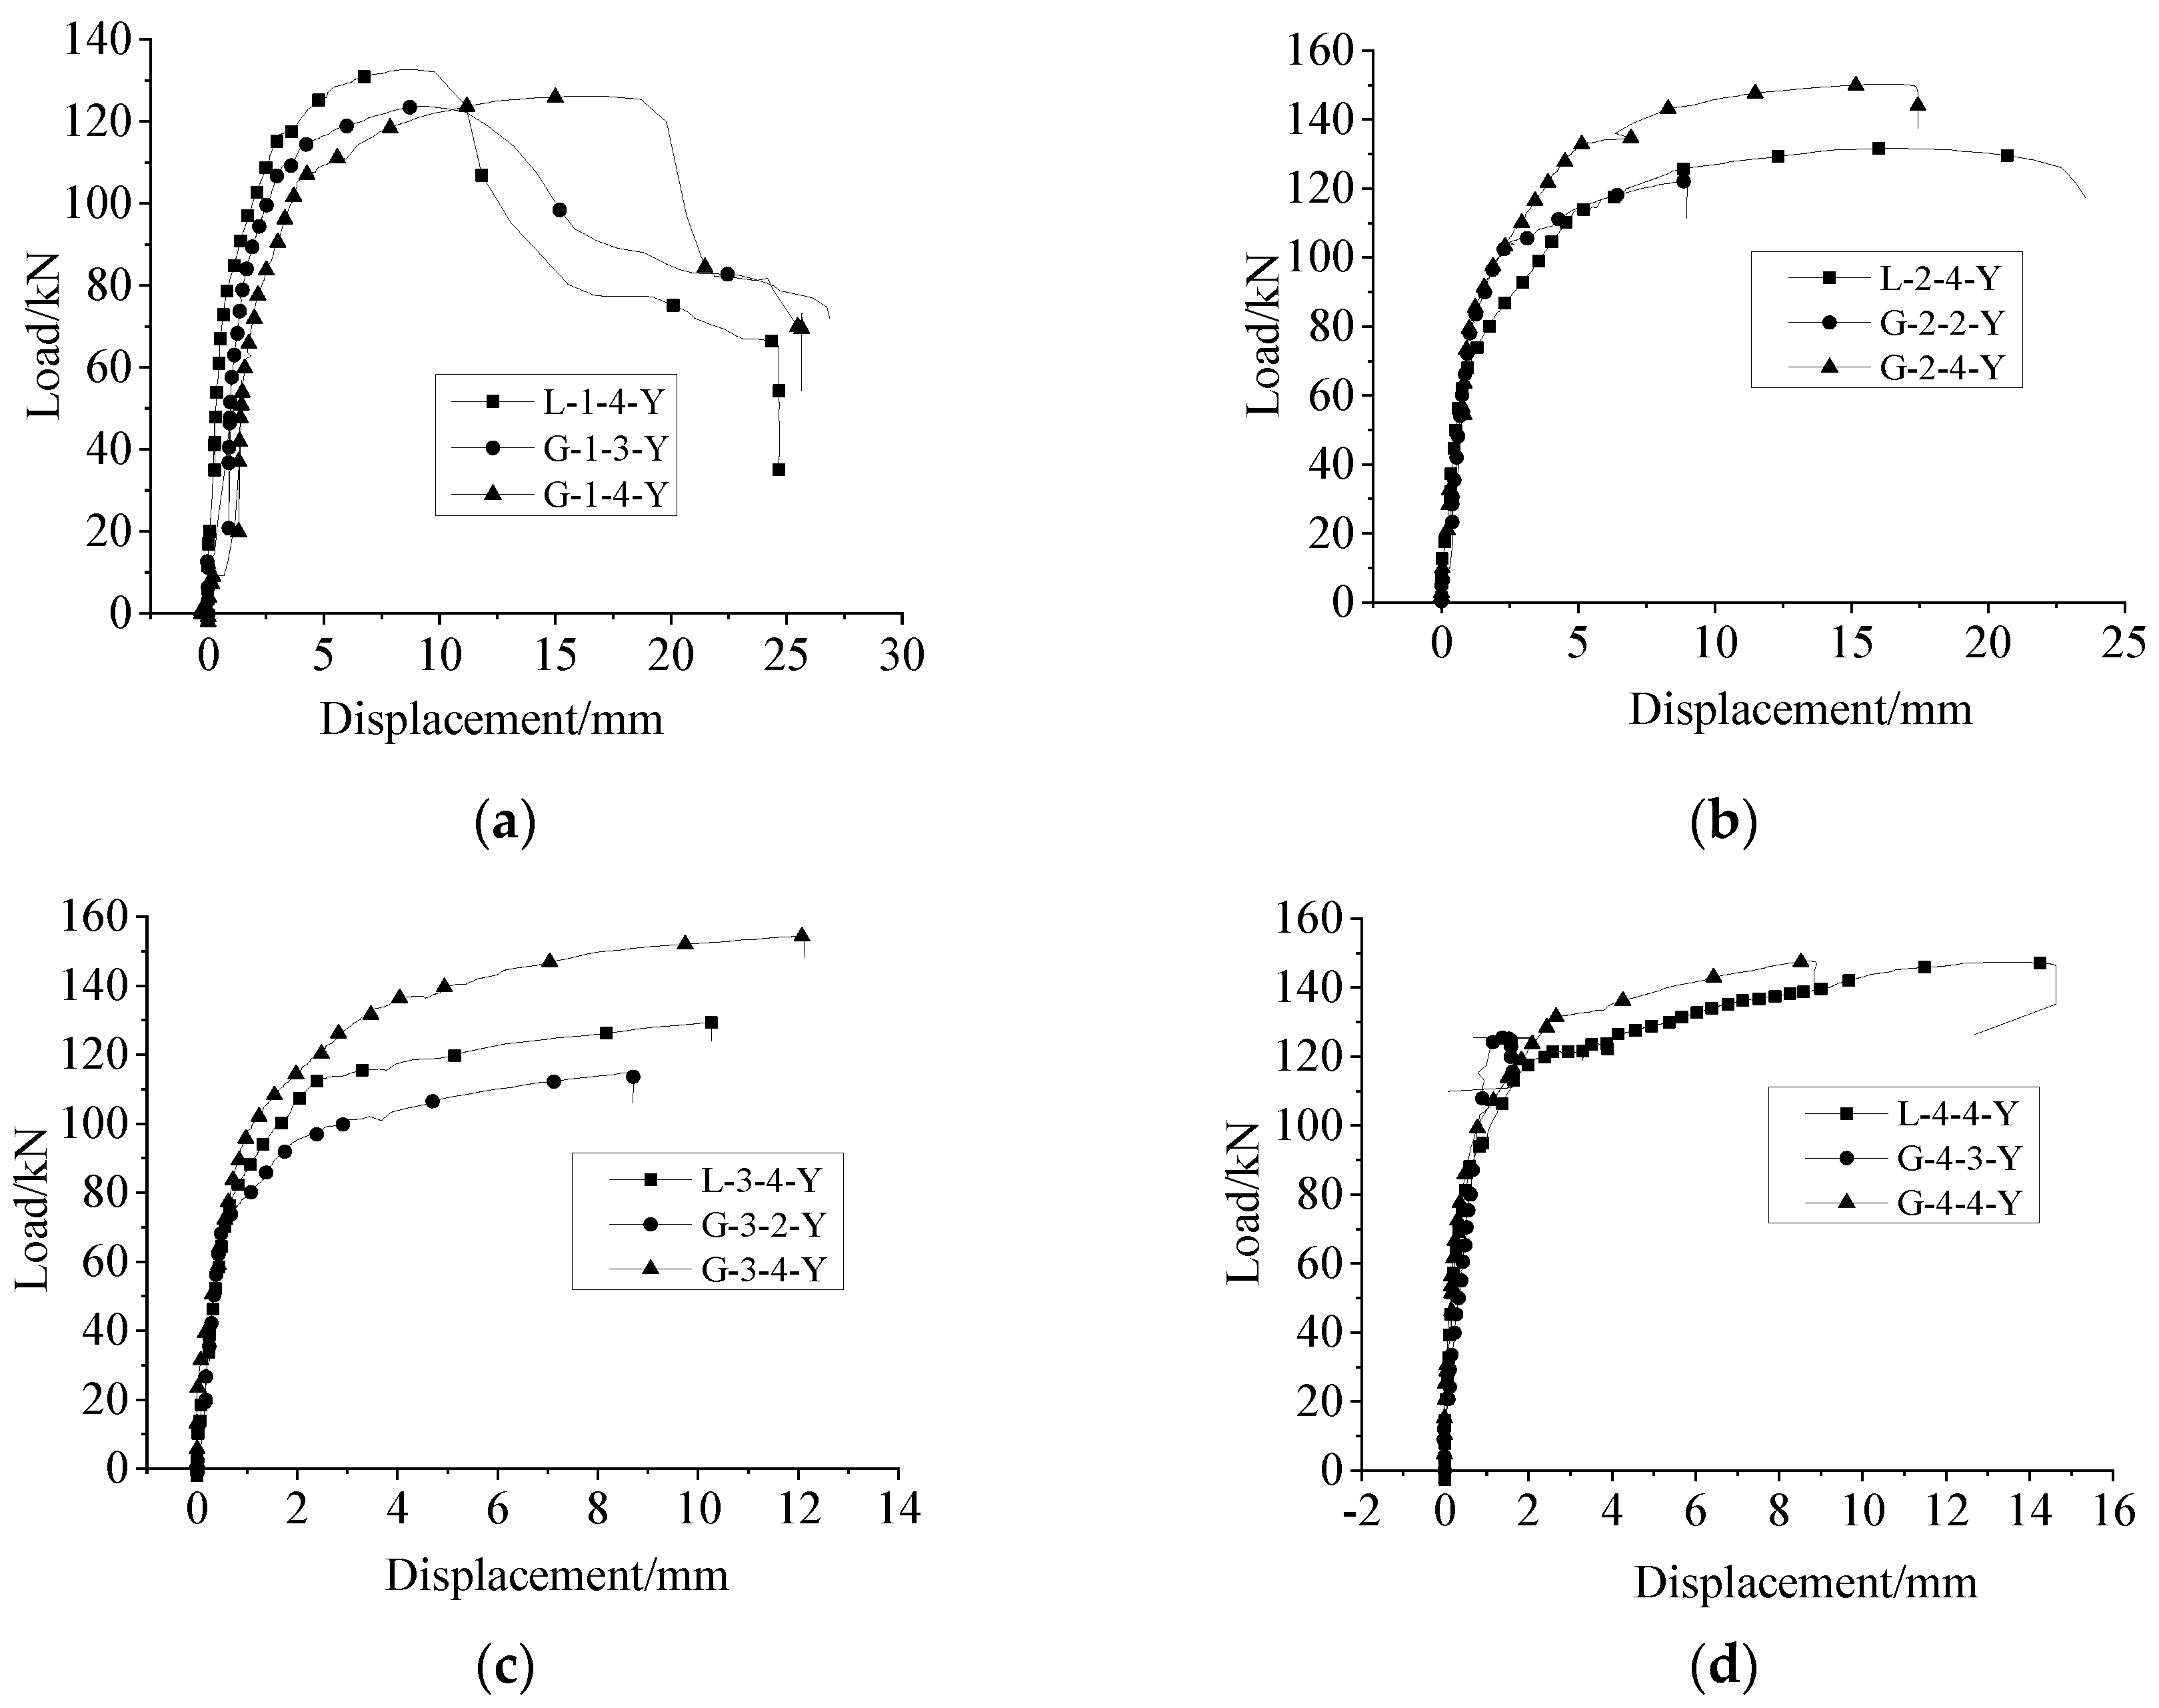
4.1.3. Comparison between Uniaxial Tension and Repeated Tension and Compression Loading

The load–displacement curves within the standard distance (L + 4d) under uniaxial tension and repeated tension and compression (only the last tensile part) loading of the specimens with anti-deflection measures were compared (as shown in Figure 16). The average ultimate strength of the specimens under repeated tension and compression loading was 772.31 MPa, which was 20% higher than that of specimens under uniaxial tensile strength (643.78 MPa), indicating that the bearing capacity of the connector had been strengthened after repeated high-stress tension and compression loading. The specimens were all broken via steel bar pull out with the lapping length of 6d, and the initial stiffness of the specimen under uniaxial tension was greater than that under repeated tension and compression loading. This was because the cracks between the steel bar and grouting material were further developed after repeated tension and compression loading. All the specimens were broken via steel bar tensile failure, as shown in Figure 16b–d, and the initial stiffness values of the specimens were similar to those of the grouting material in the sleeve with slight damage.

4.2. Bearing Capacity

The strength performance evaluation results of the specimens according to the technical specification for the mechanical connection of steel bars [30] and the American specification ACI-318 [31] are shown in Table 3. The regulations of the American specification ACI-318 are less restrictive than those of the Technical Specification for Mechanical Connection of Steel Bars. The factors influencing the bearing capacity are discussed in Section 3.

4.3. Ductility and Residual Deformation

4.3.1. Ductility

The calculation method for ductility is shown in [30], where δ y is the yield displacement of the specimen, δ u is the displacement of the ultimate bearing capacity, R d = δ u / δ y is the displacement ductility coefficient, and Asgt is the total elongation under the maximum force. The test results are shown in Table 4. The mechanical parameters of the specimens under repeated tension and compression loading were determined based on the data from the last tension process of the cyclical loading. Specimens L2, L3, and L4 were all broken via steel bar tensile failure, with average ductility coefficients of 4.01, 4.01, and 4.31, respectively. Specimens G2, G3, and G4 were broken via steel bar tensile failure, with average ductility coefficients of 3.28, 3.68, and 3.47, respectively. The lapping length had little effect on the ductility of the steel bar during steel bar tensile failure. The ductility values of the specimens under repeated tension and compression loading were lower than those of the specimens under uniaxial tension. This was because the hardening of the steel bar occurred during the loading process and the cracks between the steel bar and grouting material further developed, resulting in an increase in the yield displacement and a decrease in the ductility. The results in Table 4 show that anti-deflection measures had little influence on the ductility values of the specimens. The Asgt values of all the specimens that underwent steel bar tensile failure met the requirements of [30].

4.3.2. Residual Deformation

The residual deformation of a specimen refers to the unrecoverable deformation of the specimen after the tension, that is, the deformation could not return to the initial state after unloading to zero in the plastic stage. In the test, the values of the residual deformation u0 after uniaxial tension and those of the residual deformation u20 after repeated tension and compression loading of each specimen are shown in Table 4. According to the specifications of grade-I connections, u0 should be no more than 0.1 mm and u20 should be no more than 0.3 mm. The relationship between the average residual deformation of the specimen and the lapping length is shown in Figure 17.
Under the anti-deflection measures, the residual deformation values u0 and u20 of the specimens decreased with the increase in the lapping length. In the case of uniaxial tension, u0 did not meet the requirements of the specification when the lapping length was 6d [30], whereas u0 met the requirements of the specification when the lapping length was no less than 8d [30]. In the case of repeated tension and compression, u20 was much larger than the requirement of the specification when the lapping length was 6d–8d [30], whereas it was very close to the requirement of the specification when the lapping length was no less than 10d [30].
For specimens with anti-deflection measures, u0 consisted of the residual deformation of the steel bar with the lapping length of 4d and the micro-slip between the steel bar and the grouting material. The residual deformation of the steel bar is the unrecoverable deformation of the steel bar after tension. Micro-slip between the steel bar and the grouting material refers to chemical cementation strength losses and the friction and mechanical bite force between the steel bar and grouting materials. It increased gradually for the specimens after tensile loading, so a relatively small slip between the steel bar and grouting material was produced. Micro-slip occurred at the loading end in the initial stage of loading, and it also occurred at the free end of the steel bar with the increase in the load [32]. However, when the lapping length was long, there was no micro-slip at the free end, so the residual deformation decreased with the increase in the lapping length. The u0 value of the specimen without anti-deflection measures consisted of residual deformation of the steel bar, micro-slip between the steel bar and grouting material [32] and bending deformation of the steel bar.
As shown in Figure 17, for specimens with anti-deflection measures and the same lapping length, the residual deformation of the specimen under a high-stress repeated load was larger than that under uniaxial tension, which was caused by the further development of the cracks and an increase in the micro-slip between the steel bar and grouting material during repeated tension and compression loading.
The residual deformation of the specimens without anti-deflection measures was larger than that of the specimens with anti-deflection measures in the case of uniaxial tension. In the case of repeated loading (the residual deformation values of most of the specimens without anti-deflection measures could not be measured) and a lapping length of 12.5d, the u20 values of the specimens without anti-deflection measures were larger than those of the specimens with anti-deflection measures. These were caused by bending deformation of the steel bars.

4.4. Longitudinal and Hoop Stress Distributions of Sleeve

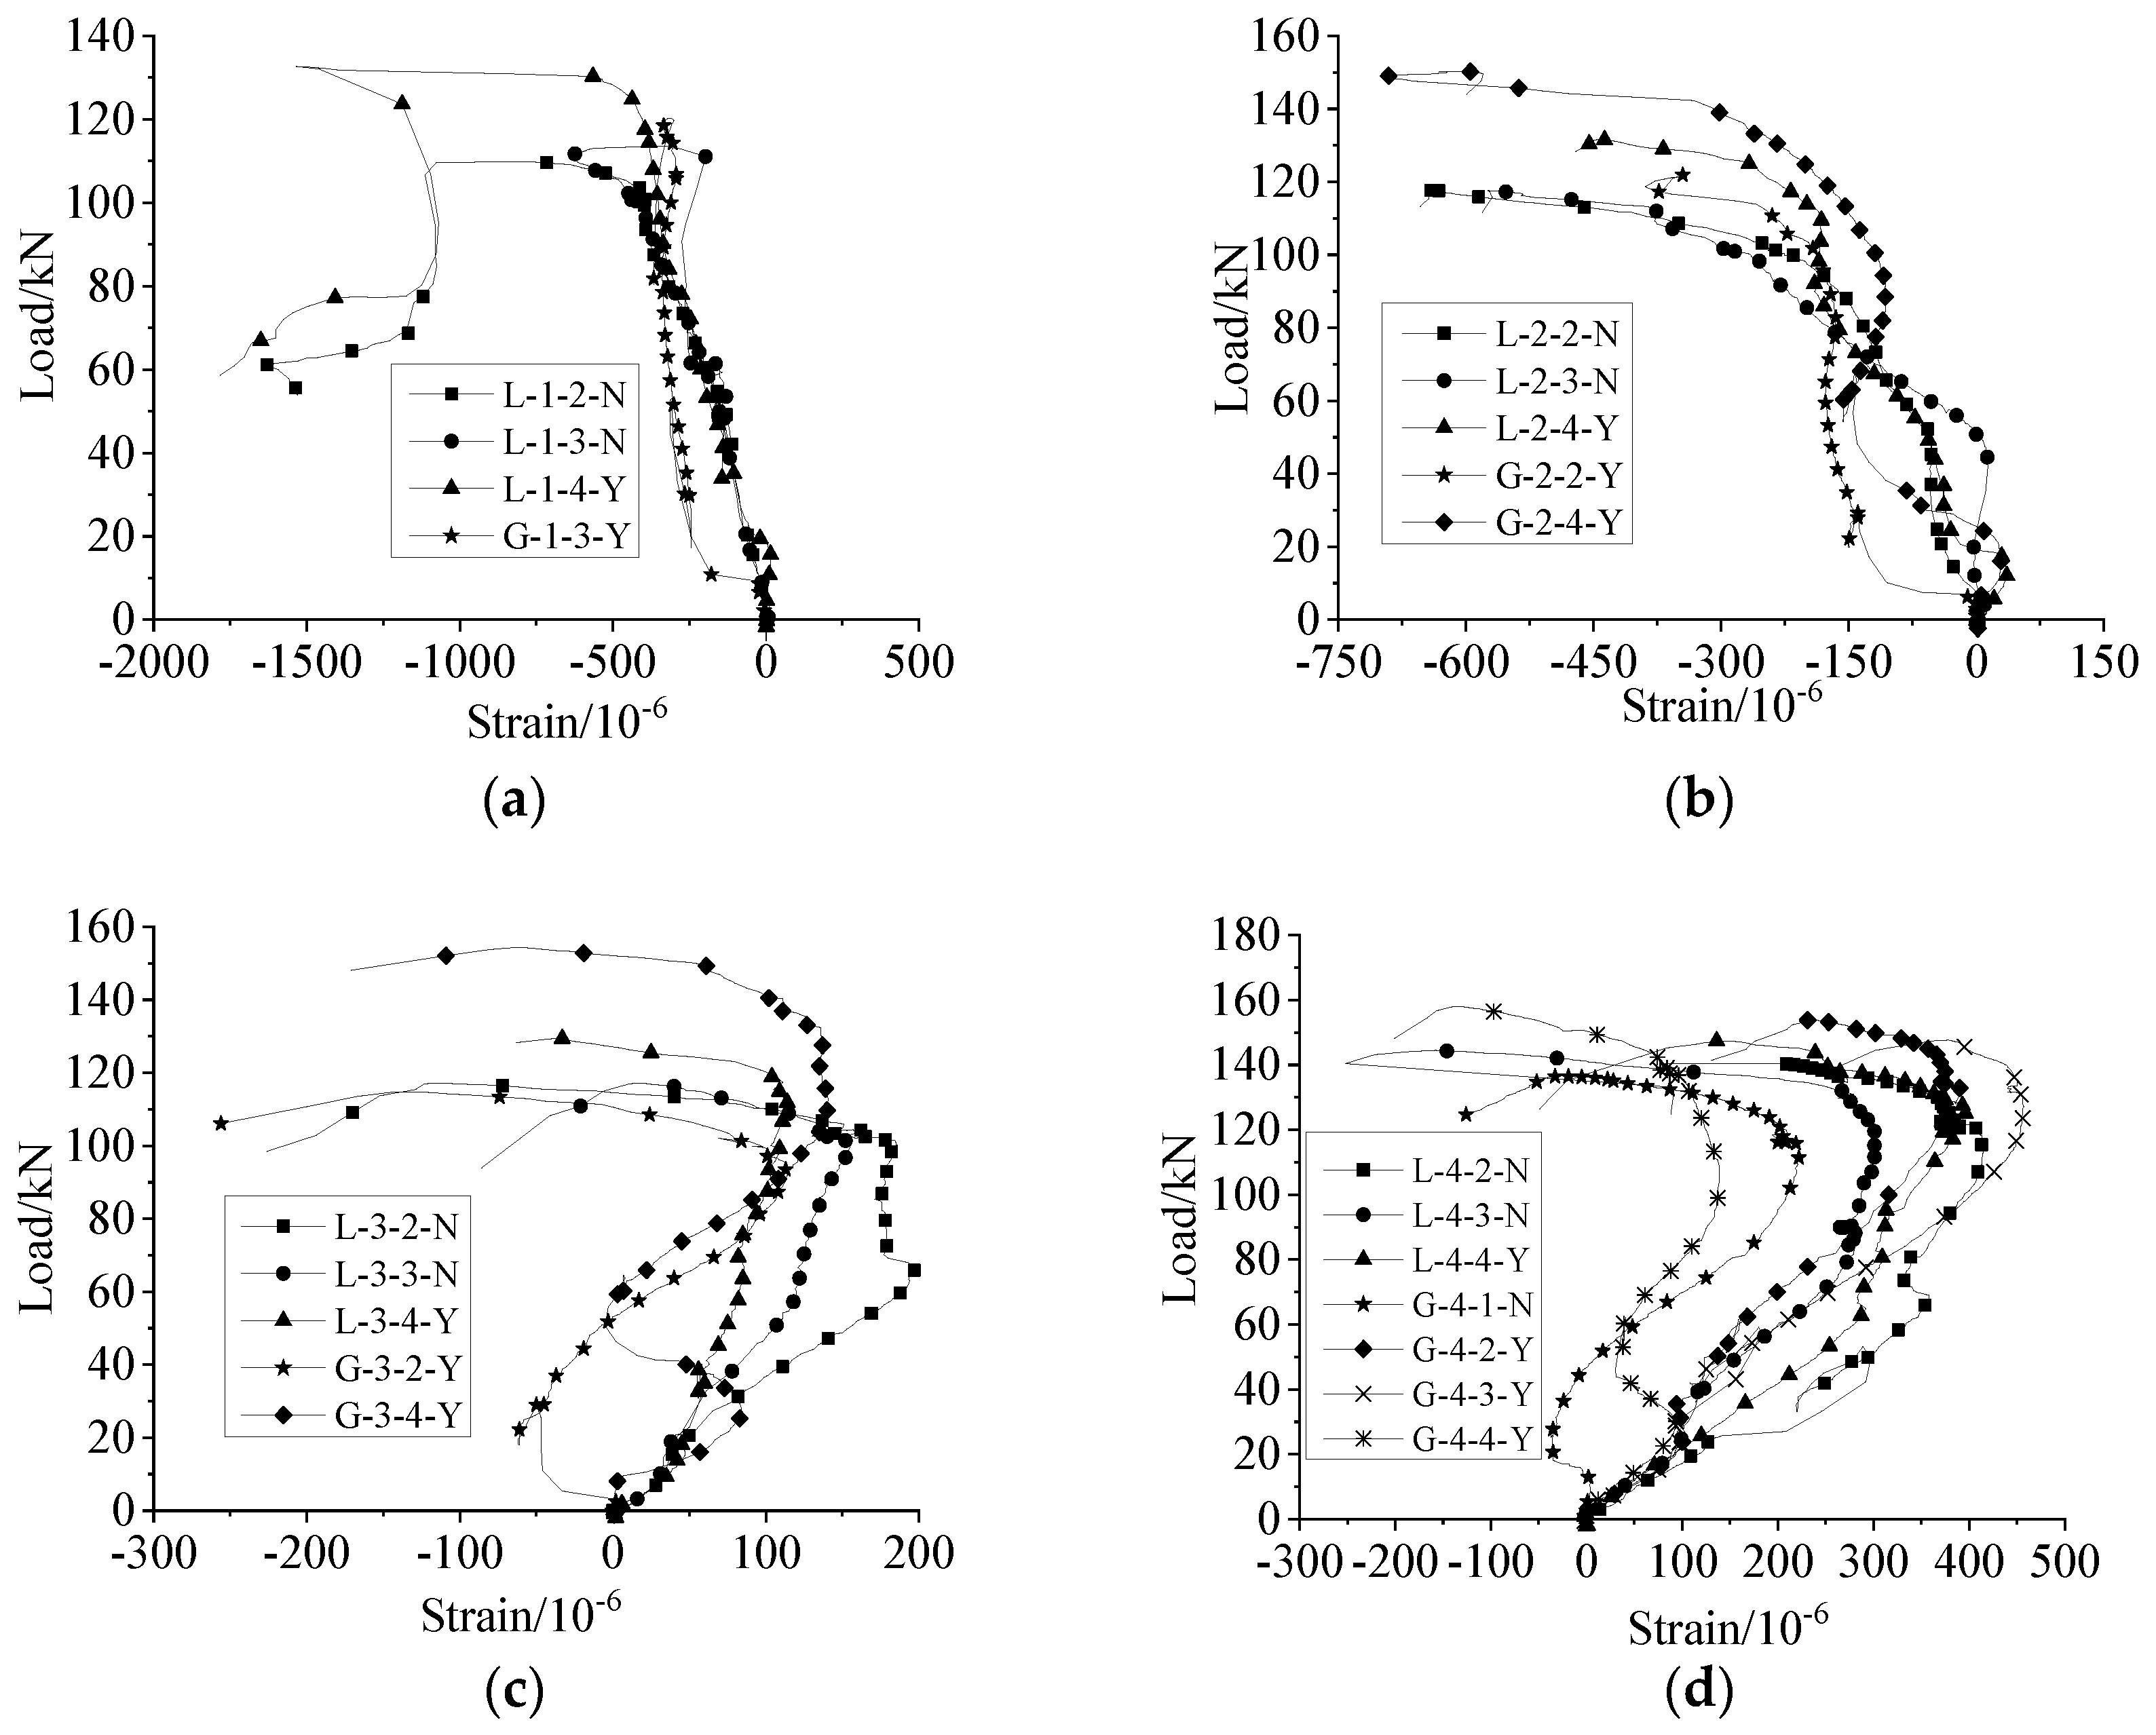
4.4.1. Longitudinal and Hoop Strain Curves for the Middle Section of the Sleeve near Steel Bar under Uniaxial Tension and Repeated Tension and Compression (Only Final Tension Process) Loading

Figure 18 shows the comparison of the longitudinal strain curves near the steel bar side of the sleeve, and Figure 19 shows the comparison of the hoop strain curves of the sleeve under uniaxial tension and repeated tension and compression (only the last tension process) loading. The variation trends of the longitudinal and hoop strains of the sleeve were fairly consistent between the cases of uniaxial tension and repeated tension and compression (only the last tension process) loading. The longitudinal strain was mostly forced via compression and the hoop strain was mostly forced via tension near the steel bar side at the middle cross-section of the sleeve (the reasons are presented in Section 6). The difference was that the load was constant but the longitudinal and hoop strains of the sleeve had increased (the curve was in the horizontal section) at the beginning of the load of the last tensile part after the high-stress tension and compression. This was because all the measurement data were zeroed, and then the connection was changed to uniaxial tension after high-stress repeated tension and compression loading. After the zeroing process of the data acquisition instrument, the strain of each strain gauge was zero while the residual strain (from −111 to 161 µε) of the sleeve existed. The residual strain of the sleeve was eliminated with the increase in the uniaxial tension load, so a horizontal section of the curve existed.
The influence of the lapping length on the average longitudinal and hoop strains of the middle section of the sleeve is shown in Figure 20. The longitudinal compressive strain and the hoop tensile strain of the middle section of the sleeve were decreased under uniaxial tension and repeated tension and compression (only the final tension process) loading with the increase in the lapping length of steel bars.

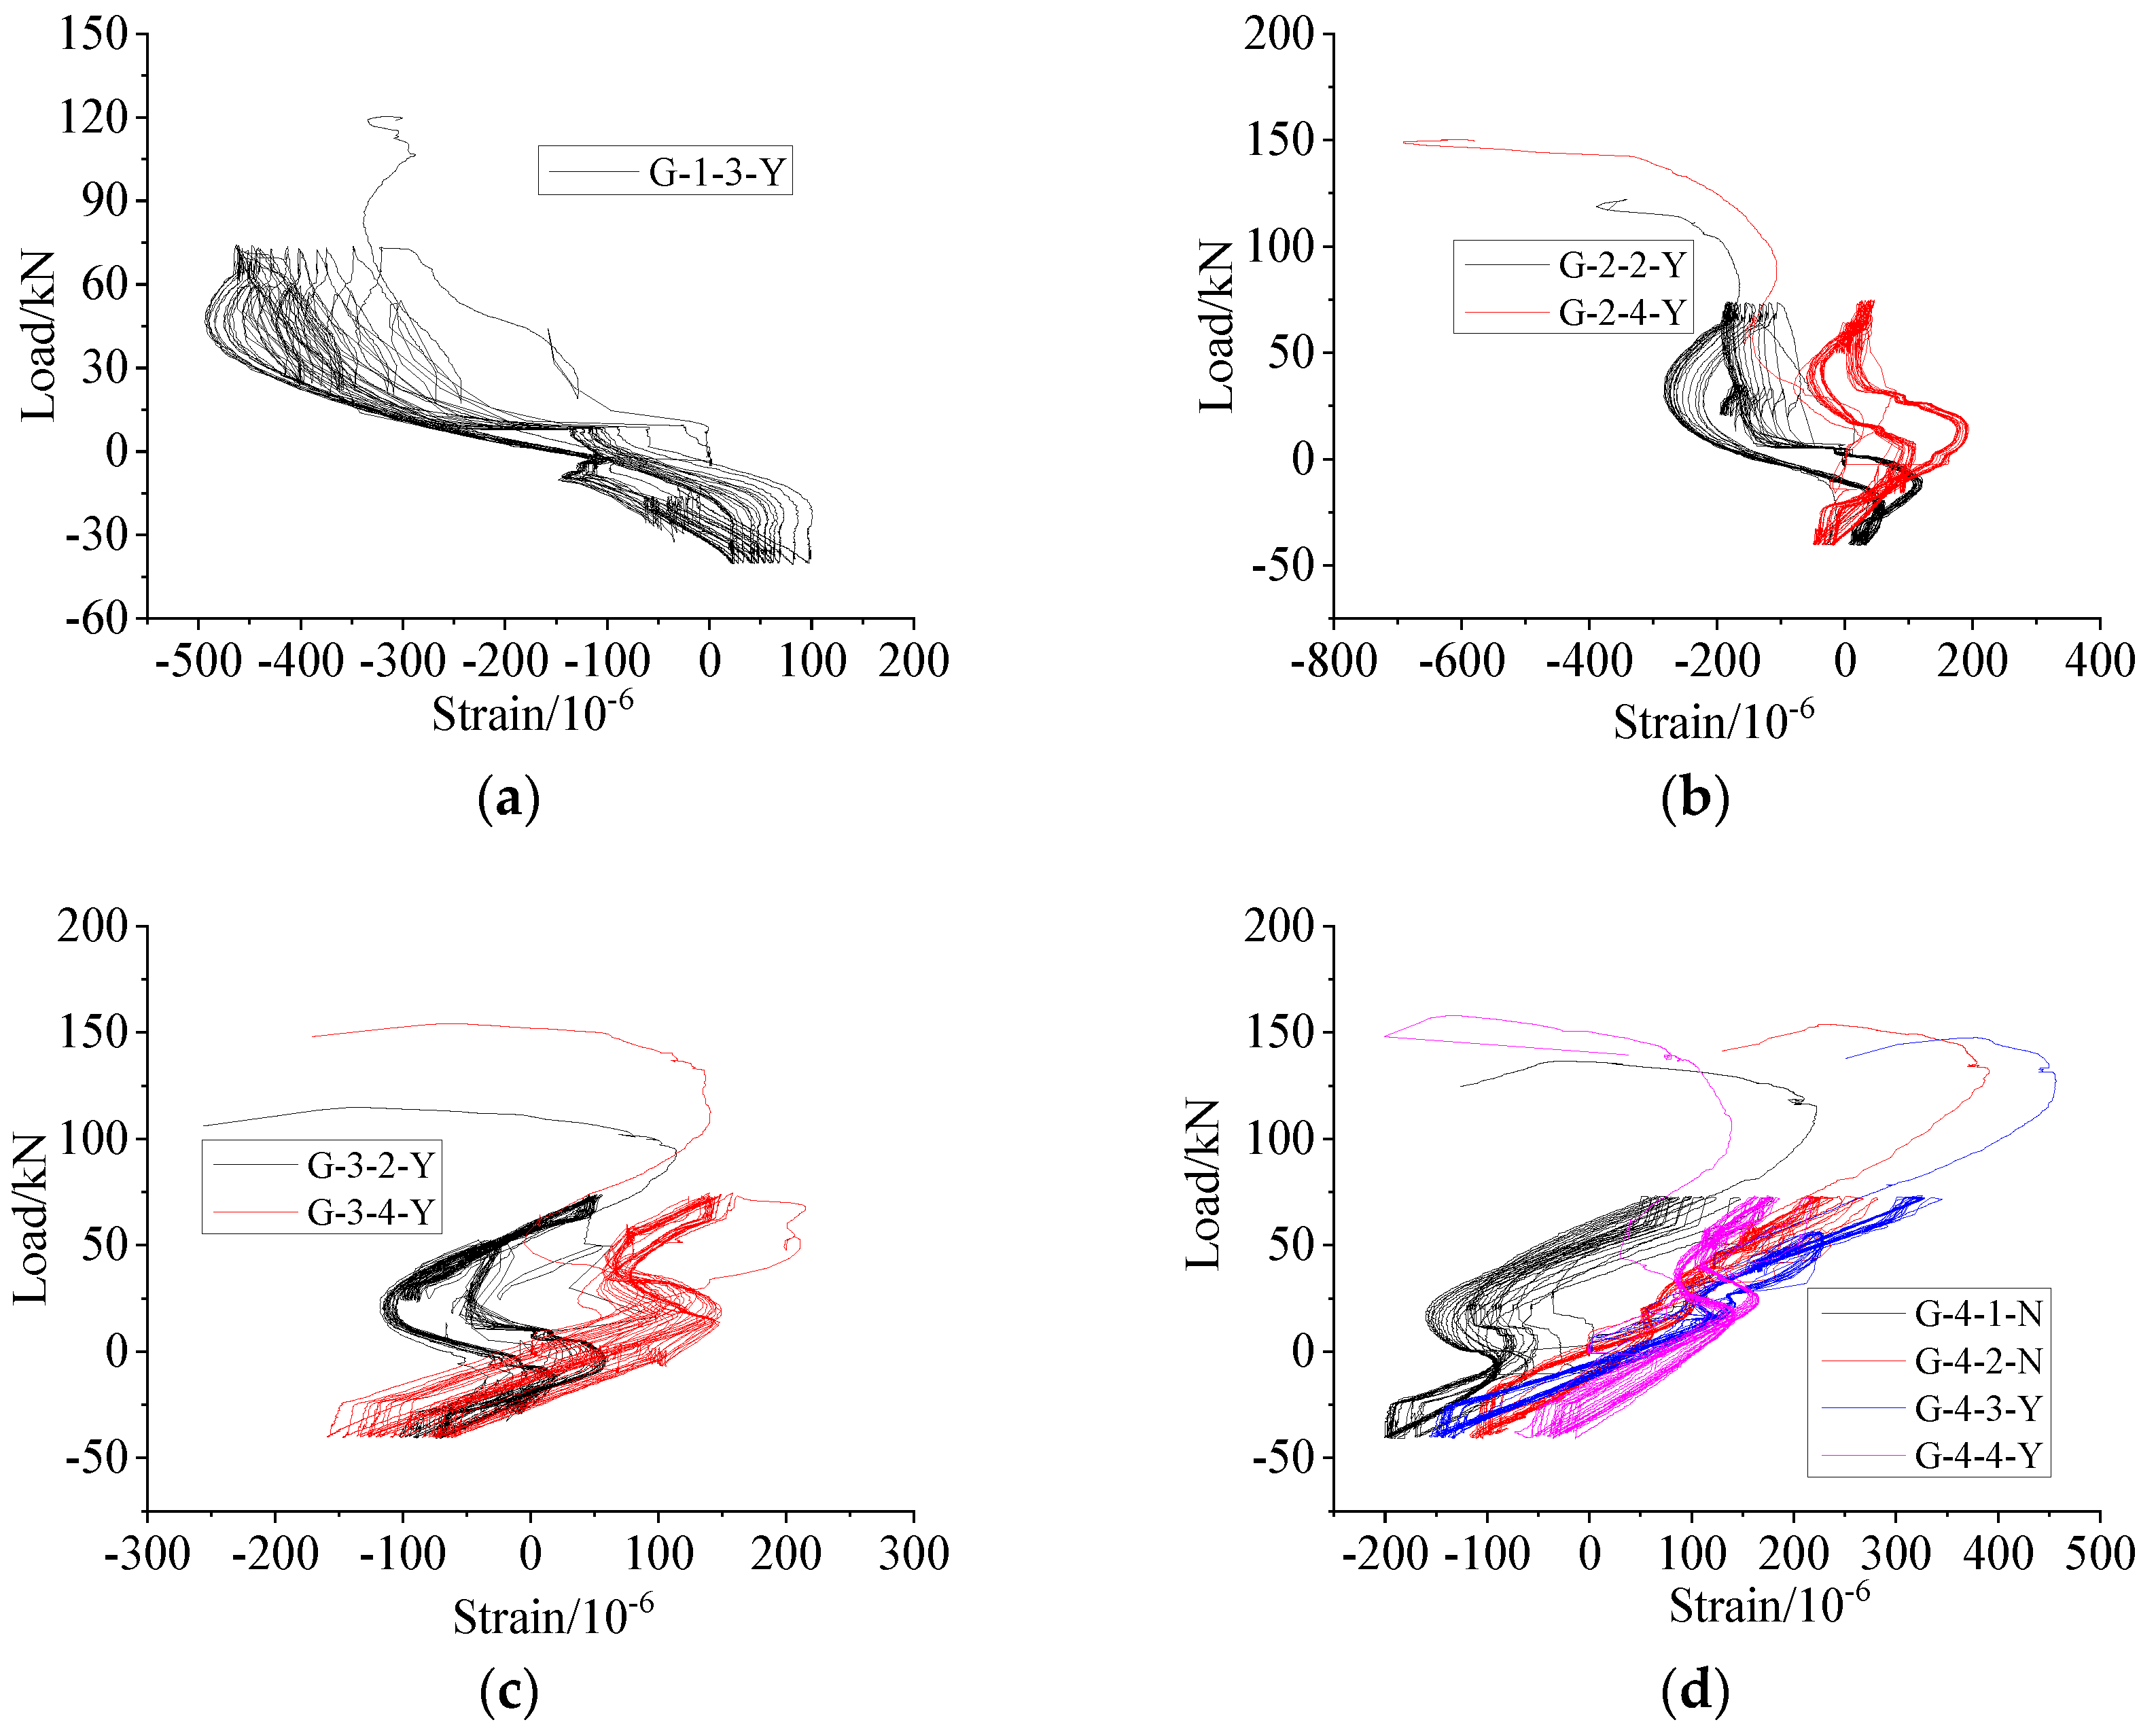
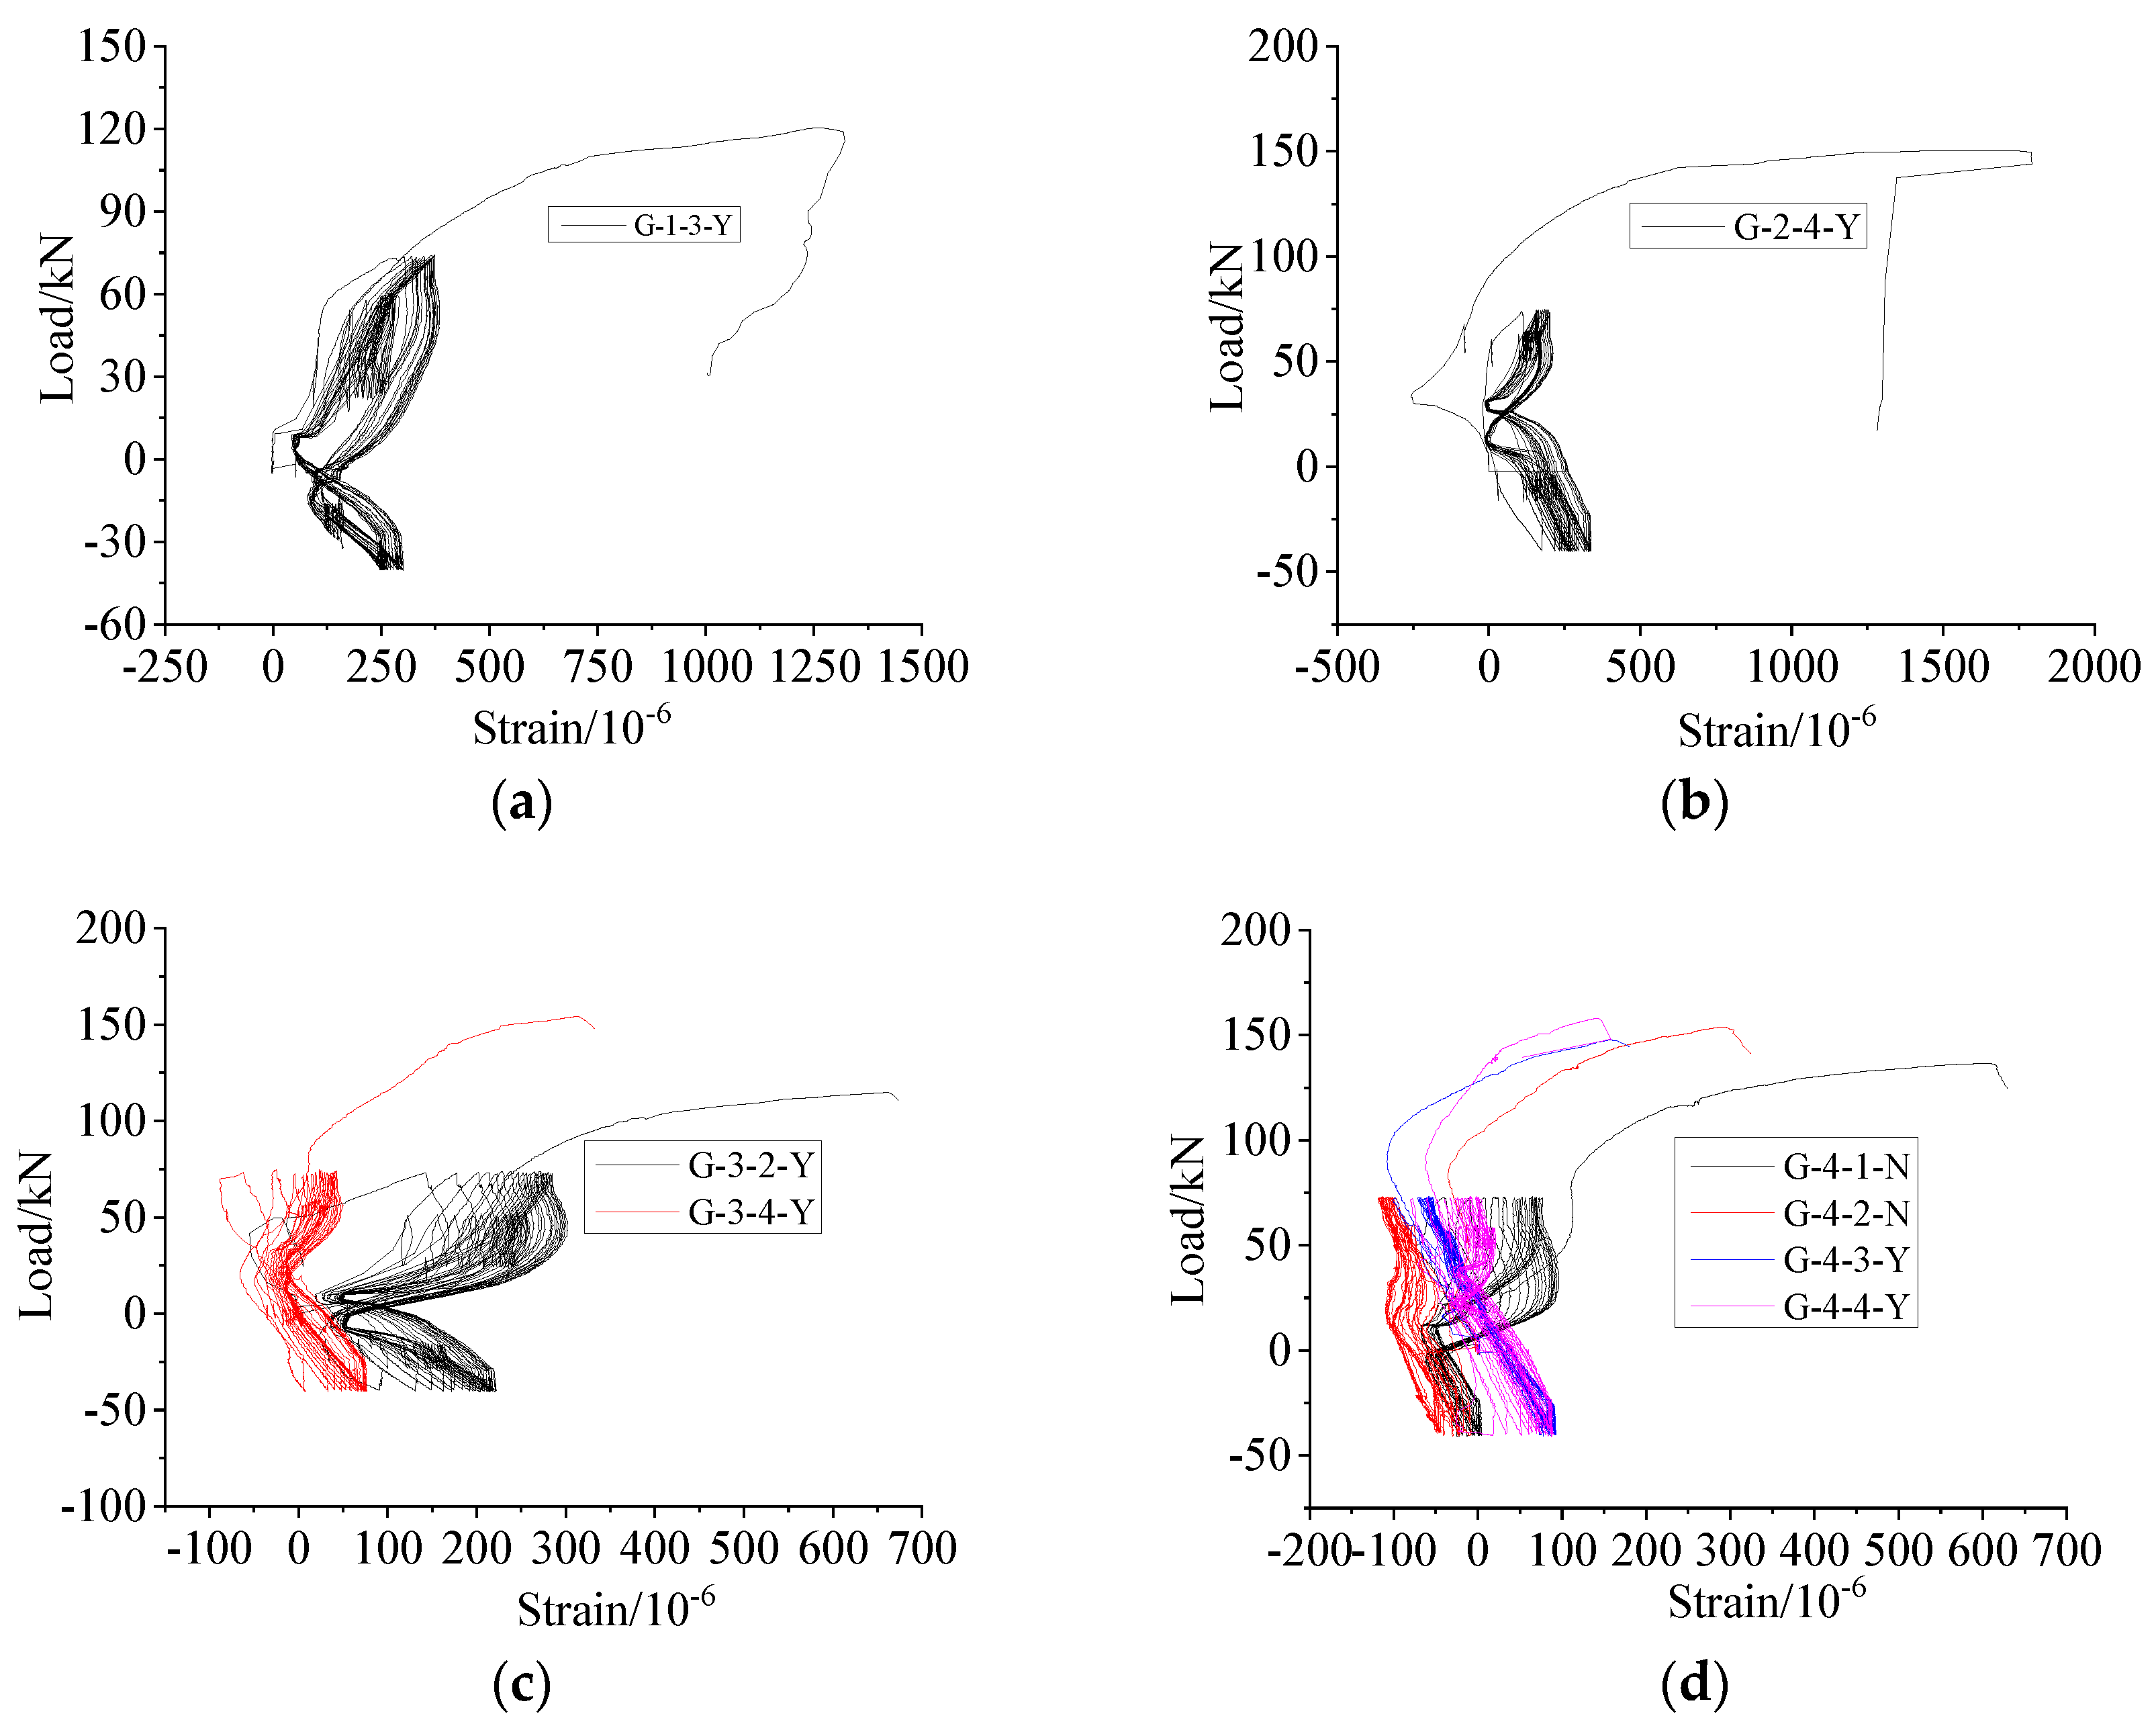
4.4.2. Longitudinal and Hoop Strain Curves of the Middle Section of the Sleeve near Steel Bar Side under High-Stress Repeated Tension and Compression Loading

Figure 21 shows the longitudinal strain curves of the middle section of the sleeve near the steel bar side under high-stress repeated tension and compression loading. When the lapping length was short, the curve was inclined toward the upper left and lower right sides. With the increase in the lapping length, the curve was inclined toward the lower left and upper right sides, indicating that the sleeve strain behaviour changed with the change of the lapping length.
For the specimen with a lapping length of 6d (Figure 21a), when it was under tension, the sleeve was mostly compressed longitudinally (the ordinate in Figure 21 was greater than 0). Under compression (ordinate in Figure 21 was less than 0), the sleeve was compressed when the load was small and stretched as the load increased. The reasons for these observations are discussed in Section 6. For the specimen with a lapping length of 8d, when it was under tension, the sleeve was mainly compressed longitudinally (Figure 21b). Under compression, the sleeve was stretched when the load was small and compressed with the increase in the load. For the specimen with a lapping length of 10d–12.5d, when it was under tension, the sleeve was mainly pulled longitudinally (Figure 21c,d). Under compression, the sleeve was stretched when the load was small and compressed with the increase in the load.
Figure 22 shows the hoop strain curves of the middle section near the steel bar side of the sleeve under high-stress repeated tension and compression loading. As shown in the figure, the middle section of the sleeve near the steel bar side is mainly under tension while the sleeve mainly acts as a constraint regardless of compression or tension. The maximum hoop tension strain of all specimens does not exceed the yield strain of the base metal of the sleeve.

5. Mechanical Mechanism of the Connector

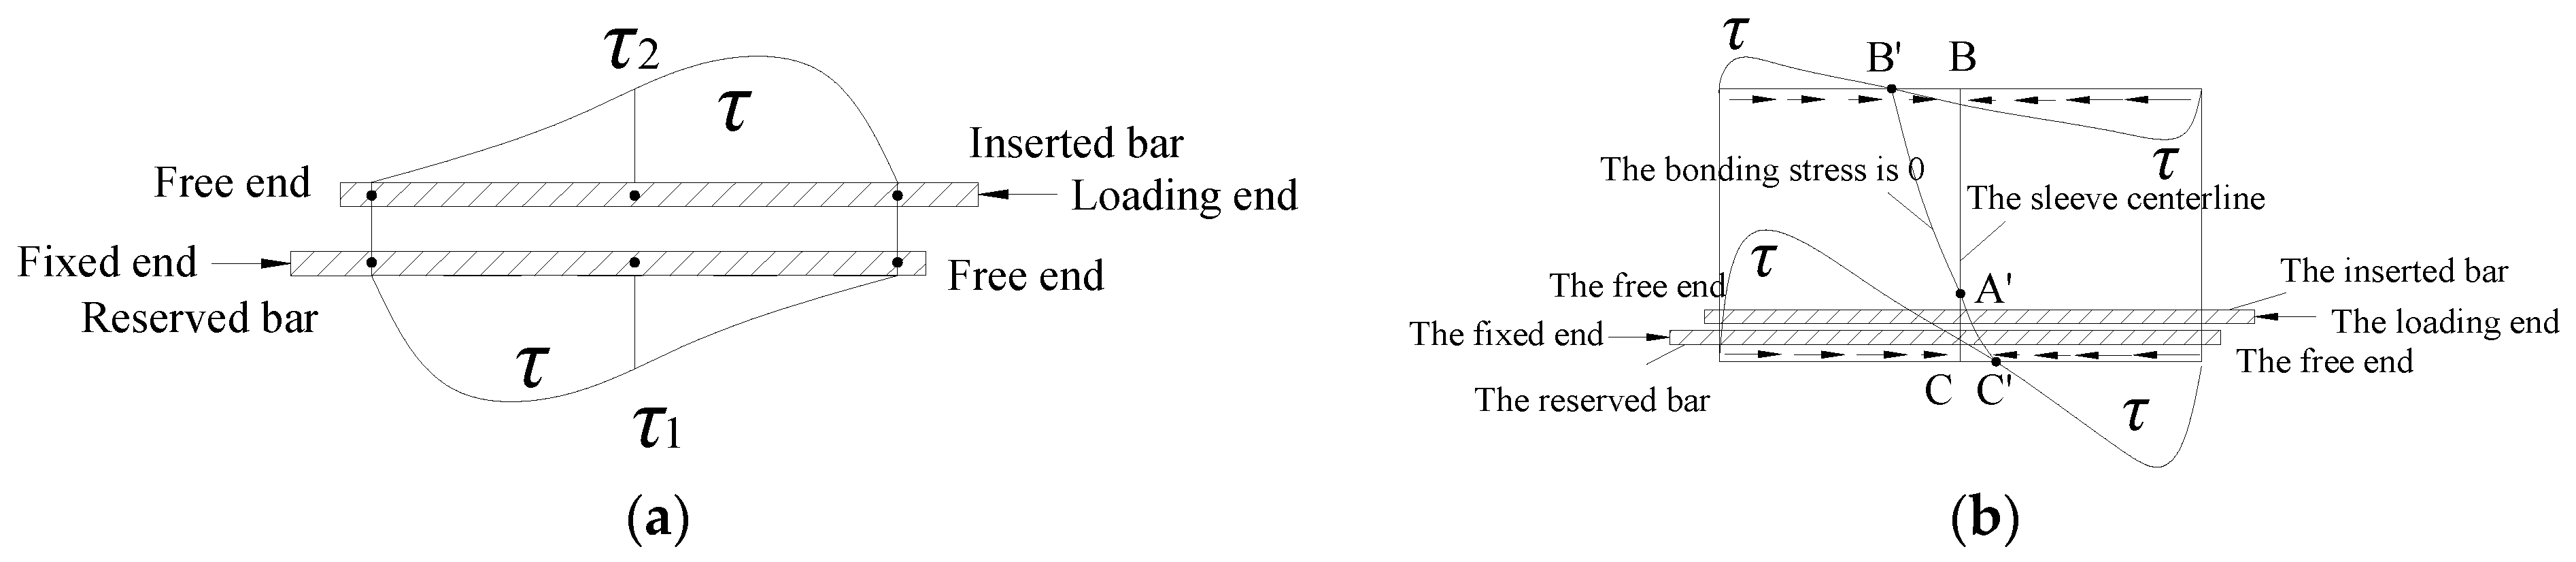
5.1. Stress Analysis of Connection under Tension

The stress mechanism of the APC connector under tension was reported previously [23]. The sleeve was under axial tension in the initial stage of loading and axial compression in the later stage of loading.

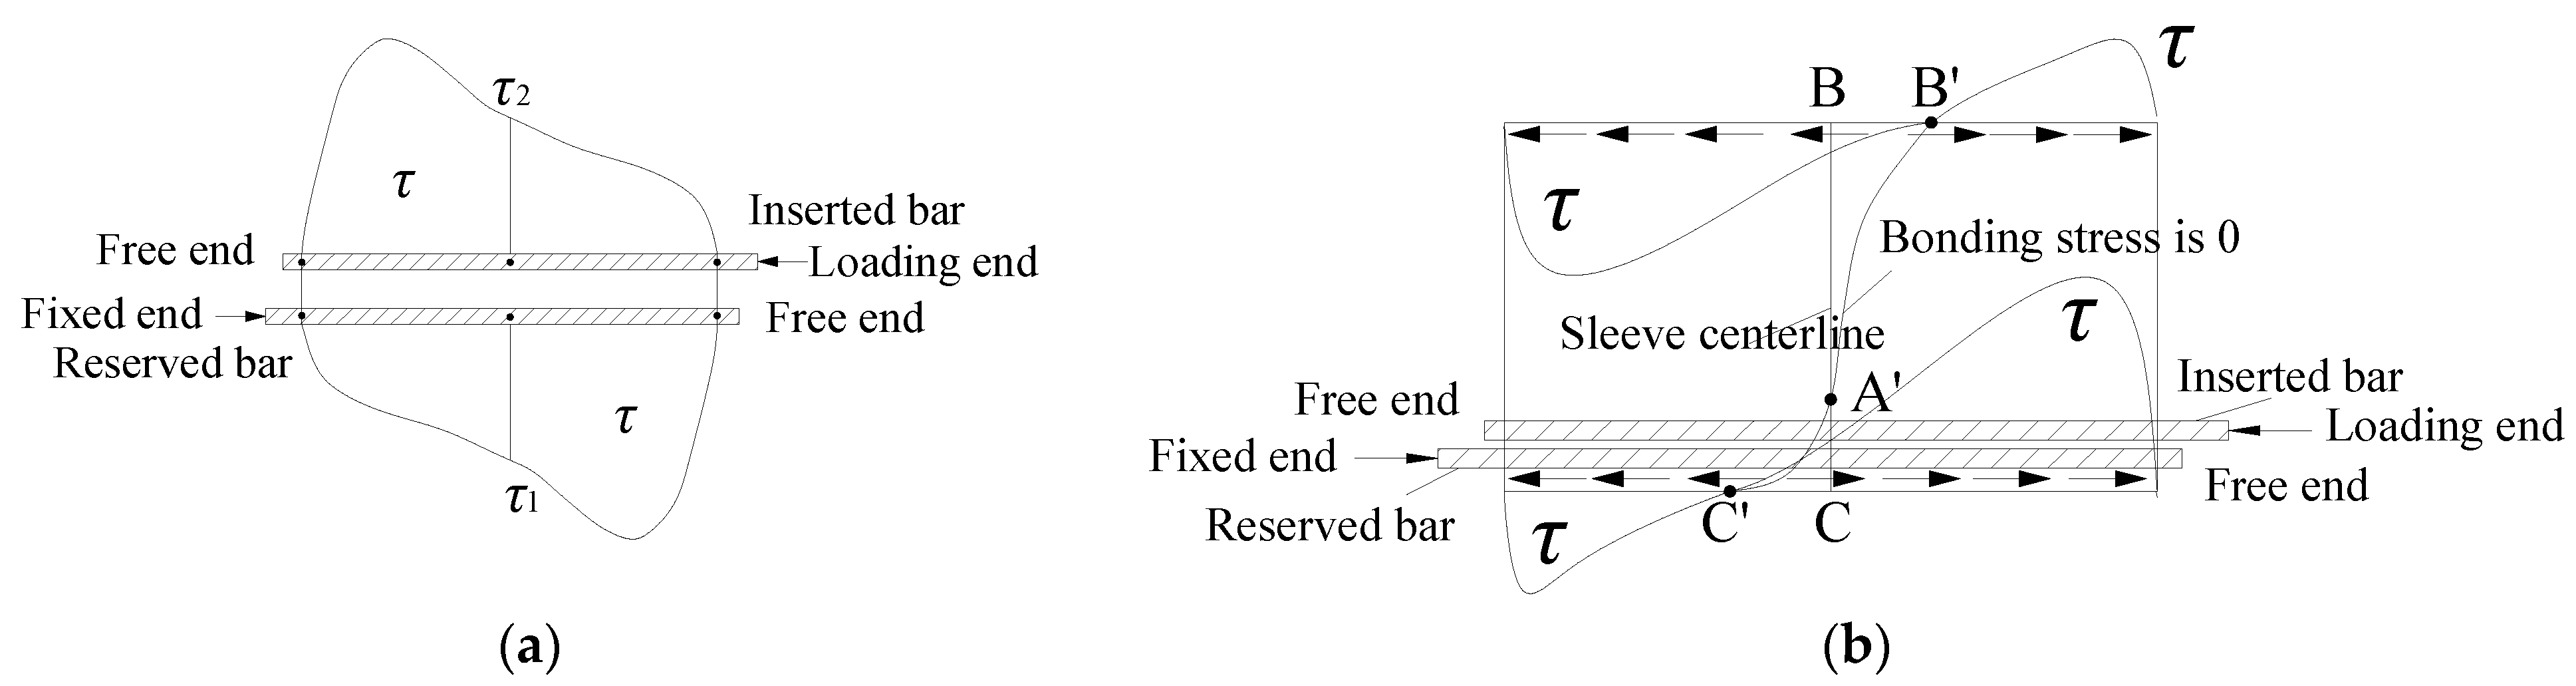
5.2. Stress Analysis of Connection under Compression

For the sleeve with a lapping length of L = 6d as an example, the distribution of the bonding stress τb between the steel bars and the grouting material under uniaxial compression loads at low loading [33] is shown in Figure 23a. The distribution was similar to that in the initial stage of uniaxial tension.
The bonding stress of the two bars was antisymmetric along the length direction. In the middle section of the sleeve, the bonding stresses between the two bars and the grout material were equal in magnitude and opposite in direction (τ1 equalled τ2 in Figure 23a). The bonding stresses at points A and A’, which were the same distance from the two bars, were 0 on the wall at the section with a length of 1/2 of the sleeve length. Figure 24 shows the distribution diagram of the bonding stress at the section with a length of 1/2 the sleeve length, in which “●” represents the vertical flat side facing outward, “×” represents the vertical flat side facing inward, and the size of the symbol represents the magnitude of the bonding stress.
As shown in Figure 23a, due to the uneven distribution of the bonding stress between the steel bars and the grouting material when the load was low, the bonding stresses near the compression ends of the two steel bars were larger, whereas the bonding stress between the steel bar and the grouting material was almost zero near the free end of the steel bar. Thus, the magnitude and direction of the bonding stress between the sleeve and the grouting material mainly depended on the steel under compression at the cross-section of the sleeve end.
At the loading end of the specimen, the magnitude and direction of the bonding stress at the cross-section on the sleeve was determined using the inserted steel bar, because the bonding stress of the inserted steel bar was greater than that of the reserved steel bar. The bonding stress of the sleeve was larger near the steel bar that was inserted later, but smaller at the far end. The direction of the bonding stress of the sleeve near or far from the steel bar at the loading end of the specimen was consistent with the compression direction of the inserted steel bar.
The fixed end of the specimen was opposite the loading end. The size and direction of the bonding stress of the sleeve on the section of the fixed end were mainly determined by the reserved steel bar. The direction of the bonding stress of the sleeve near or far from the steel bar at the fixed end was consistent with the compression direction of the reserved steel bar.
As shown in Figure 24, the direction of the bonding stress at the middle section of the sleeve at point B on the far side of the steel bar was consistent with the compression direction of the inserted steel bar, and the direction of the bonding stress at point C near the steel bar side was consistent with the compression direction of the reserved steel bar. The bonding stress of the sleeve is shown in Figure 23b. Point C′, which had zero bonding stress and was located near the steel bar side, was inclined toward the side of the loading end, and point B’, which had zero bonding stress and was located far from the steel bar end, was inclined to the side of the fixed end. As shown in Figure 23b, the bonding stress exerted by the grouting material on the sleeve was in the opposite direction in the early loading stage, so the sleeve was under uniaxial compression.
For the case when the compression load was high and the grouting material was not damaged, the distribution of the bonding stress between the steel bar and the grouting material is shown in Figure 25a. By conducting a similar analysis to that conducted on the initial loading stage, it was concluded that the bonding stresses of the far and near steel bar sides of the sleeve at the fixed end were consistent with the compression direction of the steel bar that was inserted later under the ultimate load. Additionally, the bonding stresses of the far and near sides of the sleeve at the loading end were consistent with the compression direction of the reserved steel bar. Figure 24 shows that the direction of the bonding stress of the sleeve on the far side of the steel bar at the middle section was consistent with the compression direction of the bonding stress of the steel bar that was inserted later, whereas that on the near side of the steel bar was consistent with the compression direction of the bonding stress of the reserved steel bar. Figure 25b shows the bonding stress of the sleeve under the ultimate load according to the above analysis. The direction of the bonding stress of the sleeve was opposite from that of the grouting material when the load was large, so the sleeve was under uniaxial tension.
With the increase in the lapping length, the bonding stress distributions of the steel bar and sleeve changed, which requires further study.

6. Calculation of Bonding Strength and Critical Lapping Length

6.1. Grey Correlation Analysis of Bonding Factors

Grey correlation theory [34] was used to quantitatively analyse the correlation of the steel bar diameter d, lapping length l, relative lapping length l/d, sleeve inner diameter D, sleeve wall thickness t, steel content ρv, and simplified steel content t/D with the bonding strength. Table 5 shows the correlation results of each factor with the bonding strength. It is mainly described by the order of the correlation degree, not only the magnitude of the correlation r. Because the correlation r of each factor was higher than 0.7, each factor was closely related to the ultimate bonding strength.
As shown in Table 5, the correlation between the simplified steel content t/D and the ultimate bonding strength was the highest. The correlation between the sleeve inner diameter and the ultimate bonding strength was also relatively high. The correlation between the wall thickness t of the sleeve and ultimate bonding strength was relatively weak. This was because the constraint ability of the sleeve increased rapidly with the increase in the wall thickness when the wall thickness of the sleeve was relatively small (less than 2.5 mm). The increase in the wall thickness had little effect on improving the constraint ability of the sleeve when the wall thickness of the sleeve was large (no less than 2.5 mm) [35]. The wall thicknesses of most of the sleeves were large (3 mm) in the data analysed, resulting in a relatively weak correlation between t and the ultimate bonding strength τu. Among the parameters of the steel bar, that is, the diameter d, lapping length l, and relative lapping length l/d, the steel bar diameter d was most highly correlated with ultimate bonding strength. The relative lapping length l/d had a better correlation with the ultimate bonding strength compared with the single factor l.

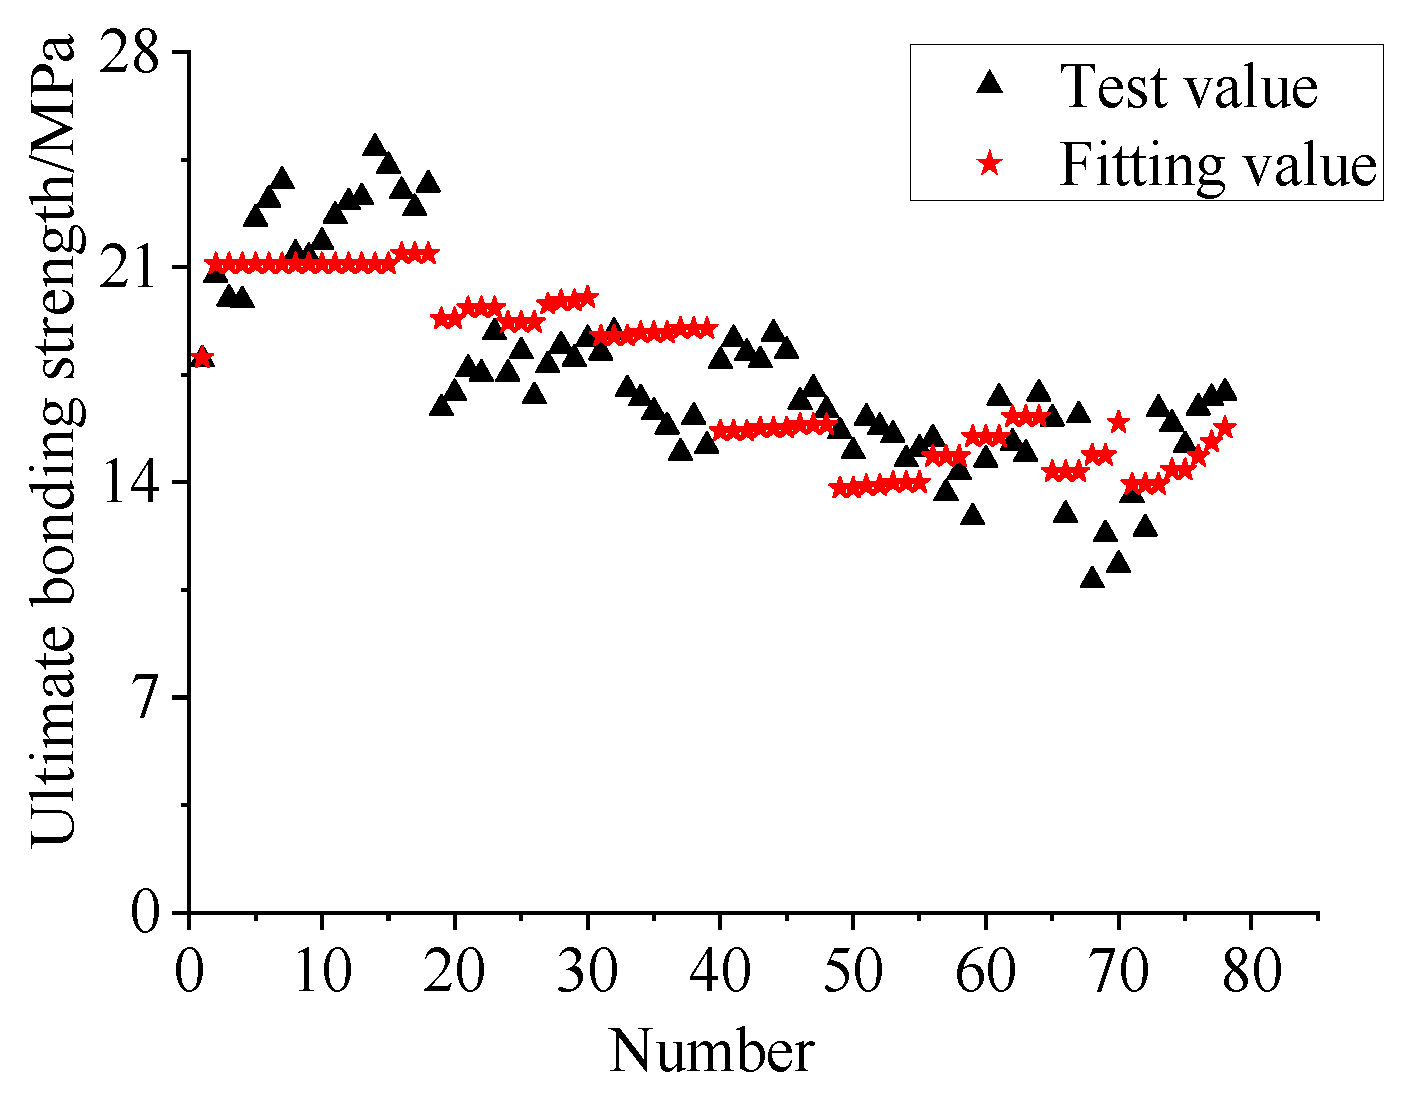
6.2. Calculation of Ultimate Bonding Stress Considering the Influence of Defects

After combining the Grey correlation analysis results of the bonding factors and referring to [36], the following equation was selected to fit the ultimate bonding strength of the grouted sleeve lapping connector:
τ ¯ u = ( α + β d l ) ( γ + m D d + n t D ) f ts ,
where α, β, γ, m, and n are undetermined coefficients, and fts is the splitting tensile strength of the grouting material.
The grouting material is known to be difficult to fill when there is a collision between a steel bar and another steel bar (or sleeve) during the casting of a specimen. The grouting defect coefficient ω (0.85) was introduced to investigate the influence of grouting defects on the bonding strength.
By substituting the test values of a previous series of tests [36, 37] and this test into Equation (1), the following equation for calculating the ultimate bonding strength considering the influence of defects was obtained:
τ ¯ ux = ( 0.24 + 2.78 d l ) ( 6.27 0.08 D d + 31.56 t D ) f ts · ω .
The ratio of the fitted values to the test values of the ultimate bonding strength ranged from 0.85 to 1.28, with an average value of 1.00, standard deviation of 0.047, coefficient of variation of 0.047, and residual sum of squares of 75.12. Figure 26 shows the comparison between the fitted and test values of the ultimate bonding strength. The fitted values of the bonding stress considering the influence of grouting defects were in good agreement with the test values.

6.3. Critical Lapping Length Considering Grouting Defect

It is stipulated that the lapping length when the tensile failure of the steel bar and the bonding slip failure of the grouting occur simultaneously is the critical lapping length of the steel bar, and the steel bar reaches the ultimate tensile strength fu. According to the balance of the force, the formula for calculating the critical lapping length can be obtained as follows:
l crx = d f u 4 τ ¯ ux ,
where lcrx is the critical lapping length considering the grouting defects and τ ¯ ux is the average ultimate bonding strength considering the grouting defects.
The following can be obtained by combining Equations (2) and (3):
l crx = [ f u 0.95 ( 6.27 0.08 D d + 31.56 t D ) f ts · ω 11 ] d .
By inserting the test data of the ultimate tensile strength of the steel bar from this test and Xu’s test [25] into Equation (4), the values of the critical lapping length lcrx of the specimen considering the grouting defects were calculated and compared with the values of the critical lapping length lcre of the specimen when it was damaged during testing; the results are shown in Table 6. As the grouting defects were considered, the error or variance of the equation was decreased and the calculated values were in good agreement with the experimental results.
As shown in Table 3, the residual deformation of the specimens of group G with a lapping length of 12.5d under the anti-deflection condition met the specification requirements. The critical lapping length calculated by Equation (4) in this paper was 13d, indicating that the specimens designed according to the calculation formula of the critical lapping length in this paper can also meet the specification requirements of the residual deformation of specimens under high-stress repeated tension and compression loading.

7. Conclusions

Uniaxial tensile and high-stress repeated tension and compression tests of 32 APC connectors with different lapping lengths were carried out. Analysis of the mechanical properties of these grouted sleeve lapping connectors was conducted. The following conclusions were drawn based on this research.
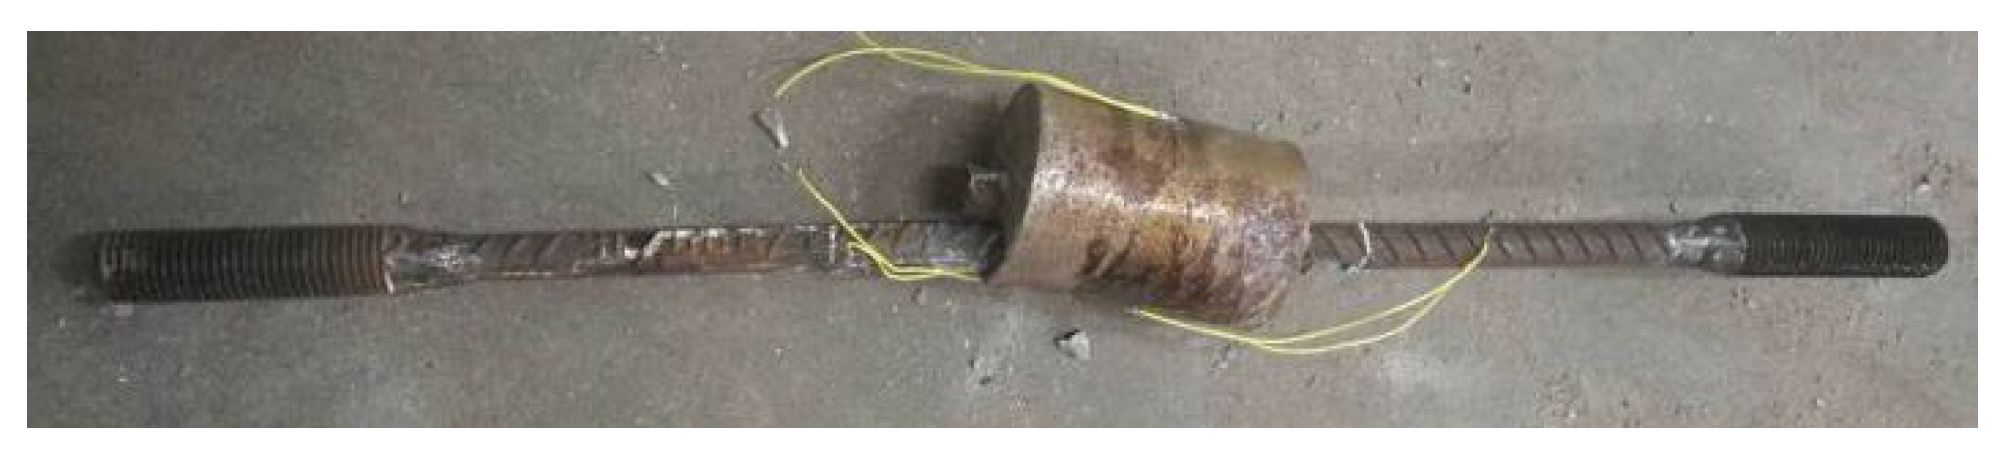
  • There were two failure modes of the APC connector specimens under uniaxial tension: steel bar tensile failure and steel bar pull out. There were three failure modes of the specimens under high-stress repeated tension and compression: steel bar tensile failure, steel bar pull out, and steel bar bending.
  • The bearing capacity of specimens was strengthened after repeated high-stress tension and compression, so the ultimate bearing capacity increased compared with specimens under uniaxial tension. Because of anti-deflection measures, the bearing capacities of specimens without anti-deflection measures were lower than those of specimens with anti-deflection measures.
  • When the connector was broken via the steel bar being pulled out under uniaxial tension, the effects of the lapping length and anti-deflection measures on the ductility of the specimens were not evident under repeated tension and compression. As the steel bar was hardened and the cracks of the grout were fully developed under repeated tension and compression loading, the yield displacement δ y of the specimens increased, and the ductility of the specimens was less than that of the specimens under uniaxial tension.
  • The values of the residual deformation u0 and u20 decreased with the increase in the lapping length. The stiffness values before yielding of the specimens with anti-deflection measures were higher than those without anti-deflection measures, whereas the values of the residual deformation u0 and u20 were lower.
  • Under uniaxial tension and repeated tension and compression (only the final tension process) loading, the longitudinal compressive strain, and the hoop tensile strain near the steel bar side of the middle section of the sleeve decreased with the increase in the lapping length of the sleeve under the ultimate load. After repeated tension and compression loading, the longitudinal strain in the middle of the sleeve changed from compression to tension under tension and from tension to compression under compression with the increase in the lapping length.
  • When the lapping length was small, the sleeve was subjected to longitudinal compression in the early stage and tension in the late stage, which agreed with the test results. The distribution of the bonding stress of the steel bar and the sleeve changed with the increase in the lapping length, which needs further research.
  • The correlation between the variables and the bonding strength of the APC connector was analysed by using Grey correlation analysis. It was found that the correlation between the simplified steel content t/D and the ultimate bonding strength was the greatest. Formulas for the ultimate bonding strength and the critical lapping length for the steel bar fracture were proposed considering the grouting defect coefficient ω. The theoretical calculation results agreed well with the test results.

Author Contributions

Q.Y. proposed the method, conceived the experiments, analysed the data, drew the conclusions, and wrote the paper; P.T. performed the experiments under repeated tension and compression loading and analysed the data; Z.T. performed the experiments under uniaxial tension and analysed the data; X.Z. conceived and designed the experiments; Z.Z. analysed the bonding strength; B.F. proposed the formula for critical lapping length; Z.C. checked and revised the paper. All authors have read and agreed to the published version of the manuscript.

Funding

This study was funded by the Science and Technology Program of Shanghai, grant number 21ZR1468300.

Institutional Review Board Statement

Not applicable.

Informed Consent Statement

Not applicable.

Acknowledgments

We thank Xilin Lv (University of Tongji) for his assistance.

Conflicts of Interest

The authors declare no conflict of interest.

References

  1. Yee, A.A. Structural and Economic Benefits of Precast/Prestressed Concrete Construction. PCI J. 2001, 46, 34–42. [Google Scholar] [CrossRef]
  2. Holden, T.; Restrepo, J.; Mander, J.B. Seismic Performance of Precast Reinforced and Prestressed Concrete Walls. J. Struct. Eng. 2003, 129, 286–296. [Google Scholar] [CrossRef]
  3. Alias, A.; Sapawi, F.; Kusbiantoro, A.; Zubir, M.A.; Rahman, A.B.A. Performance of grouted splice sleeve connector under tensile load. J. Mech. Eng. Sci. 2014, 7, 1094–1102. [Google Scholar] [CrossRef]
  4. Ameli, M.J.; Pantelides, C.P. Seismic analysis of precast concrete bridge columns connected with grouted splice sleeve connectors. J. Struct. Eng. 2017, 143, 04016176. [Google Scholar] [CrossRef]
  5. Rahman, A.B.A.; Yoon, L.H.; Ibrahim, I.S.; Mohamed, R.N.; Mohammad, S.; Saim, A.A. Performance of grouted splice sleeves with tapered bars under axial tension. Appl. Mech. Mater. 2015, 4113, 1176–1180. Available online: https://www.scientific.net/AMM.789-790.1176 (accessed on 30 April 2022).
  6. Sayadi, A.A.; Rahman, A.B.A.; Jumaat, M.Z.B.; Alengaram, U.J.; Ahmad, S. The relationship between interlocking mechanism and bond strength in elastic and inelastic segment of splice sleeve. Constr. Build. Mater. 2014, 55, 227–237. [Google Scholar] [CrossRef]
  7. Ling, J.H.; Rahman, A.B.A.; Ibrahim, I.S. Feasibility study of grouted splice connector under tensile load. Constr. Build. Mater. 2014, 50, 530–539. [Google Scholar] [CrossRef]
  8. Ling, J.H.; Rahman, A.B.A.; Ibrahim, I.S.; Hamid, Z.A. Behaviour of grouted pipe splice under incremental tensile load. Constr. Build. Mater. 2012, 33, 90–98. [Google Scholar] [CrossRef]
  9. Alias, A.; Zubir, M.A.; Shahid, K.A.; Rahman, A.B.A. Structural Performance of Grouted Sleeve Connectors with and without Transverse Reinforcement for Precast Concrete Structure. Procedia Eng. 2013, 53, 116–123. [Google Scholar] [CrossRef] [Green Version]
  10. Ling, J.H.; Rahman, A.B.A.; Ibrahim, I.S.; Hamid, Z.A. Tensile capacity of grouted splice sleeves. Eng. Struct. 2016, 111, 285–296. [Google Scholar] [CrossRef]
  11. Henin, E.; Morcous, G. Non-proprietary bar splice sleeve for precast concrete construction. Eng. Struct. 2015, 83, 154–162. [Google Scholar] [CrossRef]
  12. Li, F.R.; Abruzzese, D.; Milani, G.; Li, S.C. Influence of internal defects of semi grouted sleeve connections on the seismic performance of precast monolithic concrete columns. J. Build. Eng. 2022, 49, 104009. [Google Scholar] [CrossRef]
  13. Belleri, A.; Riva, P. Seismic performance and retrofit of precast concrete grouted sleeve connections. PCI J. 2012, 57, 97–109. [Google Scholar] [CrossRef]
  14. Yuan, H.; Zhu, Z.G.; Naito, C.J.; Yi, W.J. Tensile behavior of half grouted sleeve connections: Experimental study and analytical modeling. Constr. Build. Mater. 2017, 152, 96–104. [Google Scholar] [CrossRef]
  15. Dai, Z.Q.; Pang, S.D.; Liew, J.Y.R. Axial load resistance of grouted sleeve connection for modular construction. Thin-Walled Struct. 2020, 154, 106883. [Google Scholar] [CrossRef]
  16. Espoir, K.K.; Xie, F.Z.; Geng, H.J. Grouted Sleeve Connection for Precast Concrete Members. Civ. Eng. J. 2020, 30, 435–447. [Google Scholar] [CrossRef]
  17. Zheng, G.Y.; Kuang, Z.P.; Xiao, J.Z.; Pan, Z.F. Mechanical performance for defective and repaired grouted sleeve connections under uniaxial and cyclic loadings. Constr. Build. Mater. 2020, 233, 117233. [Google Scholar] [CrossRef]
  18. Liu, Y.; Zhang, L.H.; Zhu, Q.H. Experimental study on mechanical properties of reinforcement sleeving grouting joint. J. N. China Inst. Sci. Technol. 2018, 15, 80–86. [Google Scholar] [CrossRef]
  19. Xu, C.S.; Liu, H.T.; Du, X.L. Experimental study on connection performance of reinforced sleeve grouting under repeated tension and compression under high stress. J. Build. Struct. 2018, 39, 178–184+193. [Google Scholar] [CrossRef]
  20. Zhao, X.L.; Grundy, P.; Lee, Y.T. Grout sleeve connections under large deformation cyclic loading. In Proceedings of the Twelfth International Offshore and Polar Engineering Conference, Kyushu, Japan, 26–31 May 2002. [Google Scholar]
  21. Wang, T.; Yu, M.; Li, X.Y.; Yan, Z.G.; Saafi, M.; Ye, J.Q. Experimental investigation on the post-fire cyclic behavior of grouted sleeve connections. Constr. Build. Mater. 2021, 279, 122394. [Google Scholar] [CrossRef]
  22. Yu, Q. A New Confined Lapping Sleeve. C.N. Patent 201420656653.0, 1 April 2015. [Google Scholar]
  23. Yu, Q.; Zhang, L.; Tang, P.Y.; Li, L.Z.; Zhang, X.K.; Fan, B.X.; Zhang, Z.; Chen, Z.H. Experimental Study and In-depth Tensile Mechanism Analysis of Grouted Sleeve Lapping Conectors. Lat. Am. J. Solids Struct. 2022, 19, e428. [Google Scholar] [CrossRef]
  24. Yu, Q.; Zhang, Y.M.; Gong, X.; Bai, S.H.; Fan, B.X. Comparison of mechanical properties of reinforced sleeve grouting butt joint and lap joint. J. Harbin Inst. Technol. 2020, 52, 140–150. [Google Scholar] [CrossRef]
  25. Yu, Q.; Xu, X.J.; Yuan, W.H.; Xu, Z.Y.; Lv, X.L. Mechanical experimental study on sleeve binding slurry anchor lap joints with different lap lengths. J. Hunan Univ. 2017, 44, 82–91. [Google Scholar] [CrossRef]
  26. GB/T 17671-1999; Test Method for Strength of Cement Mortar. State Administration of Quality and Technical Supervision; China Standardization Press: Beijing, China, 1999. (In Chinese)
  27. GB50081-2002; Standard Test Method for Mechanical Properties of Ordinary Concrete. Ministry of Construction of the People’s Republic of China, China Architecture and Building Press: Beijing, China, 2003. (In Chinese)
  28. GB/T228.1-2010; Metallic Materials Tensile Test Part 1: Test Method at Room Temperature. National Standardization Committee of China, General Administration of Quality Supervision, Inspection and Quarantine of the People’s Republic of China, China Standard Press: Beijing, China, 2010. (In Chinese)
  29. Yu, Q. A Kind of Single Tensile and Reciprocating Tensile and Compression Loading Device for Reinforcement Slepe Grouting Lap Connection. C.N. Patent 202021155373.3, 26 February 2021. [Google Scholar]
  30. JGJ 107-2016. Technical Specification for Mechanical Joint of Reinforcement. Ministry of Housing and Urban-Rural Development, China Building Industry Press: Beijing, China, 2016. (In Chinese)
  31. ACI 318M-11. Building Code Requirements for Structural Concrete and Commentary. American Concrete Institute: Farmington Hills, MI, USA, 2011.
  32. Xu, Y.L. Experimental Study on Bonding Anchorage Performance of Deformed Reinforcement and Concrete. Ph.D. Thesis, Tsinghua University, Beijing, China, 1990. [Google Scholar]
  33. Xu, Y.L.; Shen, W.D.; Wang, H. An experimental study of bond-anchorage properties of bars in concrete. J. Build. Mater. Struct. 1994, 15, 26–37. [Google Scholar] [CrossRef]
  34. Zhou, X.W. Research and Application of Grey Relation Degree. Master’s Thesis, Jilin University, Changchun, China, 2007. [Google Scholar]
  35. Xu, K. Influence of Sleeve Section Size on Tensile Performance of Sleeve Lapping Connectors. Master’s Thesis, Tongji University, Shanghai, China, 2018. [Google Scholar]
  36. Shan, X.B. Experimental Study on Bonding Anchorage between Deformed Reinforcement and Self-compacting Concrete. Master’s Thesis, Harbin Institute of Technology, Harbin, China, 2008. [Google Scholar]
  37. Yu, Q.; Xu, Z.Y.; Yuan, W.H.; Lv, X.L. Tensile test of sleeve grouting lap joint under the influence of two factors. J. Harbin Inst. Technol. 2016, 48, 34–42. [Google Scholar] [CrossRef]
Figure 1. Schematic diagrams of grouted splice connector and grouted sleeve lapping connector. (a) Grouted sleeve splice connector, (b) Grouted sleeve lapping connector.
Applsci 12 06736 g001
Figure 2. Interlock phenomenon of grouted sleeve lapping connector.
Applsci 12 06736 g002
Figure 3. Schematic diagrams of specimens with different lapping lengths (unit: mm): (a) elevation of the specimen and (b) profile of the specimen.
Applsci 12 06736 g003
Figure 4. Specimens (a) before and (b) after the grouting material was poured in.
Applsci 12 06736 g004
Figure 5. Schematic diagram of the high-strength screw.
Applsci 12 06736 g005
Figure 6. Tests to measure the material properties of the H-40 grouting material: (a) rupture strength, (b) splitting tensile strength, (c) axial compressive strength, and (d) elastic modulus.
Applsci 12 06736 g006
Figure 7. Uniaxial tension tests of dog-bone-shaped specimens: (a) loading equipment and (b) failure mode.
Applsci 12 06736 g007
Figure 8. Repeated tension and compression loading equipment: (a) setup of the test, (b) schematic diagram of the anti-deflection device, and (c) Section 1-1.
Applsci 12 06736 g008
Figure 9. Schematic diagram of the layout of the strain gauges (unit: mm). (a) the front view and (b) Section 1-1.
Applsci 12 06736 g009
Figure 10. Layout of displacement meter: (a) plan and (b) Section 1-1.
Applsci 12 06736 g010
Figure 11. Steel bar tensile failure.
Applsci 12 06736 g011
Figure 12. Steel bar pull out.
Applsci 12 06736 g012
Figure 13. Steel bar bending after repeated tension and compression loading.
Applsci 12 06736 g013
Figure 14. Load–displacement curves under uniaxial tension. (a) Group L−1, (b) Group L−2, (c) Group L−3, (d) Group L−4.
Applsci 12 06736 g014
Figure 15. Load–displacement curves under high-stress repeated tension and compression loading (with standard distance (L + 4d)). (a) Group G−1, (b) Group G−2, (c) Group G−3, (d) Group G−4.
Applsci 12 06736 g015
Figure 16. Load–displacement curves of specimens with anti-deflection measures under uniaxial tension and high-stress repeated tension and compression (only the last tensile part) loading (with standard distance (L + 4d)). (a) L = 6d, (b) L = 8d, (c) L = 10d, (d) L = 12.5d.
Applsci 12 06736 g016
Figure 17. Relationship between residual deformation and lapping length under uniaxial tension and high-stress repeated tension and compression loading.
Applsci 12 06736 g017
Figure 18. Load–longitudinal strain curves for the middle section of the sleeve near the steel bar under uniaxial tension and repeated high-stress tension and compression loading (the final tension process) (SZ3). (a) L = 6d, (b) L = 8d, (c) L = 10d, (d) L = 12.5d.
Applsci 12 06736 g018
Figure 19. Load–hoop strain curves for the middle section of the sleeve near the steel bar under uniaxial tension and repeated high-stress tension and compression loading (the final tension process) (SH3). (a) L = 6d, (b) L = 8d, (c) L = 10d, (d) L = 12.5d.
Applsci 12 06736 g019
Figure 20. Effect of lapping length on the longitudinal and hoop strains of the middle section of the sleeve under the ultimate load during uniaxial tension and repeated tension and compression (only the final tension process) loading.
Applsci 12 06736 g020
Figure 21. Load–longitudinal strain curves for the middle section of the sleeve near the steel bar under repeated high-stress tension and compression loading (SZ3). (a) Group G−1, (b) Group G−2, (c) Group G−3, (d) Group G−4.
Applsci 12 06736 g021
Figure 22. Load–hoop strain curves for the middle section of the sleeve near the steel bar under repeated high-stress tension and compression loading (SH3). (a) Group G−1, (b) Group G−2, (c) Group G−3, (d) Group G−4.
Applsci 12 06736 g022
Figure 23. Bonding stress at the initial stage of loading (compression load). (a) Bonding stress distribution of steel bar, (b) Bonding stress of sleeve.
Applsci 12 06736 g023
Figure 24. Distribution of the longitudinal bonding stress between the middle section of the sleeve and the grouting material along the sleeve.
Applsci 12 06736 g024
Figure 25. Analysis of the bonding stress of the sleeve in the higher-loading period under compression. (a) Bonding stress distribution of steel bar, (b) Bonding stress of sleeve.
Applsci 12 06736 g025
Figure 26. Fitted and experimental values of the ultimate bonding strength.
Applsci 12 06736 g026
Table 1. Material properties of the sleeve.
NumberCross-Sectional Area (mm2)Yield Load (kN)Ultimate Load (kN)Yield Strength (MPa)Average Yield Strength (MPa)Ultimate Strength (MPa)Average Ultimate Strength (MPa)
T-137.238.8415.71237.44266.99422.24417.16
T-238.6210.5714.55273.69376.75
T-337.5710.8917.00289.86452.49
Table 2. Loading schemes for the specimens with different lapping lengths.
Loading MethodLoading SchemeLimit of Residual Deformation in Accordance with Grade-I Connection Standard (mm)
Uniaxial tension 0 employ   the   tension   of   0.6 f yk a     0   ( measurement   of   residual   deformation )   0 (measurement of residual deformation) → maximum tension (record of ultimate tensile strength)→ damaged (measurement of total elongation at maximum force)bu0 ≤ 0.10 (d ≤ 32)
High-stress repeated tension and compression 0   ( employ   the   tension   of   0.9 f yk employ   the   compression   of   0.5 f yk )   repeat   20   times 0 damaged cu20 ≤ 0.3
Note: a fyk denotes the standard value of the yield strength of the steel bar; b u0 denotes the residual deformation of the connection after uniaxial tension loading to 0.6 fyk and unloading within the specified distance; c u20 denotes the residual deformation of the connection after 20 cycles of high-stress repeated tension and compression according to the specified loading system.
Table 3. Test results.
SpecimenFailure PatternLapping LengthRelative Lapping LengthPub/kNfyc/MPafud/MPaWhether the Strength Meets the Requirements of [28]Whether the Strength Meets the Requirements of [29]
L-1-1-N aSteel bar pulled out at fixed end 966.0112.54492.39559.9N gN
L-1-2-NSteel bar pulled out at fixed end 966.0109.84493.58546.47NN
L-1-3-NSteel bar pulled out at fixed end 966.0113.54485.97564.88NN
L-1-4-YSteel bar pulled out at loading end 966.0132.7568.71660.2Y fY
L-2-1-NSteel bar tensile failure at weld at fixed end1288.0116.01482.44577.16YY
L-2-2-NSteel bar tensile failure at weld at fixed end1288.0118.29489.65588.51YY
L-2-3-NSteel bar tensile failure at weld at fixed end1288.0117.64484.28585.27YY
L-2-4-YSteel bar tensile failure at sleeve end at loading end1288.0131.4573.33653.73YY
L-3-1-NSteel bar tensile failure at weld at fixed end16010.0117.67493.58585.42YY
L-3-2-NSteel bar tensile failure at weld at fixed end16010.0117.23486.72583.23YY
L-3-3-NSteel bar tensile failure at weld at fixed end16010.0117.13489.85582.74YY
L-3-4-YSteel bar tensile failure at weld at loading end16010.0129.4566.67643.78YY
L-4-1-NSteel bar tensile failure at reinforcing base at fixed end20012.5138.2576.12687.56YY
L-4-2-NSteel bar tensile failure at weld at loading end20012.5140.7599700YY
L-4-3-NSteel bar tensile failure at weld at fixed end20012.5145.2633.83722.39YY
L-4-4-YSteel bar tensile failure at weld at fixed end20012.5147.8609.45735.32YY
G-1-1-NSteel bar bending after repeated tension and compression for first cycle966.0—— e————————
G-1-2-YSteel bar bending after repeated tension and compression for first cycle966.0——————————
G-1-3-YSteel bar pulled out at loading end966.0123.7535.47615.42YY
G-1-4-YSteel bar pulled out at loading end966.0126.2524.48627.86YY
G-2-1-NSteel bar bending after repeated tension and compression for first cycle1288.0——————————
G-2-2-YSteel bar tensile failure at weld at loading end1288.0122.1529607.46YY
G-2-3-YSteel bar tensile failure at weld at loading end (steel bar bending after repeated tension and compression for 14th cycle)1288.0——————————
G-2-4-YSteel bar tensile failure at weld at loading end1288.0150.3643.88747.76YY
G-3-1-NSteel bar bending after repeated tension and compression for first cycle 16010.0——————————
G-3-2-YSteel bar tensile failure at weld at loading end16010.0114.8481.19571.14YY
G-3-3-YSteel bar tensile failure at weld at fixed end (steel bar bending after repeated tension and compression for the 6th cycle, Anti-polarizer damaged)16010.0——————————
G-3-4-YSteel bar tensile failure at weld at loading end16010.0154.3652.34767.66YY
G-4-1-NSteel bar tensile failure at reinforcing base at loading end20012.5136.8573.13680.6YY
G-4-2-NSteel bar tensile failure at reinforcing base at loading end20012.5154.1661.19766.67YY
G-4-3-YSteel bar tensile failure at reinforcing base at loading end20012.5147.8683.58735.32YY
G-4-4-YSteel bar tensile failure at weld at loading end20012.5157.3658.21782.59YY
Note: a With “L-1-1-Y” as an example: L denotes uniaxial tension, G denotes high-stress repeated tension and compression; the second number, 1, denotes the test group; the third number, 1, denotes the number of specimens in the group; Y denotes the anti-deflection measures and N denotes no anti-deflection measures; b Pu denotes the ultimate bearing capacity of the specimen; c fy denotes the yield strength of the specimen; d fu denotes the ultimate strength of the specimen; e “—” indicates that the data cannot be measured; f “Y” indicates that the strength of the specimen met the requirements of the corresponding specifications; g “N” indicates that the strength of the specimen did not meet the requirements of the corresponding specifications.
Table 4. Test results of ductility and residual deformation.
SpecimenAsgtu0/u20 (mm)Whether the Residual Deformation Met the Requirements of [30] R d = δ u / δ y
L-1-1-N——0.22N c——
L-1-2-N——0.33N——
L-1-3-N——0.52N——
L-1-4-Y——0.25N——
L-2-1-N8.930.37N3.29
L-2-2-N10.650.35N4.72
L-2-3-N8.930.08Y a4.59
L-2-4-Y8.470.06Y3.81
L-3-1-N9.010.25N4.21
L-3-2-N8.270.25N4.24
L-3-3-N9.310.07Y4.30
L-3-4-Y8.720.05Y3.66
L-4-1-N10.14.0.13N4.07
L-4-2-N7.840.09Y4.82
L-4-3-N7.980.15N4.02
L-4-4-Y8.590.05Y4.33
G-1-1-N————————
G-1-2-Y————————
G-1-3-Y——0.53N——
G-1-4-Y——0.76N——
G-2-1-N————————
G-2-2-Y——0.51N2.83
G-2-3-Y————————
G-2-4-Y——0.7N3.73
G-3-1-N————————
G-3-2-Y——0.5N3.86
G-3-3-Y————————
G-3-4-Y——0.19Y3.49
G-4-1-N——0.39N5.09
G-4-2-N——0.45N3.24
G-4-3-Y——0.31AY b2.58
G-4-4-Y——0.31AY3.00
Note: a “Y” means that the deformation of the specimens met the requirements of the corresponding specifications. b “AY” means that the deformation of most of the specimens met the requirements of the corresponding specifications. c “N” means that the deformation of the specimens did not meet the requirements of the corresponding specifications.
Table 5. Correlation of each factor with the bonding strength.
Influencing FactorsdltDl/dD/dt/DSteel Content ρv
Correlation r0.7624 0.71950.74660.77820.72550.75590.79210.7903
Table 6. Comparison between the test and calculated values of the critical lapping length of specimens with grouting defects.
Data Sourced
(mm)
t
(mm)
D
(mm)
ft
(MPa)
lcrx/dlcre/d
ω = 0.85
Value from this test203704.1213About 8–10
Value from Xu’s test183704.631110.5
Publisher’s Note: MDPI stays neutral with regard to jurisdictional claims in published maps and institutional affiliations.

