1. Introduction
The phrase “threat intelligence” was coined to help security practitioners and analysts spot cyber attacks on computer networks. CTI (Cyber Threat Intelligence) is described as the method of gathering information, implementing statistical analysis to understand security risks, and identifying risk malware and exploits kinds, as well as creating defense mechanisms [
1]. CTI allows security analysts to collect data, detect threats, and respond quickly with a more effective defensive strategy to neutralize cyber attacks before they exploit system weaknesses. The research community has established ways to display real-time working and safeguarding of individual and organizational data in this respect. Because attackers utilize varied (and unique) methods to target the victim, identifying and neutralizing them is a difficult undertaking. Attackers seek either to acquire personal data such as passwords, bank details, and mobile information or to obtain access to a person’s device in order to carry out criminal operations.
A cyber attack begins with reconnaissance of the target and concludes with exploiting weaknesses to complete the intended task [
2]. As a result, cyber security has become a serious worry, as more people who do not have access to network security technologies have become webmasters. Network attacks, such as DoS (Denial of Service), Injection Assaults, and Brute Force, threaten a number of cloud servers. Many cloud hosts have been hacked and have become botnets or Bitcoin Trojan malware vectors. One of the most effective strategies to lessen the security risk is to provide unified protection for renters who are unaware of cyber security. In today’s world, security is a critical concern. Intruders have proliferated substantially in recent years as the world’s internet technology offerings have developed [
3]. Over time, computer networks have grown, contributing to economic development. According to the ISTR (Internet Security Threat Report), malware is found in one out of every thirteen web queries. Spam in e-mail has climbed to more than 55%, internet dangers have risen to 46%, and ransomware has grown to 46% [
4]. Cybercrime and threats have evolved into a serious menace. Because of this expansion, the necessity of network security has increased. IDS aids in the detection of threats by examining packets recorded from the network [
5]. Many risks exist, such as Denial of Service (DoS), which introduces undesirable traffic into a network and denies or disables legitimate users from accessing resources. Malicious software, known as malware, also takes advantage of susceptibility in computer network systems [
5].
The defense system (Intrusion Detection System) can alert users or block attacks when detecting network intrusions. More and more CSPs are using IDS to protect their tenants’ cloud servers [
6]. As a result, intrusion detection systems are required in the network security industry to prevent attackers from accessing information. In order to identify probable intrusions, an IDS monitors both incoming and outgoing traffic and activities. In Intrusion Detection Systems, ML algorithms are also applied. The ML algorithm is a method of data analysis in which the process of an analytical model is automated [
7]. IDS provides sophisticated tools and technology for a variety of areas, and it has grown rapidly in the past two decades [
8].
Traditional Intrusion Detection Systems tend to focus on enhancing detection performance rather than timeliness, making it difficult to detect massive amounts of data traffic in a short period of time. As a result, attackers have a window of opportunity. Furthermore, in recent years, network assaults involving massive volumes of traffic data have become unexpectedly widespread [
9]. As a result, technologies for the real-time analysis of huge data traffic on high-transmission networks are critical. However, an Intrusion Detection System that works in real time is still in the beginning phase of research and is insufficient to reach a conclusion [
10].
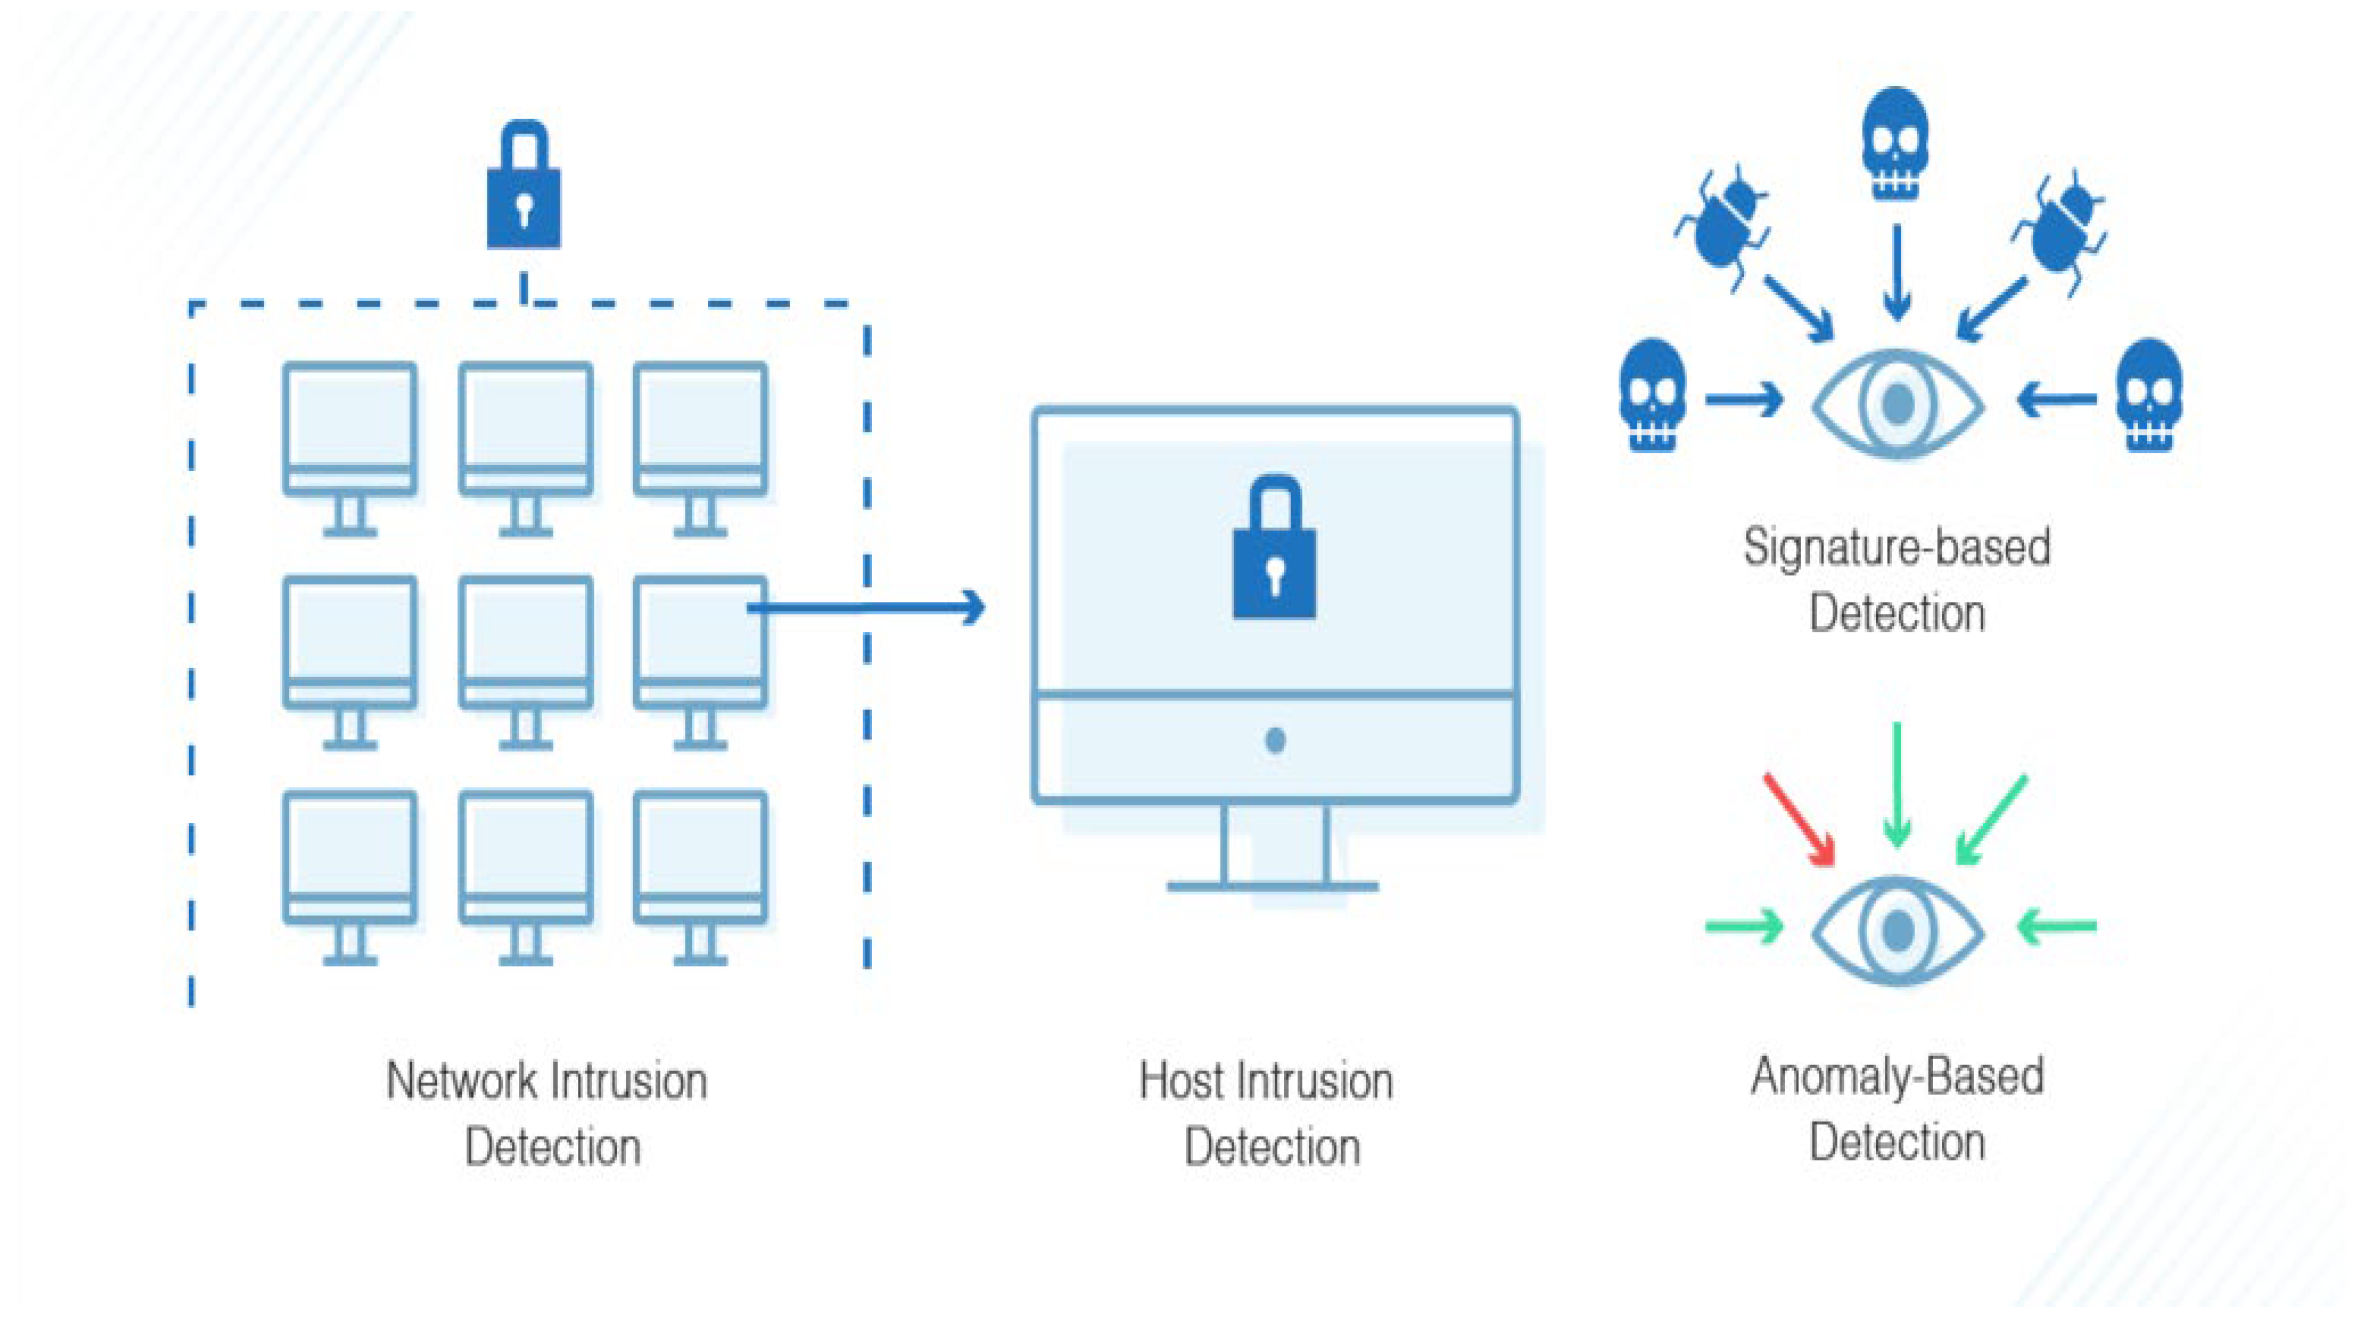
Intrusion Detection Systems keep track of network activity and perform thorough network analyses. They may also detect potential assaults (anomalies) as well as unwanted network access. An IDS, in its most basic form, is computer software or program(s) that collects and evaluates numerous security criteria (metrics or parameters) pertaining to a network. When the term “intrusion detection system” is used, three major methodological ideas come to mind: misuse detection, anomaly detection, or a combination of the two. When there is a divergence from a previously specified network state, the IDS labels it as anomaly detection. Anomaly detection is detecting behavior that is considerably different from normal activity. Misuse detection, on the other hand, compares the attack behaviors used to break into systems with the user activity that has been recorded. It is important to remember that intrusions might come from outside the network (outsider assaults) or from authorized users who want more power (insider attacks). Intrusion might also be privileged users trying to abuse their power. Anomaly detection in computer networks and on the internet as a whole has been the subject of numerous notable papers by security experts.
There are two types of IDS, based on signatures or anomalies, as shown in
Figure 1. An IDS based on signatures identifies attacks using a huge database of known attack signatures. It can only detect known assaults and has no way of detecting novel ones. The IDS approach to anomaly detection creates a statistical model to characterize typical network flow. An anomaly is defined as network traffic that deviates from the model pattern, and such behavior is identified as an intrusion. An IDS is utilized to identify and categorize attacks or violations of security-related protocols at host- and network-level architecture. Depending on the invasive behavior, Intrusion Detection Systems are based on network or host. A network-based IDS (NIDS) is based on network activity. Network activity is gathered through network monitoring equipment such as switches, routers, and other network devices. A host-based IDS (HIDS) is utilized on local host computer activity. The HIDS operates with a variety of log files that are gathered by sensors from the local host computer. The NIDS monitors every packet in the network, whereas the HIDS relies on log files and user account information. The majority of companies utilize a combination of NIDS and HIDS.
Convolution Neural Network is a subset of deep learning and is becoming a popular method of identifying sophisticated assaults with unusual patterns [
11]. Deep learning gives automated techniques for extracting deep features. It provides a more accurate representation of data, allowing for the creation of better models. Intrusion Detection Systems benefit from the use of deep learning algorithms. Several researchers have focused on deep learning IDS techniques since the release of the KDD CUP 99 dataset in 1999. The Defense Advanced Research Projects Agency’s (DARPA) KDD dataset is most often used for IDS evaluation. Denial of Service, Probe, User to Root, and Remote to Local are four categories of attack data in KDD. Deep learning algorithms are based on the structure, function and functioning of biological neurons in the human brain [
12]. Natural language processing, medical research, speech recognition, picture recognition, aerospace and military, and other sectors have seen considerable success using DL. DL-based algorithms, in contrast to typical ML algorithms, deal with big datasets with a variety of attributes (inputs). Some of the traits are necessary to solve a specific categorization challenge, while others are unnecessary and redundant. Furthermore, datasets with a large number of feature vector dimensions are difficult to train and test.
NSL-KDD dataset is a military network environment created with a set of attack and TCP/IP data to extend an Air Force LAN (Local Area Network).
Each data record comprises 41 network characteristics, and each datum falls into one of four kinds of assaults (DoS, U2R, R2L, and Probe) [
13].
The CIC-IDS-2017 and CSE-CIC-IDS-2018 datasets were created by the Canadian Institute of Cyber Security using intrusion traffic characterization techniques. These datasets are divided into seven attack types, each of which describes a current assault scenario. The NSL-KDD dataset, on the other hand, comprises 41 categories, which is more than the CIC-IDS-2018 dataset [
14].
The large quantity of redundant records in the KDD dataset leads the learning algorithms to be biased towards frequent records, preventing them from learning rare records, which are frequently more detrimental to networks, such as U2R and R2L assaults. Furthermore, the presence of these repeated records in the test set will bias the evaluation findings in favor of approaches with higher detection rates on frequent records.
In addition, the complexity level of the records in the KDD dataset was examined. Surprisingly, all 21 learners accurately categorized roughly 98% of the recordings in the training set and 86% of the records in the test set [
15]. The application of the NSL-KDD dataset, a network dataset that is the latest version of its predecessor, KDD CUP 99, is recommended in this paper. NSL-KDD was created to address the inherent issues with KDD CUP 99 [
16]. CNN [
17] is used to classify data. It alters data using the kernel technique and then computes a suitable boundary between the available outputs based on these modifications [
18,
19].
Table 1 details the different types of attacks and their names. There are four different types of assaults.
The advancement of computing capabilities has accelerated deep learning (DL) for a variety of applications, including processing of images, processing of natural language, computer vision, and the IDS, which is the subject of this article. We developed an intrusion detection model with the help of CNN, a DL approach for training image datasets. We organized convolutional neural layers and max-pooling layers to create a CNN-based IDS. In our project, we use the suggested model to train the dataset and compare the results to those of another CNN model to see how well it performs.
The workflow of this article is shown below:
The dataset has been thoroughly explored. Two characteristics must be addressed before the model can be trained.
The dataset has a problem with class imbalance, which is addressed using a hybrid method.
The use of Python and a deep learning model in the IDS implementation process is discussed in this paper.
Regarding time and accuracy, the selected model with the best detection accuracy exceeded numerous proposed approaches.
This article’s primary contributions are listed below:
We propose a method for an Intrusion Detection System with the help of deep learning that outperforms previously developed systems in terms of accuracy.
While implementing the IDS with different hyper parameters, we use a pre-processing step to speed up the training process.
We solve difficulties such as class imbalance in the specified dataset, NSL-KDD.
In the intrusion detection process, CNN offers flexibility. The CNN model has the capability to assess and confirm that data are correct or partially correct. A Deep Neural Network, on the other hand, is capable of performing nonlinear data analysis.
CNN has the capacity to non-linearly handle input from a variety of sources. This is especially critical when numerous attackers launch a coordinated attack on the network.
We process data at a high rate and with high generalization ability combined with efficient categorization performance.
Objectives
The objective of our research was to develop behavioral patterns that deviate from the system’s regular behavior, known as an anomaly detection-based attack. Although Intrusion Detection System can be used to identify previously undisclosed harmful activity, an innovative CNN architecture type was designed to learn content properties of anomalies and then locate the individual anomaly. The following questions are addressed in our work:
What characteristics best describe various attacks?
What kind of data is most suited for identifying specific attacks?
Which deep learning methods are best suited to a certain data type?
This paper is organized as follows. This article is organized as follows. Chapter 2 provides the Literature review.
Section 3 provides information on the proposed system, dataset selection, data preprocessing, and feature reduction. Chapter 4 contains information about the CNN Intrusion Detection Model. Performance evaluation of the proposed system and comparisons in the literature are given in Chapter 5. Finally, Chapter 6 concludes with conclusions and future work.
2. Literature Review
In the current paper, Saljoughi et al. [
20] proposed a network IDS for cloud settings that detects intrusions and assaults utilizing a Multi-layer Perceptron Neural Network and the Particle Swarm Optimization (PSO) algorithm. The PSO method was used to identify the optimal biases and weights of the MLP, and then trained utilizing training data and the obtained optimal weights. NIDS is implemented in the network, which is directly attached to the cloud’s computing; meanwhile, other NIDSs were set up on the processing servers for maximum efficiency and security. Most of the NIDSs report incidents of attacks to a main processing server with a lot of database space, and the suggested system would use these data if needed. The results of optimizing the neural network using the PSO algorithm revealed a significant enhancement in the functionality of the MLP NIDS in order to detect attacks with greater precision and reducing time complexity. NSL-KDD and KDD CUP datasets were used to test the algorithms. The results revealed an increase in the accuracy of detecting unauthorized user security breaches.
Mehibs and Hashim [
21] suggested a method based on the Fuzzy C Mean (FCM) algorithm in a cloud data center to recognize intrusion events from normal behavior and to safeguard network-accessed cloud services and resources that are vulnerable to numerous forms of threats and assaults. The purpose of the Fuzzy Clustering algorithm is to divide the dataset into two different clusters: assault and normal activity. The described module is separated into two parts: (1) training, in which the optimal cluster centers are produced, and (2) testing, in which cluster centers are produced with the help of the training stage to identify fresh, unseen samples. The FCM method was trained and evaluated using the KDD CUP 99 dataset. The system has a high detection rate and a low false positive alarm rate.
Idhammad et al. [
22] show a distributed ML-based technique for cloud computing services. The method comprises five components: (1) network traffic of cloud data collector; (2) network traffic of data pre-processing; (3) anomaly detection; (4) network traffic synchronization; (5) assault traffic categorization. The suggested solution is intended to be installed in the cloud computing alongside the provider’s edge networking devices. This enables the physical layer’s edge network routers to capture incoming packets. The suggested approach is analysis using the public dataset CIDDS-001 in a series of experiments on the Google Cloud Platform. Compared with the normal Random Forest classifier, the results are adequate. The system had a 97% average accuracy, a 0.21% average false positive rate, and a 6.23 s average running time.
BNID at the network layer in the cloud environment was proposed by Ghanshala et al. [
23] as a flexible intrusion detection approach. The authors created a security architecture for deploying BNID at the cloud network node to protect cloud machines against network threats. At the network layer, BNID collects the behavior of virtual machines’ communication, analyses it, and detects harmful network patterns. A cloud administrator investigation report is created. The actual results based on the dataset reveal that BNIDS outperforms the Decision Tree and Naive Bayes techniques. The attack dataset from our solution is validated using the Information Technology Operations Center (ITOC). BNID has an accuracy at 98.88% at a false positive rate of 1.57%, which is adequate.
Vinayakumar et al. [
24] studied the use of a DNN, a type of DL model, to build an effective and flexible IDS for detecting and categorizing unexpected and surprising cyber attacks. Because of the ongoing change in network behavior and the rapid evolution of attacks, it is essential to analyze a large number of datasets collected over time utilizing dynamic and static approaches. The research aids in the identification of the optimal algorithm for predicting upcoming cyber attacks. It has been confirmed through thorough experimental testing that DNNs outperform traditional machine learning classifiers. Finally, the authors provide an AlexNet IDS with a hybrid scale, a highly hybrid and scalable DNN framework that can be used in real time to successfully monitor network host- and traffic-level events in order to forewarn of potential intrusions. The DNN with five layers obtained 78.9% accuracy on the dataset.
Gupta et al. [
25] introduced LIO-IDS, which is based on an LSTM classifier and an Improved One-vs-One approach. The introduced model is a two-layer anomaly-based network IDS that identifies various network intrusions with high accuracy in a short computing time. Using the LSTM classifier, layer 1 of LIO-IDS distinguishes intrusions from normal network data. Layer 2 classifies detected incursions into attack classes using ensemble methods. Because of its high attack detection rates and rapid computation durations, the recommended model is suited for deployment in the real world for network-based intrusion detection.
The main aim of this paper is to check if DL algorithms are suitable for IDS based on anomalies systems. We created anomaly detection models using several DNN network topologies, such as auto encoders, recurrent neural networks, and CNN, for this study. These deep models were trained using the training dataset and evaluated using NSL-KDD training dataset, which is split by a sklearn split function. We conducted all of the tests in this work using a GPU-based test bed. Traditional ML-based models were created using well-known tools such as Nearest Neighbor, Decision Tree, Random Forest, Extreme Learning Machine, Support Vector Machine, Naïve Bayes, and Quadratic Discriminate Analysis. The deep IDS models’ test results demonstrate promise for practical applications in anomaly detection systems. DNN-based systems outperformed typical ML-based IDSs, according to the findings. DCNN, for example, attained 85% accuracy on the test data, a better performance than normal ML approaches, according to the trials. Finally, we concluded that DL is a promising technique for applicability in network security (InfoSec).
3. Proposed System
The proposed system is presented in this section. The dataset that we utilized to validate the proposed detection model is introduced in the first subsection. The processes for preparing the dataset for model training are described in the second subsection. The structure of the CNN model and the parameters that we utilized to build our suggested approach are discussed in the last part.
The following are some publicly available datasets [
26]:
The DARPA dataset created at MIT Lincoln Laboratories in 1998, 1999, and 2000. The dataset was built by manually entering network-based attacks. The dataset was finished in five weeks, with the final two weeks of data used for testing.
The DARPA 98 dataset was used to create the KDD 99 incursion data. There are 41 features in the dataset, plus one extra attribute per class.
The offline network data in the dataset are based on the KDD 99 dataset [
26].
The new NSL-KDD dataset [
27] is an upgraded version of the previous one. It comprises the most important records from the entire KDD data collection. To enable the classifiers to generate an unbiased output, redundant records are deleted. The test and training datasets have a sufficient amount of records, which is reasonable and allows experiments to be run on the whole set. The proposed method was evaluated on the dataset, which has 43 characteristics and one class attribute. The new NSL-KDD dataset is smaller than the KDD-99 dataset, which includes duplicate records. For scholars, there is a library of downloadable files available.
The proposed method was evaluated on the dataset with 43 characteristics and one class attribute. The 43 features are divided into four categories: the first is the network connection’s basic properties; the second is nine features such as the type of protocol, the number of bytes, and so on; the third is the network connection’s content attributes, which include 13 features such as the type of protocol, the number of bytes, and so on; and the fourth is the network connection’s security features, which include nine features such as the type of protocol, the number of bytes, and so on.
NSL-KDD’s training set excludes duplicate records, lowering the complexity [
27]. In [
27], various advantages of the NSL-KDD dataset over the KDD-99 dataset are discussed. The training is carried out with KDD training data, which has 22 attack types, and the testing is performed with KDD test data, which has 17 more attack types. For training and testing, these assaults may be divided into four classes, each having certain common characteristics. In addition, the dataset has 125,973 patterns in the training dataset and 22,544 patterns in the test dataset. The proposed model includes checks for these 17 unknown testing set assaults, making the model more realistic. The assaults are divided into four categories:
DoS—A Denial of Service attacks depletes the victim’s resources, preventing it from handling genuine requests—for example, syn flooding. “Source bytes” and “percentage of packets with faults” are two characteristics that are relevant. A malicious party’s attempt to deactivate system or network resources and services.
Probe—The attacker gathers information about the target system’s possible vulnerabilities, which may then be utilized to conduct attacks on such systems. The goal of observation and other probing attacks, such as scanning port, is to obtain data about the distant victim. “Connection duration” and “source bytes” are two characteristics that are relevant.
R2L—The ability to transfer data packets over a network to a remote system and gain access as a user or root to carry out unauthorized operations. The attacker gains local and remote machine access to the victim machine via unlawful access from a remote machine. Password guessing is an example for R2L. Features that are relevant include “duration of connection” and “service requested”, which are network-level information, whereas “number of unsuccessful login attempts” is a host-level feature.
U2R—An attacker logs in as a regular user and exploits security flaws to acquire administrative access. Unauthorized access to a local super user (root) is a type of attack in which an attacker enters a target system using a normal account and attempts to acquire administrator rights by exploiting a vulnerability. “Number of file creations” and “number of shell prompts invoked” are two relevant aspects.
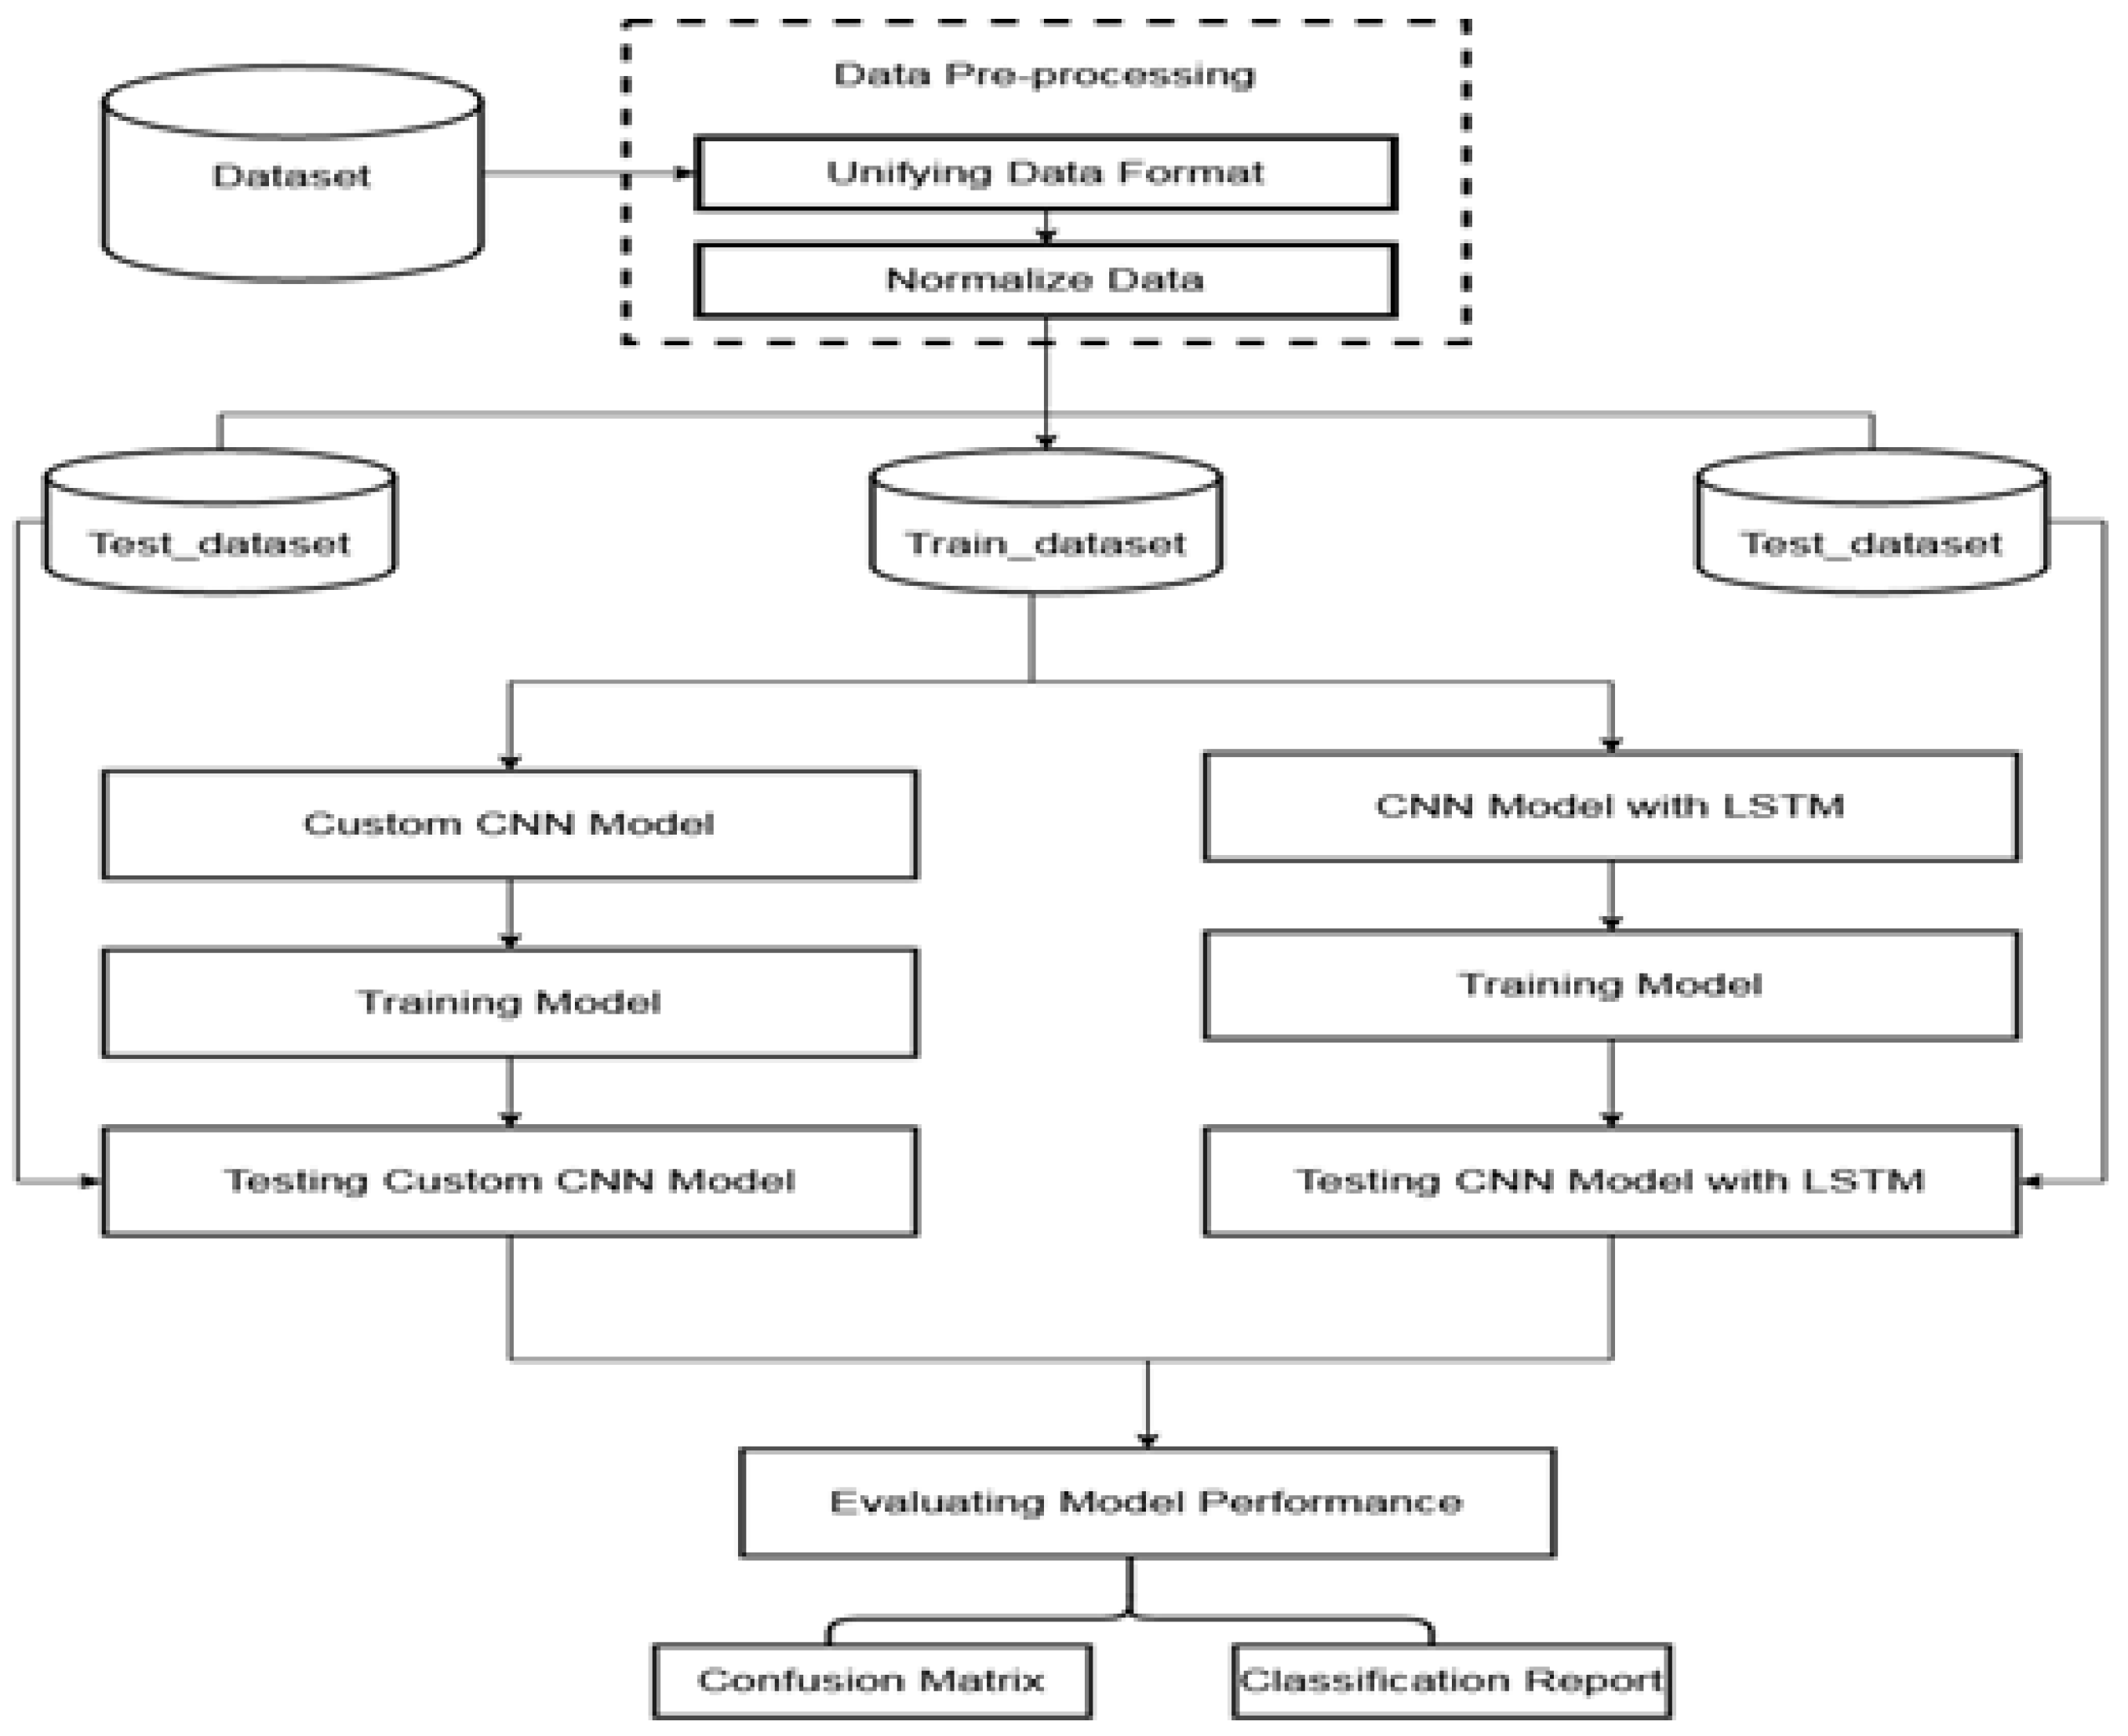
The model’s general architecture is made up of three phases.
Part 1: Data preparation and type conversion are the first steps. The symbolic properties of datasets are normalized and digitized to provide standardized datasets. After the dimensionality of the normal datasets is reduced, every network dataset is converted into a two-dimensional dataset that conforms to the model input data form. The information is subsequently fed into the CNN model with the help of pandas, a data-reading tool.
Part 2: The concrete construction of the CNN intrusion detection model. After training the adjusted data with the DL model, the optimal features are obtained. In the dataset, the Softmax classifier is employed to detect five attack states.
Part 3: Model training and reverse fine-tuning improve the model performance. The CNN model’s back propagation approach fine-tunes the network model’s parameters. Once the appropriate model parameters have been discovered, the performance of the network model is evaluated using the classification results of the test data.
Figure 2 shows the flow of the IDS model.
3.1. Dataset Selection and Data Equalization
The NSL-KDD data are separated into five groups after manual classification [
8].
Figure 3 depicts the distribution of these five categories of data in the test and train data. The kind containing the most data, as seen in the diagram, is Normal data. There are 67,343 records in the Normal category. The kind with the least amount of data is U2R, which only has 52 records.
The ratio between the two types of data is close to 1000 to 1. The problem of class imbalance will have a significant influence on the Convolutional Neural Network. Even if U2R assaults are not detected, the system’s greatest accuracy rate of 99.9% can be achieved. The optimizer’s pursuit of overall accuracy during the training phase is anticipated to result in a U2R attack detection rate of close to 0%, which is exactly what transpired. Oversampling and under sampling are common solutions to data imbalance; however, unlike certain conventional machine learning models, oversampling does not result in overfitting in CNNs [
28].
3.2. Data Preprocessing
Preprocessing data is the first and most important step before using any CNN application. In a data preparation step, there are different subtasks, such as deleting undesired data, data conversion, scaling, removing erroneous data, and so on. Currently, the framework allows both traditional and min-max scaling of unlabeled da-ta to compare inputs that have a comparable trait. The inputs that are comparable are then grouped together. To put it another way, the algorithm tries to discover hidden patterns in the input data and then predicts responses to test inputs based on those patterns.
The attributes of the NSL-KDD dataset are both numeric and non-numeric. Because the training and testing inputs to CNN should be numeric matrices, non-numeric attributes such as flag, service, and protocol type are transformed to numeric attributes. Since CNN cannot process non-numeric values, it is not possible to train the data while maintaining the labels for each row with a textual property, such as the property label, e.g., Normal, DoS, Probe, U2R, and R2L. Consequently, these qualities must be converted into numerical values. Each label is changed to a number and added to the dataset as a separate property; for example, instead of one property in the dataset called “label”, which contains all the categories, each category is added as a separate property in the data frame before parsing it to the model. As a result, the label “Normal” is changed to “1”, followed by “DOS” to “2”, “Probe” to “3”, “R2L” to “4”, and “U2R” to “5”.
3.3. Feature Reduction
Feature selection is used to filter out data that are redundant or irrelevant. It is a method of picking a subset of important characteristics that fully describe an issue while causing the least amount of presentation degradation.
According to Ref. [
29], 21 attributes have no bearing on assault detection. We reduced the size of the dataset by removing the least usable characteristics from the training and testing sets, leaving us with 40 features. Now that the dataset has been reduced, it may be used for training and testing. Training and testing were likewise performed using 41 features, although feature reduction was not conducted on the dataset in this case.
3.3.1. Training Neural Network
These patterns are not evenly distributed in the NSL-KDD training dataset, which has 125,973 items. In their class, R2L and U2R have just a few patterns. A total of 18,718 patterns were chosen to preserve equality and speed up the training process—17,672 patterns were picked at random from the Normal, DOS, and Probe classes, and the rest were drawn from the remaining classes. Training was executed on both a full-featured and a feature-reduced dataset. We used two models: (1) Custom CNN model and (2) a CNN model with LSTM.
3.3.2. Testing Neural Network
The NSL-KDD dataset’s test set contains several undefined attacks which are not included in the training dataset. As a result, precisely classifying such assaults is a top priority. The neural network is evaluated using 22,544 records from the whole test dataset, with or without feature reduction, if necessary.
3.3.3. Result Evaluation
Various parameters may be used to assess the performance of a neural network. Classification accuracy, detection rate, and false positive rate are all common measures, with the supplied parameter calculated by combining true positive, false negative, false positive, and true negative. A confusion matrix is used to examine these aspects.
4. Implementation
This section describes the suggested CNN model’s implementation. The dataset used to evaluate the intrusion detection model is introduced in the first subsection. The second paragraph outlines the procedures involved in preparing the dataset for model training. The construction of the CNN model and the parameters utilized to assemble our project are discussed in the last subsection.
4.1. CNN Intrusion Detection Model
We present in this paper CNN-IDS, an intrusion detection method based on the standard CNN model Lenet-5 [
30]. This technique may successfully identify network intrusion data by upgrading its network topology and implementing optimization. It primarily consists of three phases for detecting network intrusion data. STEP 1: Using the CNN to model network connection data. The network traffic dataset is first decreased in dimension and then mapped into two-dimensional feature vectors. The CNN input layer can employ the converted two-dimensional network connection feature matrix as input samples. Second, the label is encoded in a single step, which makes training and testing easier. STEP 2: Extracting and analyzing network-traffic characteristics with the CNN. The CNN-IDS model comprises three layers: an input layer, five hidden layers, and an output layer. The input layer transforms a 1D network dataset into two-dimensional plane data, allowing CNN features to be learned faster. Two more layers, (1) a convolution layer and (2) a pooling layer, are also included. The convolution layer continuously maps some data to a high dimension and trains the feature data from the network data. The pooling layer reduces computation time and corrects the model’s detection performance by reducing the size of the retrieved features. Each convolution layer and each pooling layer in the Lenet-5 intrusion detection architecture are configured alternatively to reliably and effectively extract intrusion characteristics. To predict categorization, the output layer translates the outcome of feature extraction to a 1D array. STEP 3: The classification results are generated using a combination of the Softmax classifier and CNN. That is, the intrusion behavior detection findings are acquired.
We used the TensorFlow framework to construct the Convolutional Neural Network in this study. The training dataset has 21 types of attacks, whereas the test dataset has 17 new attack types [
31]. We experimented with two distinct CNN models: (1) a CNN model with LSTM and (2) a CNN model without LSTM.
Behind each convolutional layer, we placed two max-pooling layers and two convolutional layers. Though the max-pooling layer is not required for a CNN model, we utilize it since there is very little risk of losing essential features due to the transformed dataset being only number data rather than hidden values. Moreover, for each convolutional layer, we use “Relu” as an activation function. Dropout is used after each phase of the max-pooling to reduce overfitting. Finally, a flatten layer is added behind the final max-pooling and dropout layers. Two dense layers are added, and in between the dense layers, a dropout layer is applied to nullify the contribution of neurons to the next dense layer. At last, the dense layer will leave the output shape of (None, 5), as there are five multi-classification classes (Normal, R2L, U2R, Probes, DoS). In the Custom CNN model, there are a total of 138,949 parameters. The weights and biases that will be utilized for calculation in all neurons of the CNN are known as parameters (params). When we train a model on a set of photos, it determines exact values for all parameters (such as weights and biases) that are used to analyze the image and anticipate the output.
4.2. CNN Model with LSTM
In the CNN model using LSTM, there are four convolutional layers and two pooling layers beneath each of the two convolutional layers. In addition, for each convolutional layer, we use “relu” as an activation function. Each step of the LSTM layer has only one dropout layer applied.
In the CNN LSTM architecture, CNN layers for feature extraction on input data are combined with LSTMs to assist sequence prediction. Convolutional Neural Networks have been improved to have long short-term memory. In order to solve the disappearing and expanding gradient problems, in LSTM, memory block is used instead of traditional NN units. The RNNs, which use cell states to store values and long-term states, is the primary distinction. This network can recall and link past data to the data that are collected in the present. LSTM is used in conjunction with three gates: an input gate, a “forget” gate, and an output gate.
A dense layer is added at last as a final layer. The dense layer will leave the output shape of (None, 5), as there are five multi-classification classes (Normal, R2L, U2R, Probes, DoS). In the CNN with LSTM model, there are a total of 142,667 parameters.
The DL models that were proposed were trained on Python. Testing was carried out via Google Collaboratory (Colab). We employed the following experimental settings throughout all the trials: batch size; learning rate; and number of epochs = 20. The dataset was randomly partitioned into two distinct datasets: train and test. The parameters used are batch size, number of epochs, optimizer, and loss. Batch size represents the number of training data points in each iteration. The number of epochs represents the number of times the model trains the data. The optimizer denotes the optimization algorithm used, and loss is the computing method for minimizing the model seeking knowledge. The fine-tuning configuration in this model is described in
Table 2.
Visualizing the performance of any ML algorithm is a straightforward method for making sense of the model’s output data and making an educated judgement regarding the model’s parameters or hyper parameters that need to be altered and thus identify under-fitting or overfitting. Generalizing the model is one of the most difficult aspects of ML techniques that can predict suitable results with fresh data rather than trained data. Presentation of training loss or training accuracy with respect to the number of epochs is an excellent technique to show that the model has been adequately trained.
It is also important to adjust the hyper parameters. The total number of nodes per layer in the CNN, as well as the number of network layers, shows the performance of the model. To help in the optimization of these parameters and the construction of a better model, the fitness of the training and test set data can be displayed. While training models on the CPU, both models take a long time to train the dataset at first, but as we reach higher epochs, the processing time decreases. We switched the processing unit in Colab to GPU and saw a significant difference in processing time and performance.
5. Results
To evaluate the performance of the suggested system, we ran tests in a variety of situations and compared the model to relevant methods in the literature. For the deep learning applications Keras and TensorFlow, we utilized the Python language and development libraries. During the training process, the following parameters were used: CNN-Dropout, with a rate of 0.1 to avoid overfitting; the loss function Categorical Cross-entropy, which is a classic loss used in multi-classification tasks; the default learning rate defined in Keras, which is 0.001; and the optimizer Adam, an adaptive learning rate optimization technique for training a CNN model.
Cross-validation is a model selection method that is mostly used to choose hyper parameters. The number of parameters in the model will change when the hyper parameters are changed. Increasing the number of layers in a neural network, for example, might create thousands of new parameters (depending on the width of the layer). Simple models with few parameters, models with simple hyper parameters, and models that are straightforward to tune are frequently employed with k-fold cross-validation. CNN has a proclivity for overfitting rather than under-fitting [
32].
The exact values of weights or coefficients that the model ends up with after solving the optimization using gradient descent, etc., are referred to as parameters. This results in the weights matrix for each layer in a CNN.
To discover the optimal collection of hyper parameters, cross-validation is utilized. The optimizer (gradient descent, Adam, etc.) finds the optimal set of parameters for a given collection of hyper parameters and data [
33].
Furthermore, cross-validation is mostly used in regular regression problems; in this work, the problem is classification, which would necessitate k-fold cross-validation as an equivalent to traditional cross-validation. In this experiment, we avoid k-fold cross-validation because the folds should have equal labeling percentages, which is challenging to accomplish, especially with a large dataset. Having inconsistent labeling would negatively affect the accuracy of the model. However, as an alternative, different testing methods are used, such as f1-score, precision, and recall, which are applied for both models [
34].
The steps to measure the results entail applying different models which represent the algorithms used; the dataset, methodology, and evaluation metrics are also used.
Table 3 summarizes our results.
The two models’ iteration durations, batch size, and optimization function are all specified in the same way.
Table 4 indicates that the Convolutional Neural Network IDS model has a quicker model training speed than the other algorithms of deep learning when comparing training time and classification outcomes for each iteration. The CNN model requires less time during training than the LSTM as it simpler. However, the testing time is identical for both models.
Table 4 presents a comparison of the time factor for both models.
On each dataset, we used deep learning frameworks and measured performance metrics including accuracy, standard deviation, and time. To develop the best deep learning classifier to utilize as the baseline classifier, we tested with various parameters supplied by each framework. We also tried normalizing the numeric features, but the change in performance was too small to warrant normalizing numeric values in all of the studies.
The data in the dataset are classified as Normal or as one of the 24 types of attacks. These 24 assaults are divided into four categories. It is a collection of data mining-related ML algorithms. The following are the steps in the experiment:
Pick a dataset and prepare it for analysis.
Put the classification algorithm to the test.
Compare the results of the classifier.
To distinguish between redundant and unnecessary data, feature selection is used, which is a method of picking important features that fully reflect an issue while causing the least amount of display degradation. As a result, concentrating on a small set of features may yield superior outcomes.
The lowest collection of features that can accurately define the training dataset will be retrieved as a generic strategy for feature selection. It is sufficient to describe the data, and the label class is associated with attributes (that is, it is an exact predictor). Moreover, the predictive power drops and may be poor if an attribute always has the same value. In the recursive feature elimination approach, a model is built periodically, a feature is placed aside, and the procedure is repeated with leftover features until all features in the dataset have been exhausted. A good attribute selection criterion is not always synonymous with a good feature subset construction method. We evaluated the impact of removing one feature at a time since we wanted to meet a given set of requirements.
Our aim was to see if an attribute selection process would increase the accuracy of a model’s detection on different types of attack classes found in the NSL-KDD dataset. In our experiment, each attack category was fixed separately because they all have different characteristics and are unique in nature.
This choice was made in order to find all-important characteristics for each attack type and evaluate the accuracy gain over the original set of features. Because important features that are appropriate to identify those distinct assaults classes have been discovered, the model’s performance has been significantly enhanced, according to the analysis.
This study provides fresh insight into the use of a learning algorithm and reduction approach to choose relevant and vital features with the help of Confusion Matrix and Classification Report to increase an Intrusion Detection System’s accuracy and find prospective characteristics that might help with this development.
By using the sklearn split function, we have split the NSL-KDD dataset into two parts, train, and test, with an 80:20 ratio. The accuracy of the train and test datasets for both models are displayed in
Table 5. According to Ref. [
35], the conventional LSTM model shows low performance on the NSL-KDD test dataset due to the low number of data attributes present in this file. Our method of splitting the dataset into two parts shows higher performance.
Classification models produce multiple category outputs. The overall error in our model is calculated by most error measures, but we cannot detect specific instances of faults in our model. The model may misclassify some categories more than others, but using a conventional accuracy metric, we cannot discern this.
Figure 4a,b shows the confusion matrix of the NSL-KDD dataset for each CNN model (Custom CNN and CNN model with LSTM). The confusion matrix was divided into 5 × 5 matrices with five different classes.
Table 5 shows the accuracy of the training and test datasets of both models.
For further verification, reports on f1-score, precision, recall, and support are generated for both CNN and CNN-LSTM models.
Table 5 describe the metrics of the CNN model for all the categories of attacks.
Table 6 describe the same metrics for the CNN-LSTM model.
Table 7 presents a brief comparison between the accuracies of different models with the same datasets. Only testing accuracy is compared, as other approaches did not mention the training accuracy, and testing accuracy is the most important as the models will measure their effectiveness on unseen data.
6. Conclusions
In this study, we demonstrated the significance of using a set of important attributes in conjunction with a suitable classification learning method when modeling an IDS. A Convolutional Neural Network-based IDS is proposed. We used the NSL-KDD dataset for training and testing the model. We pre-processed data to execute a pre-training procedure in order to achieve the best possible training data resampling weights to tackle the problem of class imbalance. Finally, the issue of some attack types being unable to be detected owing to a lack of training data has been resolved. NSL-KDD is a dataset created by NSL. The dataset was trained and evaluated for five different types of class attacks. R2L and U2R categories had smaller patterns in the training and testing sets, and certain designs were chosen at random from the other three classes. The IDS system has a decent capacity to track the intrusion for classes in the dataset.
Our findings reveal that the suggested IDS has a greater accuracy and classification report than the other IDSs for each attack type, particularly for Root to User and User to Root assaults. The NSL-KDD dataset was used in this study for experimental validation of our IDS. Our proposed Intrusion Detection System investigates variations in the residual block and develops residual network models based on these variants, attaining higher accuracy, recall, F1-score, and precision and other measures for Root to User and User to Root attacks compared to other Intrusion Detection Systems.
The suggested feature selection approach in this study had a high accuracy rate, and features were found using an information gain and ranking strategy.
The feature selection approach is frequently used to discover the best feature subset for improving system performance by removing redundant and unnecessary characteristics from the dataset [
35]. The Convolutional Neural Network approach avoids selecting the best features. A new study approach in the future might be to immediately transform network packets into images to avoid the problem of artificial feature selection. Furthermore, the Convolutional Neural Network is fast-evolving, and the proposed structure in this research can be improved. Some researchers, for example, have recommended the use of a dropout function to decrease overfitting and increase accuracy [
36]. These strategies might be used to improve the structure of Convolutional Neural Networks in the future. Finally, when hackers know the dataset and resampling weights, they can examine the undiscovered attack package to build an assault that can circumvent the intrusion detection of our technique.
With the use of dimensionality reduction, we aimed to produce a dataset that could be converted into a 2D matrix form that met the requirements of CNN as input data. The CNN-based findings show that the method not only improves the detection and categorization of the network traffic, but also decreases the categorization time, which allows the system to satisfy on-time requirements. In a future study, we will use new sample data and employ the Generative Adversarial Network technique to find additional characteristics of categories of attack in order to overcome the problem of low detection rate and difficulties in learning in a low number of attacks (User to Root, Remote to User).
Future Works
In the future, it is recommended that researchers investigate the idea of using optimization approaches to produce a more accurate intrusion detection model. It is possible to eliminate redundant and unnecessary features using the research presented in this study, which can considerably enhance classifier performance. Accuracy is improved by finding relevant characteristics within the dataset. Finally, as shown in Ref. [
37], principal component analysis (PCA) may be utilized to minimize the amount of features and the training and testing time. We believe that by combining these three approaches, we can increase the accuracy and performance of our models. To build an effective intrusion system, we may also strive to enhance the CNN model. To make bypassing intrusion detection more difficult, we will try combining the Generative Adversarial Network (GAN) training process with CNN.


