1. Introduction
Complex networks are well suited to describe interconnected complex systems in communications, finance, transportation, power, and social sciences, and its self-organizing, self-similar, small-world, scale-free properties are very powerful for cross-discipline integration [
1,
2,
3,
4]. Research related to spreading dynamics [
5,
6] is an important branch of network science. The spreading dynamic is widespread in the real world, such as the spreading of diseases in human or biological networks, the spreading of malicious viruses in internet networks, the spreading of rumors in social networks, and the spreading of anomalies in financial networks. These spreading behaviors are complex and diverse in real networks, and the process is influenced and constrained by many natural and social factors, which are not only corresponding to the spreading properties of the things, but also to the topology and property of the networks.
Classical network models (random networks, small-world networks, and scale-free networks) are often used to explore changes in the spreading procedure. In the past 20 years, researchers have explored the spreading procedure on complex systems based on classical disease spreading mechanisms, such as, SI, SIS, SIR, etc. Here, the phase transition and criticality transition of the spreading procedure have received extensive attention. Pastor and Vespignani et al. [
7] explored and found that the spreading threshold of scale-free networks tends to zero when the size of the network tends to infinity. Chen et al. [
8] found that overlapping community structures will promote spreading. Huang and Li et al. [
9] found that having a strong community structure will inhibit spreading. In exploratory studies of disease spreading, the vast majority of attention is still focused on the phase transition of whether a disease can break out in a population. Based on the analysis of the phase transition, the spreading threshold of a disease is computed, which can be used to explore the nature of the spreading threshold, and to analyze the effect of changes of network structure and size on the spreading procedure. Studies of disease-spreading dynamics on complex networks aim to reveal the influence of network topology on disease-spreading behavior, or to analyze disease outbreak thresholds quantitatively or qualitatively based on infectious disease models, which can deepen the understanding of disease spreading behavior and predict disease outbreaks in populations. At the same time, the development of appropriate and effective immunization strategies is one of the key research topics in the dynamics of spreading on complex networks in order to suppress the negative effects of spreading.
Based on taking into account the position of a node and connected edge properties in the networks, the main measure of immunization techniques is to protect the network by selecting key nodes in the network and then cutting off effective spreading paths. Most of the current researches on immunization strategies address the spreading of individual diseases based on a single layer network. The literature [
10] compares the controlling effectiveness of random immunization and target immunization strategies on scale-free networks. Although target immunization is more effective in suppressing the disease, it requires traversing the global information of the network before taking action, and it is not applicable on the large-scale social networks. Cohen et al. [
11] proposes a strategy of acquaintance immunization, which immunizes the neighboring individuals of being randomly selected individuals with a certain probability. In this strategy, individuals with a larger degree are more likely to be selected, resulting in a better immunization effect.
The disease-spreading model refers to the basic mathematical model of disease spread, which mainly studies the spreading speed, space range, spreading path, dynamic mechanism, and other issues of diseases, so as to guide the effective prevention and control of diseases. Common infectious disease models are divided into SI, SIR, SIRS, and SEIR models. The existing models of disease spread are mainly studied based on single-layer networks, which do not conform to real-life situations and specific backgrounds. This paper mainly uses a multi-layer complex network to simulate the relationships between objects in real life, which further accords with the actual situation. Therefore, it is of great significance to study disease-spreading models on multi-layer complex networks.
With the complexity of network models and the diversification of disease spreading, the study of spreading models on multi-layer complex networks [
12] and immunization strategies has attracted extensive attention from many scholars. For complex and large social systems, traditional single-layer networks can no longer fully and effectively reveal the nature of real systems, and may lead to misrepresentation of real-world phenomena. Therefore, multi-layer networks have emerged. Multi-layer networks use different types of connected edges belonging to different levels of the system to describe the interactions of system entities in different link relationships, so as to effectively demonstrate the heterogeneity of nodes and the diversity of being connected edges, and it has become a hot topic in the field of network science. Liu et al. [
13] proposed and constructed four three-level super-network models based on a mixture of small-world and scale-free network models, and defined a two-level cross-degree to represent the competing and cooperative relationships between nodes at different levels. In the literature [
14], two-layer ER and two-layer BA networks were constructed, and the influence of the association degree was researched for nodes between different layers. In the study of disease spreading in multi-layer networks, Zhou et al. [
15] analyzed the spreading dynamics of interacting diseases from two perspectives: spreading threshold and disease outbreak, and further investigating the impact of interactions between diseases on immunization strategies. Wei et al. [
16] explored the epidemic spreading process on two-layer interaction networks and proposed three different models to describe the cooperative diffusion procedure on interconnected networks. Arruda et al. [
17] summarized the spreading dynamics on multi-layer networks separately.
The SIS spreading mechanism is the most basic and common in real life, and it is suitable for describing diseases such as influenza, which can recur after being cured. The three-layer network model is also a good description of the spreading characteristics of cross-layer diseases. Therefore, this paper adopts a three-layer complex network disease spreading model based on the SIS mechanism that generally conforms to the structure of real-life network systems and the characteristics of diseases. The novelty of the three-layer complex network construction algorithm is that the number of nodes within each individual layer is variable, and two single layers among three layers use the different construction algorithms. Due to using different construction algorithms, each single-layer network has a different average degree, resulting in a multi-peaked distribution for the overall degree of the network. The multi-peaked feature makes the network model more complex, while the different number of nodes in each layer makes it more relevant to the actual networks. The topological properties of the multi-layer networks and the influencing factors of disease spread are combined to investigate the dynamic behaviors of the disease spread. At the same time, the multi-peaked feature of the network provides a theoretical basis for the formulation of disease immunization strategies.
In the spreading field in the real world, whether it is the virus spread of the computer, the rumor spread in information communication, or the disease spread crossing species, they have different spreading characteristics, and the basis of spreading lies in the interaction of different network types. The research of this paper is used to explore the cross-layer spreading behavior. By constructing a three-layer network model, this paper explores its spreading nature, and we further study the influence of spreading behavior from network structure characteristics, spreading rates, and other factors. Meanwhile, the immunization strategy of the intermediary layer is designed, and the immunization strategy is implemented in the intermediary layer by using the structural characteristics, which saves time, simplifies the complexity of the algorithm, and effectively suppresses the spread of the global networks.
2. Introduction to Basic Concepts
2.1. Multi-Layer Network Concepts
As networks have grown in size and complexity of application scenarios, network models have shifted towards coupled networks with interactions, multi-layered networks, or networks within networks. In the sociological literature, such networks are referred to as “multiplex networks” [
18] or “multirelational networks” [
19]. The mathematical definition of a multilayer network was given by Boccaletti [
12] in 2014. A multilayer network
with
layers is composed of a set of different network layers
and a set of inter-layer edges
, where
and
is a single layer of the multi-layer network,
is the set of the intra-layer edges, and
is the set of edges between any two layers for the network layer
and
. The set of nodes of the network layer
is denoted by
, and the intra-layer adjacency matrix of
is denoted by
, where
corresponds to the inter-layer adjacency matrix of
, where
2.2. SIS Disease Spread Mechanism
Depending on the state of the individual in the procedure of disease spreading, researchers have proposed classical SI-, SIS-, and SIR-spreading mechanisms. Currently, some diseases where the infection originates from animals are transmitted to humans through intermediaries, such as mosquitoes, cockroaches, and rats, and it is eventually cured or inhibited by an immunization antibody or drug treatment, which returns it to a susceptible state; the procedure is similar to the SIS-spreading mechanism. Therefore, this paper begins with a study of spreading behavior on multi-layered complex networks based on the SIS disease-spreading mechanism.
In the SIS disease-spreading mechanism, the states of nodes are divided into two types: the susceptible state
and the infected state
. The infected individuals infect the virus to the susceptible individuals with a certain infection rate
, and then it is cured with a certain recovery rate
; finally, it becomes the state
again. The
and
are denoted the density of individuals in state
and state
at time
, respectively. The behavior of disease spread in the SIS model can be described by the following set of differential equations:
Moreover, we set the rate of disease spread as
, the problem of solving the above differential equations can be transformed into the calculation of the following differential equations:
Using Equations (1)–(4), it can be obtained as follows:
There is a threshold for such equations. At moment , the steady state’s solution is , , when the network spreading tends to a steady state. When , the increase or decrease of depends on the size of , whose limit value is . As the increases, its steady state solution is .
2.3. Introduction to Immunization Strategy
The impact of real-life spreading phenomena is divided into a positive and negative element. For the spread of viruses, infectious diseases, and negative spread of social opinions and rumors, immunization strategies should be implemented in time to reduce the negative impact of spread. Strategies such as random immunization, targeted immunization, and acquaintance immunization, are often used to suppress the spreading procedure.
Random immunization is the random selection approach of some nodes to be immunized with equal probability. Targeted immunization is the selective method of a small number of core nodes on the network for immunization. The selected probability is various, which depends on the position of the nodes on the networks, and it is likely to be more effective if the more important nodes are found for immunization. The acquaintance immunization strategy first performs random immunization and then it randomly selects neighboring nodes from the selected nodes again for immunization. According to the immunization algorithm, acquaintance immunization can achieve better immunization performance without knowing the global node information of the networks.
The most-used immunization algorithms are target immunization and acquaintance immunization, and improved algorithms based on these immunization algorithms. Tian et al. [
20] proposed a rumor immunization strategy based on a multi-community system and demonstrated that the strategy is more effective in inhibiting the further spread of rumors in the middle and later stages of the spread. Ge et al. [
21] proposed an innovative acquaintance immunization strategy, named after AI-CWD, which considers influencing factors, such as edge weight and degree value, respectively. Liu et al. [
22] proposed a locally optimal virus immunization strategy based on a weighted scale-free network and verified the effectiveness of such immunization strategy. Liu et al. [
23] proposed a ternary group-edge immunization strategy and compared it with other immunization strategies. The comparison results demonstrate that the ternary group-edge immunization is more effective when the infection rate is larger, and its effectiveness is inferior to that of the edge immunization of degree-degree. The proposal of immunization strategy is an important way to inhibit the spread of infectious diseases, rumors, viruses etc. It is still a topic whether the immunization strategy can meet the requirements of real networks and it can be applied on real networks.
3. Construction of Three-Layer Complex Networks
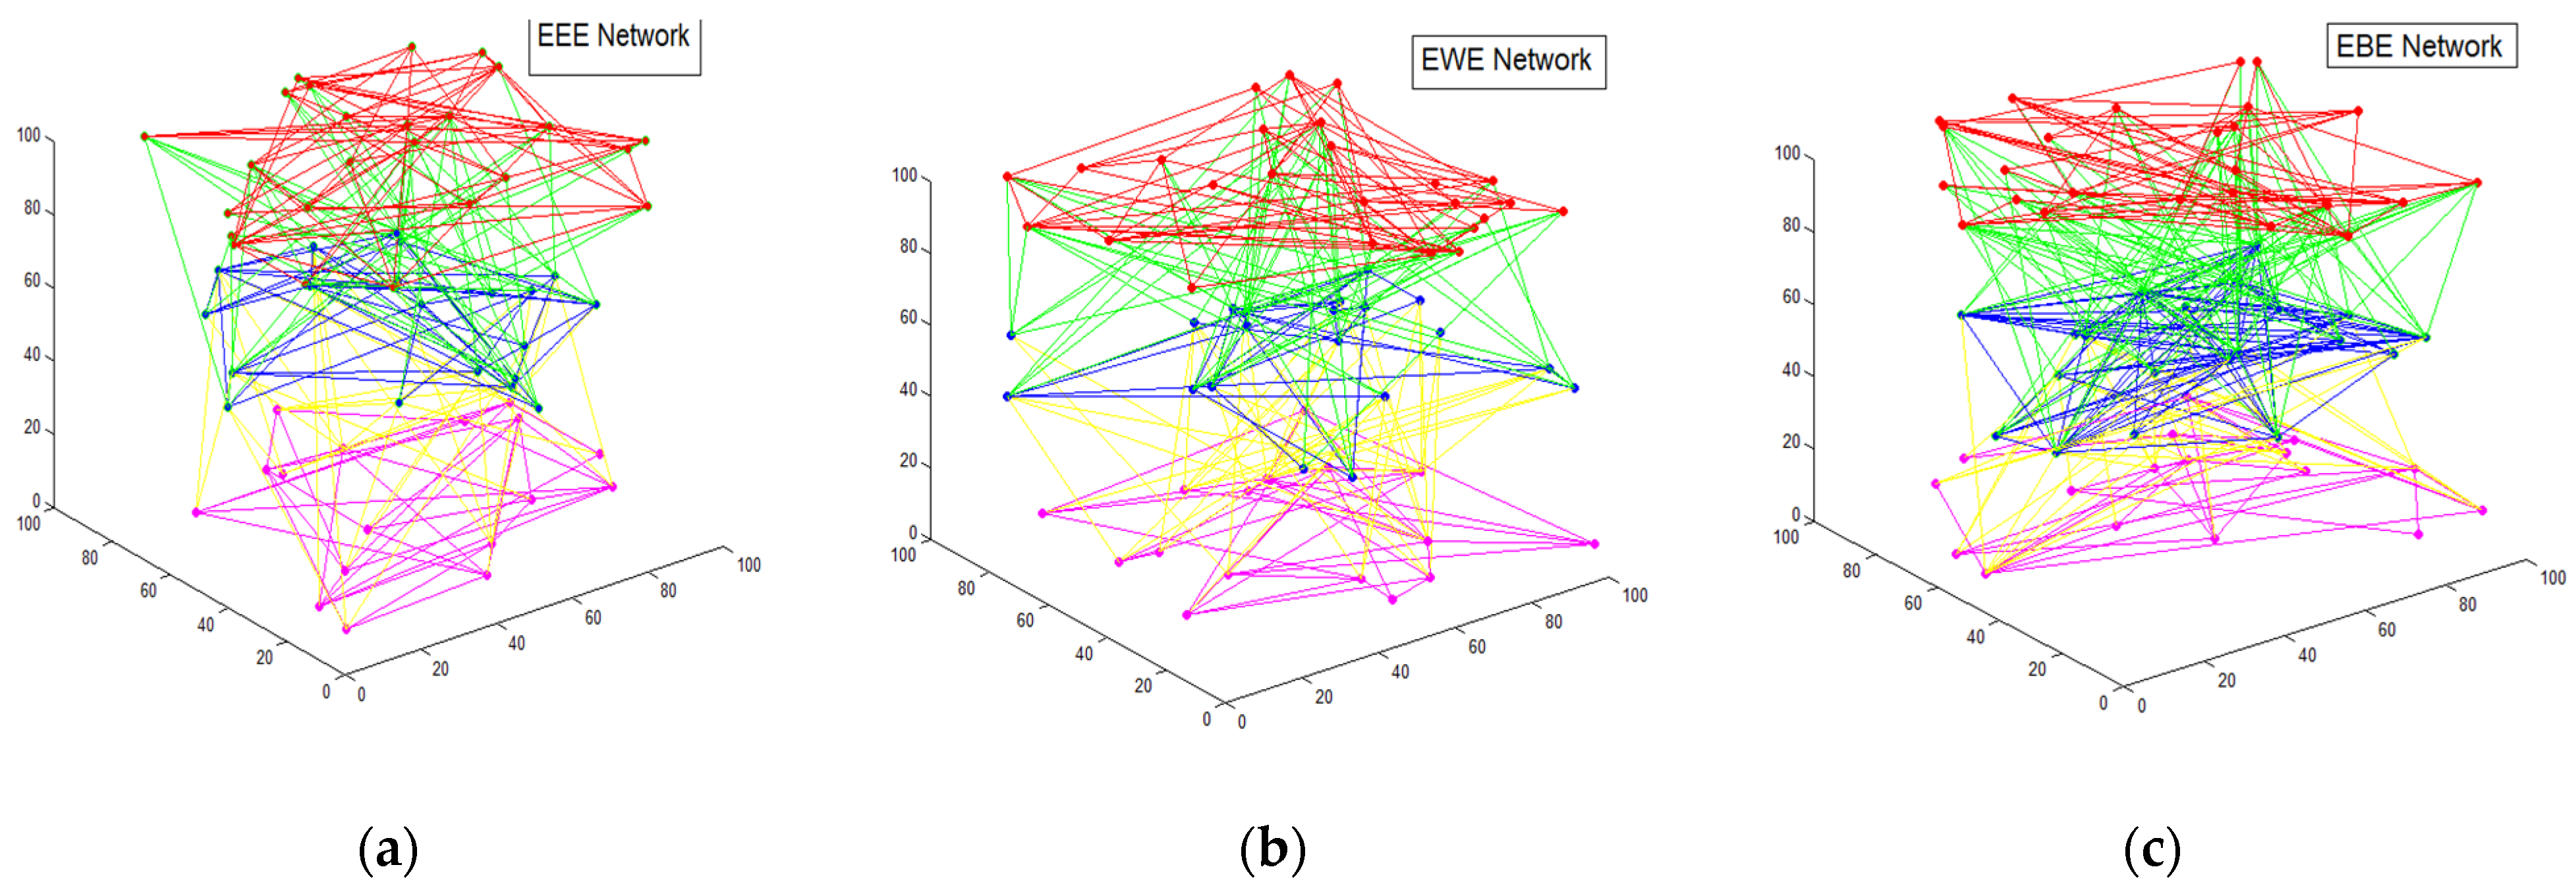
For the multi-path and multi-level problem of disease spread in real life, this paper proposes three special three-layer complex network models, such as three-layer EEE networks, three-layer EWE networks, and three-layer EBE networks. For the three-layer EEE network, the three single layers are respectively constructed by ER random links. For the three-layer EWE network, the first and third layers use ER random links, and the intermediary layer uses the WS small-world network modeling approach. For the three-layer EBE network, the first and third layers are also ER random networks modeling approach and the intermediary layer is a BA scale-free network modeling approach. In addition, all three networks use random links between layers, and the intra-layer and inter-layer link probabilities are all variables.
Table 1 shows the definitions of the relevant parameters for the three-layer complex network model.
The spreading mechanism in this paper applies the existing SIS disease-spreading mechanism; we apply this mechanism to the three-layer network constructed in this paper. Based on this model, we can better explore the spreading behavior of the three-layer network model. The three-layer network model in this paper focuses on the intermediary layer, and we also propose a construction algorithm of different three-layer network models, such as WEW, WEB, and BWE, which can greatly achieve the diversity of the three-layer networks. However, this paper only selects EEE, EWE, and EBE networks, and explores the related influences of spreading behavior in the three-layer network using different intermediary layers.
At present, the current immunization strategy cannot effectively suppress the spread of disease in multi-layer networks. The traditional immunization strategies cannot effectively suppress the spreading procedure for more complex multi-layer networks. This paper takes advantage of the proposed models and sets different immunization strategies of the intermediary layer, which effectively inhibits the spread based on the global networks and provides an experimental basis for inhibiting the across-layer disease spread in reality.
3.1. The Three-Layer EEE Network Modeling
The algorithm for the construction of the three-layer EEE network model is as follows.
Step 1: At the initial moment, there are nodes in the network layer , the intra-layer connectivity probability is and the adjacency matrix is . There are , nodes in the network layer ,; the intra-layer connectivity probability is ,; and the adjacency matrix is , . The inter-layer connectivity probability between and layers is , and the adjacency matrix is . The inter-layer connectivity probability between and layers is , the adjacency matrix is , the total number of nodes in the three-layer network is , and the global network adjacency matrix is .
Step 2: The ER random network construction method is used in the intra-layer. In the network layer , the connected edges between nodes and are traversed and each connected edge generates a random probability . If , then in the adjacency matrix , otherwise ; the traversal of the intra-layer nodes is completed. The network layers and are constructed in the same way for the network layer .
Step 3: The inter-layer link uses a random link method, traversing the nodes in the layer and the node in the layer , generating a random probability , if , then in the adjacency matrix , otherwise ; the nodes in the layer are traversed to finish. The inter-layer connectivity algorithm for the layers and is the same as described above. There is no directly connected edges between the network layers and .
The construction of the network model is completed according to the above three-layer EEE network construction method.
Figure 1a shows the schematic diagram of the three-layer EEE network model with the following parameter settings:
,
,
,
,
,
,
, and
.
3.2. The Three-Layer EWE Network Modeling
The construction algorithm of the three-layer EWE network model is as follows.
Step 1: The initial conditions of the network are the same as described in the algorithm above.
Step 2: The single network layers and are both randomly connected in the intra-layer, while the intermediary layer uses the construction algorithm of the WS small-world networks. First, it starts from the rule graph, a nearest-neighbor coupled network containing nodes is considered, where each node is connected to nodes of its left and right neighbors, and is an even number. And then, the randomized re-link is performed, it sets the re-link probability as , and each edge in the above regular graph is randomly reconnected with the probability , and there is no duplicate edge.
Step 3: The inter-layer is connected using a random link method, and there are no directly connected edges between the first and third layers of the network.
The network model is constructed according to the above three-layer EWE network construction method.
Figure 1b shows the three-layer EWE network model with the following parameters:
,
,
,
,
,
,
, and
.
3.3. Three-Layer EBE Network Modeling
The construction algorithm of the three-layer EBE network model is as follows.
Step 1: The initial conditions are as described above.
Step 2: The single network layers and are both randomly connected in the intra-layer. This intermediary layer uses a BA scale-free network construction algorithm that combines a growth and priority link mechanism with an initial network of nodes. After that, one node at a time is added and connected to old nodes, and , while the probability that a new node connects to an old node satisfies the relationship , here it the degree of node , and the algorithm ends when the total number of nodes in the network increases to .
Step 3: The inter-layer is connected using random link method, and there are no directly connected edges between the first and third layer of the network.
The network model is constructed according to the above three-layer EBE network construction method.
Figure 1c shows the three-layer EBE network model with the following parameters:
,
,
,
,
,
,
,
, and
.
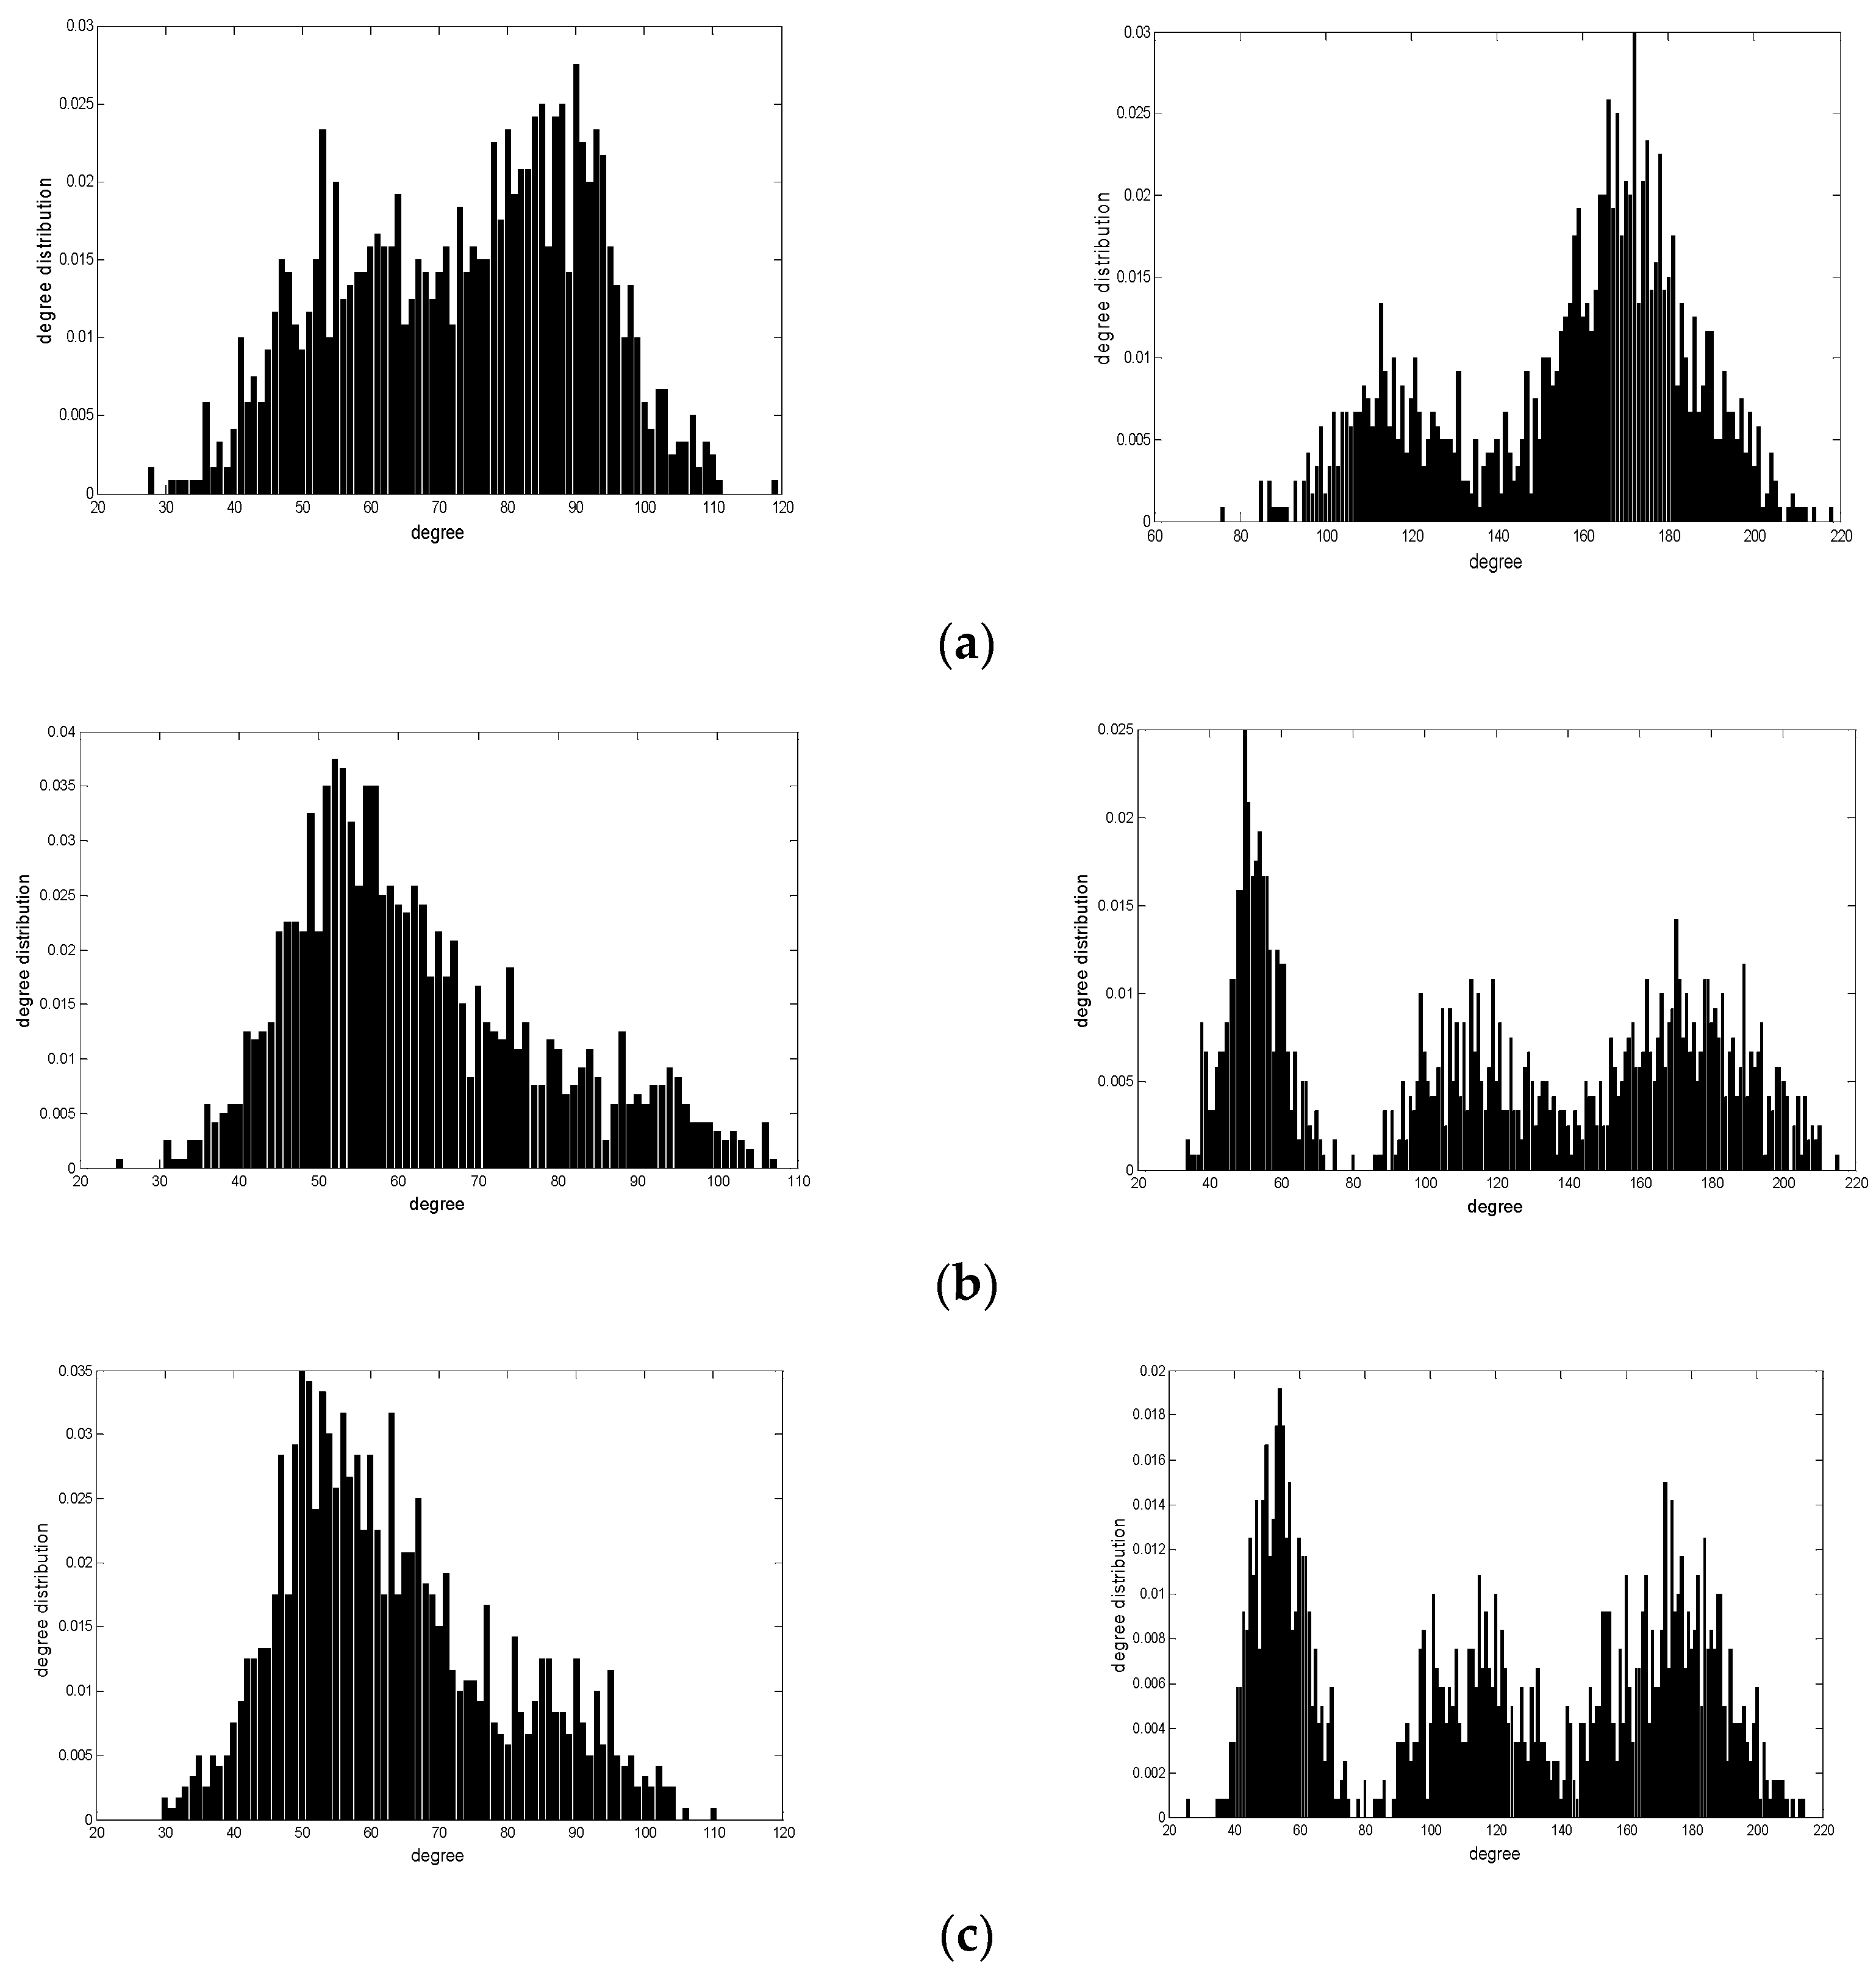
3.4. The Degree Distribution Attribute of Three-Layer Complex Networks
The degree distribution properties of the network are analyzed under three different three-layer complex network construction algorithms described above. The number of network nodes is set as follows:
,
, and
. The whole structural properties of the network are analyzed by varying the intra-layer and inter-layer link probabilities. Due to the large number of parameters involved in the experiments, only a few special degree distribution are listed below. The specific experimental parameters are shown in
Table 2, and
Figure 2 shows the degree distributions of the three-layer EEE, three-layer EWE, and three-layer EBE networks, respectively.
It seems that the three-layer networks have different degree distribution properties, such as the complexity of the three-layer complex network model construction algorithm, the difference in the size of the network nodes, the variation in the probability of connecting edges of intra-layer and inter-layer, and the different structural properties of each single layer. To summarize the above experimental results, the differences in the average degree values of the single layers on a three-layer network lead to multiple peaks in the degree distribution of the network, and the overall degree distribution of the three complex three-layer networks are all normally distributed uniform networks. However, it does not mean that the power-law property is masked. If the intermediary layer is denser and the other layers are relatively sparse and less randomly connected, the degree distribution of the three-layer networks may also tend to be distributed in power-law.
4. Modeling and Analysis of Three-Layer SIS Disease Spread Model
Multi-layer networks incorporate the interdependence and inter-constrained relationships between different types of network groups, and they are more coincident with real networks. There have been studies on disease spreading on multi-layer complex networks, but they are generally exemplified by two-layer networks, where the top and bottom layers are constructed as the same network, and there are certain specificities in this type of network model. In reality, many diseases are transmitted through intermediary layers, for example, HIV is from chimpanzees, H5N1 and H7N9 are from birds, dengue virus is from mosquitoes, SARS virus is from civets and the Black Death, and plagues are from rodents. None of these diseases originate from human societies, but it ultimately poses a great danger to human life. In order to better analyze the spread characteristics of diseases in multi-layer heterogeneous networks, this paper constructs a three-layer complex network model that conforms to the cross-layer spreading characteristics of realistic diseases, in which only the intermediary layer changes, the inter-layers are connected by random approach, the number of nodes in the three single layers is not unique, and two intra-layer link method are not same. Therefore, three different types of groups, such as animal society, mediated group, and human society, are modeled and analyzed based on the multi-layer network model to explore the trend of disease spread in the cross-layer networks. The three different types of groups adopt appropriate immunization strategies using the properties of the intermediary layer to suppress the damage caused by such cross-layer disease spread. Therefore, exploring the influence of the intermediary layer on the overall spreading procedure is the central focus in this paper.
Different parameters constructed by the three-layer network can lead to different spreading phenomena. In addition, the changes in the infection and recovery rates of the disease itself can also lead to changes of spreading procedure. Therefore, the analyses of the different effects of each parameter have an important implication for the spreading procedure and the adoption of the subsequent immunization strategies.
The modeling procedure of the three-layer SIS disease spreading model proposed in this paper is shown in
Figure 3 below.
Firstly, this paper constructs three kinds of three-layer complex network models and analyzes the network degree distribution of three-layer EEE network, EWE network and EBE network, which constructs a detailed foundation for exploring the impact of network structure on spreading behavior. Secondly, the disease-spreading layer behavior in the three-layer complex networks under SIS disease-spreading mechanism is deeply studied. Based on the SIS-spreading mechanism, the spreading threshold in the three-layer network structure is analyzed. The theoretical derivation results are verified by simulation. It is concluded that the spreading threshold is closely related to the network average degree. At the same time, the influence of network structure characteristics on the spreading procedure and the influence of disease spreading rate on the spreading procedure are also deeply explored. Finally, the special properties of the intermediary layer of the three-layer network are analyzed, and the corresponding immunization strategy is formulated to effectively inhibit the spreading behavior.
This paper is mainly based on the characteristics of the three-layer network structure to explore the cross-layer spreading behavior of diseases. Therefore, the innovation of this paper lies in the construction and visualization of three-layer network models with different intermediary layers. This algorithm greatly inherits the diversity of the multi-layer networks, which provide a good model reference for exploring the more complex and highly correlated networks. Secondly, this paper deduces the spreading threshold of the three-layer network through the spreading threshold theory of two-layer network and verifies the correctness of the theoretical results. Finally, the special properties of the intermediary layer in the three-layer network are used, and corresponding immunization strategies are formulated to effectively inhibit the spreading behavior.
The three-layer network structure constructed in this paper is widely used. For example, cross-media spread of information, computer network virus spread, financial behavior spread, and so on. We construct a practical three-layer network model and formulate corresponding immunization strategy at the intermediary layer. It can save more time and effectively suppress or promote the spreading behavior based on the three-layer networks.
Based on Equations (1)–(3), this paper defines the number of S-state nodes in each individual layer at time t in the three-layer network. Based on that, the univariate cubic equation is constructed. The global spreading threshold of the three-layer network is obtained by solving the eigenvalues of the univariate cubic equation. Furthermore, the correctness of the theoretical results is verified by simulations.
For the network construction algorithm, the time complexity is related to the number of nodes (n) and link probability. Through the running time of the program, it is obtained that the larger the n and link probability, the slower the code-running procedure. In general, the time complexity of building a three-layer network is O(n). For the immunization strategy and spreading behavior, the program runs stably with a time complexity of O(n). Therefore, the overall algorithm time complexity is O(n2).
In order to explain the contents in
Figure 3 in detail and understand the spreading behavior oriented to three layer complex networks, we give the pseudocode of disease spreading oriented to three-layer complex networks, which is shown in Algorithm 1 as follows.
| Algorithm 1 Disease spreading behavior oriented to three-layer complex networks |
Input:
p: the intra-layer link probability
a1: the adjacency matrix of the first layer network
a2: the adjacency matrix of the second layer network
a3: the adjacency matrix of the first and second layers
a4: the adjacency matrix of the third layer network
a5: the adjacency matrix of the second and third layers |
Output:
spreading threshold and speed etc. |
Contents
1. Generate the adjacency matrix of the first layer network
a1(i,j) = 1;
a1(j,i) = 1;
2. Generate the adjacency matrix of the second layer network
a2(i,j) = 1;
a2(j,i) = 1;
3. Connect the edges between the first and second layers
if I == j
a3(i,j) = 0;
else
if pab > p
a3(i,j) = 1;
end
end
4. Generate the adjacency matrix of the third layer network
a4(i,j) = 1;
a4(j,i) = 1;
5. Connect the edges between the second and third layers
if I == j
a5(i,j) = 0;
else
if pbc > p
a5(i,j) = 1;
end
end
6. Based on SIS model, the cross-layer spreading behavior of diseases is studied. |
4.1. Theoretical Analysis of Disease Spreading Threshold in Three-Layer Network
In the SIS-spreading mechanism, nodes are either in the state S or state I, and inter-layer edges indicate that disease can be spread through these links. At the same time, the susceptible nodes may be infected by the infected state nodes with a certain probability in the same layer or another layer. Meanwhile, the infected node may turn into a healthy state with a certain recovery probability. In the three-layer complex network, two adjacent layers are randomly connected to each other, and the proportion of nodes infected in the three single layers is represented by
,
, and
, respectively. The parameters involved in the whole procedure of network spread are provided in
Table 3.
The process of SIS disease spread in this three-layer network can be defined by Equation (6) as follows.
Here, denotes the number of nodes that are restored to the state S at the time , denotes the probability that a susceptible node is infected by an infected node in the same layer, where the infection rate is proportional to the average degree , and denotes the number of nodes in the layer that are infected by the nodes in the layer.
Let
, the system transforms to a stationary state soon, and the Equation (7) can be calculated in order to obtain a non-trivial stable solution
Combining the above equations, it can be seen that if an infectious disease starts to spread within any one layer, it will generate the global disease-spreading activity in the three-layer complex networks, in which there is a spreading threshold dividing the entire network into a healthy state and a spreading state. When
and
, the spreading procedure will enter a healthy balance state, and
,
. Conversely, when both
and
exceed the spreading threshold
, the network will globally spread the disease through the links in the intermediary layer, and the density of the infected nodes in the network will increase, even if it increase up to 1. By ignoring the
in Equation (7), Equation (8) can be obtained as follows.
By rectifying the above equations, we can get Equation (9).
And
,
, then Equation (9) can be simplified as
.
If the matrix has the maximum eigenvalue , it is clear that the global spread of the network will not occur, but when , the global spread phenomenon will occur in the three-layer networks, and then the spreading threshold of the network is , which also means that and are infinitely close to . Hence, we can obtain the global spreading threshold for the three-layer networks as in Equation (10), where the threshold can be replaced by and . The eigenvalues of the univariate cubic equation can be obtained by solving the univariate cubic equation, and the minimum value is the global spreading threshold of the three-layer networks.
Let
, then the global spreading threshold of the three-layer networks can be calculated by Equation (10).
The minimum value of this equation can be calculated in reference to Shengjin’s Theorems, and
The global spreading threshold of the three-layer complex networks is calculated as follows.
and
,
Without considering inter-layer spread, we only analyze the disease-spreading thresholds in intra-layer. For the three single layers
, the disease spreading form is described as follows.
Similarly, if we ignore the
,
, and
terms in Equation (12), we get
The final spreading threshold for the single layer network is obtained as , , .
When
, we get
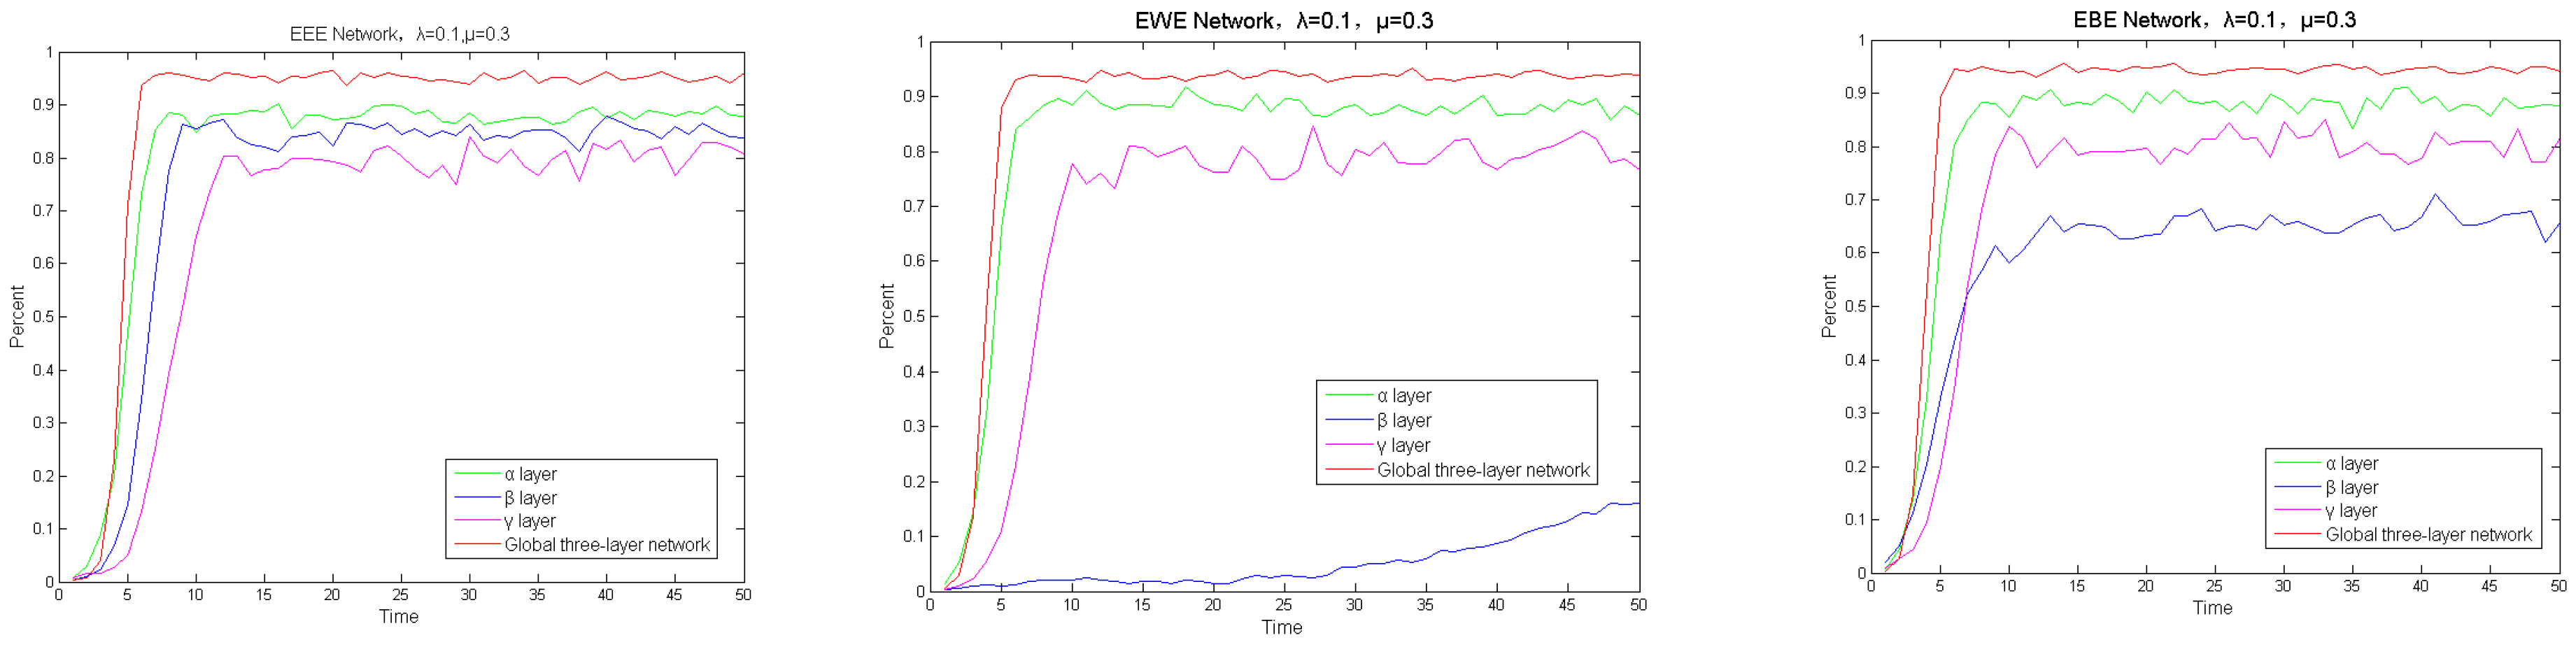
. In summary, we obtain that the spreading threshold of the single-layer network is greater than that of the global network in three-layer networks, and the spreading threshold of the network is related to the average degree value of the network; the larger the average degree value, the faster the spreading speed. To prove the theoretical derivation, experiments are carried out on the three-layer EEE network, three-layer EWE network, and three-layer EBE network, respectively. The results are shown in
Figure 4, where the global network is the first to start spreading, followed by the single layer network, and the highest number of infections in the network is observed when the global spreading reaches a steady state. The spreading speed of the layer
is greater than that of the layer
, and the spreading speed of layer
is faster than that of layer
in the three-layer EEE network; the main reason is that all three layers are ER random networks, and the layer
of the network has the largest average degree, therefore, the faster the spreading speed, the smaller the spreading threshold.
In the three-layer EWE network, the spreading speed of the layer is significantly lower than the other two layers of the network, the main reason is that the layer is constructed using the WS small-world network method, and the network links are sparse and the average degree is smaller, so the spreading speed is the slowest.
Similarly, In the EBE network, the layer uses the BA scale-free network construction method, and the network degree distribution is extremely uneven; coupling with taking a smaller parameter value, consequently, the network is more sparse and the spreading speed is much slower.
In the EEE network, the spreading speed of the layer
is greater than that of the layer
, and the spreading speed of the layer
is greater than that of the layer
; the main reason is that the three-layer network uses the ER random network, the average degree of the network is the largest, and thus, the spreading speed is much faster and the spreading threshold is also much smaller.
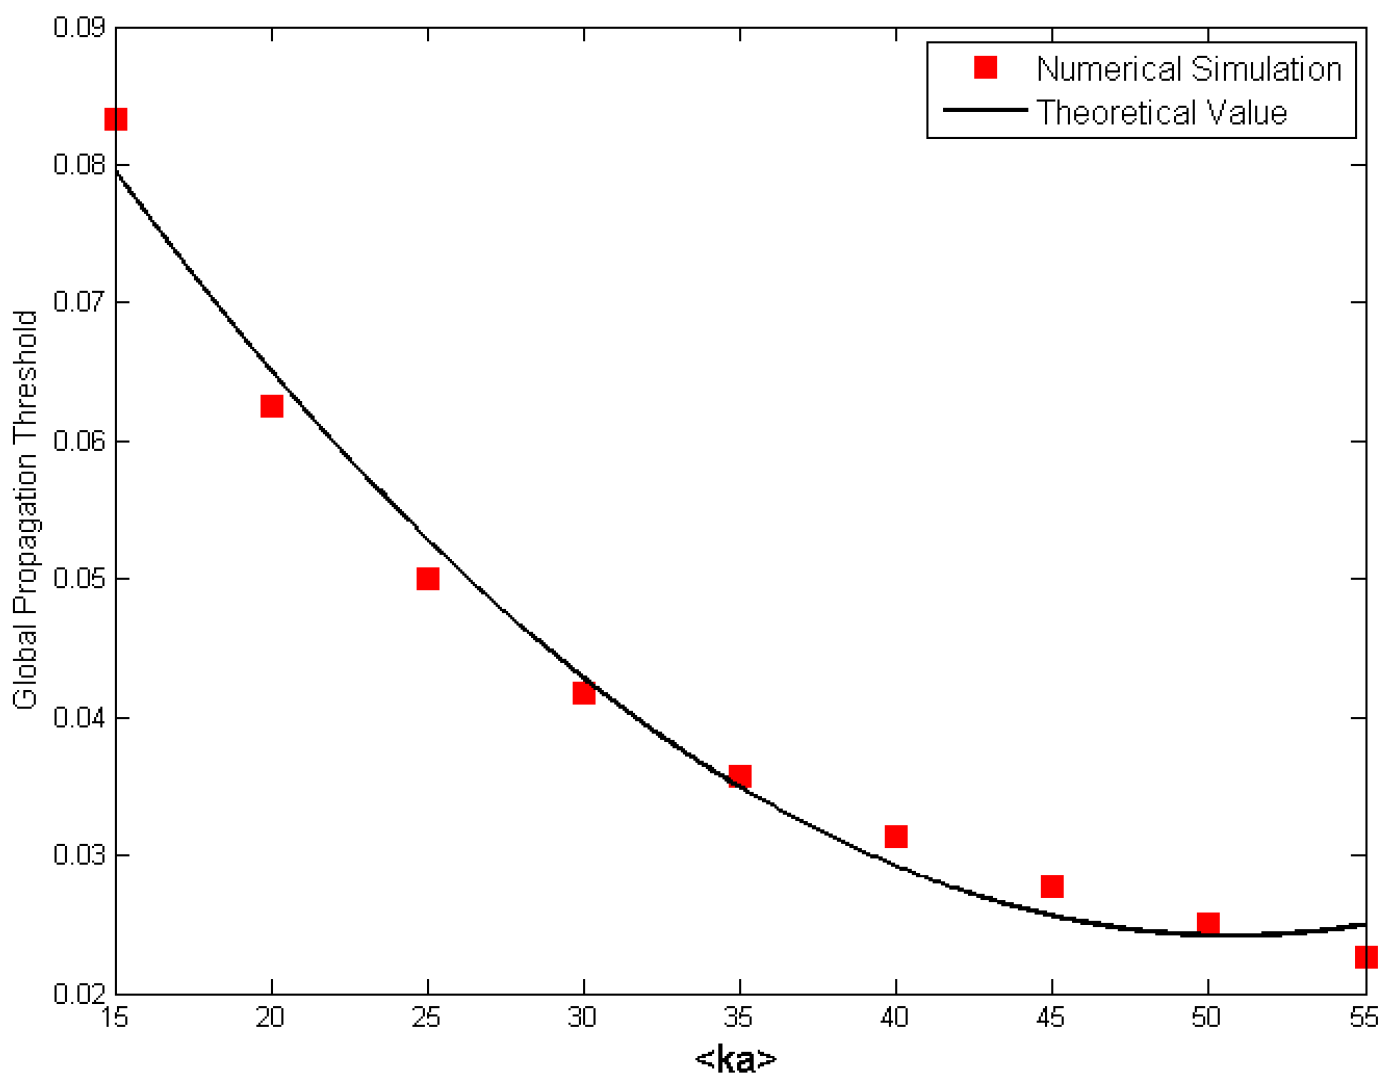
Figure 5 demonstrates that the overall spreading threshold of the network is in good agreement with the theoretical derivation. This shows that the spreading threshold is closely related to the average degree in a uniform network.
The parameter settings in
Figure 4 are shown as follows:
For the three-layer network EEE, , , , , .
For the three-layer network EWE, , , , , , .
For three-layer network EBE, , , , , , .
4.2. Influence Analysis of the Three-Layer Network Structure on Spread
First, the influences of different types of networks on spread behaviour is explored based on the different peak characteristics of the three-layers complex networks. As shown in
Section 3.4, it can generate multi-peak phenomenon for the networks due to the difference of the average degrees of the single layer networks, and the effect of the average degree of the network on the spreading situation is then explored. For the three-layer EEE network,
,
,
,
, and
. For the three-layer EWE network,
,
, and
. For the three-layer EBE network,
,
, and
. With the above parameter settings, the overall average degree of all three networks is 69. The spreading threshold and spreading speed of the three different types of three-layer complex networks are the same as shown in
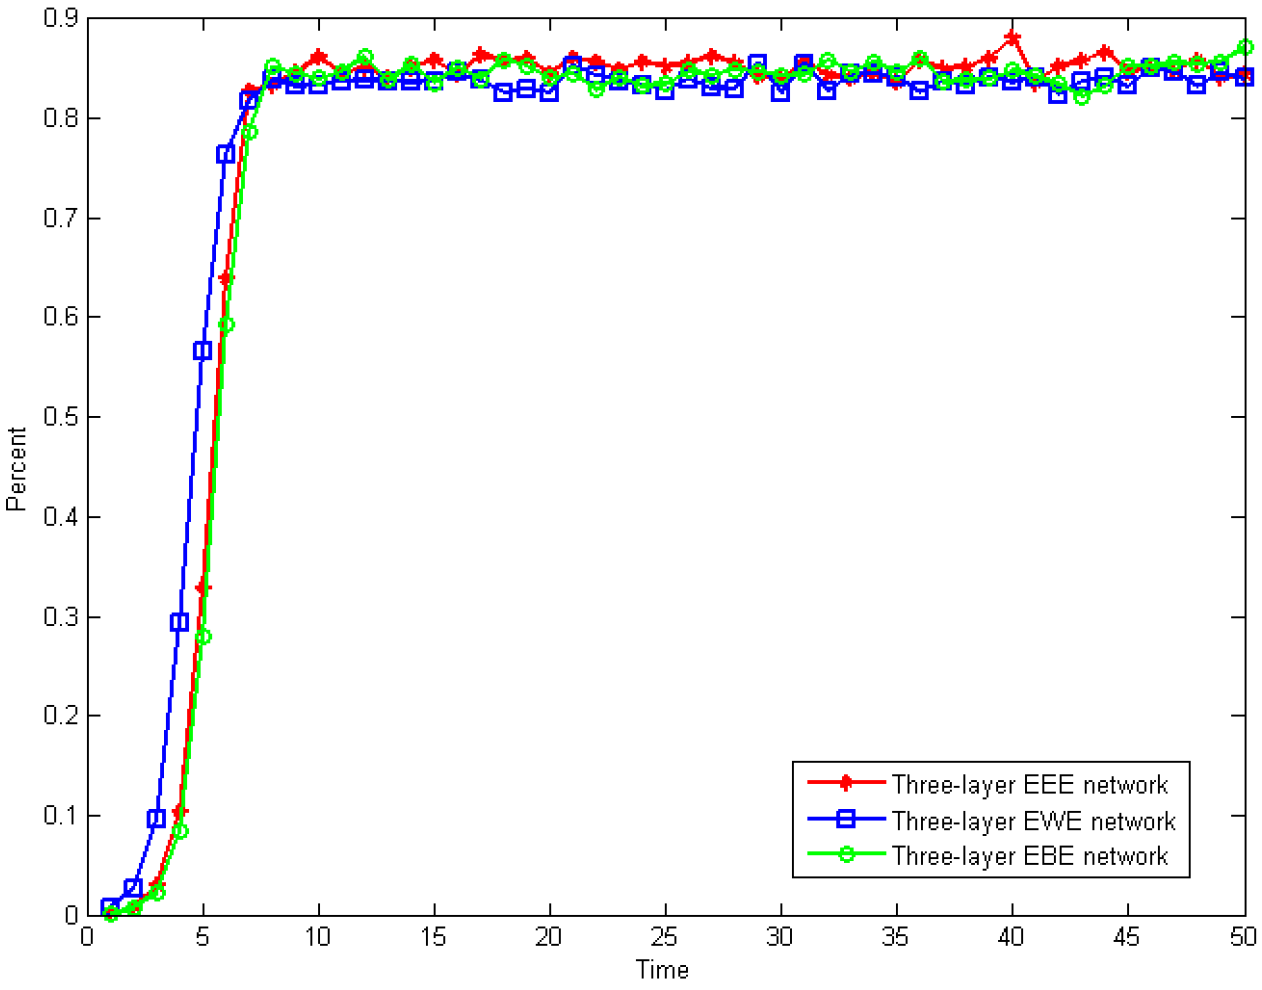
Figure 6. It has been verified through many experiments that the spreading procedure of the whole network is consistent under the condition of the same average degree of the network, which does not matter with regards to the structure type or parameter changes of the network, therefore, the average degree of the whole network is the main factor affecting the whole spreading procedure, in other words, the larger the average degree, the wider the spreading range and the faster the spreading speed. The different peak properties are determined by the differences in the average degree of the single layers of the network, so there is no obvious regulation between the average degree and the peak of the network. Therefore, the factor affecting the network-spreading behaviour is the size of the average degree of the network in a uniform network; it is not relevant with the network type.
Second, the effect of the construction parameters of the network on the spreading procedure is explored for the different three-layer complex network construction algorithms. For comparison, the network size is unchanged, they are , , , and the infection rate and recovery rate are permanent.
In the three-layer EEE network, two sets of experiments are set up to investigate the effect of the changes of the intra-layer connectivity probability on the spreading procedure.
- (1)
When the probability of the intra-layer link in the three-layer EEE network gradually increases and the probability of the inter-layer link remains unchanged, the other parameters are set as follows:
and
. When the probabilities of the intra-layer links are 0.05, 0.1, 0.3, 0.4, and 0.5 for
, the spreading procedure is shown in
Figure 7a; with the increase of the intra-layer link probability, the spreading speed is gradually accelerated and the density of the infected people gradually increases. When the probability of the intra-layer link increases to 0.3, the overall spreading speed of the network reaches the maximum value and the density of the infected nodes also reaches the maximum state.
- (2)
The probability of the inter-layer link of the three-layer EEE network increases gradually, and the probability of the intra-layer link remains unchanged. We set the probability of the intra-layer link of the network as
, and the probability of the inter-layer link as
, respectively. The network spreading is shown in
Figure 7b. With the probability increase of the inter-layer link of the network, the spreading speed is gradually accelerated, and the number of infected nodes is also increased. When the inter-layer link probability increases to 0.3, the number of infected nodes in the network reaches the maximum value, but the spreading speed deviates slightly.
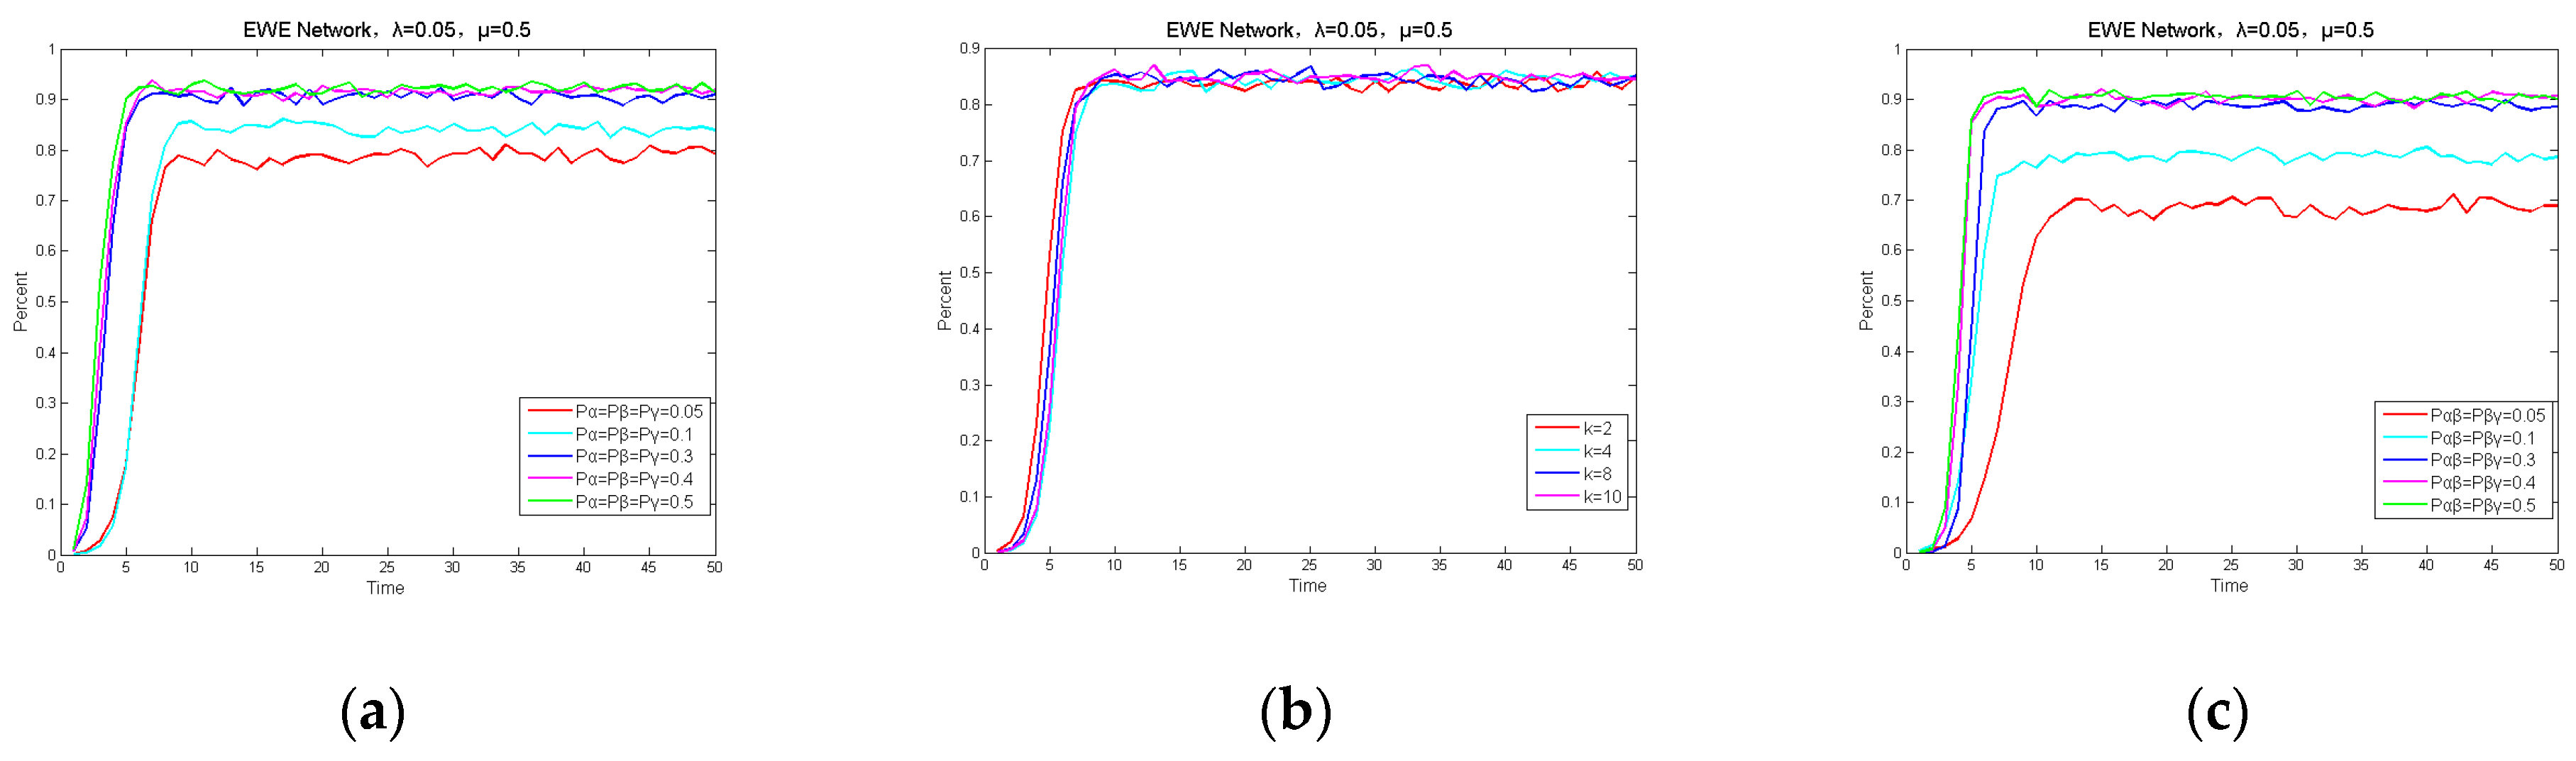
In the three-layer EWE network, we investigate the effect of the intra-layer and inter-layer connectivity probability on spreading procedure, the k values of the number of neighboring nodes in the network are also experimentally compared. Three sets of experiments are set up to investigate the effect of the changes of the network parameters, which are slightly accelerated, but the node density is the same when reaching the steady state, and there is no significant change. With the increase of , the network-spreading speed does not accelerate the significant spreading procedure.
- (1)
When the probability of intra-layer link gradually increases and the probability of the inter-layer link remains unchanged, the other parameters are set as follow:
,
,
. When the probability of the intra-layer re-link is
, the spreading procedure of the network is shown in
Figure 8a. With the increase of the probability of the intra-layer link, the spreading speed is gradually accelerated, and the density of the infected people in the network is also gradually increased. When the intra-layer link probability increases to 0.3, the overall propagation speed of the network reaches the maximum value, the density of the infected nodes is also in the maximum state.
- (2)
When the number of the neighboring nodes
increases, the spreading procedure is shown in
Figure 8b, and the results show that the value of
does not have an effect on the spread.
- (3)
When the probability of the inter-layer link increases, i.e.,
, the network-spreading procedure is shown in
Figure 8c. As the probability increases of the inter-layer link, the spreading speed is gradually accelerated and the number of infected nodes is increased. When the probability of the inter-layer link increases to 0.3, the number of infected nodes in the network reaches the maximum value.
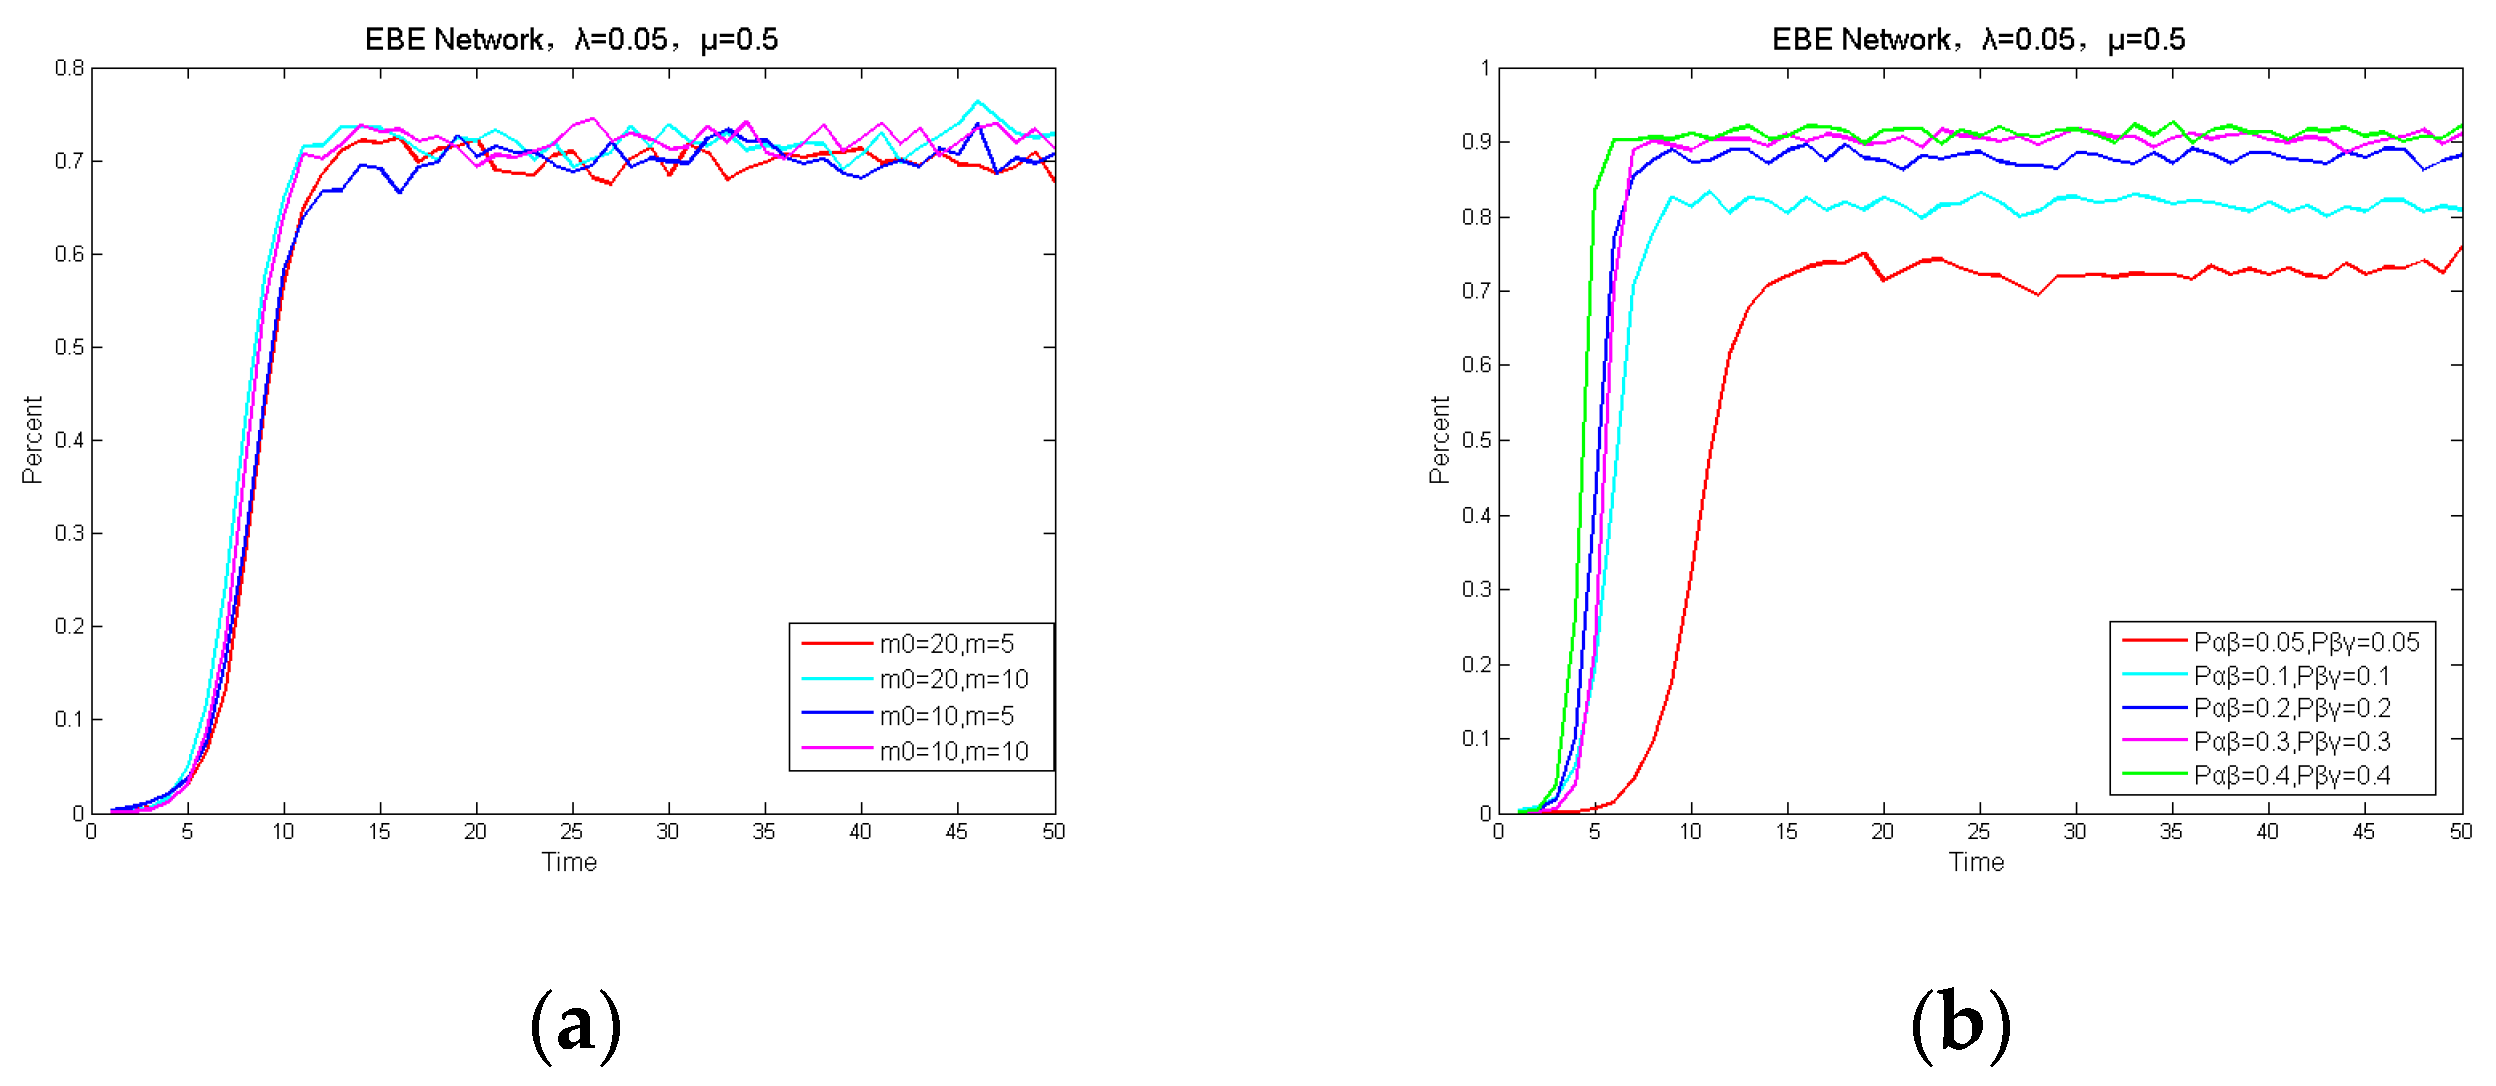
In the three-layer EBE network, two sets of experiments are conducted to investigate the effect of the inter-layer link probability and the parameters and on the spreading situation in the BA scale-free network.
- (1)
To investigate the effect of the parameters
and
on the spreading procedure, the parameters
and
are set to
and
, and the spreading result is shown in
Figure 9a. As the value
increase, the whole spreads smoothly, and there is no change in density at steady state.
- (2)
When the probability of the inter-layer link of the network increases, the experimental results are shown in
Figure 9b for
. With the increase of the probability of the inter-layer link, the spreading speed is accelerated, and the spreading speed reaches the maximum value when the probability of the inter-layer link reaches 0.3, and the density is also maximum at steady state.
4.3. Influence of Diffusion on Spreading Procedure
In the SIS disease-spreading model, the disease diffusion rate depends on the biological characteristics of the pathogen, such as spreading rate changes and recovery rate changes. The disease diffusion rate is defined as
, and the effect of the disease diffusion rate on the global spread of the network is tested by keeping the other network parameters constant. The effect of disease-spreading rate on spreading procedure in the three-layer EEE network, three-layer EWE network, and three-layer EBE network is shown in
Figure 10,
Figure 11 and
Figure 12, in which it can be concluded that the spreading speed of the network gradually decreases as the diffusion rate decreases in these three types of networks, and the number of infected people gradually decreases and the number of the susceptible people gradually increases. Conversely, the spreading rate increases as the diffusion rate gradually increases, the proportion of the infected people progressively increases, and the number of susceptible people progressively decreases. In contrast to real-life disease spread, this experiment and its results reveal the dynamics of disease spreading in multi-layer networks from a macro-perspective and provide a theoretical reference for policy makers to effectively curb the spread of the disease.
5. Immunization Strategy of Intermediary Layer
In the three-layer complex networks, the intermediary layer connects the upper and lower layers, and the probability of the inter-layers link controls the average degree value of the network, which makes the network characteristics appear as multi-peak phenomenon, and the average degree value directly affects the disease-spreading behavior. Therefore, the intermediary layer plays an important role in the global spreading procedure. Through the intermediary layer’s mediating role, the disease can spread across different types of networks, which greatly extends the range of spread and causes serious hazards for different groups. It is an important idea that we set the immunization strategies in multi-layer networks to suppress such cross-layer disease spreading from the intermediary layer.
In reality, there are many ways to suppress the disease spread, and the most effective way is to isolate the infection source in time and avoid contact with the infected individuals. Based on such theory, the corresponding disease immunization strategy is formulated in conjunction with an analysis of the structural properties of the three-layer networks and the factors influencing the disease spread. For the three-layer network EEE, three-layer network EWE, and three-layer network EBE, the disease spread is firstly suppressed by reducing the probability of cross-layer links between the intermediary layer and the other layer. Secondly, the spread of disease can also be suppressed by reducing the link tightness in the intermediary layer, and it also can be suppressed by appropriately reducing the number of individuals in the intermediary layer.
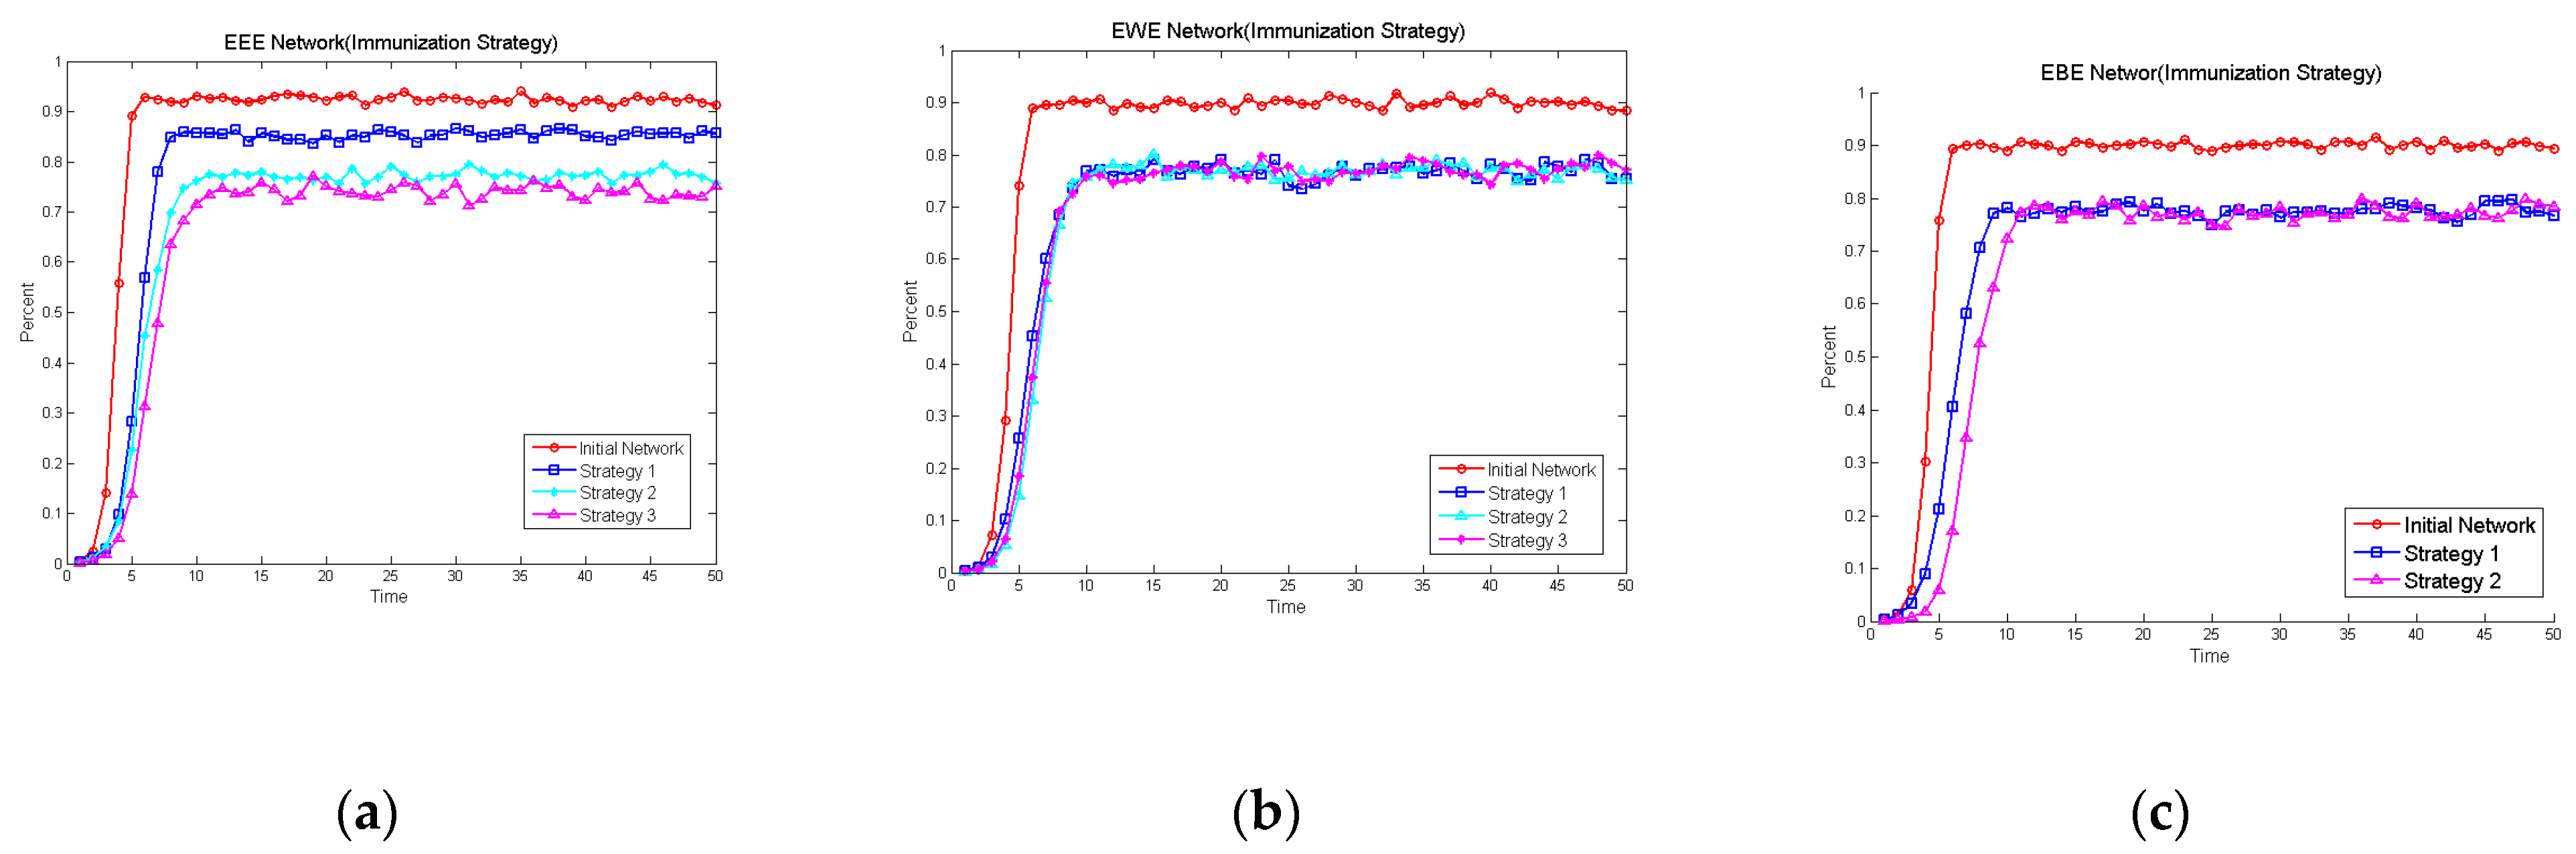
For the different networks, the corresponding immunization strategies are designed. The three kinds of immunization strategies are designed on the three-layer network EEE, in which each new one is changed based on the previous strategy parameters, and such design is more obvious to create an experimental comparison and is more useful for the results analysis.
The initial network parameters are set as , , , , and .
Strategy 1: reducing the link probability of the intermediary layer, and setting the inter-layer link probability to .
Strategy 2: continuing to reduce the intra-layer link probability of the intermediary layer based on strategy 1, and .
Strategy 3: reducing the number of nodes in the intermediary layer based on the above experiments, and .
Figure 13a shows the experimental results of the three strategies, which show that all three strategies can effectively suppress the spread of the disease; meanwhile, it can reduce the spreading speed and the density of the infected individuals.
On the three-layer network EWE, three immunization strategies are also formulated. Since the analysis in
Section 4.2 above shows that the number
of neighboring nodes has little impact on the spread, such factor is not considered. On the three-layer network EWE, the immunization strategies are consistent with the network EEE. The experimental results are shown in
Figure 13b; the spreading speed of the network is significantly reduced after adopting strategy 1, and the spread is not significantly suppressed by reducing the intra-layer link probability and reducing the number of nodes in the intermediary layer. Therefore, it is the inter-layer link probability that affects the spreading procedure.
The two immunization strategies are formulated on the three-layer network EBE, and the inter-layer link probability is first reduced and then the number of nodes in the intermediary layer are reduced. The experimental results are shown in
Figure 13c. After adopting immunization strategy 1, the spreading speed is significantly reduced and the number of infected nodes is also significantly reduced. After adopting strategy 2, the spreading speed is significantly slowed down, but the density of the infected nodes does not change when it reaches the steady state. In addition, this paper takes into account the seed nodes; in other words, the influence of the attribute of the spreading source node on disease spread on the three-layer network EBE, and the spreading change when the node with larger degree and betweenness is the node of spreading source, are considered. As the intermediary layer network possesses the scale-free characteristic, this kind of strategy does not have a significant influence on the global spreading behavior based on the global structure analysis. The immunization strategy also works well when the overall network degree distribution shows the power-law properties.
According to the characteristics of different network models, the corresponding immunization strategies are designed through simulation experiments. The experimental results show that the spreading procedure of the global network can be well suppressed by adopting strategy 1, which reduces the inter-layer link probability for the intermediary layer. In a three-layer network where the intermediary layer is ER, the link probability between intra-layer nodes is reduced by adopting strategy 2, which can effectively suppress the disease spread and the infection scope. However, due to the small-world characteristics of the intermediary layer of the WS network, the spreading phenomenon is not significantly suppressed after adopting this strategy; the main reason it that the intermediary layer is the WS network in the three-layer network. The intermediary layer is the BA network. the strategy has no obvious effect on the global spreading behavior if the global network is a scale-free network. The strategy can play a good role when the degree of distribution of the network exhibits power-law characteristics. By adopting strategy 3, it can effectively suppress the global spread of the disease when the intermediary layer is an ER network, but it has no significant effect when the intermediary layer is a WS network. The network is not considered where the intermediary layer is a BA network, because the number of nodes has little effect on the scale-free network.
6. Conclusions
Based on the three-layer complex network, we explore the cross-layers spreading dynamics behavior of the disease. The experimental results demonstrate that the most important factor affecting spread is the average degree of the whole network when the three-layer network is the uniform network. When the global spreading threshold is less than that of the single layer, the inter-layer or intra-layer link probability has a greater influence on spreading behavior. At the same time, the intermediary layer immunization strategy is tightly dependent on the isolation effect and can effectively suppress the disease spread.
Further research on the multi-layer network spreading dynamics behavior needs to be extended in terms of the complexity of the network topology, the diversity of disease-spreading behavior, and other detailed requirements. The different construction algorithms of multi-layer networks can lead to the different properties of the network. The spreading behavior can be explored by the non-uniform nature of the network, the changes in weights, the society structure, and other aspects. Moreover, the different types of diseases can also lead to multiple spreading states on the network, and its spreading behavior has the same patterns. On the special network, the different external environmental factors can influence the spreading procedure, such as the timeliness, population migration, age structure, disease variability, non-detectability factors, and so on. Finally, the suppression of the negative spreading behavior is always the ultimate goal of spreading research for setting the immunization strategies, and it is still the major research direction of how to control the spreading procedure more efficiently and timeously. In addition, whether there is an immunization strategy that can be used in complex situations is also an issue to be considered in the future.


 ,
, 


