Article

Mechanical Properties of Metasandstone under Uniaxial Graded Cyclic Loading and Unloading

School of Resources and Safety Engineering, Central South University, Changsha 410083, China
*
Author to whom correspondence should be addressed.
Appl. Sci. 2022, 12(13), 6310; https://doi.org/10.3390/app12136310
Submission received: 12 May 2022 / Revised: 15 June 2022 / Accepted: 16 June 2022 / Published: 21 June 2022

Abstract

:
The acoustic emission and wave velocity characteristics of metasandstone under graded cyclic loading and unloading were revealed by conducting graded cyclic loading and unloading tests. The results show that the acoustic emission signals of metasandstone samples are mainly generated in the loading phase, and almost no acoustic emission activity is generated in the unloading phase. The quiet period feature can be used to monitor and predict the destabilization of metasandstone. There is a stress threshold for wave velocity variation in metasandstone, below which wave velocity does not change significantly with increasing stress. When the stress exceeds this threshold, the wave velocity of the rock sample will decrease rapidly with the increase in stress. The phenomenon of a rapid decrease in wave velocity can be used to predict the damage instability of rock masses in engineering.

1. Introduction

A large number of engineering practices show that the rock surrounding tunnels is in a cyclic unloading environment in the construction of most underground caverns, especially in mountain tunnel projects [1]. In this environment, the external damage characteristics of rock and the development of internal fractures are closely related to the stress unloading history [2]. Therefore, it is of great theoretical importance and engineering value to study the deformation damage characteristics of rocks under cyclic unloading conditions.
The macroscopic damage of rock is caused by the propagation of original internal cracks and the initiation, development, and propagation of new cracks. In this process, local stress concentration occurs inside the rock, causing sudden damage to part of the rock medium. From an energetic point of view, this is a process of elastic energy release inside the rock, and the process generates transient elastic waves, consistent with the phenomenon of rock acoustic emission. Therefore, it is possible to speculate about the damage condition inside the rock based on the characteristics of the acoustic emission signal changes inside the rock. From the perspective of wave velocity propagation, the presence of internal fractures in the rock causes reflection, scattering, and bypassing of the sound waves in the structural surface of the fracture, which significantly reduces the wave velocity. In addition, the larger the number and size of fractures, the more obvious the reduction in wave velocity. By analyzing and comparing the difference in the wave velocity of ultrasonic waves in rocks, we can roughly deduce the strength of rocks and judge the condition of internal damage defects.
In terms of acoustic emission characteristics of rocks during uniaxial cyclic loading and unloading, C. Li showed that not all types of rocks are subject to the Kaiser effect [3]. L. Wu studied the thermal infrared radiation energy characteristics of granite under cyclic loading and unloading conditions [4]. M. Zhang pointed out that increasing the loading and unloading rate will reduce the total acoustic emission ring of red sandstone samples, and the total acoustic emission count of rock samples has a negative linear relationship with the loading and unloading rate [5]. H. Wang proposed that the loading/unloading response ratio (LURR) can be used to evaluate the damage of coal and rock under cyclic load [6]. T. Wang studied the variation characteristics of acoustic emission energy rate of red sandstone under cyclic loading and unloading. The results show that the acoustic emission energy rate of red sandstone increases significantly in the early and late stage of uniaxial compression [7]. J. Guo studied the acoustic emission signal characteristics of igneous rocks with different water content under cyclic loading and unloading [8]. K. Wang studied the acoustic emission parameters and resistivity characteristics of sandstone with different saturation under constant amplitude cyclic load [9]. J. Wu studied the acoustic emission signal characteristics of concrete cube specimens having different sizes under cyclic loading and unloading [10]. D. Liang used the numerical simulation software RFPA to simulate the acoustic emission and fracture process of rock [11]. F. Gong pointed out that the uniaxial compression energy storage coefficient of rock can be calculated through multiple cyclic loading and unloading tests [12]. Feng Pei compared and analyzed the difference in acoustic emission signals of metamorphic gabbro and granite with different rockburst tendency under cyclic loading and unloading [13]. G. Zhao pointed out that the acoustic emission activity of mudstone under cyclic load is the most active before the peak stress, and the peak value of acoustic emission event is consistent with the peak energy [14]. Q. Meng proposed the exact stress point of the Kaiser effect of the acoustic emission signal of red sandstone, marble, and granite under cyclic loading and unloading [15]. J. Li studied the acoustic emission evolution characteristics of saturated limestone under different loading and unloading rates and paths [16].
In the study of wave velocity characteristics of rock, Charalampos saroglou studied the influence of the granite fracture degree on P-wave and S-wave velocity [17]. Q. Ding studied the relationship between P-wave velocity and mechanical properties of sandstone treated by a high temperature and freeze–thaw cycle [18]. L. Yang studied the evolution law of acoustic spectrum parameters of granite in the process of uniaxial compression loading failure, and found that, when the shear wave shifts from the broadband multimodal state to the low-frequency unimodal state, it means that the rock sample is about to be destroyed [19]. H. Li effectively predicted the failure of salt rock during the uniaxial compression test using the ultrasonic velocity ratio [20]. P. Xiao pointed out that, after high temperature treatment, the longitudinal wave velocity of granite specimen decreases with the increase in treatment temperature [21]. X. Liu studied the propagation law of the ultrasonic signal in coal materials under different loading conditions [22].
At present, there is a lack of research on the acoustic emission and wave velocity characteristics of metasandstone under cyclic loading and unloading conditions. This has seriously affected the application of acoustic emission and ultrasonic testing technology in the monitoring and disaster warning of metasandstone tunneling projects. Furthermore, in the existing research on the wave velocity variation characteristics of rock samples, it is not possible to collect the axial and radial wave velocity data of rock samples at the same time; rather, the single direction data of rock samples can only be collected in the axial or radial direction. Thus, it is impossible to compare and analyze the axial and radial wave velocity data of rock samples. Therefore, it is necessary to further study the acoustic emission and wave velocity characteristics of metasandstone under cyclic loading and unloading.

2. Materials and Test Methods

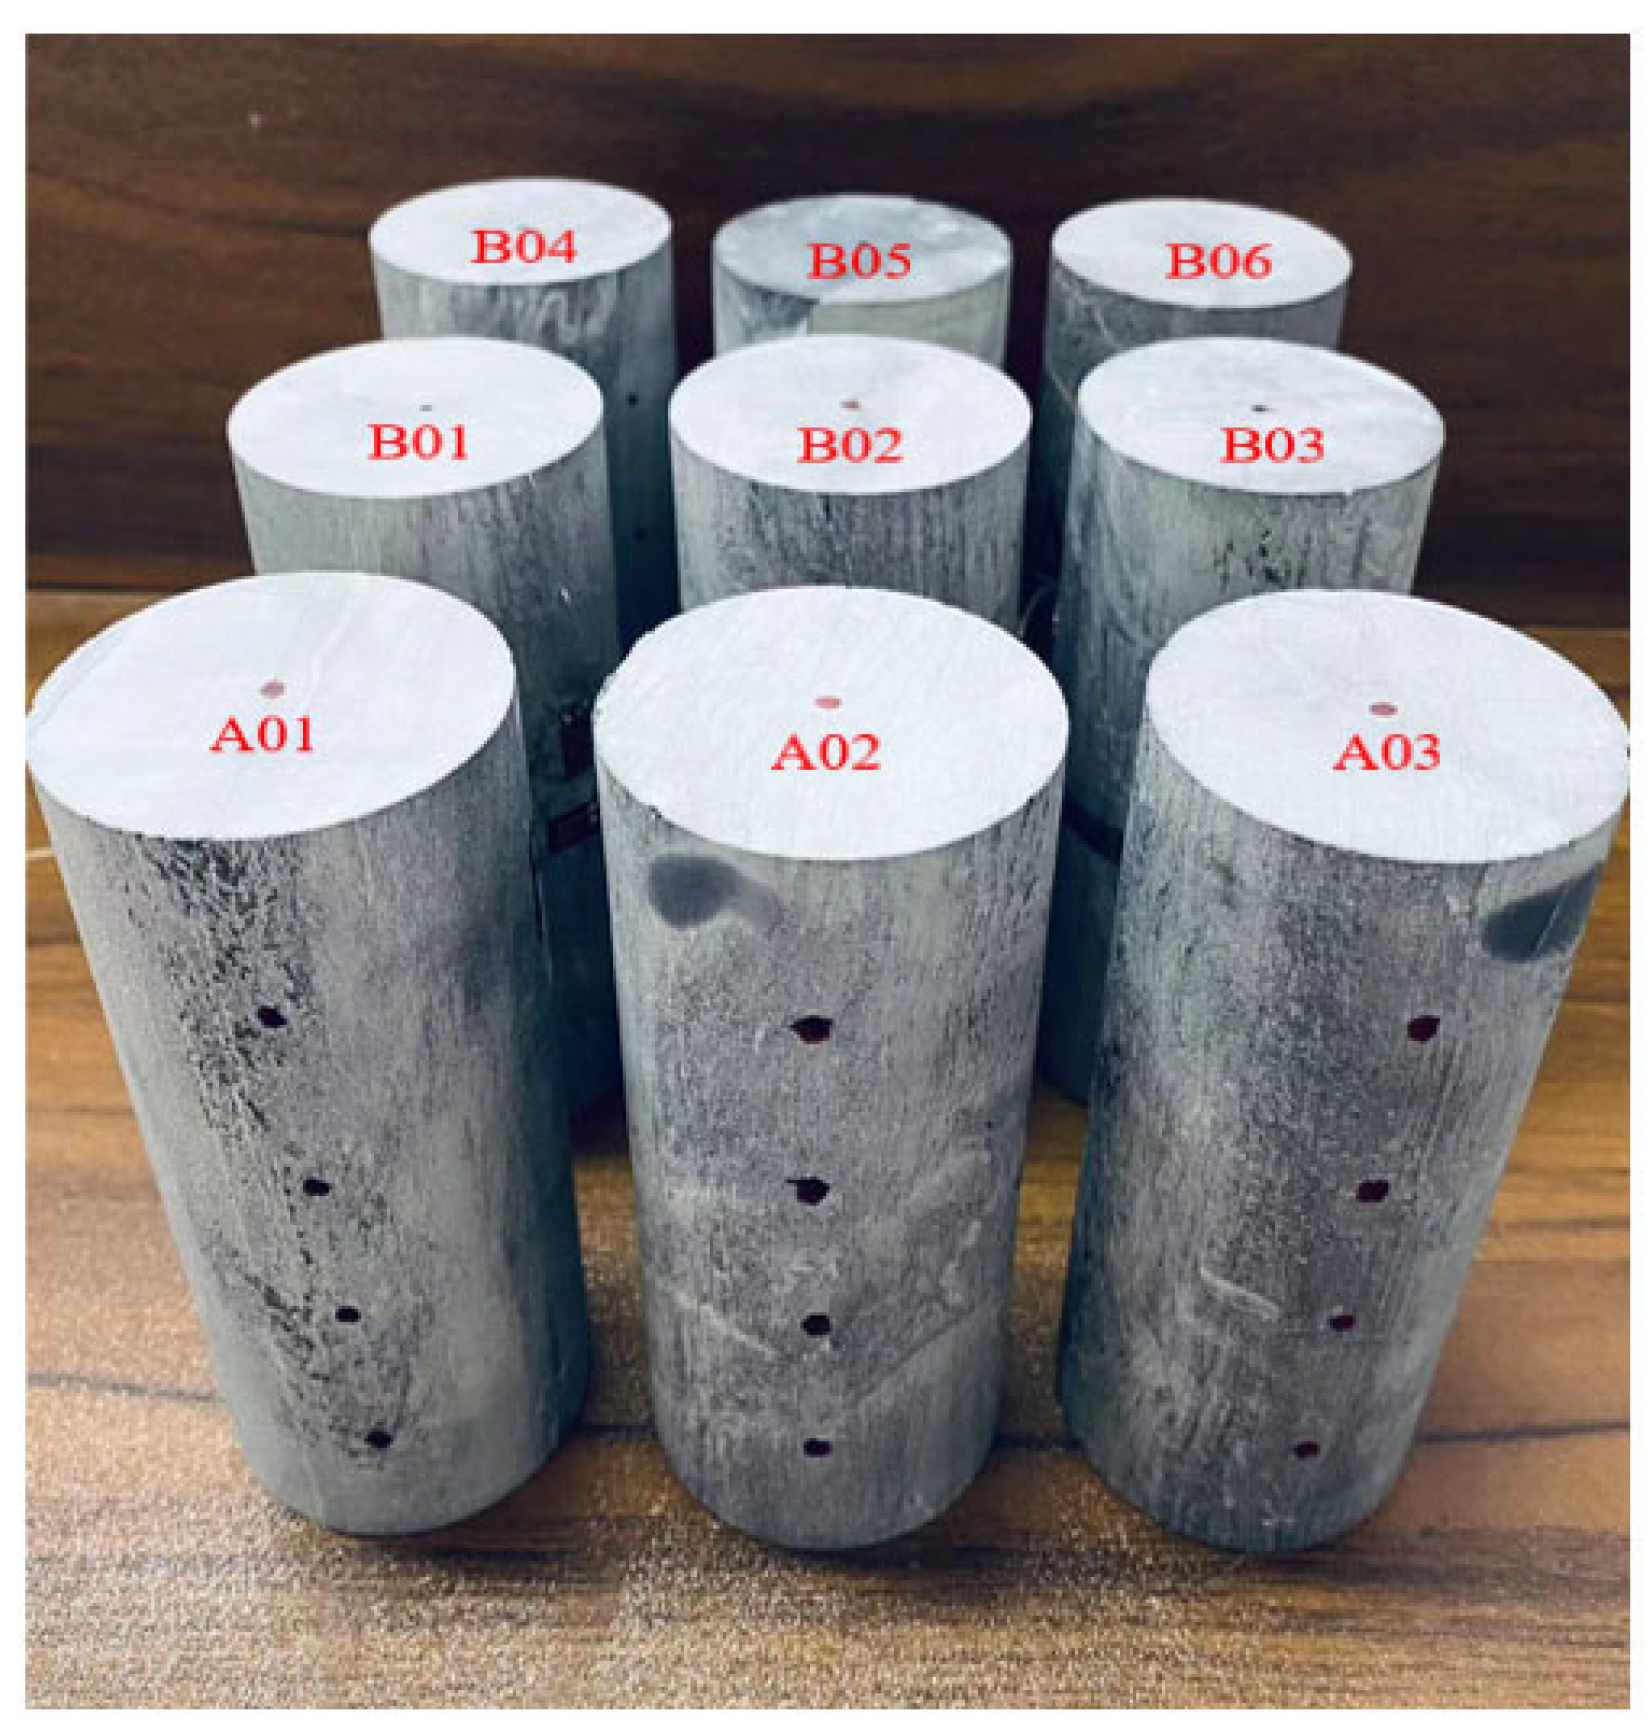
2.1. Rock Sample Preparation

The metasandstone rock samples studied in this paper were taken from the maximum burial depth interval of a metasandstone tunnel in the Huangshan area, China. The mechanical tests were divided into two groups of uniaxial compressive strength test and uniaxial graded cyclic loading and unloading test. Uniaxial compressive strength tests were planned for three rock samples A01–A03, and uniaxial cyclic loading and unloading tests were planned for six rock samples B01–B06. All rock samples used in the test were finely processed by a professional rock mechanic test stone processing factory in strict accordance with international standards. The rock samples were standard cylindrical rock samples having a diameter of 50 mm and height of 100 mm. The size, surface parallelism, and angle between the end face and axis of the prepared rock samples were measured to fully meet the test accuracy requirements.
In order to minimize the adverse effect of defective rock samples on test results, after the preparation of all rock samples, the rock samples were screened in terms of their appearance and longitudinal wave velocity. The samples with obvious surface joints and broken corners were firstly eliminated, and then the remaining samples were measured for longitudinal wave velocity according to the predesigned measurement points. The standard cylindrical rock samples were arranged with five pairs of measurement points: four pairs at equal intervals on the sides and a pair at the center of the end (Figure 1).
After completing the wave velocity measurement of all rock samples, we selected a group of rock samples with similar wave velocity data as the final rock samples for the test. The wave velocity and dimensional data of the final two groups of rock samples were measured and recorded separately for the subsequent tests. The appearance of the finally selected metasandstone rock sample is shown in Figure 2, and the basic parameters of the rock samples are shown in Table 1.

2.2. Test Equipment

The instrument used in the test to measure the longitudinal wave velocity of the rock sample was an HS-CSIH type ultrasonic parameter detector, equipped with two types of probes for the arc surface and the end surface. Energy spectroscopy and X-ray analysis of rock samples were performed using a Hitachi regulus 8230 high-resolution cold field emission scanning electron microscope and a Bruker D8 Advanced X-ray diffractometer, to determine the mineralogical composition of the rock samples. In order to make the test results more accurate, the surface of the rock sample was treated with electrical conductivity using an MSP-2S ion diffractometer before the test.
The selected material servo machine was an INSTRON-1346 type, which has digital computer automatic control, and can record the load, stress, displacement, and strain values in real time. A six-channel acoustic emission system of type PCI-2 with a resonant acoustic emission transducer of type R6a was used to collect the acoustic emission signal characteristics of the whole process of rock destruction under uniaxial compression conditions.

2.3. Test Methods

Uniaxial compression tests were first conducted on metasandstone samples A01, A02 and A03, which were loaded by the force-controlled method with a loading rate of 0.5 MPa/s. The average natural uniaxial compressive strength (UCS)and elastic modulus (E) of the rock samples were measured, and recorded as R0 and E0, respectively. Uniaxial cyclic loading and unloading tests were carried out on rock samples B01, B02, B03, B04, B05, and B06, with each 20% R0 incrementing one level. A total of 5 levels of 0–20% R0, 0–40% R0, 0–60% R0, 0–80% R0, and 0–100% R0 were set, and the same rock samples were loaded and unloaded sequentially, with each level being loaded and unloaded only once (Figure 3). If the rock sample was still not damaged after the unloading of 0–100% R0, the rock sample was loaded at a rate of 0.5 MPa/s until it was damaged, which was recorded as the 6th one-way loading.
The test steps are as follows:
(1)
Place the prepared rock sample under the working platform of the material testing machine, start the material testing machine, and make the loading end of the material testing machine slowly approach the upper end of the rock sample.
(2)
Start loading, use the force control mode to load the rock sample at the loading rate of 0.50 MPa/s to the preset upper limit value of the level stress, and reach the upper limit value of the level stress. Immediately, the rock sample is unloaded at the unloading rate of 0.50 MPa/s until the axial force is zero, and a complete loading and unloading cycle is completed. In this process, the data recording system and acoustic emission acquisition system of the material testing machine maintain synchronous acquisition throughout the whole process.
(3)
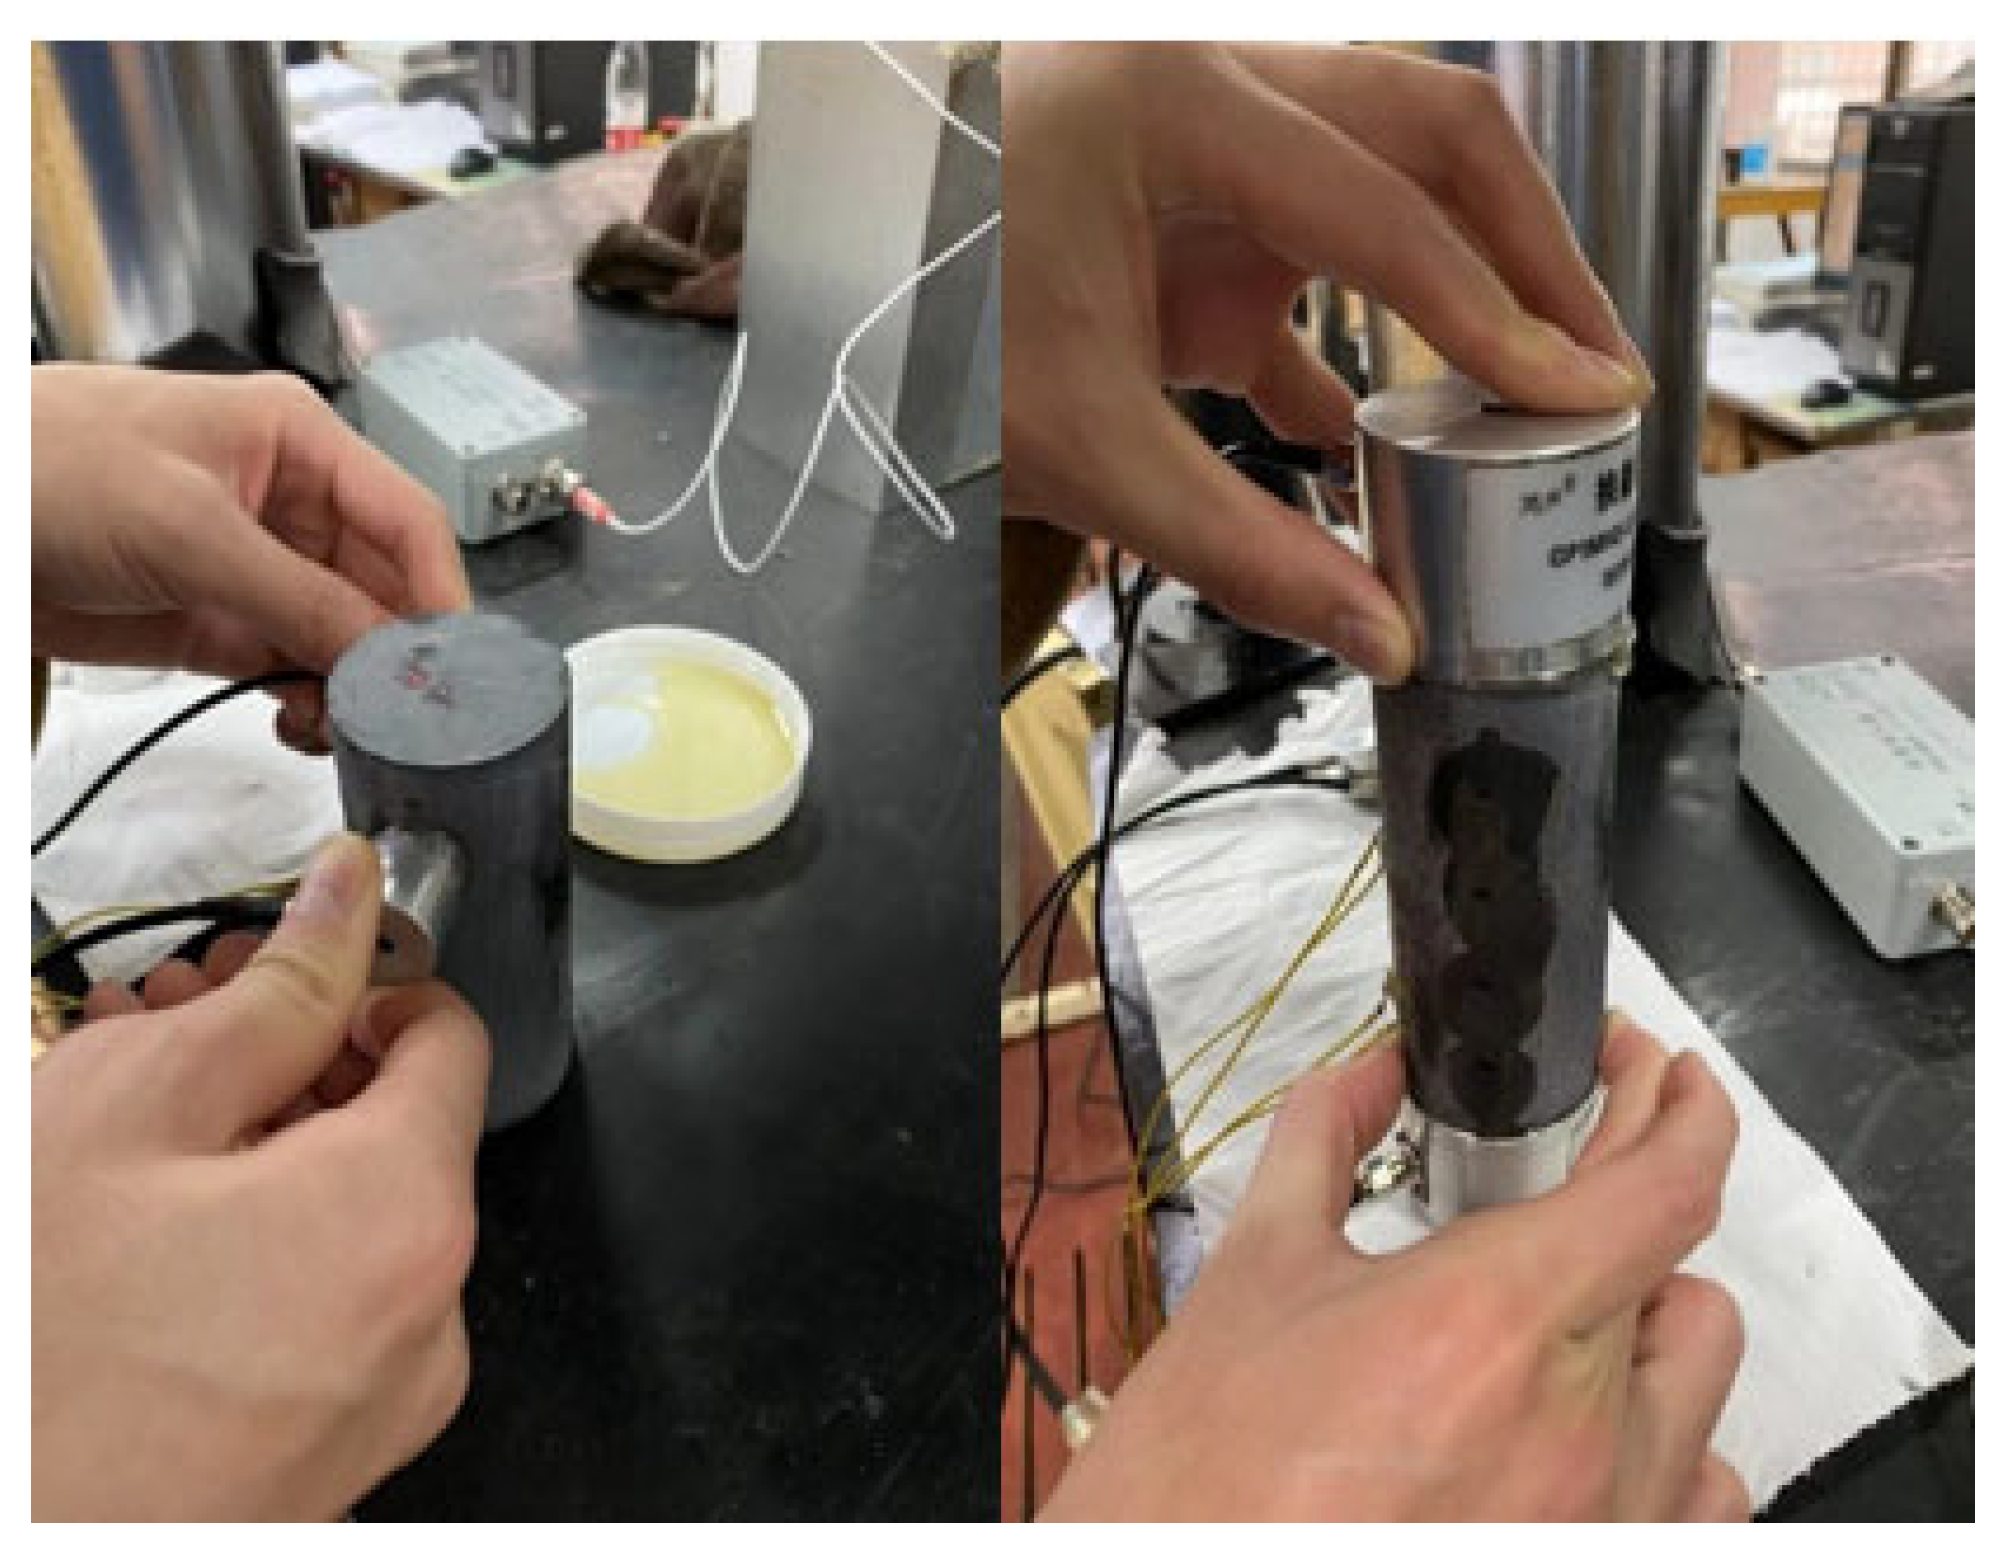
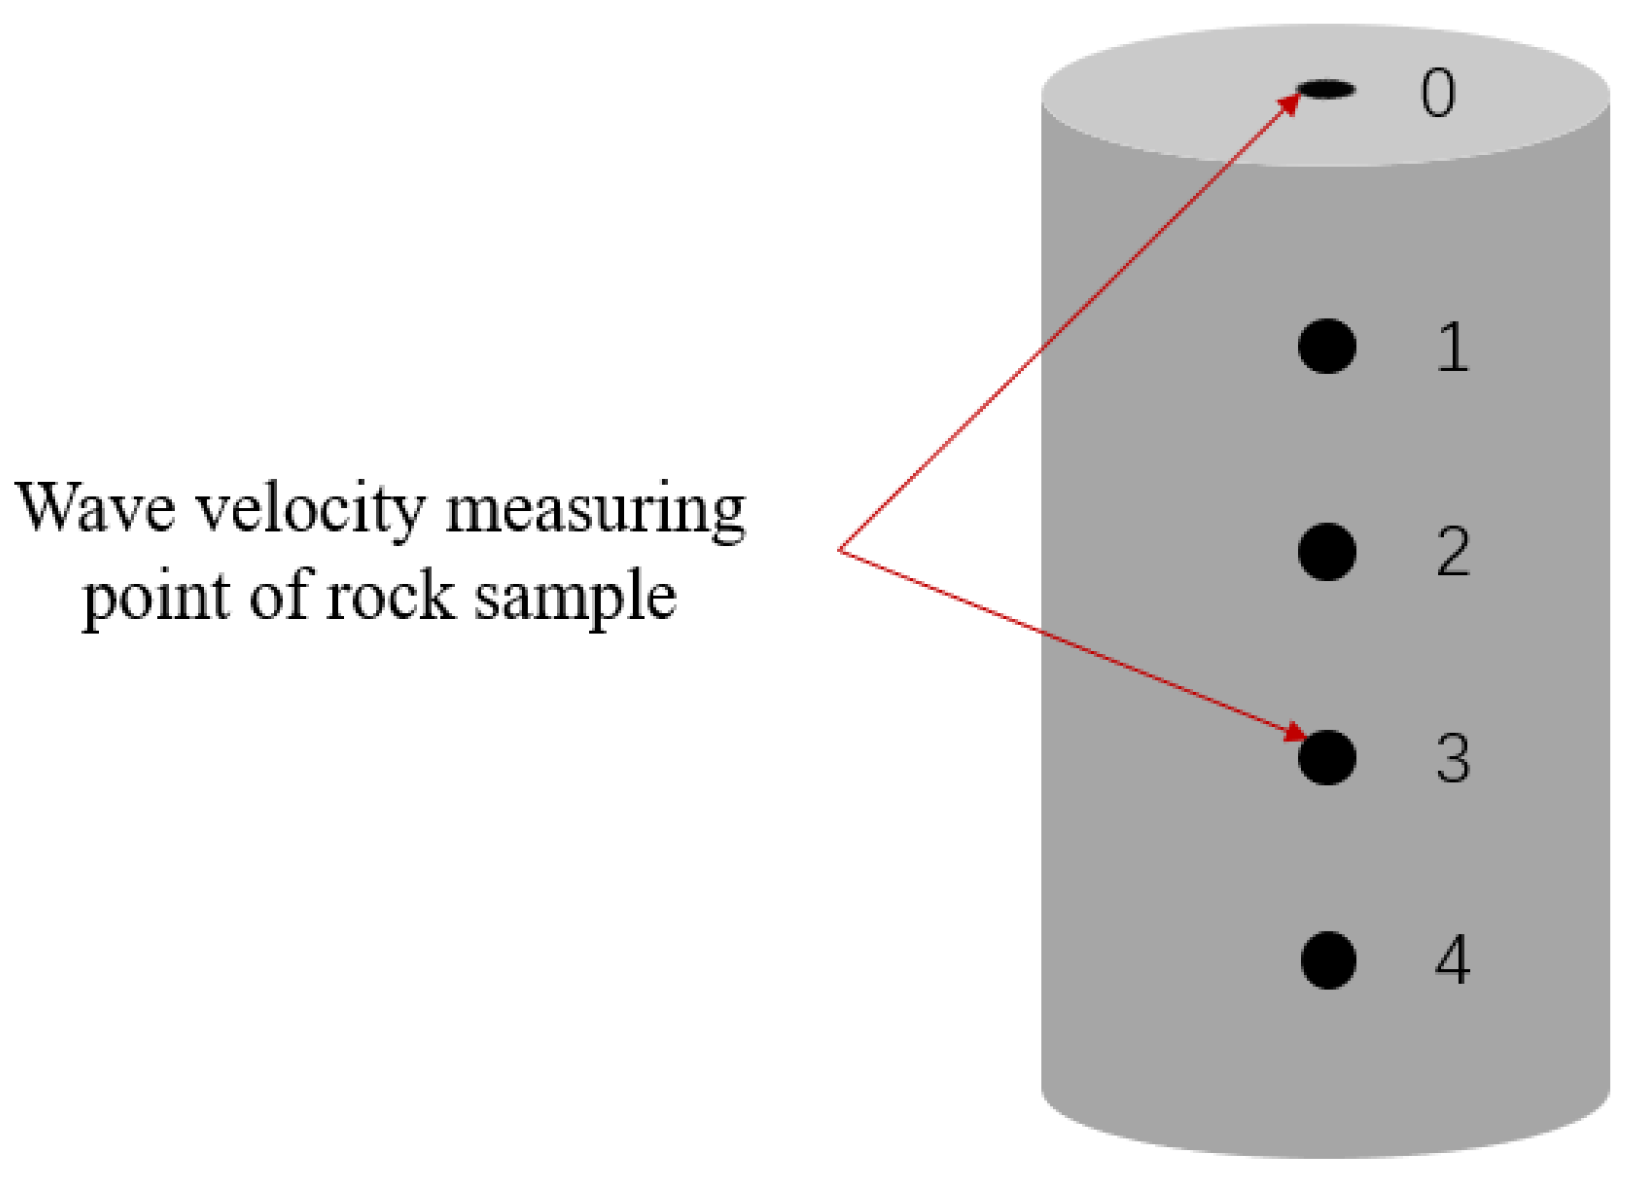
After a loading and unloading cycle, measure and record the longitudinal wave data of 5 points (0, 1, 2, 3 and 4) of the rock sample with an ultrasonic collector (Figure 4). If the test piece is macroscopically damaged, this step is terminated.
(4)
After the wave velocity measurement at five points of the rock sample is completed, place the metasandstone rock sample back on the working platform of the material testing machine, and prepare to start the loading and unloading test at the next level until the macro instability failure of the rock sample occurs. At this point, the test of a single rock sample is completed, and the test of the next rock sample is started.
Figure 4. The radial and axial wave velocities of rock samples were collected during the test.
Applsci 12 06310 g004

3. Test Results and Analysis

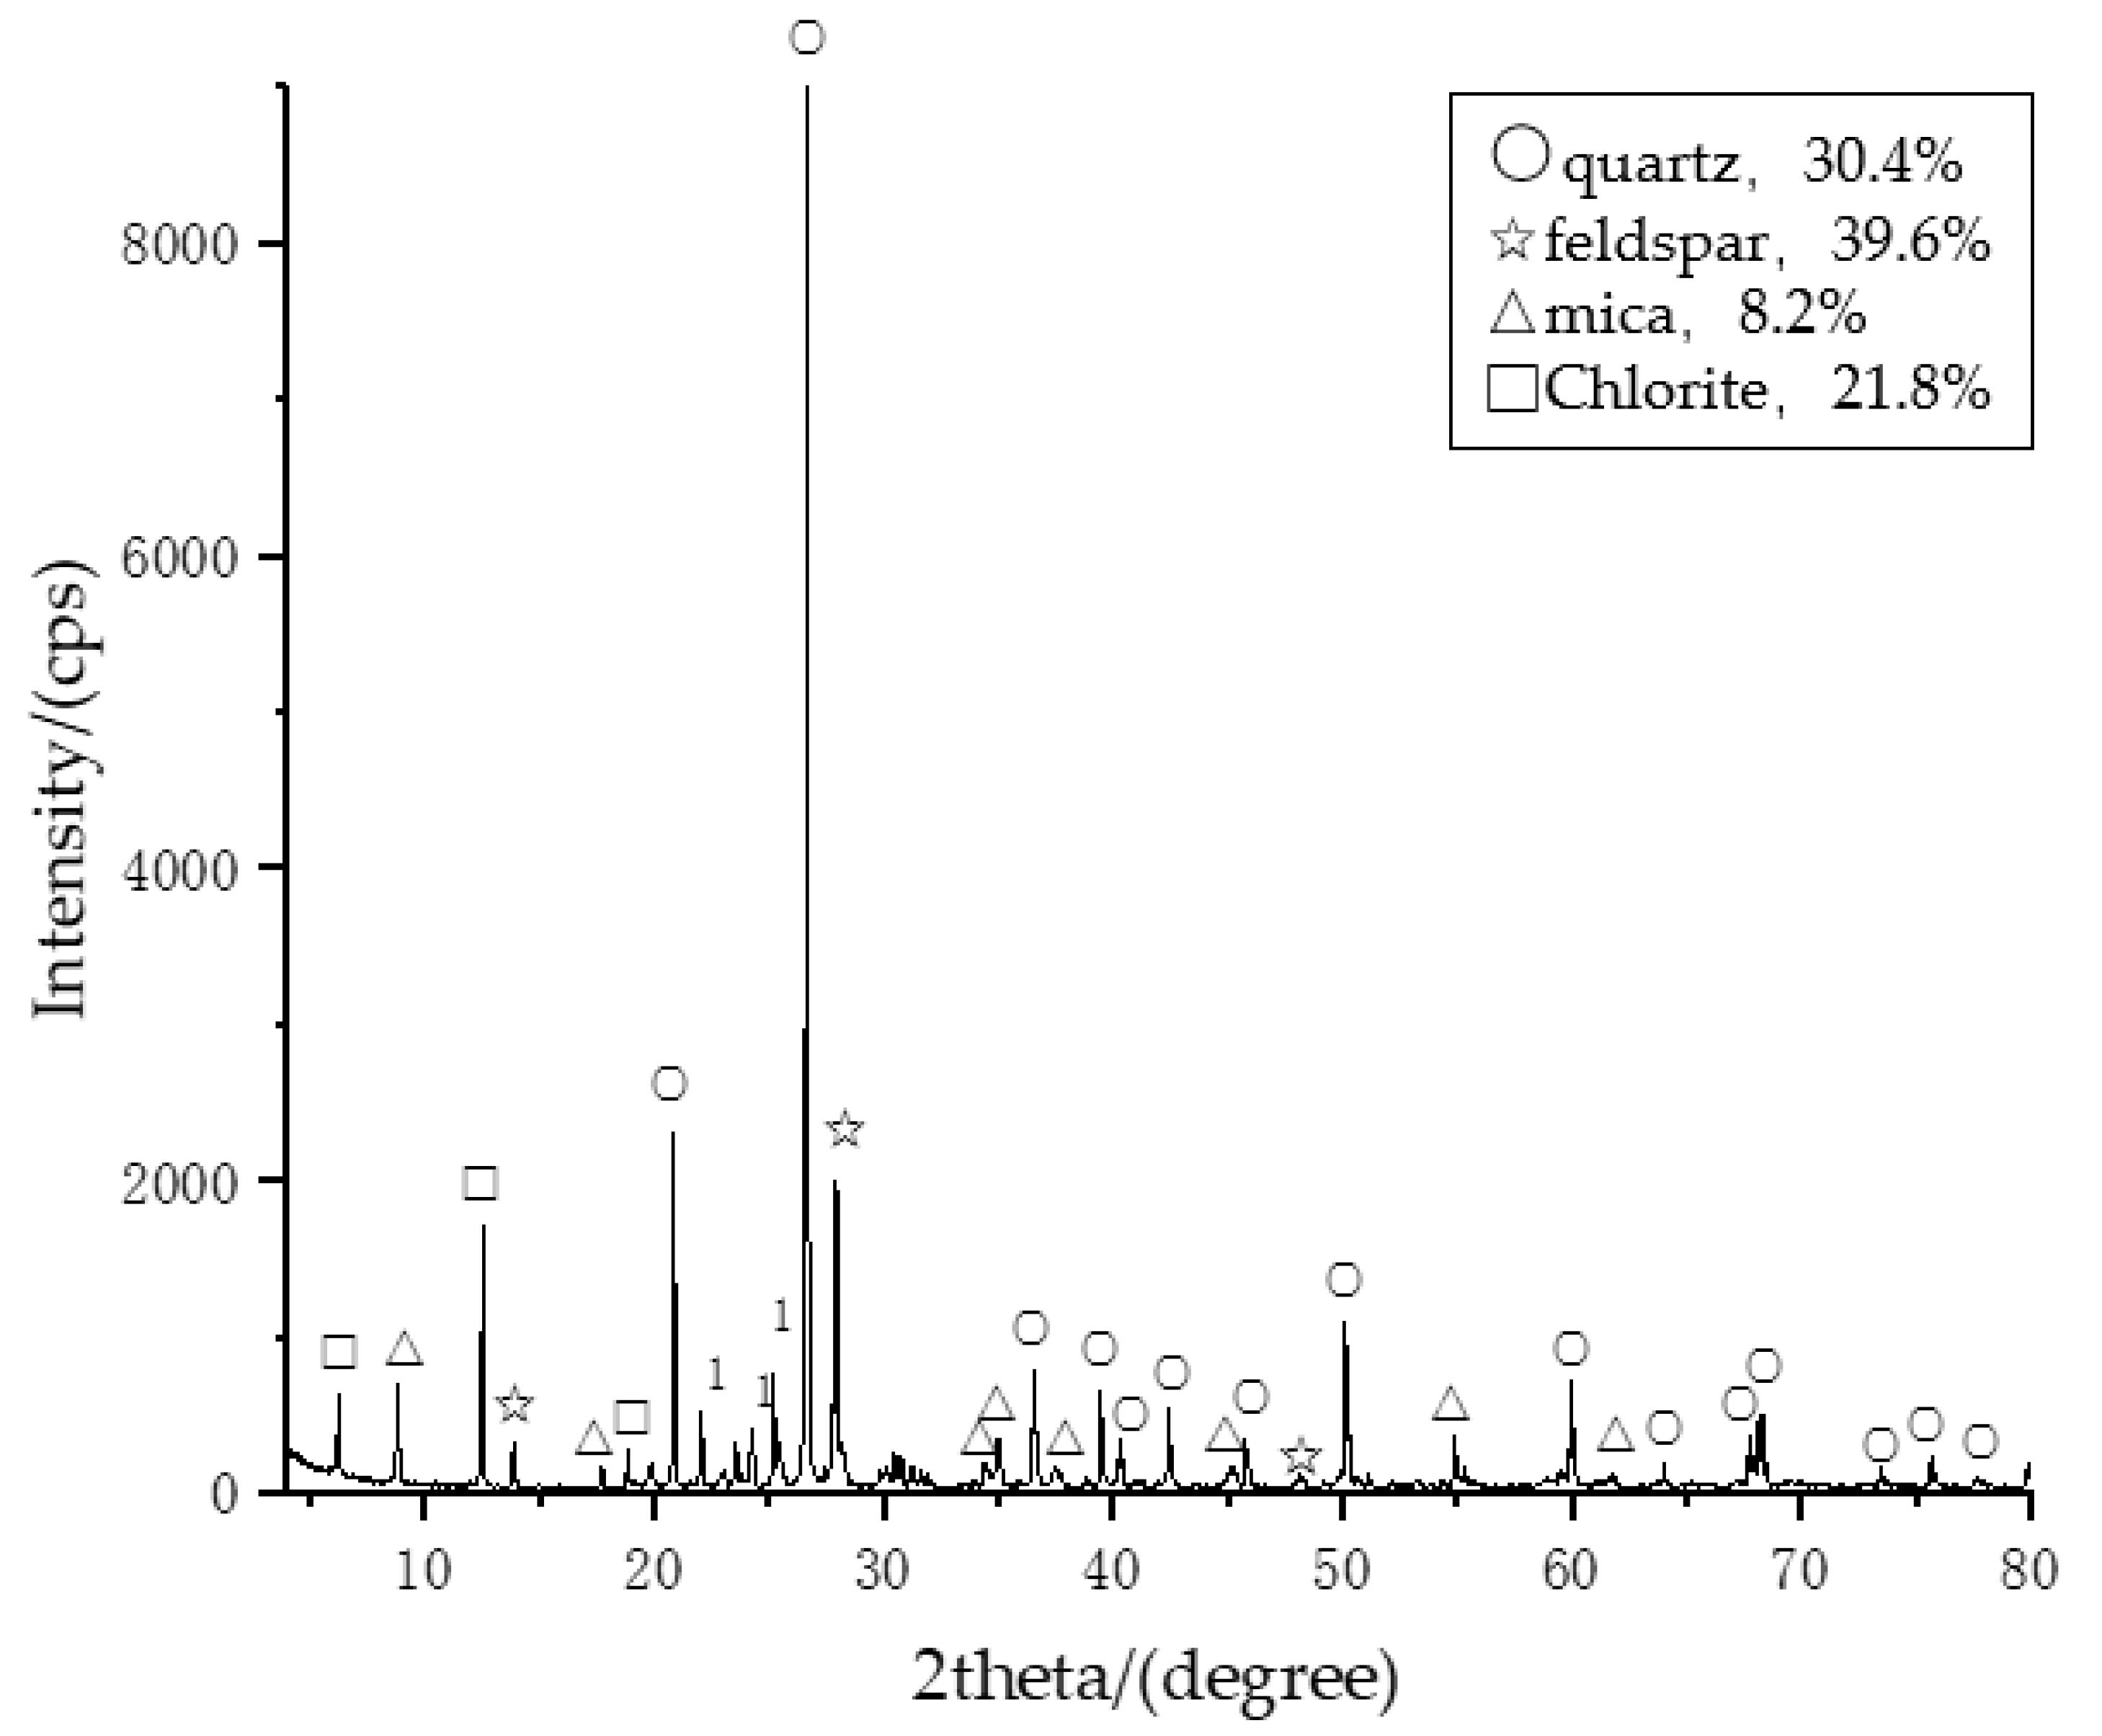
3.1. Mineral Composition Analysis

Metasandstone is formed by metamorphism of sandstone. In this process, the round grained quartz in sandstone will recrystallize into flat rice grains under the action of high temperature and high pressure. Therefore, metasandstone is harder than ordinary sandstone. A small amount of rock sample powder was taken for energy spectrum and X-ray analysis to quantitatively analyze the rock mineral composition.
Based on the quantitative analysis results of the constituent elements and crystal structure of the rock sample (Figure 5 and Figure 6), it can be determined that the main mineral components of the metamorphic sandstone are quartz and feldspar.

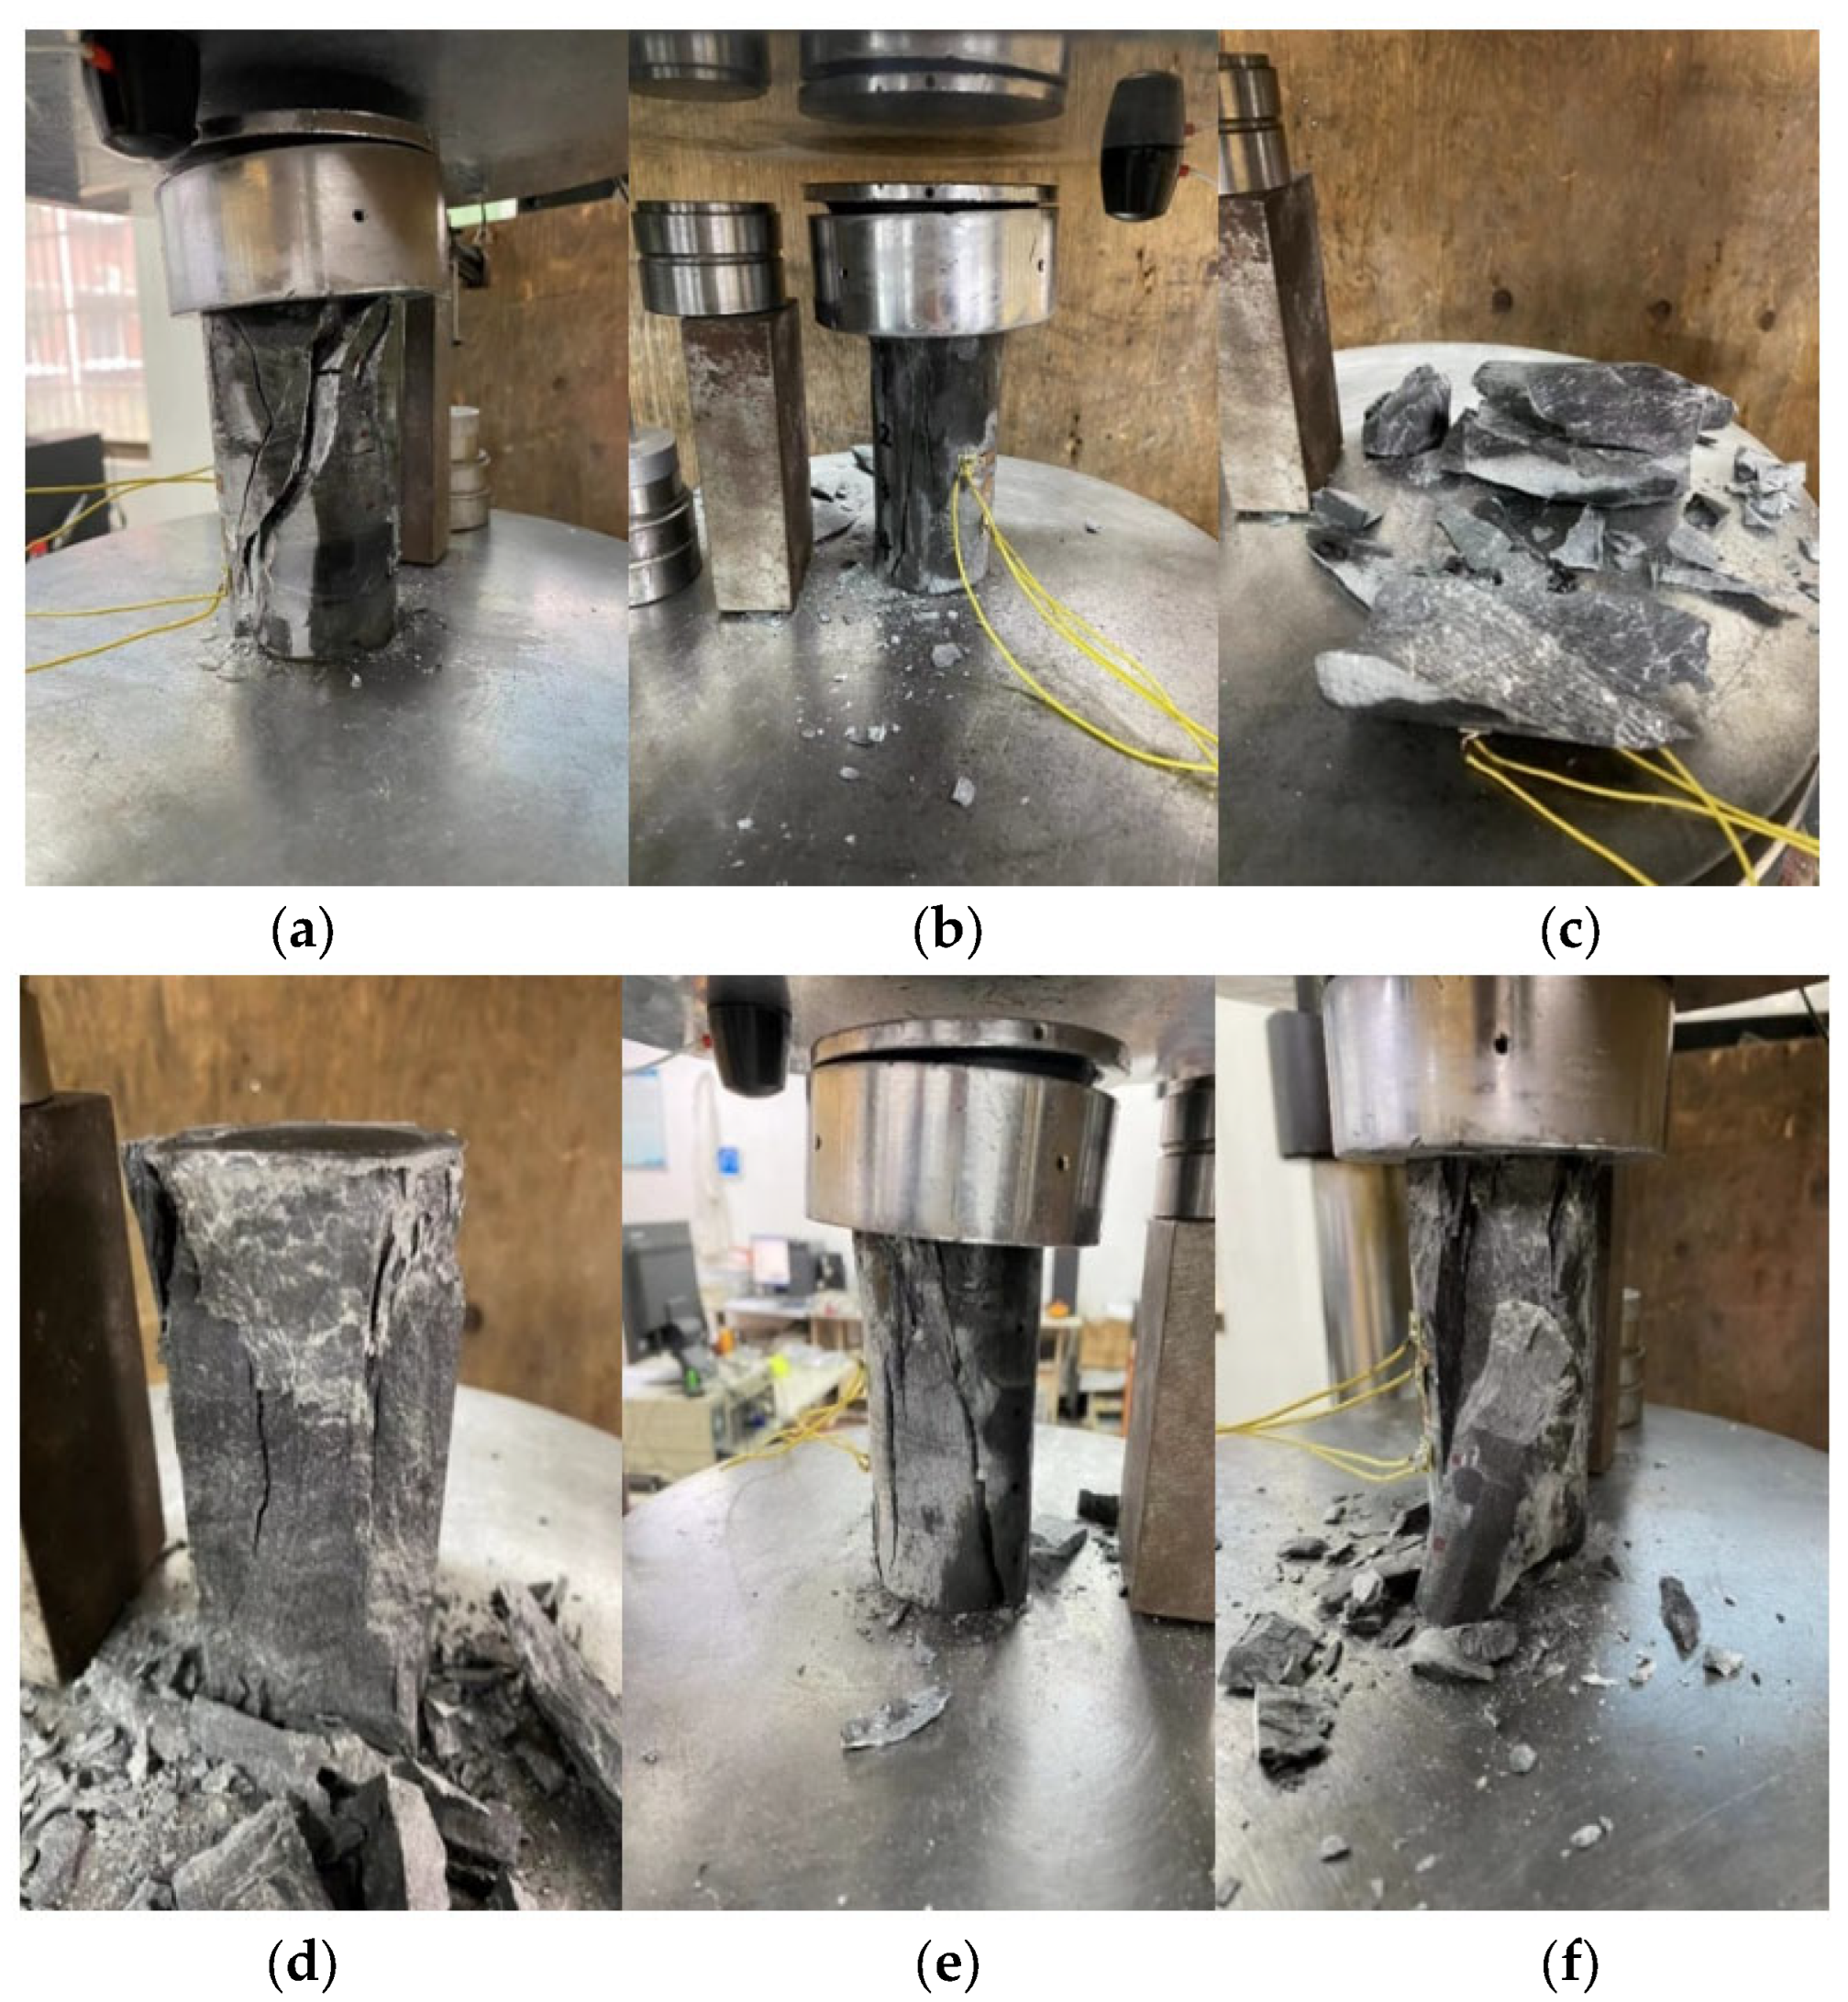
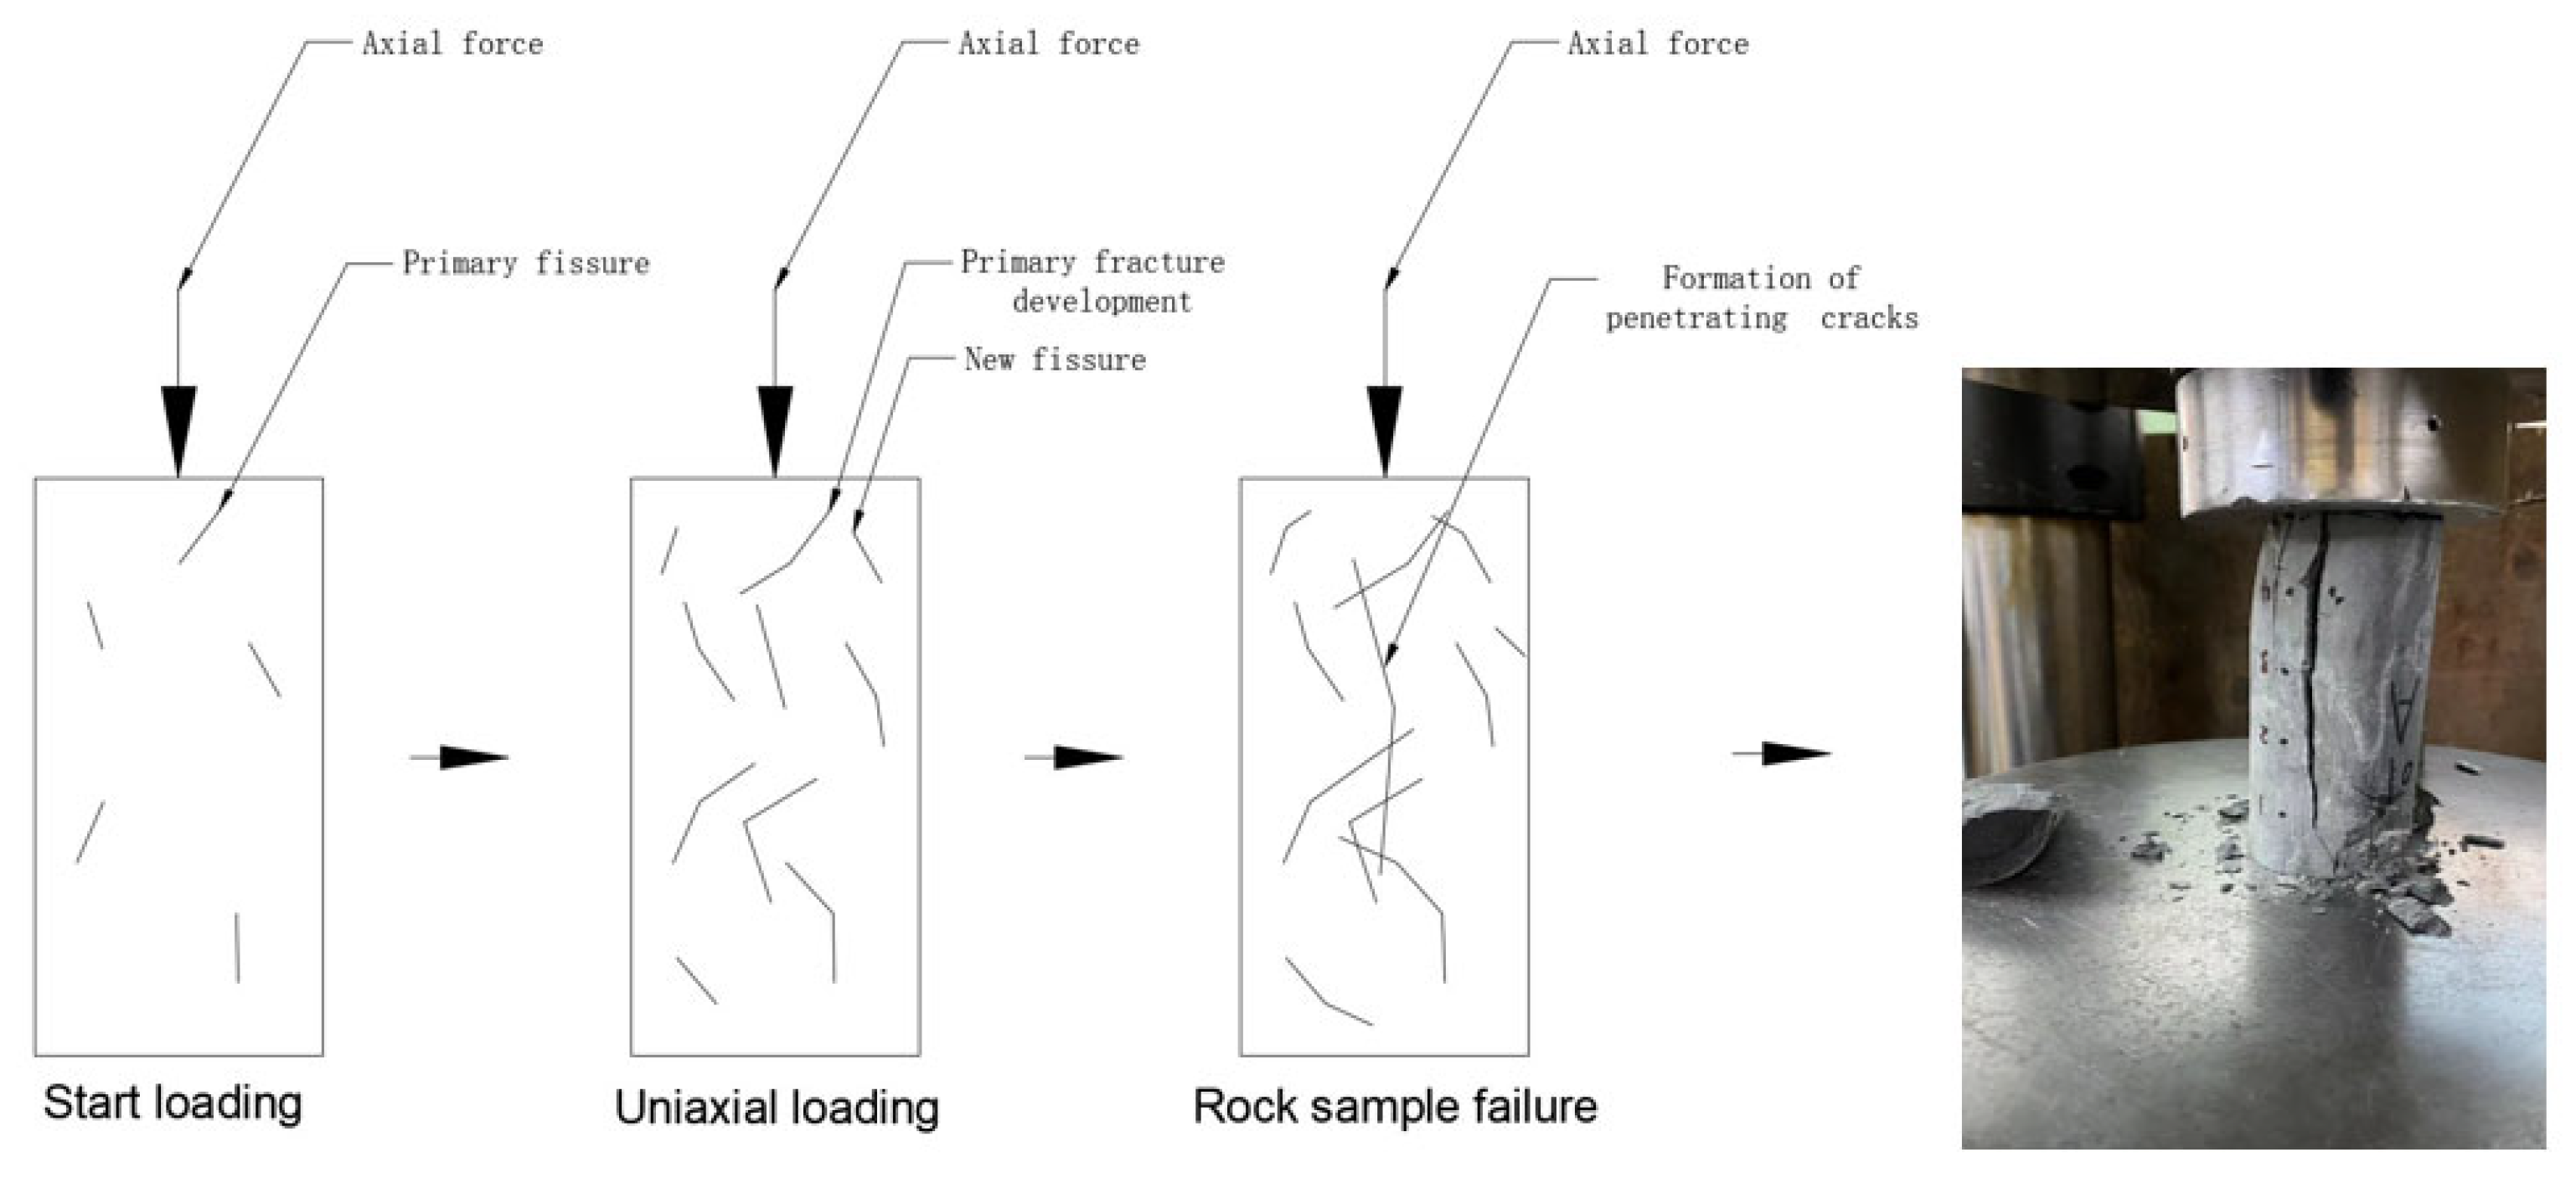
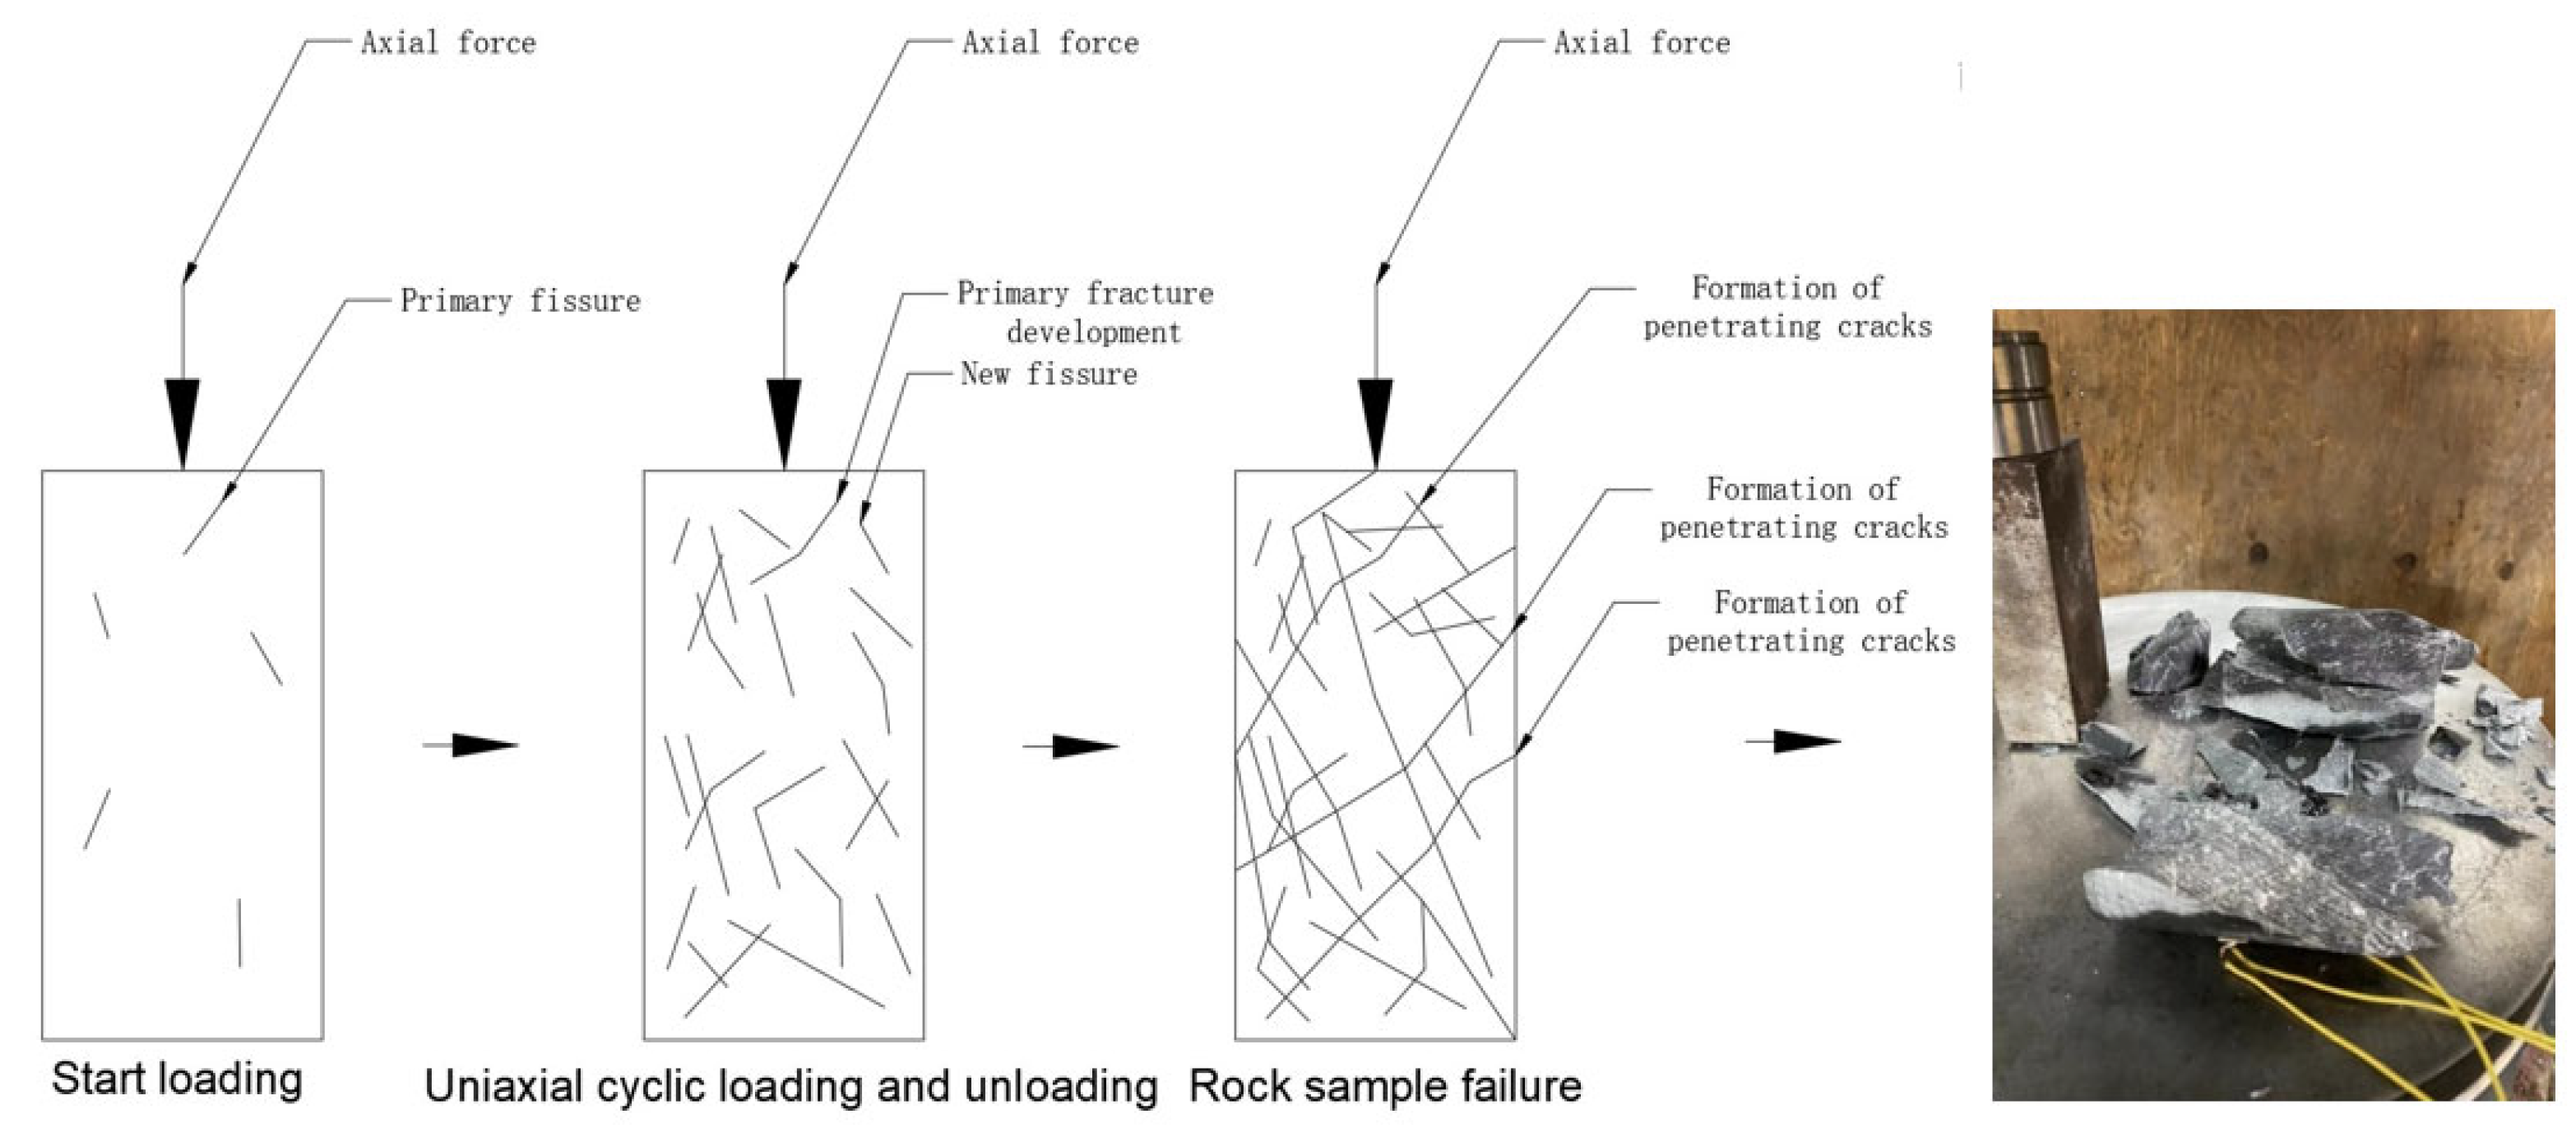
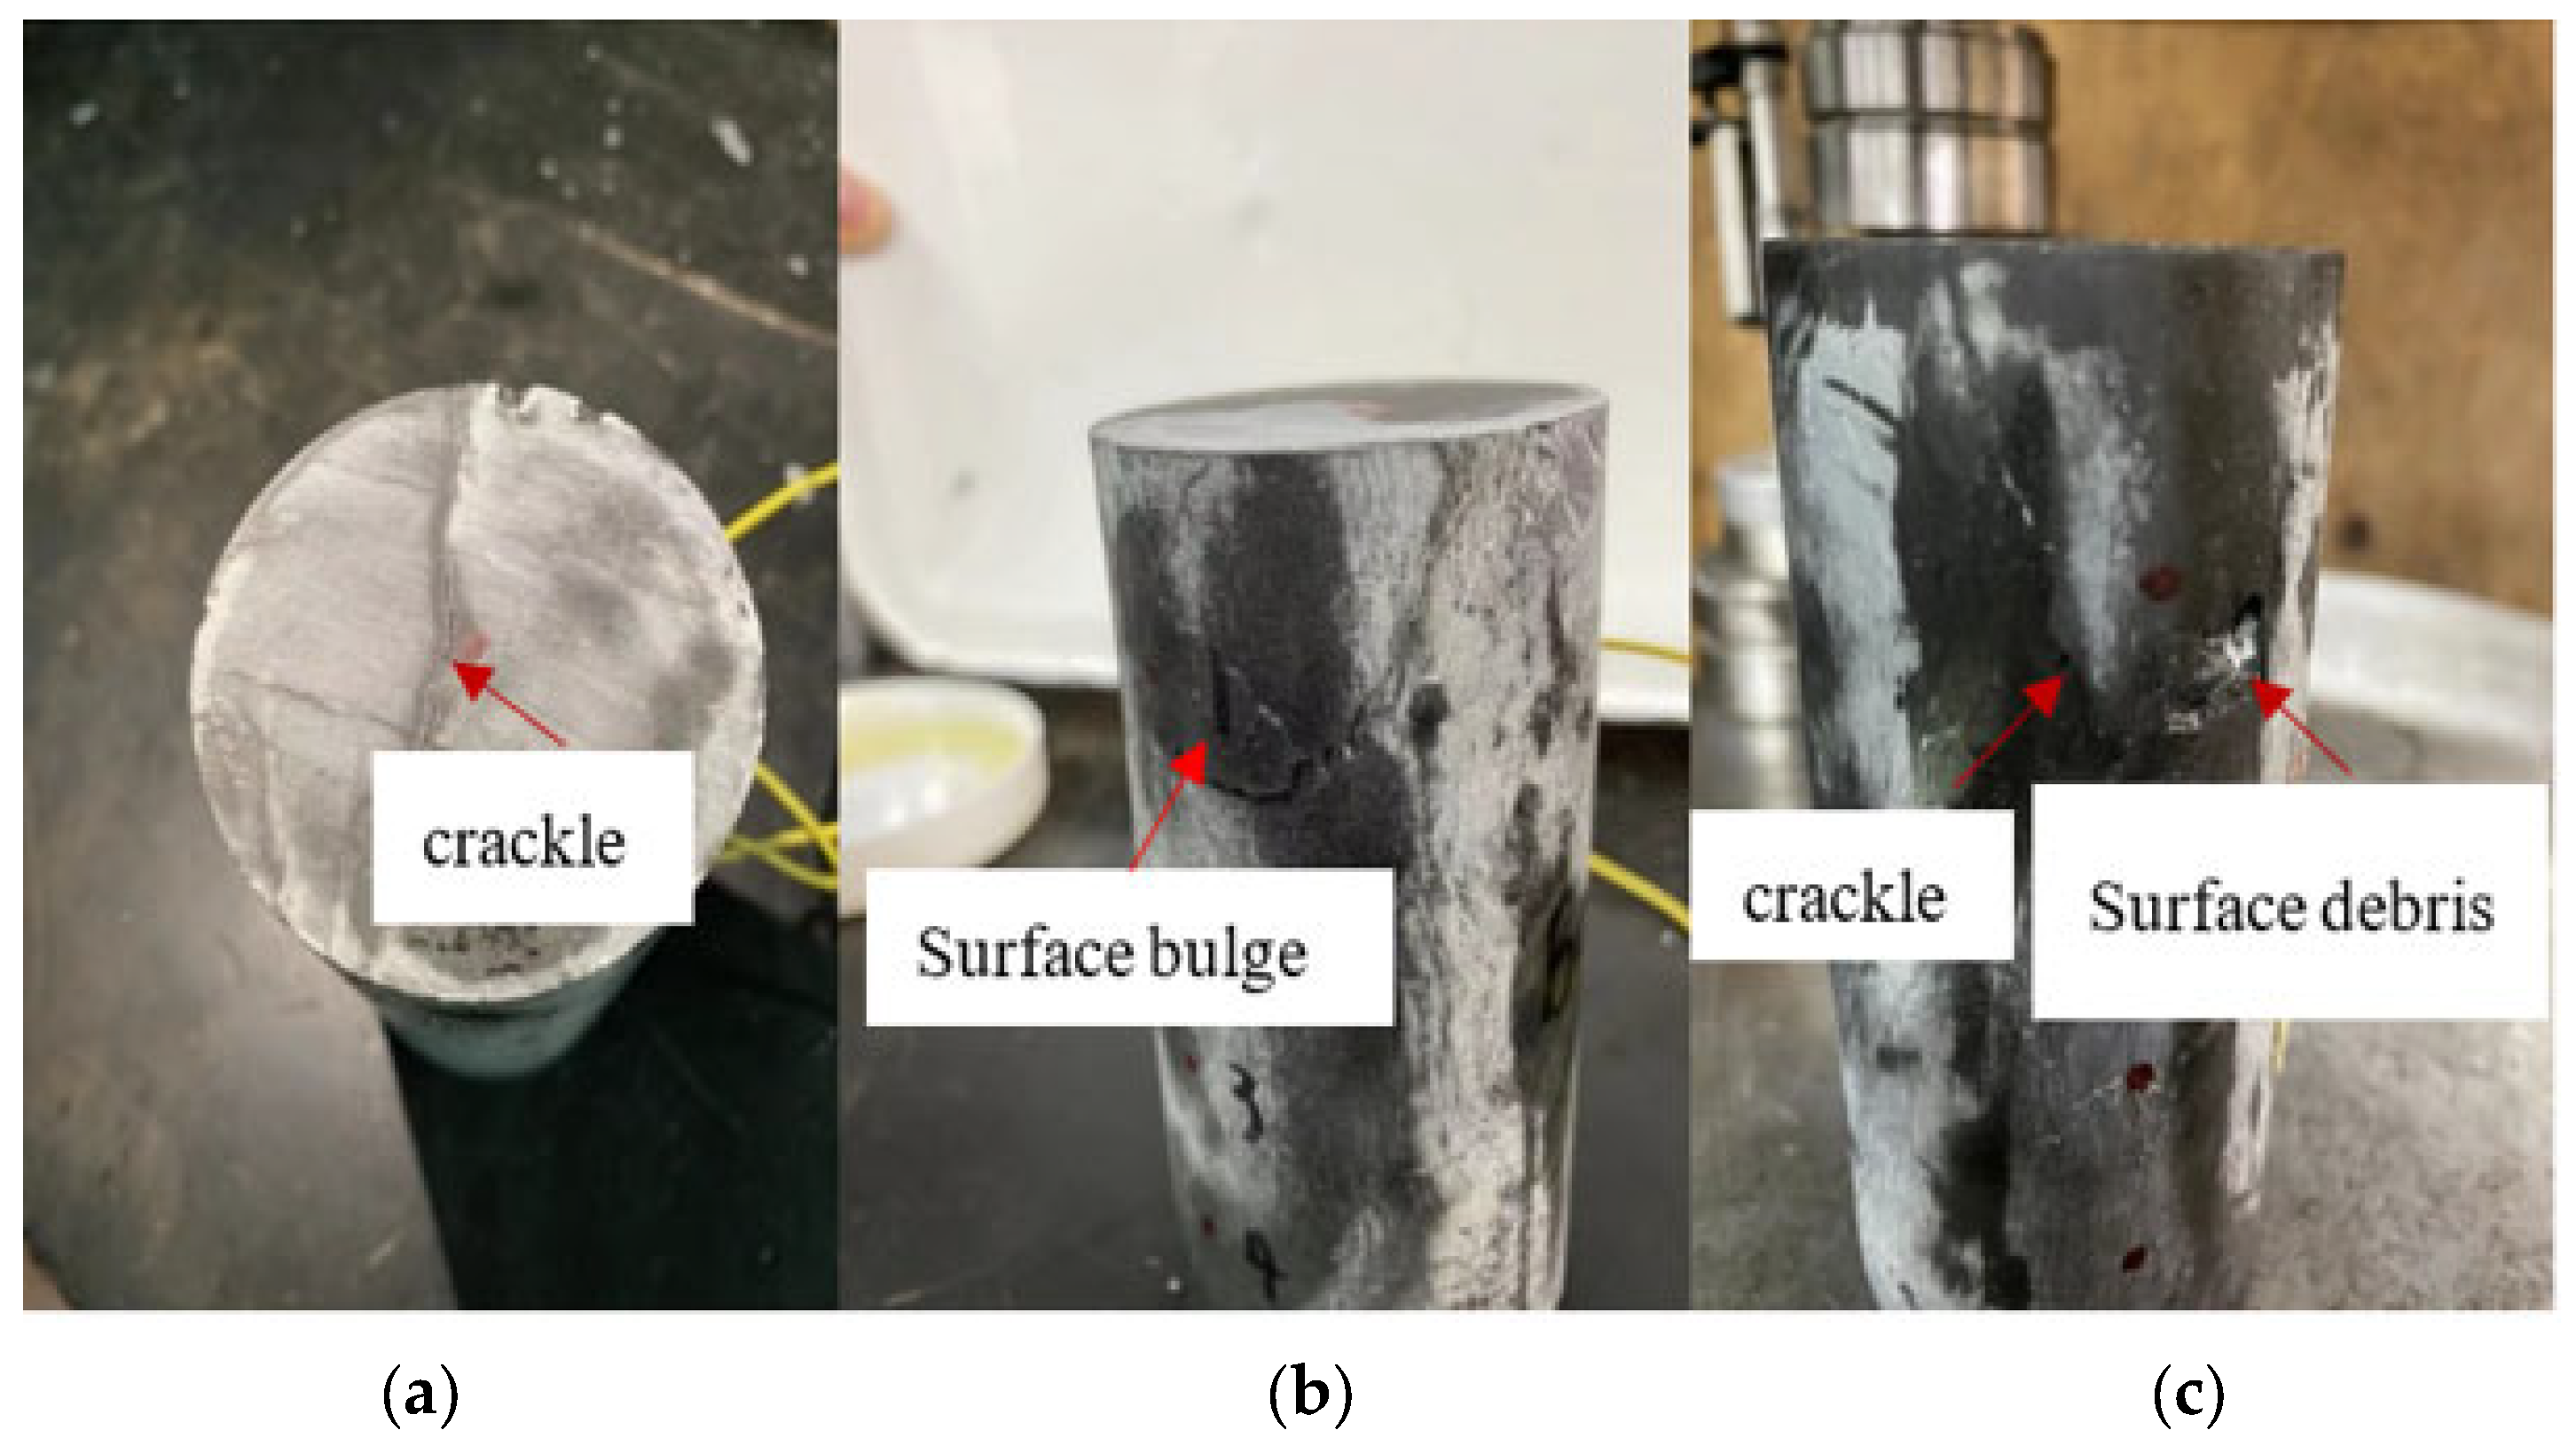
3.2. Analysis of Rock Failure Characteristics

The final failure form of the two groups of rock samples is shown in Figure 7 and Figure 8.
In Figure 8, the six rock samples exhibit obvious fatigue damage characteristics under the uniaxial graded cyclic loading and unloading action. In rock samples B01, B02, B05 and B06, there were multiple penetration cracks, some of which were larger than those in the uniaxial compression test. The damage was more severe in rock samples B03 and B04, where the rock samples disintegrated directly. It can be seen that the specimens in the uniaxial graded cyclic loading and unloading tests have a more intense form of damage compared to the uniaxial compression tests.
The damage evolution patterns of rock samples under uniaxial compression and uniaxial cyclic loading and unloading tests are shown in Figure 9 and Figure 10.
Compared with the uniaxial loading test, the uniaxial graded cyclic loading and unloading test provide more favorable conditions for the initiation and development of cracks in rock samples. Before the final damage, there are many microcracks in the rock sample, and the cracks intersect to some extent. When the axial force reaches the bearing limit of the rock sample, each fissure rapidly expands through the rock sample, which leads to a more dispersed morphology when the rock sample is damaged.
In addition, some samples also experienced obvious external damage during the test. Figure 11 shows some external damage of rock samples B02, B04, and B05 before the macroscopic damage. Microcracks appeared on the end face of B02 after the 4th level unloading test was carried out. Fragment ejection occurred on the central surface of rock samples during the loading phase of the 3rd level unloading test for B04, and bulging appeared on the upper surface of rock samples during the loading phase when the 4th level unloading test was subsequently carried out. Cracks appeared on the surface of B05 during the loading phase of the 1st level unloading test, and fragmentation appeared on the surface of B05 during the 2nd level loading test. These phenomena indicate that the rocks are subject to different degrees and forms of damage at different levels in the cyclic loading and unloading tests.

3.3. Strength Characteristic Analysis

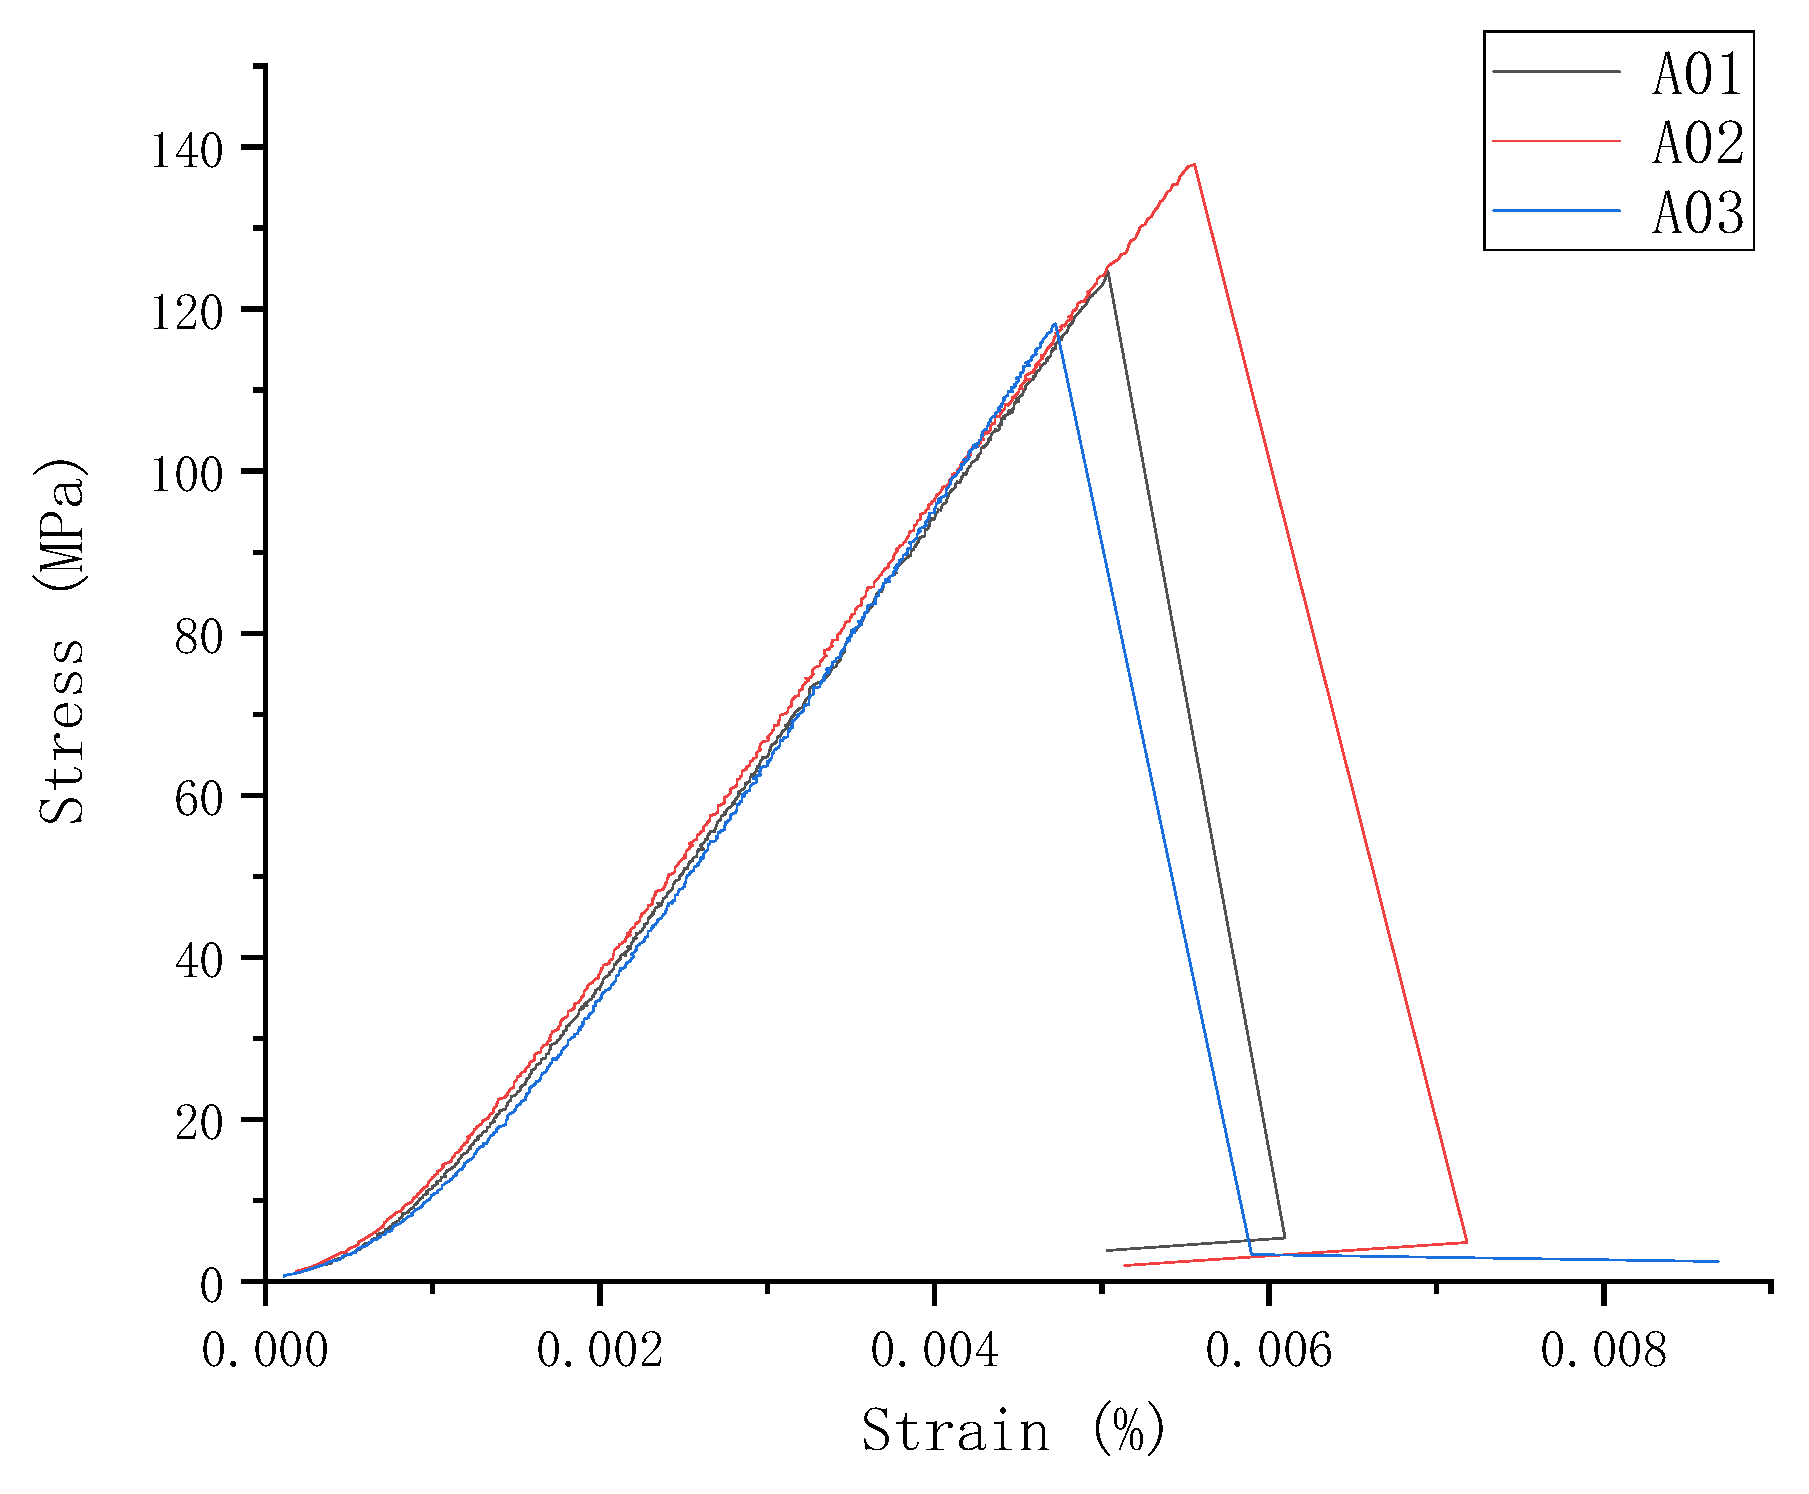
3.3.1. Variation Characteristics of Rock Compressive Strength

The stress–strain curves of metasandstone under uniaxial compression and uniaxial graded cyclic loading and unloading are shown in Figure 12 and Figure 13.
From the uniaxial compression stress–strain curve of the rock sample in Figure 12, it can be seen that the stress–strain curve does not show a yielding phase that obviously produces plastic deformation when the rock sample is about to reach the peak strength, which indicates that this metasandstone is a typical plastic-elastic rock. The deformation characteristics after the peak of the curve indicate that the metasandstone rock sample experienced obvious brittle damage.
As can be seen in Figure 13, the area of the plastic hysteresis loop in the cyclic stress–strain curve of the rock sample becomes larger as the cyclic level rises, which indicates that the irreversible damage within the rock is increasing.
Table 2 and Table 3 show the data of peak strength (UCS) and modulus of elasticity (E) of the rock samples under uniaxial compression and uniaxial graded cyclic unloading conditions.
From Table 3, it can be seen that none of the six rock samples experienced a complete 5th stage unloading cycle. Rock samples B03 and B05 were destroyed after only two complete unloading cycles, and the compressive strength was significantly lower than that of the other four samples. It is assumed that the reason for this phenomenon is that there are relatively developed joints and fissures or structural surfaces inside the B03 and B05 samples, and most of these joints and fissures or structural surfaces are not in the monitoring area of the radial wave velocity measurement point and are approximately parallel to the axis of the sample, so the internal defects are not well reflected in the initial wave velocity.
The average cyclic compressive strength of the B01–B06 rock samples at final damage Rb was 87.4 MPa, which was only 68.9% of the average uniaxial compressive strength R0. Even if the results of B03 and B05 are not taken into account, the average compressive strength of the remaining four rock samples was 100.3 MPa, which was significantly less than the uniaxial compressive strength of the metasandstone of 126.9 MPa, and the former was 79.0% of the latter. This shows that uniaxial graded cyclic loading and unloading can cause significant damage to the metasandstone rock samples, which in turn reduces the compressive strength of the rock.

3.3.2. Variation Characteristics of Elastic Modulus of Rock

The linear phase of the stress–strain curve of the six rock samples at each cyclic loading stage was taken as the interval of the elastic modulus. In order to avoid the influence of the plastic strain produced by the loading and unloading process of the rock samples of the previous level on the elastic modulus, the lower limit of the interval of the next level was higher than the upper limit of the interval of the previous level. The slope of the linear regression equation at one-half of the value interval was taken as the elastic modulus.
The trend in the elastic modulus of the six rock samples in the cyclic loading and unloading tests at each level is shown in Figure 14. It can be seen that, at the beginning, the elastic modulus of the rock samples generally increases with the increase in the upper limit stress of the loading and unloading levels, but the growth rate tends to level off as it goes on, and tends to reach an inflection point value before decreasing.
In order to study the cumulative effect of the uniaxial graded cyclic loading and unloading process on the change in rock strength characteristics, the elastic modulus measured in the uniaxial compressive strength test was considered as the initial value. The elastic modulus of the last cyclic loading stage of the six rock samples was taken as the comparison value, and the trend in the elastic modulus of the rock samples was plotted, as shown in Figure 15.
In Figure 15, after the uniaxial cyclic graded loading and unloading, the modulus of elasticity of the six rock samples decreased compared with the initial value, and the average modulus of elasticity was 22.9 GPa, which was significantly lower than the initial value of modulus of elasticity of 29.8 GPa. This indicates that the uniaxial graded loading and unloading reduced the stiffness of the rock and weakened the strength of the rock.

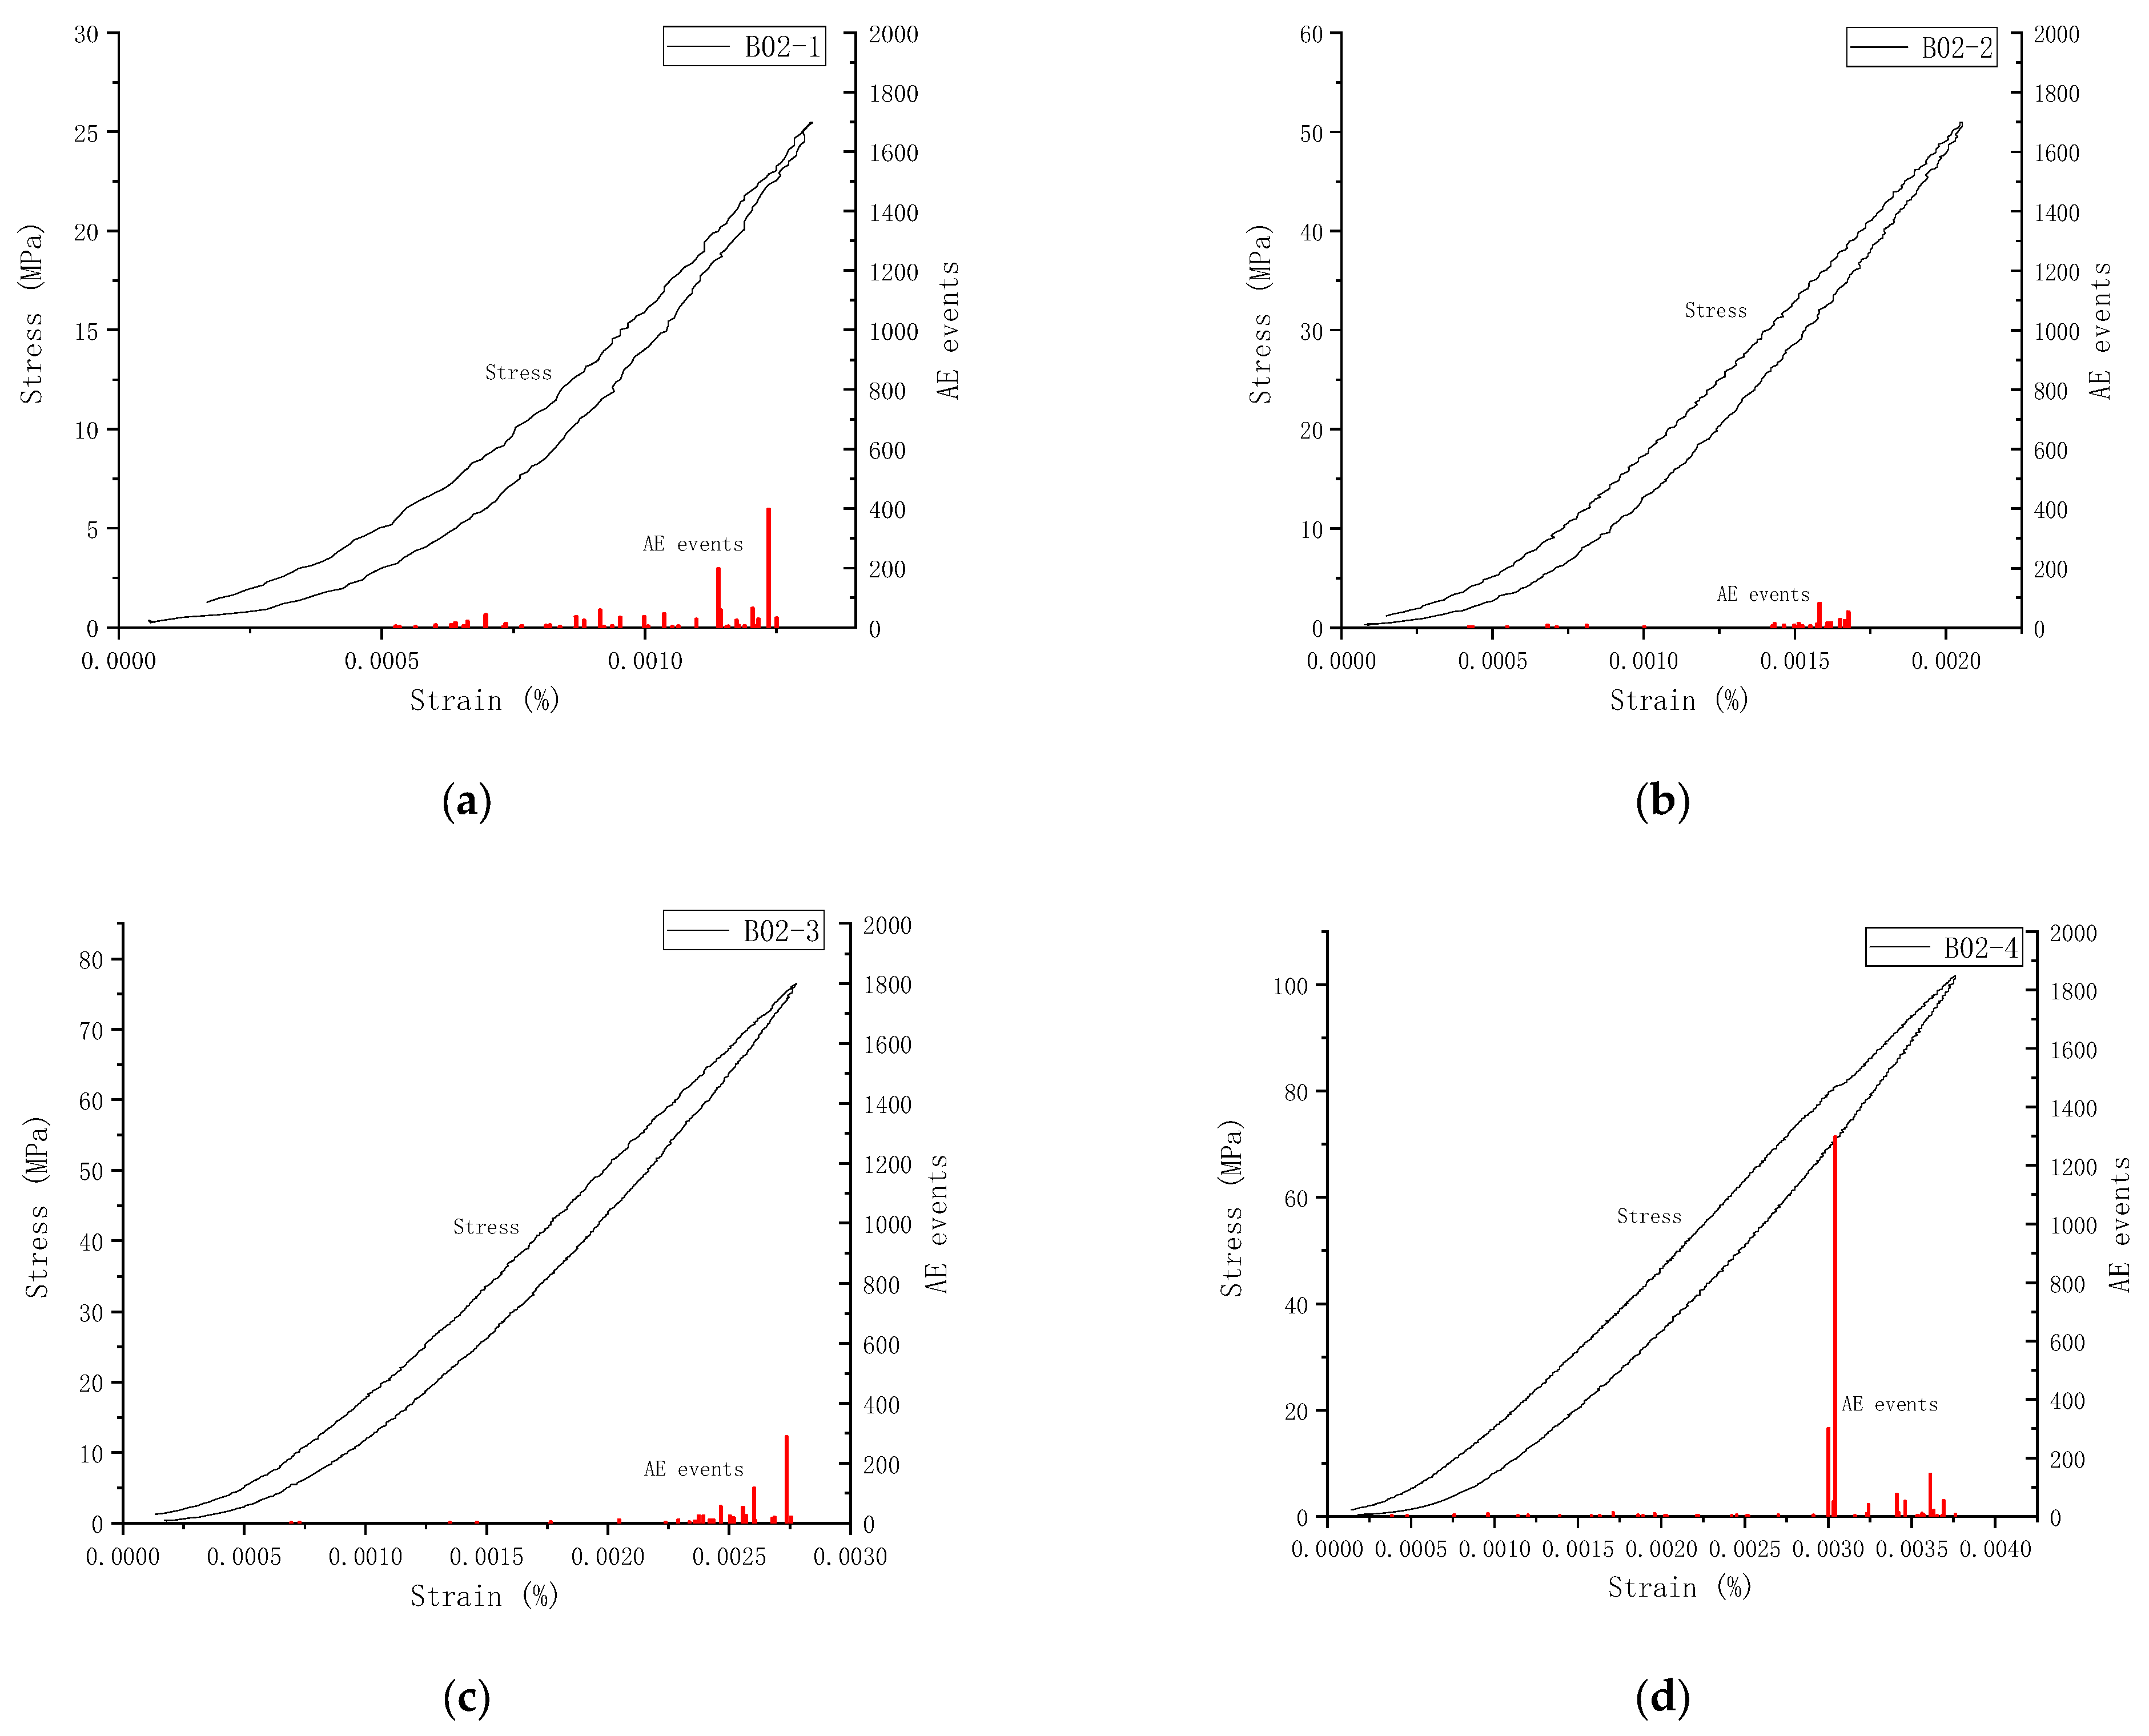
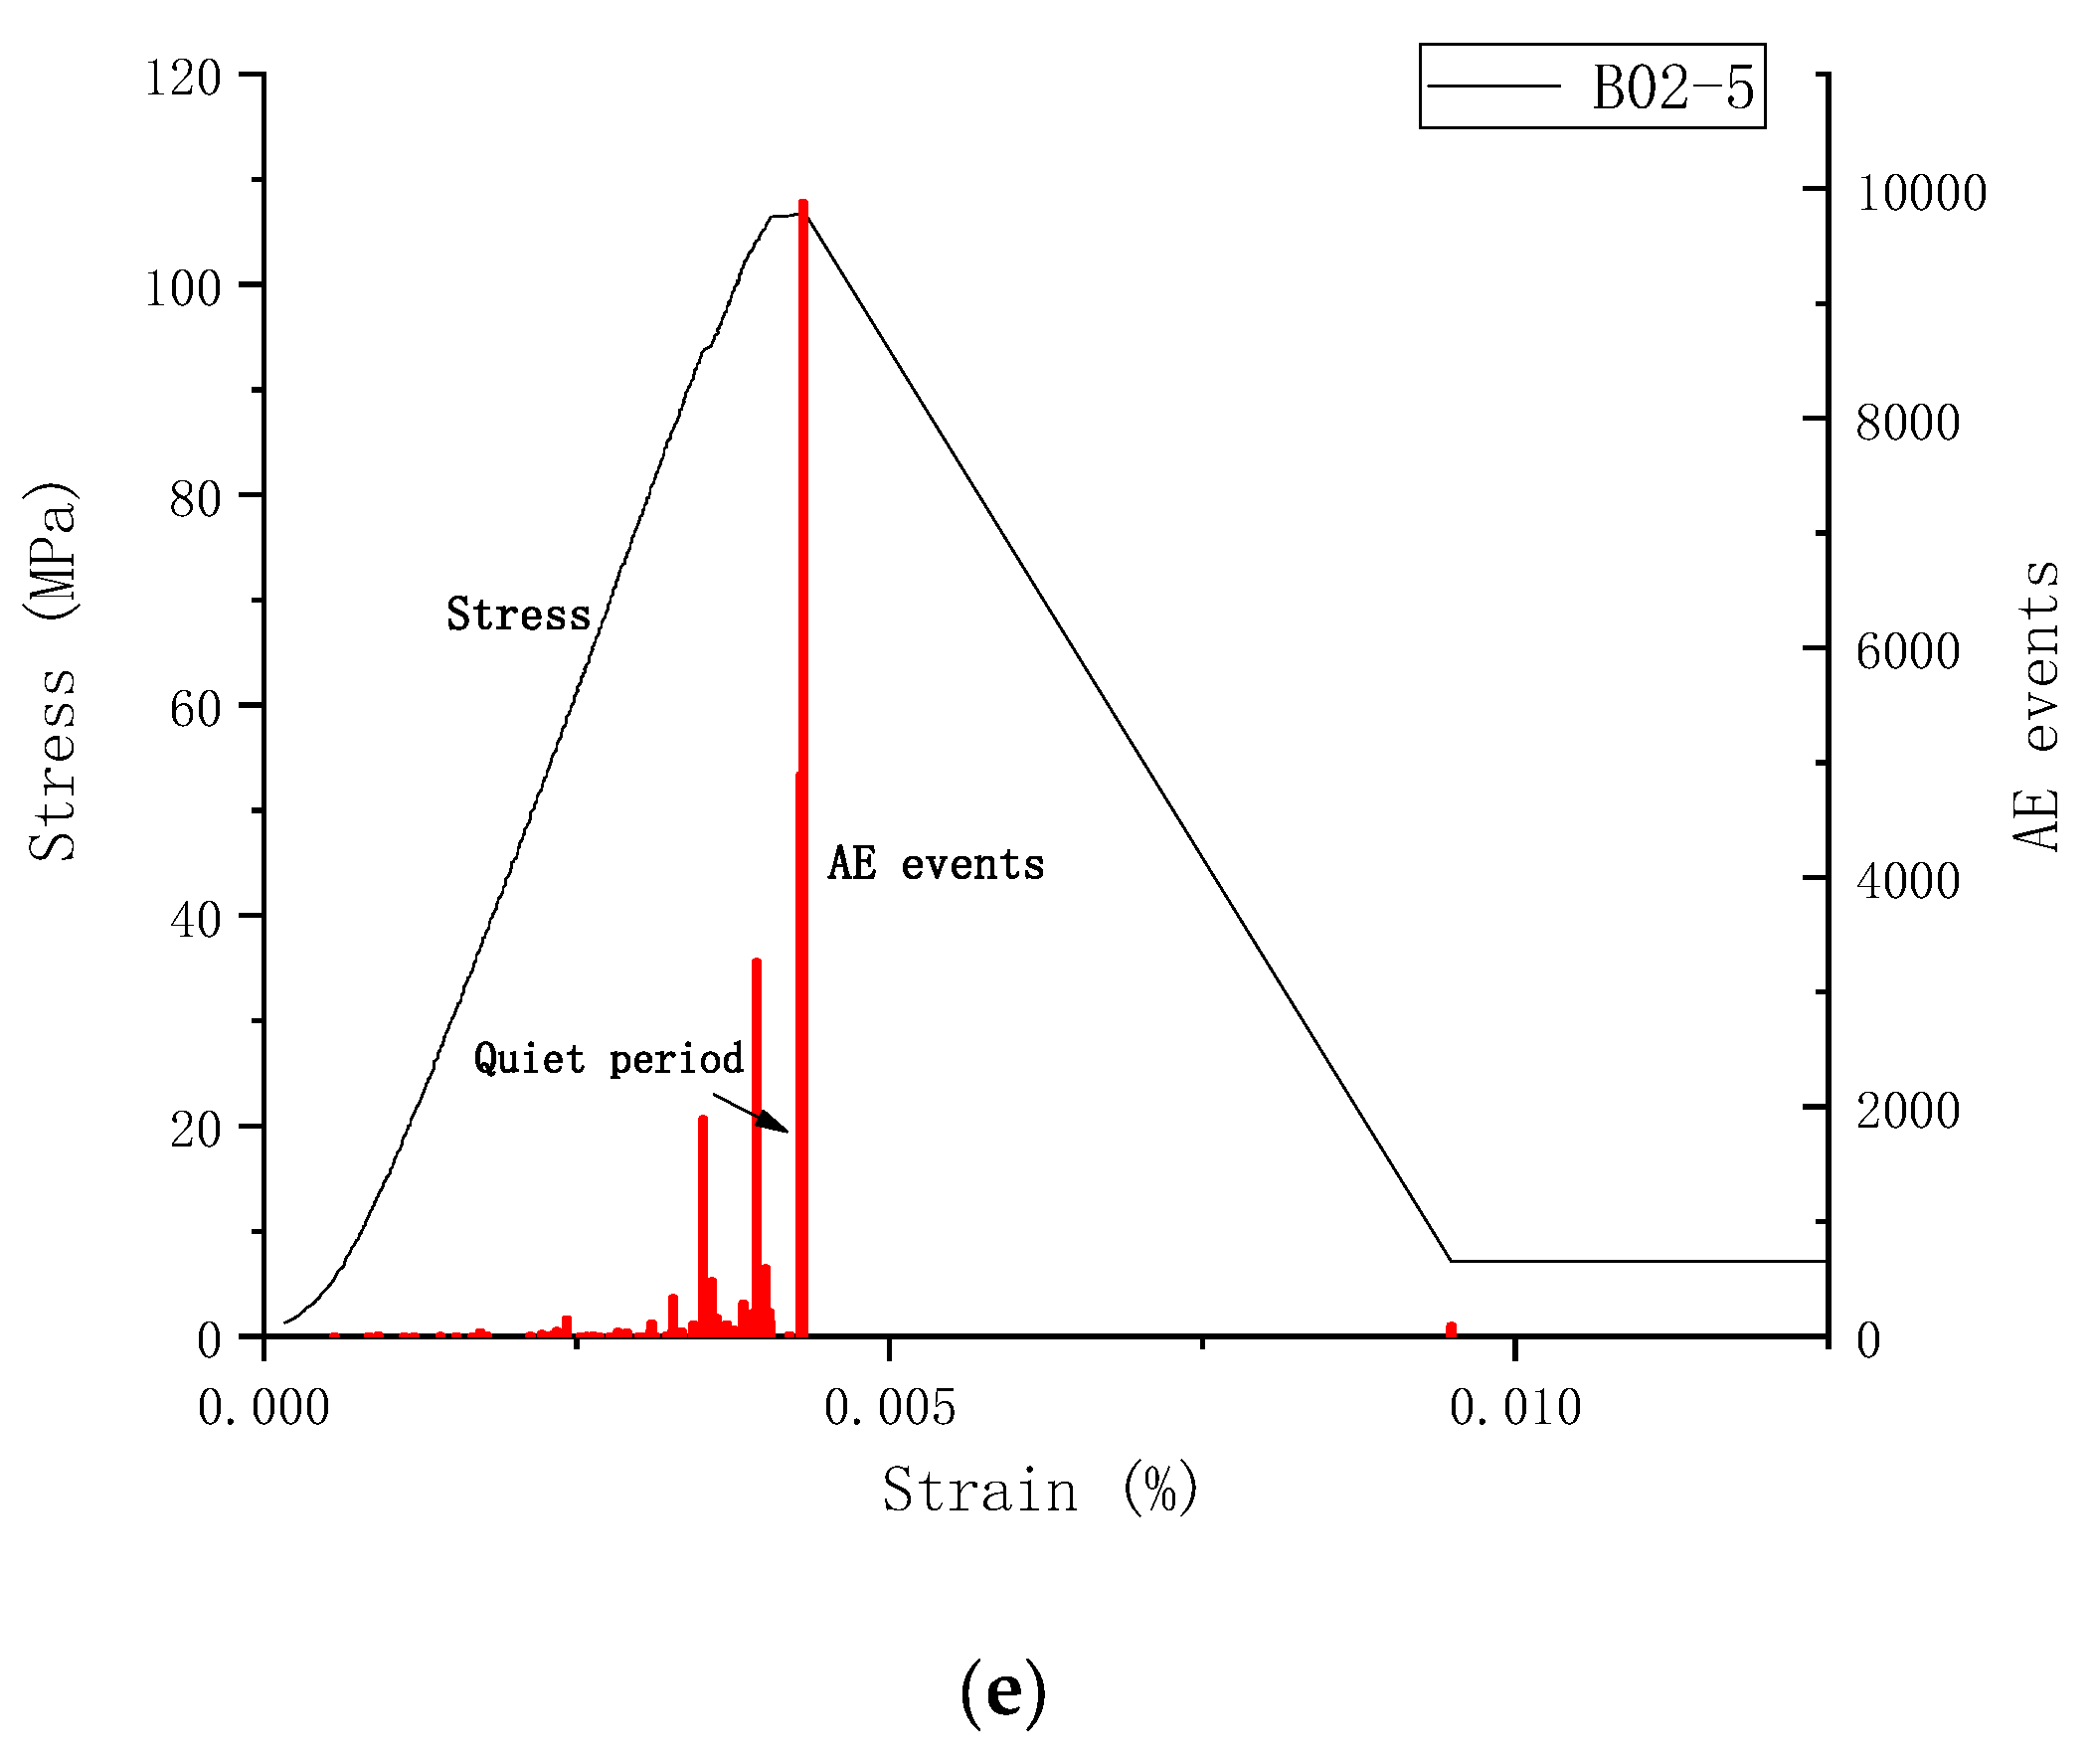
3.4. Acoustic Emission Characteristics Analysis

Considering the large amount of data, this paper uses B02 rock sample as an example to study and analyze the acoustic emission characteristics of metamorphic sandstone in uniaxial graded cyclic loading and unloading tests. The stress–strain curve and acoustic emission (AE) event characteristics of each cycle of the rock sample are shown in Figure 16.
In this study, we found that the acoustic emission signals of metasandstone rock in uniaxial graded cyclic loading and unloading tests were mainly generated in the loading phase, and almost no acoustic emission activity was generated in the unloading phase. The Kaiser effect and Felicity effect were also found in the uniaxial graded cyclic loading and unloading tests.
In Figure 16, during the first unloading cycle of the B02 rock sample, some acoustic emission signals were generated due to the friction and extrusion of crystal particles and microcracks in the rock sample, but the overall intensity of the signals was weak. The acoustic emission activity was further weakened during the second and third levels of cyclic addition and unloading of the rock sample compared with the first level, indicating that the internal damage development in the initial stage of linear deformation of the rock was low. The rock sample underwent nonlinear deformation during the fourth level of loading and unloading, and the acoustic emission activity increased compared with the previous levels. It is noteworthy that the rock samples exhibited a significant Kaiser effect during the loading and unloading tests in the second, third, and fourth levels [23,24].
The Kaiser effect means that the material will not produce obvious acoustic emissions when the loading stress does not exceed the upper limit of the upper-level stress. The cause of the Kaiser effect is the irreversible damage inside the material. However, during the fifth level of loading, the rock sample B02 produced significant acoustic emission before reaching the upper stress limit of the previous level. This is the Felicity effect, also known as the inverse Kaiser effect. The appearance of the Felicity effect shows that under the action of cyclic load, the internal damage of the rock continues to intensify, which reduces the upper limit of stress, leading to the continuous development of internal cracks in rock.
The B02 rock sample was finally damaged during the loading process of the fifth stage. It was found that, when the rock sample is macroscopically damaged, the acoustic emission number of the rock reaches the peak. However, between the last two obvious AE peaks before rock sample failure, the AE activity of rock samples tends to be relatively quiet, which is called the “quiet period” of AE activity.
The existence of the “quiet period” can be understood as the existing fissures in the rock needing a certain time to accumulate energy during further development and expansion. When the energy accumulation is sufficient, the internal cracks in the rock will immediately intersect and penetrate, and the rock samples will be destroyed, sending out strong acoustic emission signals. It can be assumed that the acoustic emission activity of the metasandstone will have a sudden rise and then a sudden fall immediately prior to damage, and the rock will be damaged soon after the sudden fall. This acoustic emission feature can be used to monitor and predict the destabilization of the rock in practical engineering.

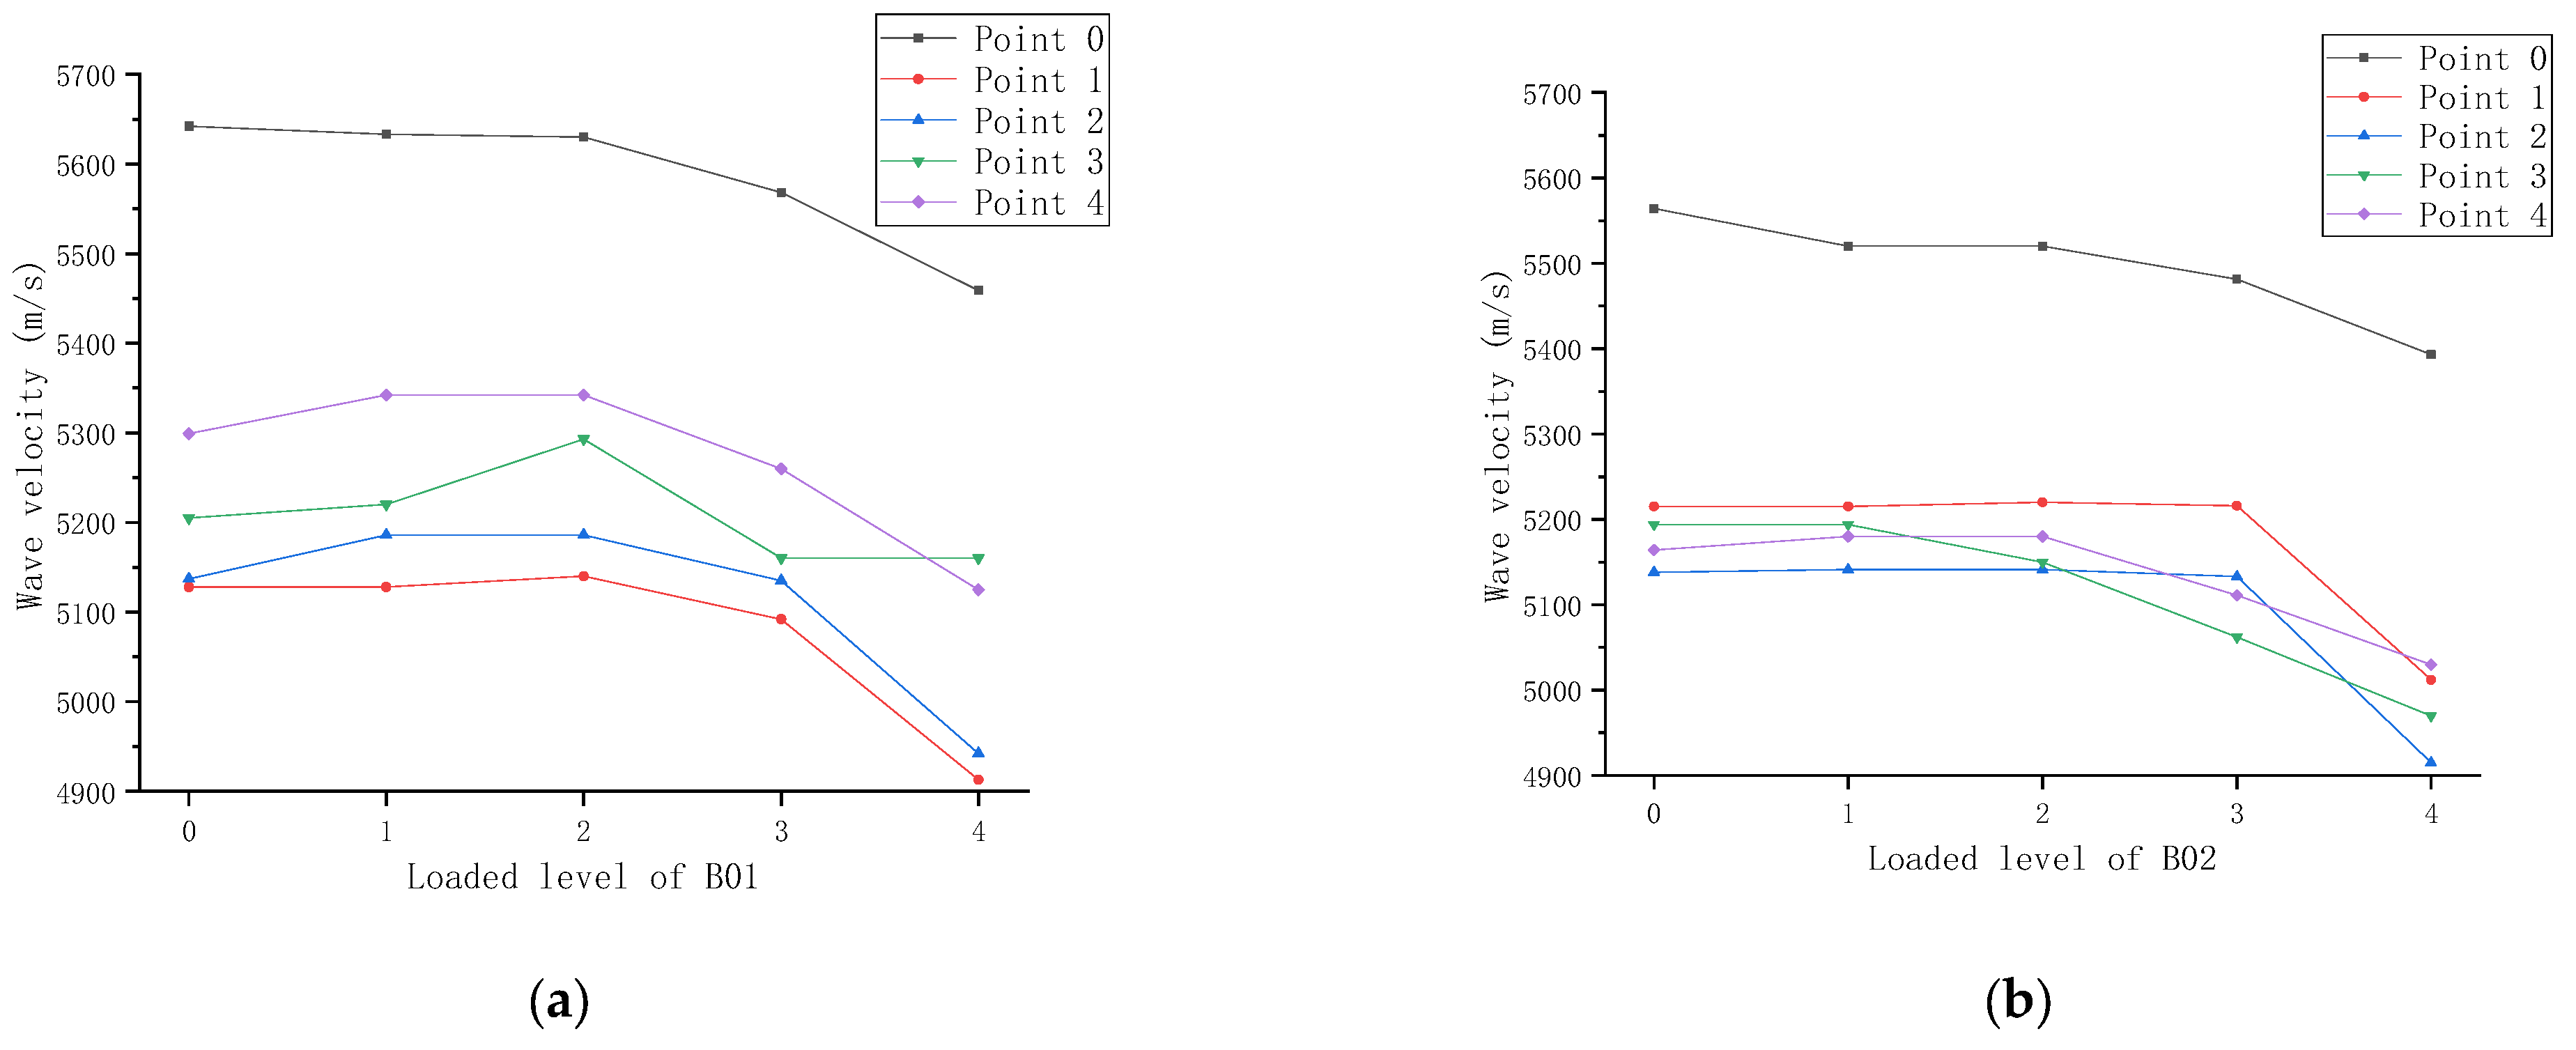
3.5. Wave Velocity Characteristics Analysis

The initial longitudinal wave data of rock samples B01–B06 are shown in Table 4. In order to show the trend of wave velocity at each point of the rock samples more intuitively, the initial wave velocity of rock samples was regarded as the wave velocity after unloading at level 0, and the relationship between the wave velocity and unloading level of rock samples is plotted. The variation in wave velocity at each point of the sample in the graded cyclic unloading test is shown in Figure 16.
In Figure 17, the wave velocities of B01, B02, B04, and B06 increase slightly after the first level unloading, because the first level unloading has a certain compression effect on the rock, and the overall density of the rock increases. The wave velocity of B03 and B05 decreases slightly, which is caused by the development of internal cracks of these samples with low strength. The development and expansion of cracks during unloading have a greater impact on the decline in wave velocity than compression and density.
After the second level unloading, the wave velocities of B01, B02, B04, and B06 remain basically unchanged, but the wave velocities of individual points increase or decrease, because the rock is heterogeneous, and there is certain variability in the structure and density changes of various points in the rock.
After the third level unloading, the wave velocities of B01, B02, B04, and B06 decrease at almost all points, and the relative decrease in wave velocities of B04 and B06 is more obvious. It shows that the unloading of this level has caused damage to the interior of the two rock samples, and the internal cracks are obviously developed and damaged.
After the 4th stage unloading, the wave velocities of B01 and B02 decrease significantly, indicating that further crack development and expansion continued to occur in the samples, and these samples were finally destroyed in the loading stage of the 5th level cycle. In terms of axial wave velocity, the axial wave velocity of the six samples after loading and unloading at all levels decreases, because the initiation and development of radial cracks enhances the reflection of ultrasonic waves in the axial direction, thus reducing the axial wave velocity of the samples. It can be concluded that the development of radial cracks in rock samples is driven by any level of unloading and loading.
From the relationship between the unloading level and the rate of decline of the wave velocity of the rock sample, it can be determined that there is a stress threshold. Below this threshold value, the wave velocity of rock samples will not decrease with the increase in stress; however, beyond this threshold value, with the increase in stress, there will be a qualitative change in the degree of rock damage, and the wave velocity of rock samples will drop rapidly. The phenomenon of a rapid decrease in wave velocity can be used in engineering to predict the damage instability of rock masses.
Table 5 and Table 6 show the comparison results of radial initial wave velocity, axial initial wave velocity, and the last measured radial wave velocity and axial velocity of the rock samples, respectively. By comparing the differences between the final changes in radial and axial wave velocities, it is found that the decrease in radial wave velocity of rock samples is significantly larger than that of axial wave velocity, which indicates that the development and expansion of internal cracks in the axial direction is higher than that in the radial direction in the process of graded cyclic loading and unloading; that is, the cracks tend to develop and expand along the direction of maximum stress.
In general, the graded cyclic unloading will lead to the further development and expansion of joint fissures in the rock. Then, the wave velocity of the rock sample will decrease, although the average value of the overall wave velocity decrease in the rock sample is only 3.4%. Considering that the wave velocity of rock is still in a rapid downward trend after the last cyclic unloading, it is not difficult to speculate that, when the peak strength is reached, the wave velocity of rock will further decrease, and the final decrease will be more than 3.4%.

4. Conclusions

(1)
In the uniaxial graded cyclic loading and unloading test, the crack sprouting and development inside the metasandstone samples were higher than those in the uniaxial loading test. The damage pattern of the rock samples had typical fatigue damage characteristics, and the damage pattern was more dispersed when compared with that in the uniaxial loading condition. Compared with the uniaxial loading test, the uniaxial graded cyclic loading and unloading caused more irreversible damage to the interior of the rock samples, which enhanced the plasticity of the metasandstone.
(2)
In the uniaxial graded cyclic loading and unloading test, the acoustic emission signals of the metasandstone samples were mainly generated in the loading phase, and almost no acoustic emission activity was generated in the unloading phase. In the uniaxial graded cyclic loading and unloading tests, the Kaiser effect and Felicity effect were evident in the metasandstone samples.
(3)
During the last loading process before the damage of metamorphic sandstone samples, the quiet period of acoustic emission occurs. The acoustic emission activity of metasandstone will rise suddenly before the damage, and then drop suddenly. The rock will be damaged soon after the sudden drop. In practical engineering, the quiet period of acoustic emission activity can be used to monitor and predict the instability of rock mass.
(4)
There is a stress threshold of wave velocity variation in metasandstone. Below this threshold value, the internal damage of rock sample is weak, and the wave velocity does not decrease significantly with the increase in stress. When the stress exceeds this threshold value, the damage degree of rock will change qualitatively with the increase in stress, and the wave velocity of rock sample will decrease rapidly. The rapid decline in wave velocity can be used to predict the damage of rock mass stability in engineering.

Author Contributions

Methodology, D.L. and Y.T.; formal analysis, S.J.; data curation, S.J.; writing—original draft preparation, S.J.; writing—review and editing, S.J. and Y.T.; project administration, D.L. and Y.T.; funding acquisition, D.L. and Y.T. All authors have read and agreed to the published version of the manuscript.

Funding

The research was funded by the Initiation fund for postdoctoral research of Central South University, grant number 228697.

Institutional Review Board Statement

The research of this thesis does not involve human and animals.

Informed Consent Statement

The research of this thesis does not involve human and animals.

Data Availability Statement

The data that support the findings of this study are available upon request from the authors.

Acknowledgments

The authors thank Road & Bridge South China Engineering Co., Ltd. for their assistance with conducting the experiments.

Conflicts of Interest

The authors declare no conflict of interest.

References

  1. Lemaitre, J.; Chaboche, J.L. Mechanics of Solid Materials; Cambridge University Press: Cambridge, UK, 1990. [Google Scholar]
  2. Singh, U.K.; Digbyp, J. A continuum damage model for simulation of the progressive failure of brittle rocks. Int. J. Solids Struct. 1989, 25, 647–663. [Google Scholar] [CrossRef]
  3. Li, C.; Nordlund, E. Experimental verification of the Kaiser effect in rocks. Rock Mech. Rock Eng. 1993, 26, 333–351. [Google Scholar] [CrossRef]
  4. Wu, L.; Zhou, K.; Gao, F.; Gu, Z.; Yang, C. Research on the Mechanical Characteristics of Cyclic Loading and Unloading of Rock Based on Infrared Thermal Image Analysis. Math. Probl. Eng. 2021, 2021, 5578629. [Google Scholar] [CrossRef]
  5. Zhang, M.; Meng, Q.; Liu, S.; Qian, D.; Zhang, N. Impacts of Cyclic Loading and Unloading Rates on Acoustic Emission Evolution and Felicity Effect of Instable Rock Mass. Adv. Mater. Sci. Eng. 2018, 2018, 8365396. [Google Scholar] [CrossRef] [Green Version]
  6. Wang, H.; Li, J.; Wen, Z. Mechanical Behavior Evolution and Damage Characterization of Coal under Different Cyclic Engineering Loading. Geofluids 2020, 2020, 8812188. [Google Scholar] [CrossRef]
  7. Wang, T.; Wang, C.; Xue, F.; Wang, L.; Teshome, B.H.; Xue, M. Acoustic Emission Characteristics and Energy Evolution of Red Sandstone Samples under Cyclic Loading and Unloading. Shock Vib. 2021, 2021, 8849137. [Google Scholar] [CrossRef]
  8. Guo, J.; Feng, G.-R.; Qi, T.-Y.; Wang, P.; Yang, J.; Li, Z.; Bai, J.; Du, X.; Wang, Z. Dynamic Mechanical Behavior of Dry and Water Saturated Igneous Rock with Acoustic Emission Monitoring. Shock Vib. 2018, 2018, 2348394. [Google Scholar] [CrossRef] [Green Version]
  9. Wang, K.; Li, X.; Huang, Z.; Zhao, M. Experimental Study on Acoustic Emission and Resistivity Response of Sandstone under Constant Amplitude Cyclic Loading. Adv. Mater. Sci. Eng. 2021, 2021, 6637200. [Google Scholar] [CrossRef]
  10. Wu, J.; Wang, E.; Ren, X.; Zhang, M. Size effect of concrete specimens on the acoustic emission characteristics under uniaxial compression conditions. Adv. Mater. Sci. Eng. 2017, 2017, 7652313. [Google Scholar] [CrossRef]
  11. Liang, D.; Zhang, N.; Rong, H. An experimental and numerical study on acoustic emission in the process of rock damage at different stress paths. Geofluids 2021, 2021, 8047755. [Google Scholar] [CrossRef]
  12. Gong, F.; Yan, J.; Wang, Y.; Luo, S. Experimental Study on Energy Evolution and Storage Performances of Rock Material under Uniaxial Cyclic Compression. Shock Vib. 2020, 2020, 6637200. [Google Scholar] [CrossRef]
  13. Pei, F.; Ji, H.; Zhao, J.; Geng, J. Energy Evolution and AE Failure Precursory Characteristics of Rocks with Different Rockburst Proneness. Adv. Civ. Eng. 2020, 2020, 8877901. [Google Scholar] [CrossRef]
  14. Zhao, G.; Wang, C.; Liang, D. Comparative experimental studies of acoustic emission characteristics of sandstone and mudstone under the impacts of cyclic loading and unloading. Int. J. Distrib. Sens. Netw. 2018, 14, 467611360. [Google Scholar] [CrossRef] [Green Version]
  15. Meng, Q.; Chen, Y.; Zhang, M.; Han, L.; Pu, H.; Liu, J. On the Kaiser Effect of Rock under Cyclic Loading and Unloading Conditions: Insights from Acoustic Emission Monitoring. Energies 2019, 12, 3255. [Google Scholar] [CrossRef] [Green Version]
  16. Li, J.; Hong, L.; Zhou, K.; Xia, C.; Zhu, L. Limestone Acoustic Emission Evolution Characteristics Under Different Experimental Loading and Unloading Conditions. Front. Phys. 2020, 8, 590710. [Google Scholar] [CrossRef]
  17. Saroglou, C.; Kallimogiannis, V. Fracturing process and effect of fracturing degree on wave velocity of a crystalline rock. J. Rock Mech. Geotech. Eng. 2017, 9, 797–806. [Google Scholar] [CrossRef]
  18. Ding, Q.; Song, S.; Pia, G. Experimental Investigation of the Relationship between the P-Wave Velocity and the Mechanical Properties of Damaged Sandstone. Adv. Mater. Sci. Eng. 2016, 7654234. [Google Scholar] [CrossRef] [Green Version]
  19. Liu, Y.; Qiao, L.; Li, Y.; Ma, G.; Golosov, A.M.; Gong, F. Ultrasonic Spectrum Analysis of Granite Damage Evolution Based on Dry-Coupled Ultrasonic Monitoring Technology. Adv. Civ. Eng. 2020, 2020, 8881800. [Google Scholar] [CrossRef]
  20. Li, H.; Dong, Z.; Ouyang, Z.; Liu, B.; Yuan, W.; Yin, H. Experimental Investigation on the Deformability, Ultrasonic Wave Propagation, and Acoustic Emission of Rock Salt Under Triaxial Compression. Appl. Sci. 2019, 9, 635. [Google Scholar] [CrossRef] [Green Version]
  21. Xiao, P.; Zheng, J.; Dou, B.; Tian, H.; Cui, G.; Kashif, M. Mechanical Behaviors of Granite after Thermal Shock with Different Cooling Rates. Energies 2021, 14, 3721. [Google Scholar] [CrossRef]
  22. Liu, X.; Wang, X.; Wang, E.; Liu, Z.; Xu, X. Study on ultrasonic response to mechanical structure of coal under loading and unloading condition. Shock. Vib. 2017, 2017, 7643451. [Google Scholar] [CrossRef] [Green Version]
  23. Kaiser, E.J. A Study of Acoustic Phenomena in Tensile Test. Ph.D. Thesis, Technische Hochschule München, München, Germany, 1953. [Google Scholar]
  24. Goodman, R.E. Subaudible noise during compression of rock. Geol. Soc. Am. Bull. 1963, 74, 487–490. [Google Scholar] [CrossRef]
Figure 1. Wave velocity measuring points of rock samples.
Applsci 12 06310 g001
Figure 2. Rock samples.
Applsci 12 06310 g002
Figure 3. Rock sample for uniaxial graded cyclic loading and unloading test.
Applsci 12 06310 g003
Figure 5. EDS energy spectrum analysis of metasandstone samples. (a) EDS image of constituent elements; (b) Total number spectrum of element distribution diagram of rock sample.
Applsci 12 06310 g005aApplsci 12 06310 g005b
Figure 6. X-ray diffraction analysis results of rock samples.
Applsci 12 06310 g006
Figure 7. Failure mode of rock sample under uniaxial compression. (a) A01; (b) A02; (c) A03.
Applsci 12 06310 g007
Figure 8. Failure mode of rock uniaxial graded cyclic loading and unloading test. (a) B01; (b) B02; (c) B03; (d) B04; (e) B05; (f) B06.
Applsci 12 06310 g008
Figure 9. Internal crack development of a rock sample during uniaxial compression test.
Applsci 12 06310 g009
Figure 10. Internal cracks of a rock sample during uniaxial graded cyclic loading and unloading.
Applsci 12 06310 g010
Figure 11. External damage of rock sample during uniaxial graded cyclic loading and unloading. (a) B02; (b) B04; (c) B05.
Applsci 12 06310 g011
Figure 12. Uniaxial compressive stress–strain curves.
Applsci 12 06310 g012
Figure 13. Uniaxial graded cyclic loading and unloading stress–strain curves of rock. (a) Stress–strain curve of B01. (b) Stress–strain curve of B02. (c) Stress–strain curve of B03. (d) Stress–strain curve of B04. (e) Stress–strain curve of B05. (f) –strain curve of B06.
Applsci 12 06310 g013
Figure 14. Relationship curve between rock sample cycle level and elastic modulus.
Applsci 12 06310 g014
Figure 15. Relationship between final cycle elastic modulus and initial elastic modulus of rock sample.
Applsci 12 06310 g015
Figure 16. Relationship between stress–strain curve and AE events of each cycle of rock sample. (a) Level 1 complete cycle; (b) Level 2 complete cycle; (c) Level 3 complete cycle; (d) Level 4 complete cycle; (e) Level 5 uniaxial compression.
Applsci 12 06310 g016aApplsci 12 06310 g016b
Figure 17. Uniaxial loading and unloading levels of rock samples and changes of point wave velocity. (a) Wave velocity change of rock sample B01; (b) Wave velocity change of rock sample B02; (c) Wave velocity change of rock sample B03; (d) Wave velocity change of rock sample B04; (e) Wave velocity change of rock sample B05. (f) Wave velocity change of rock sample B06.
Applsci 12 06310 g017aApplsci 12 06310 g017b
Table 1. Basic parameters of test rock samples.
Test ItemsRock SamplesHeight/mmDiameter/mmAverage Wave Velocity/m·s−1
Uniaxial compressionA0199.8550.115247
A02100.2949.895305
A03100.1850.235266
Uniaxial staged cyclic loading and unloadingB0199.9249.905282
B02100.0449.965255
B03100.1149.835141
B04100.1549.975149
B05100.1250.035115
B06100.2149.995182
Table 2. Strength data of rock sample in the uniaxial compression test.
Rock SamplesUCS/MPaE/GPaR0/MPaE0/GPa
A01124.629.9
A02137.928.8126.929.8
A03118.230.8
Table 3. Strength data of uniaxial graded cyclic loading and unloading tests of rock samples.
Rock SamplesNumber of
Complete Cycles
UCS/MPaE/GPaRb/MPaEb/GPa
B014110.529.6
B024107.126.4
B03267.820.387.422.9
B04390.920.0
B05255.514.6
B06392.726.5
Table 4. Initial wave velocity at each point of rock sample (m·s−1).
Rock SamplesPoint 0Point 1Point 2Point 3Point 4
B0156425128513752055299
B0255645215513851945164
B0354565142498750705051
B0455135108497250515100
B0554105112516350084950
B0655255092515451235017
Table 5. Variation of radial wave velocity of rock sample.
Rock SamplesInitial Wave
Velocity/m·s−1
Final Wave
Velocity/m·s−1
Decline Ratio/%Ratio Mean/%
B01519250353.0
B02517849823.8
B03506348194.83.7
B04505849063.0
B05504248284.2
B06509749233.4
Table 6. Variation of axial wave velocity of rock sample.
Rock SamplesInitial Wave
Velocity/m·s−1
Final Wave
Velocity/m·s−1
Decline Ratio/%Ratio Mean/%
B01564254593.2
B02556453933.1
B03545552403.93.1
B04551353752.5
B05541052173.6
B06552553952.4
Publisher’s Note: MDPI stays neutral with regard to jurisdictional claims in published maps and institutional affiliations.

