
Vanadium and Cobalt Occurrence in the Fe-Ti-V Oxide Deposits Related to Mesoproterozoic AMCG Complex in NE Poland


Abstract
:1. Introduction
2. Geological Setting
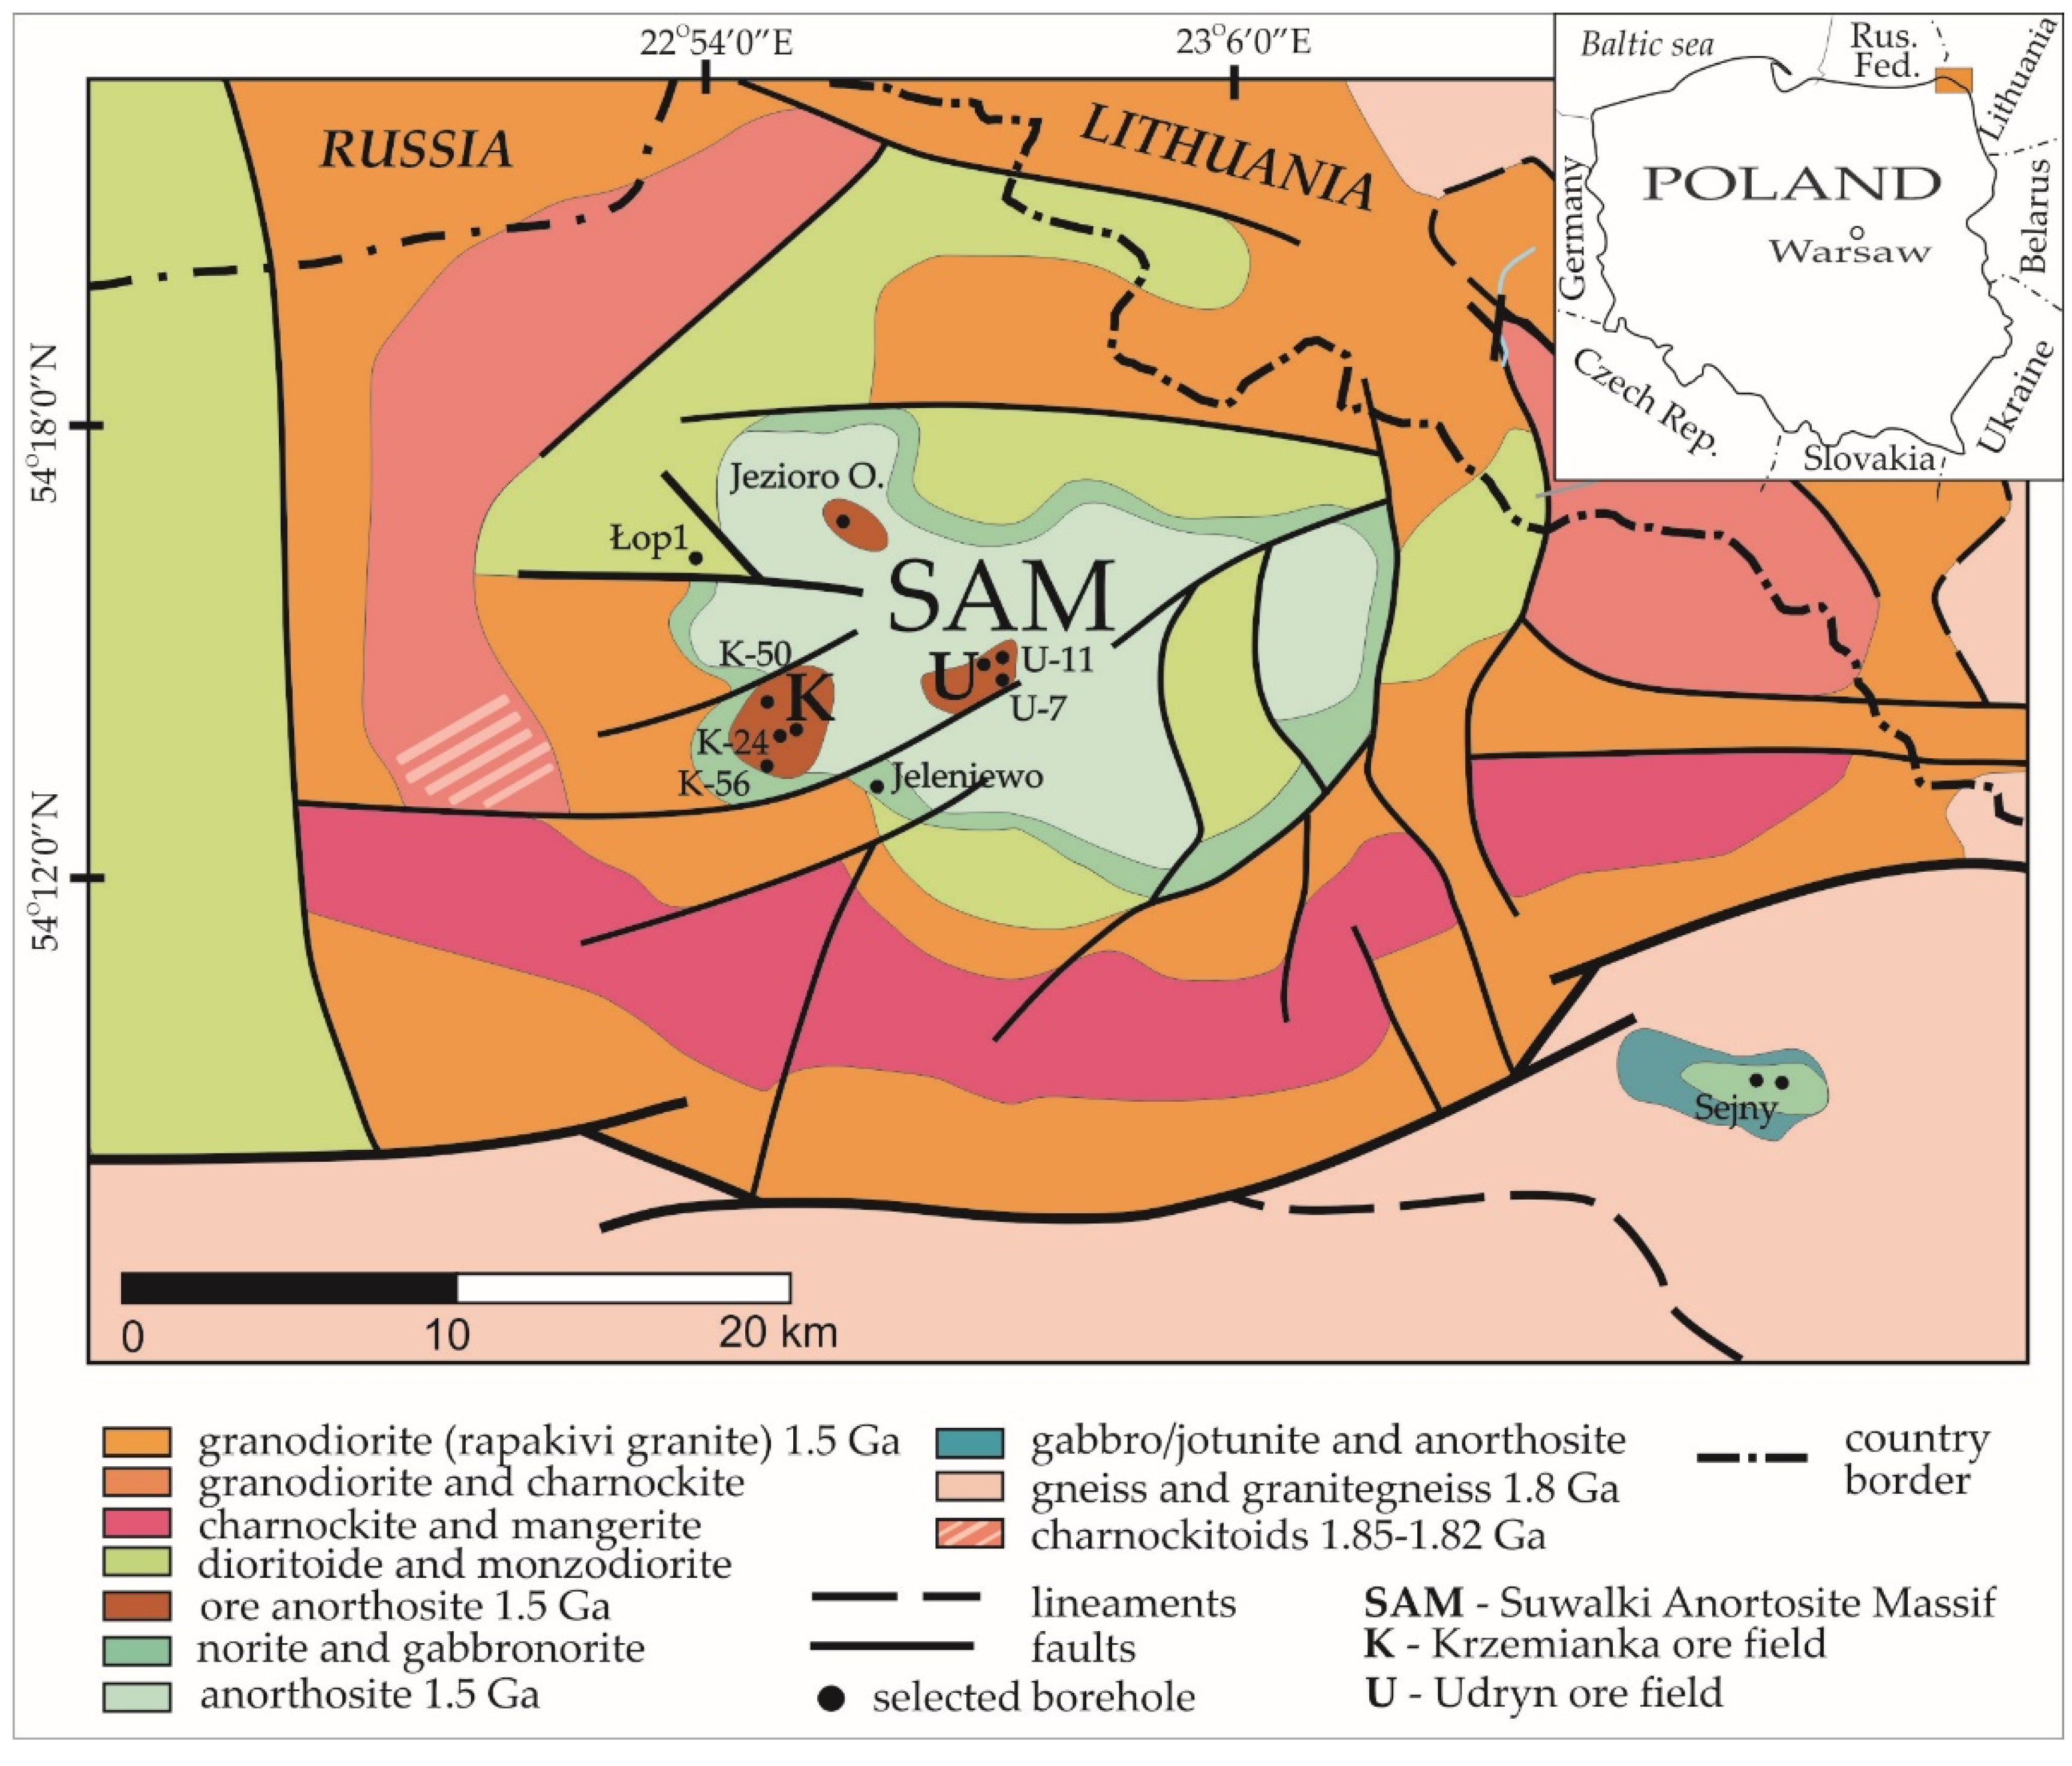
2.1. Regional Geology
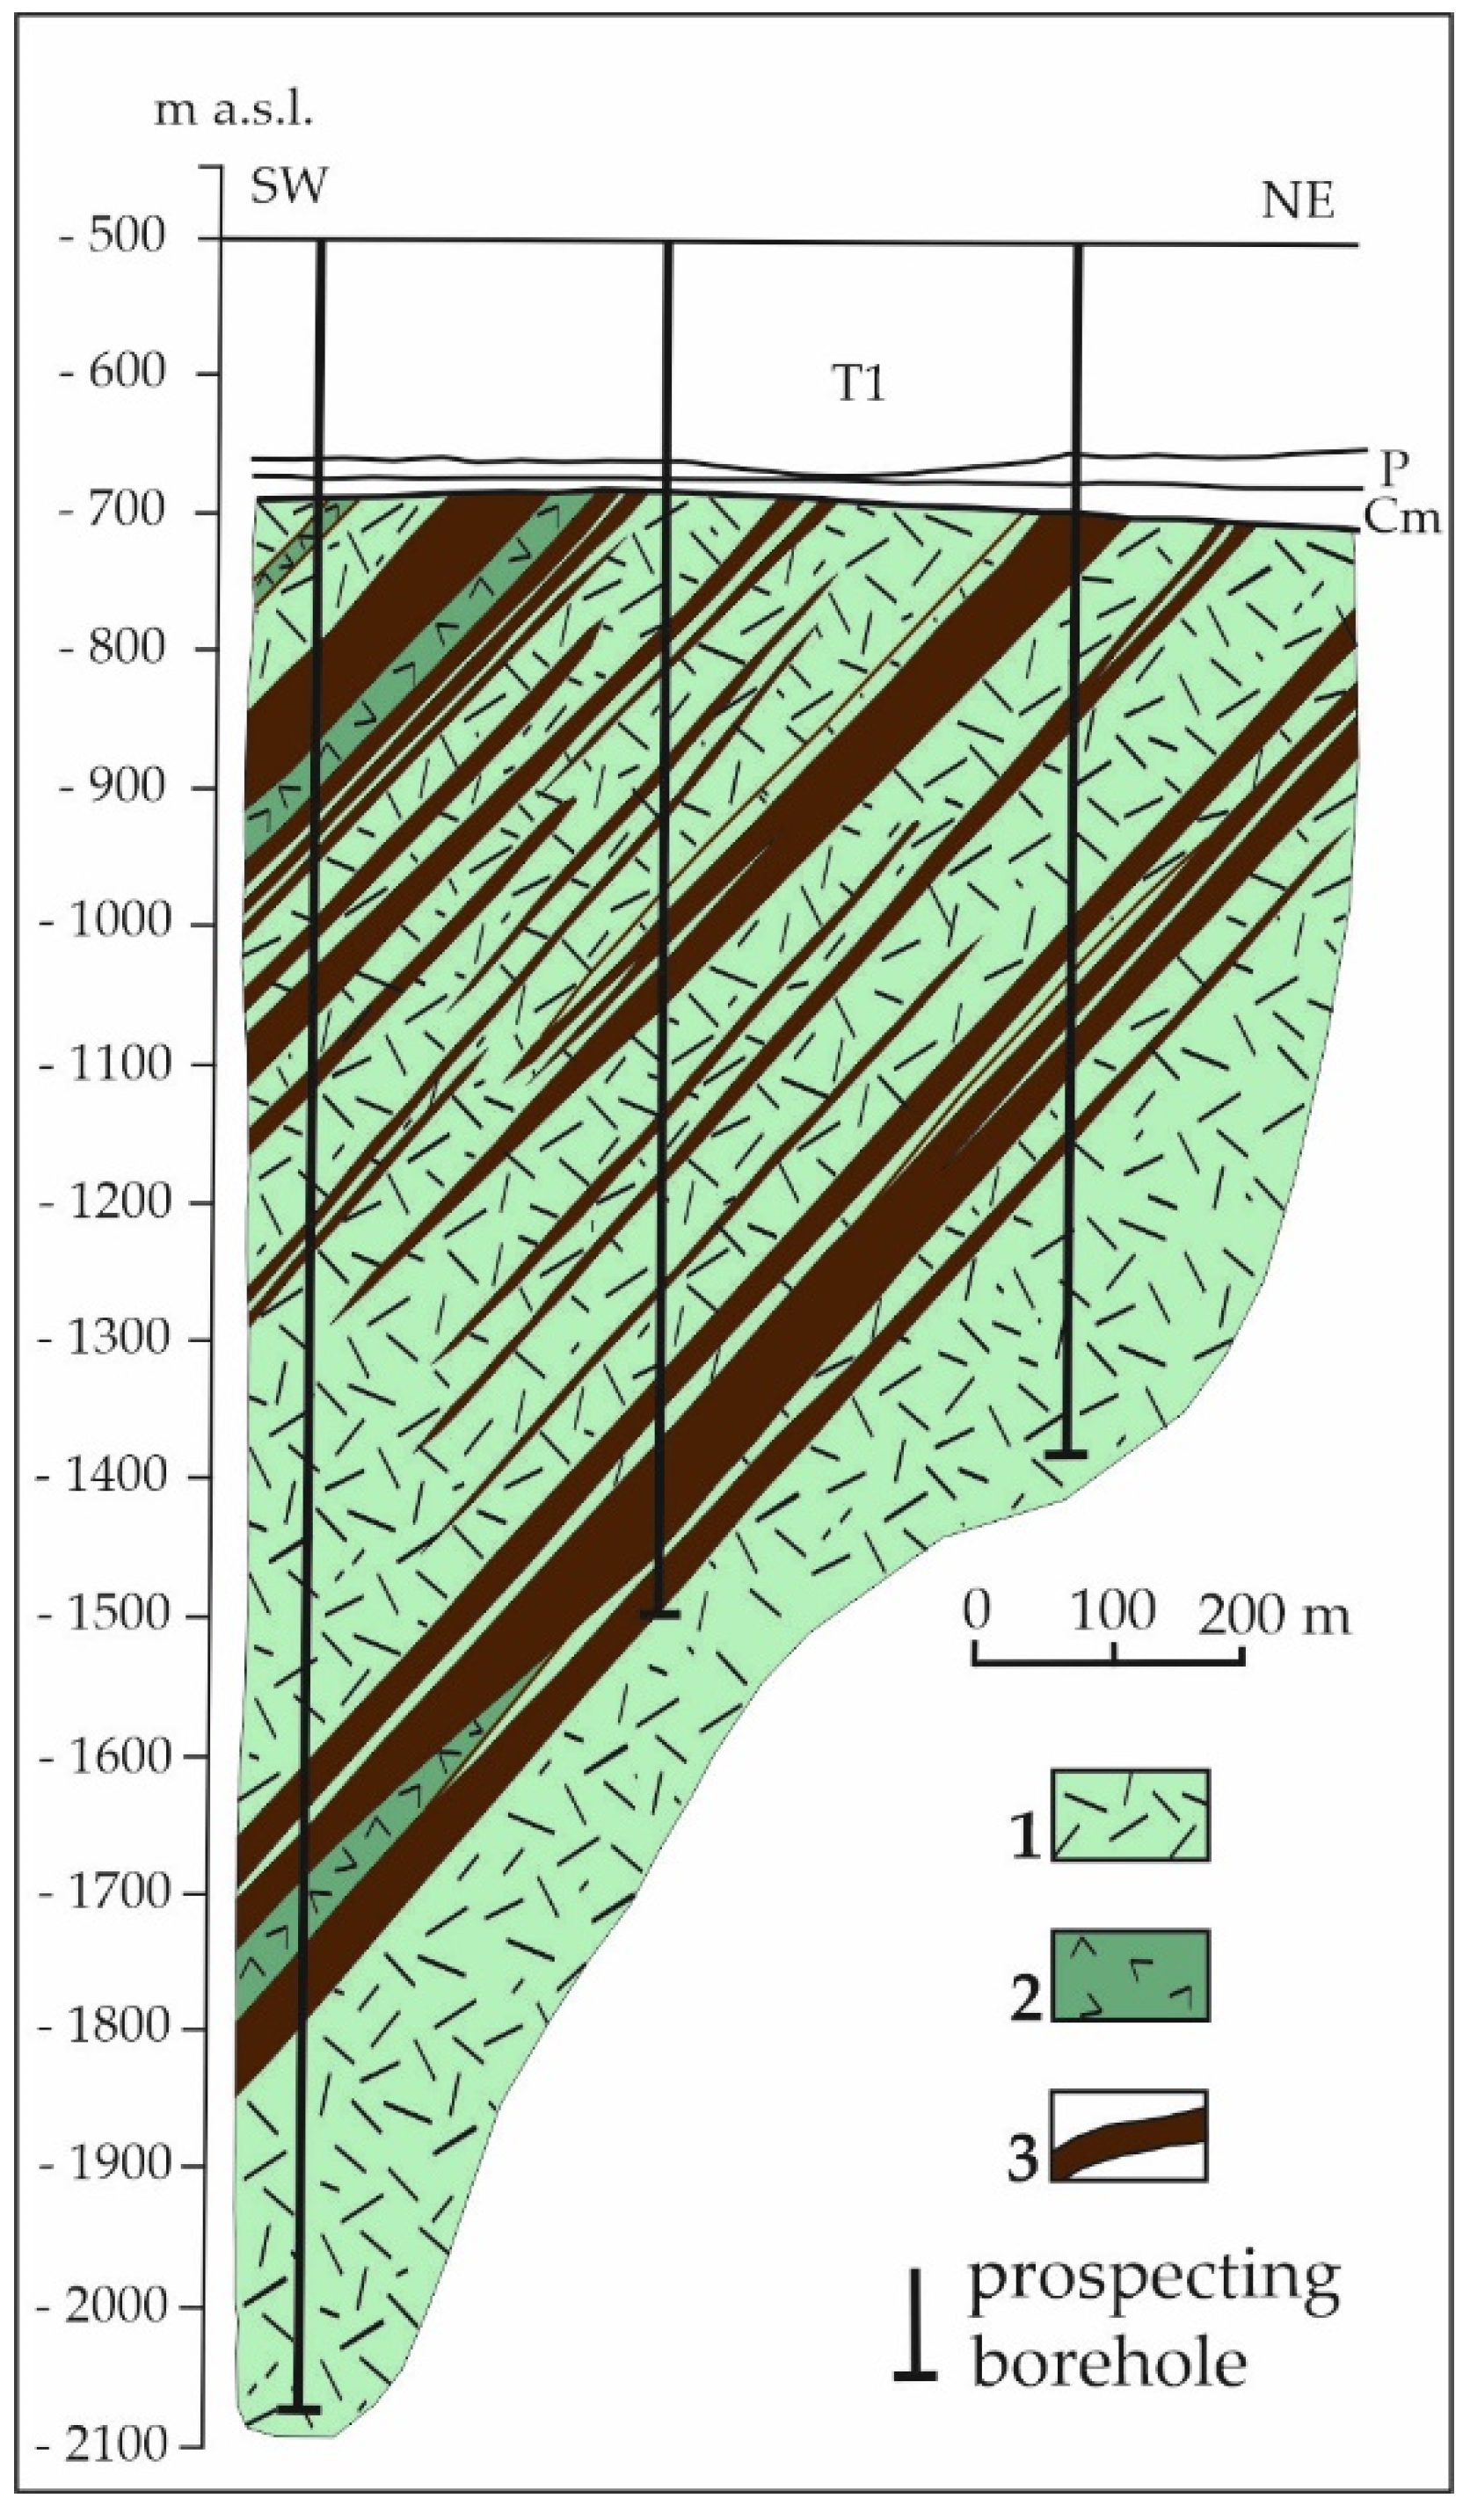
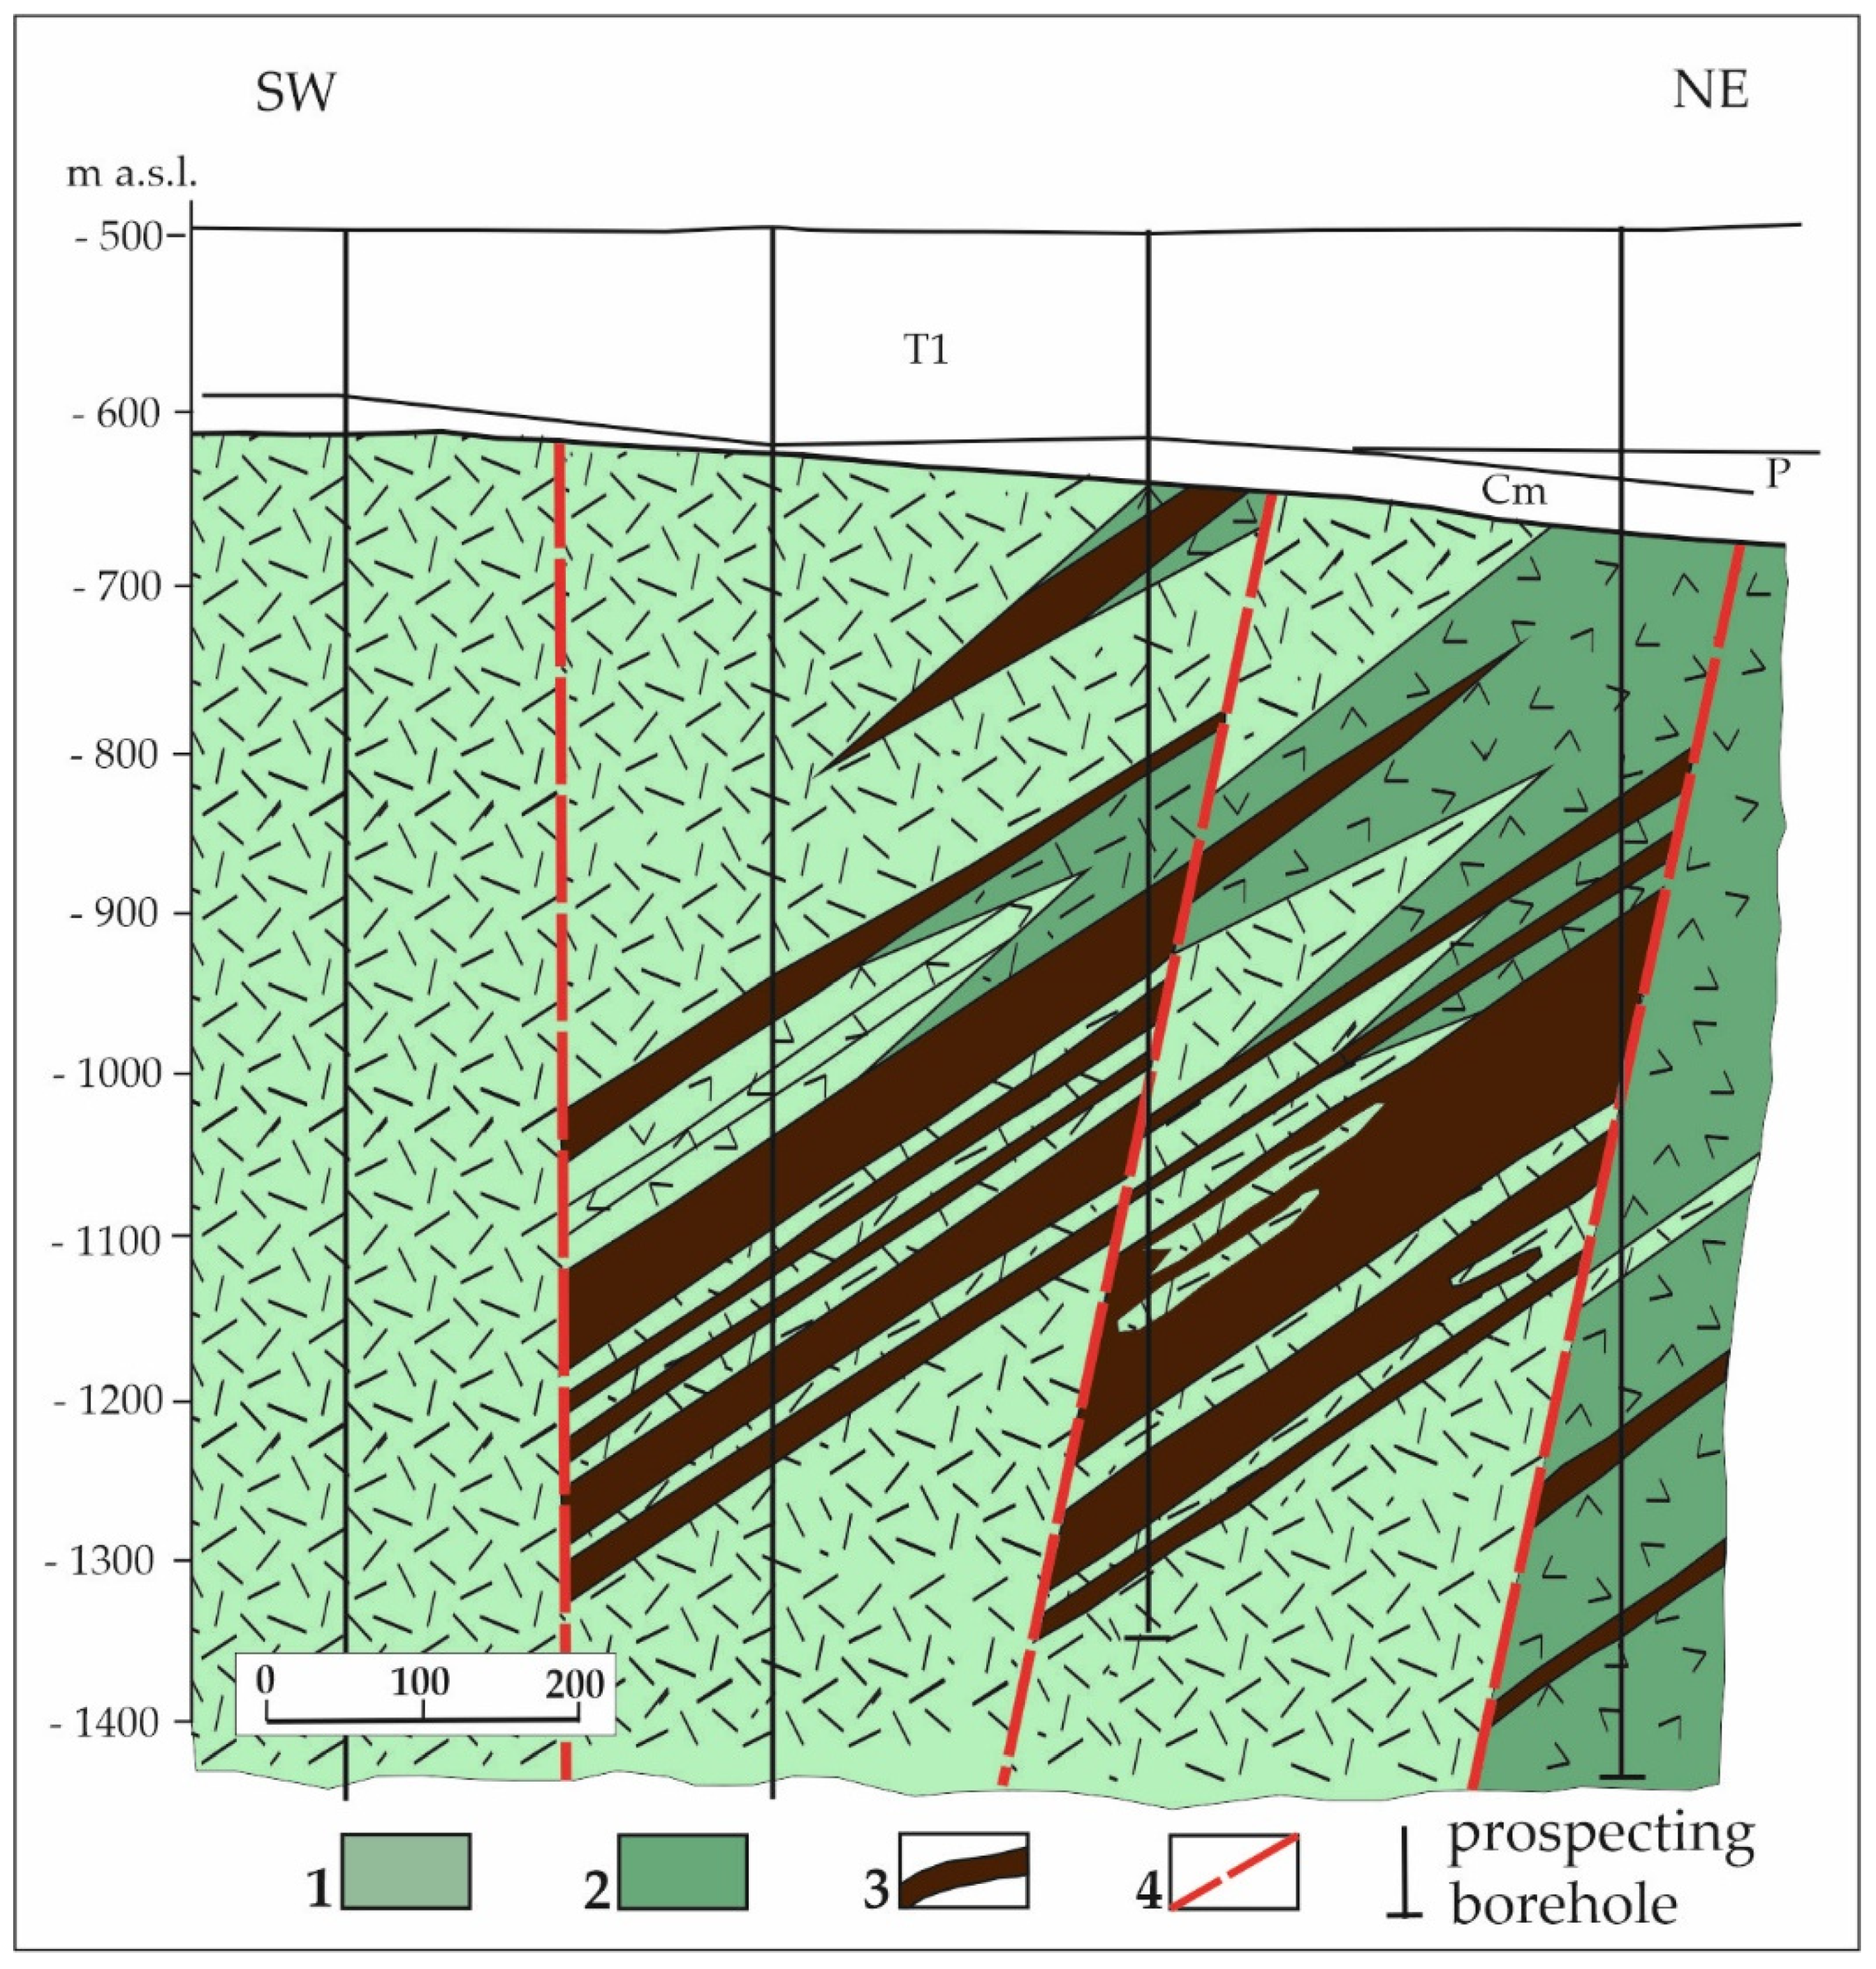
2.2. Geology of Fe-Ti-V Oxide Deposits
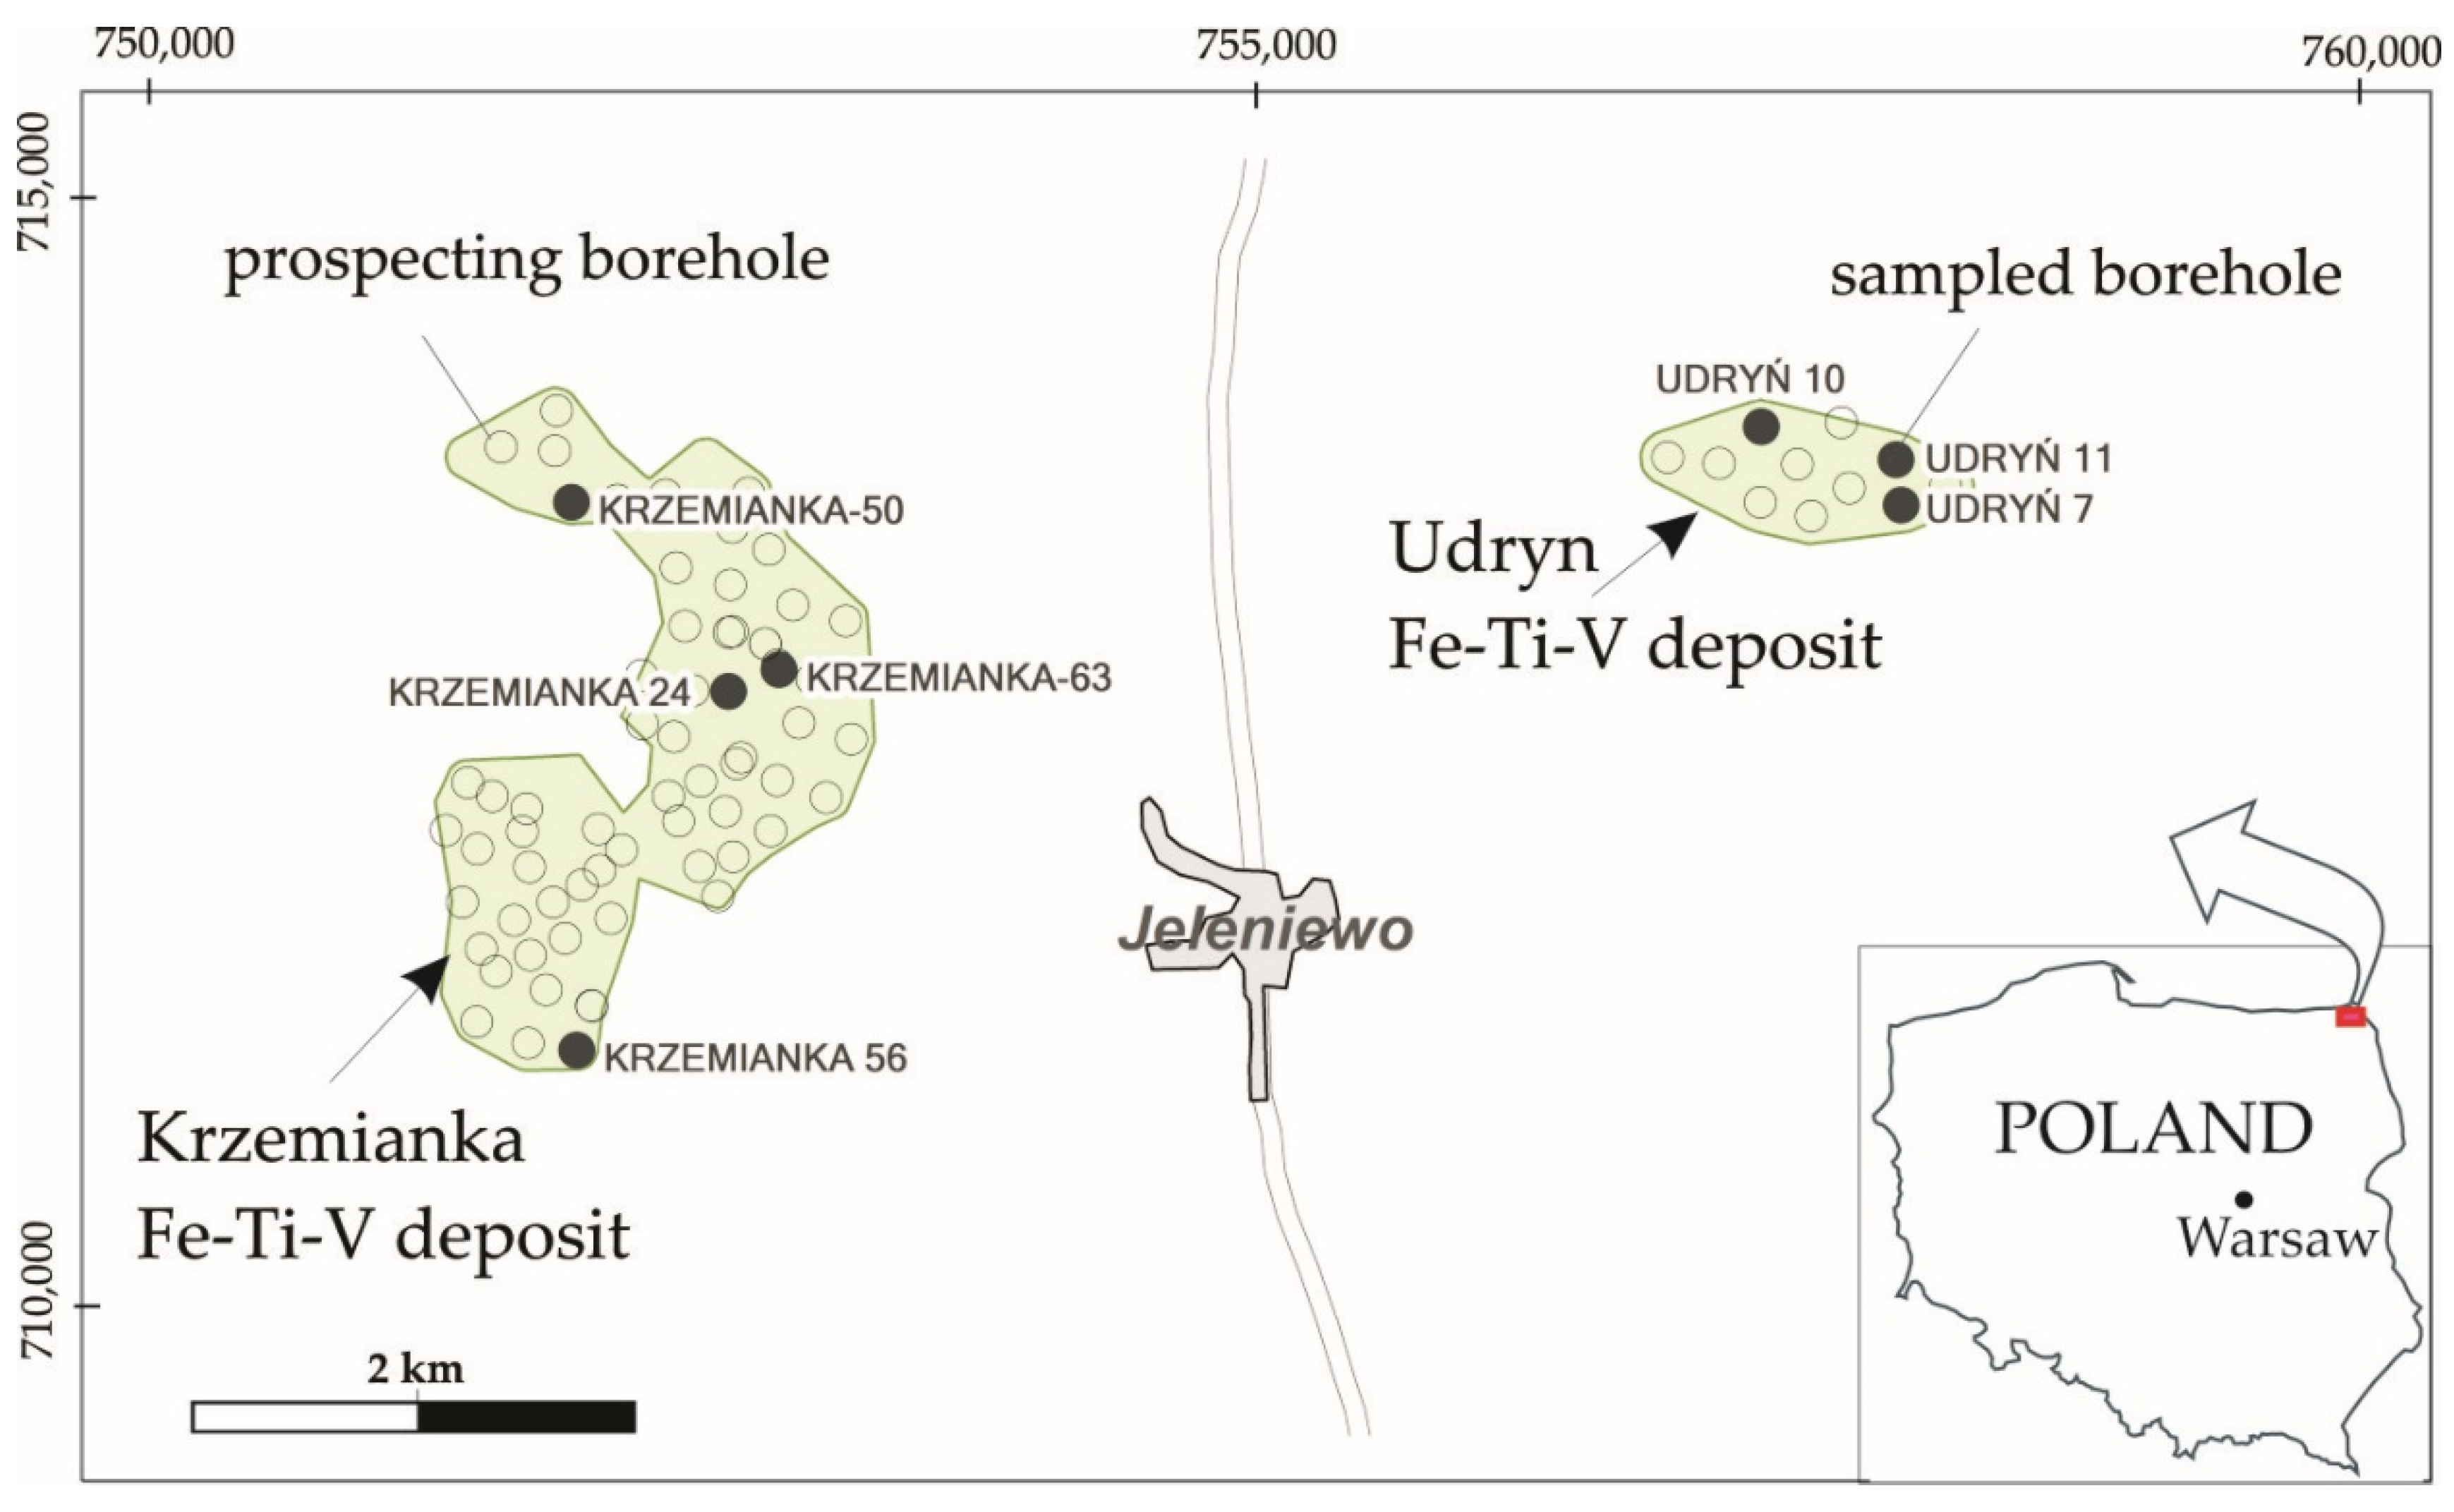
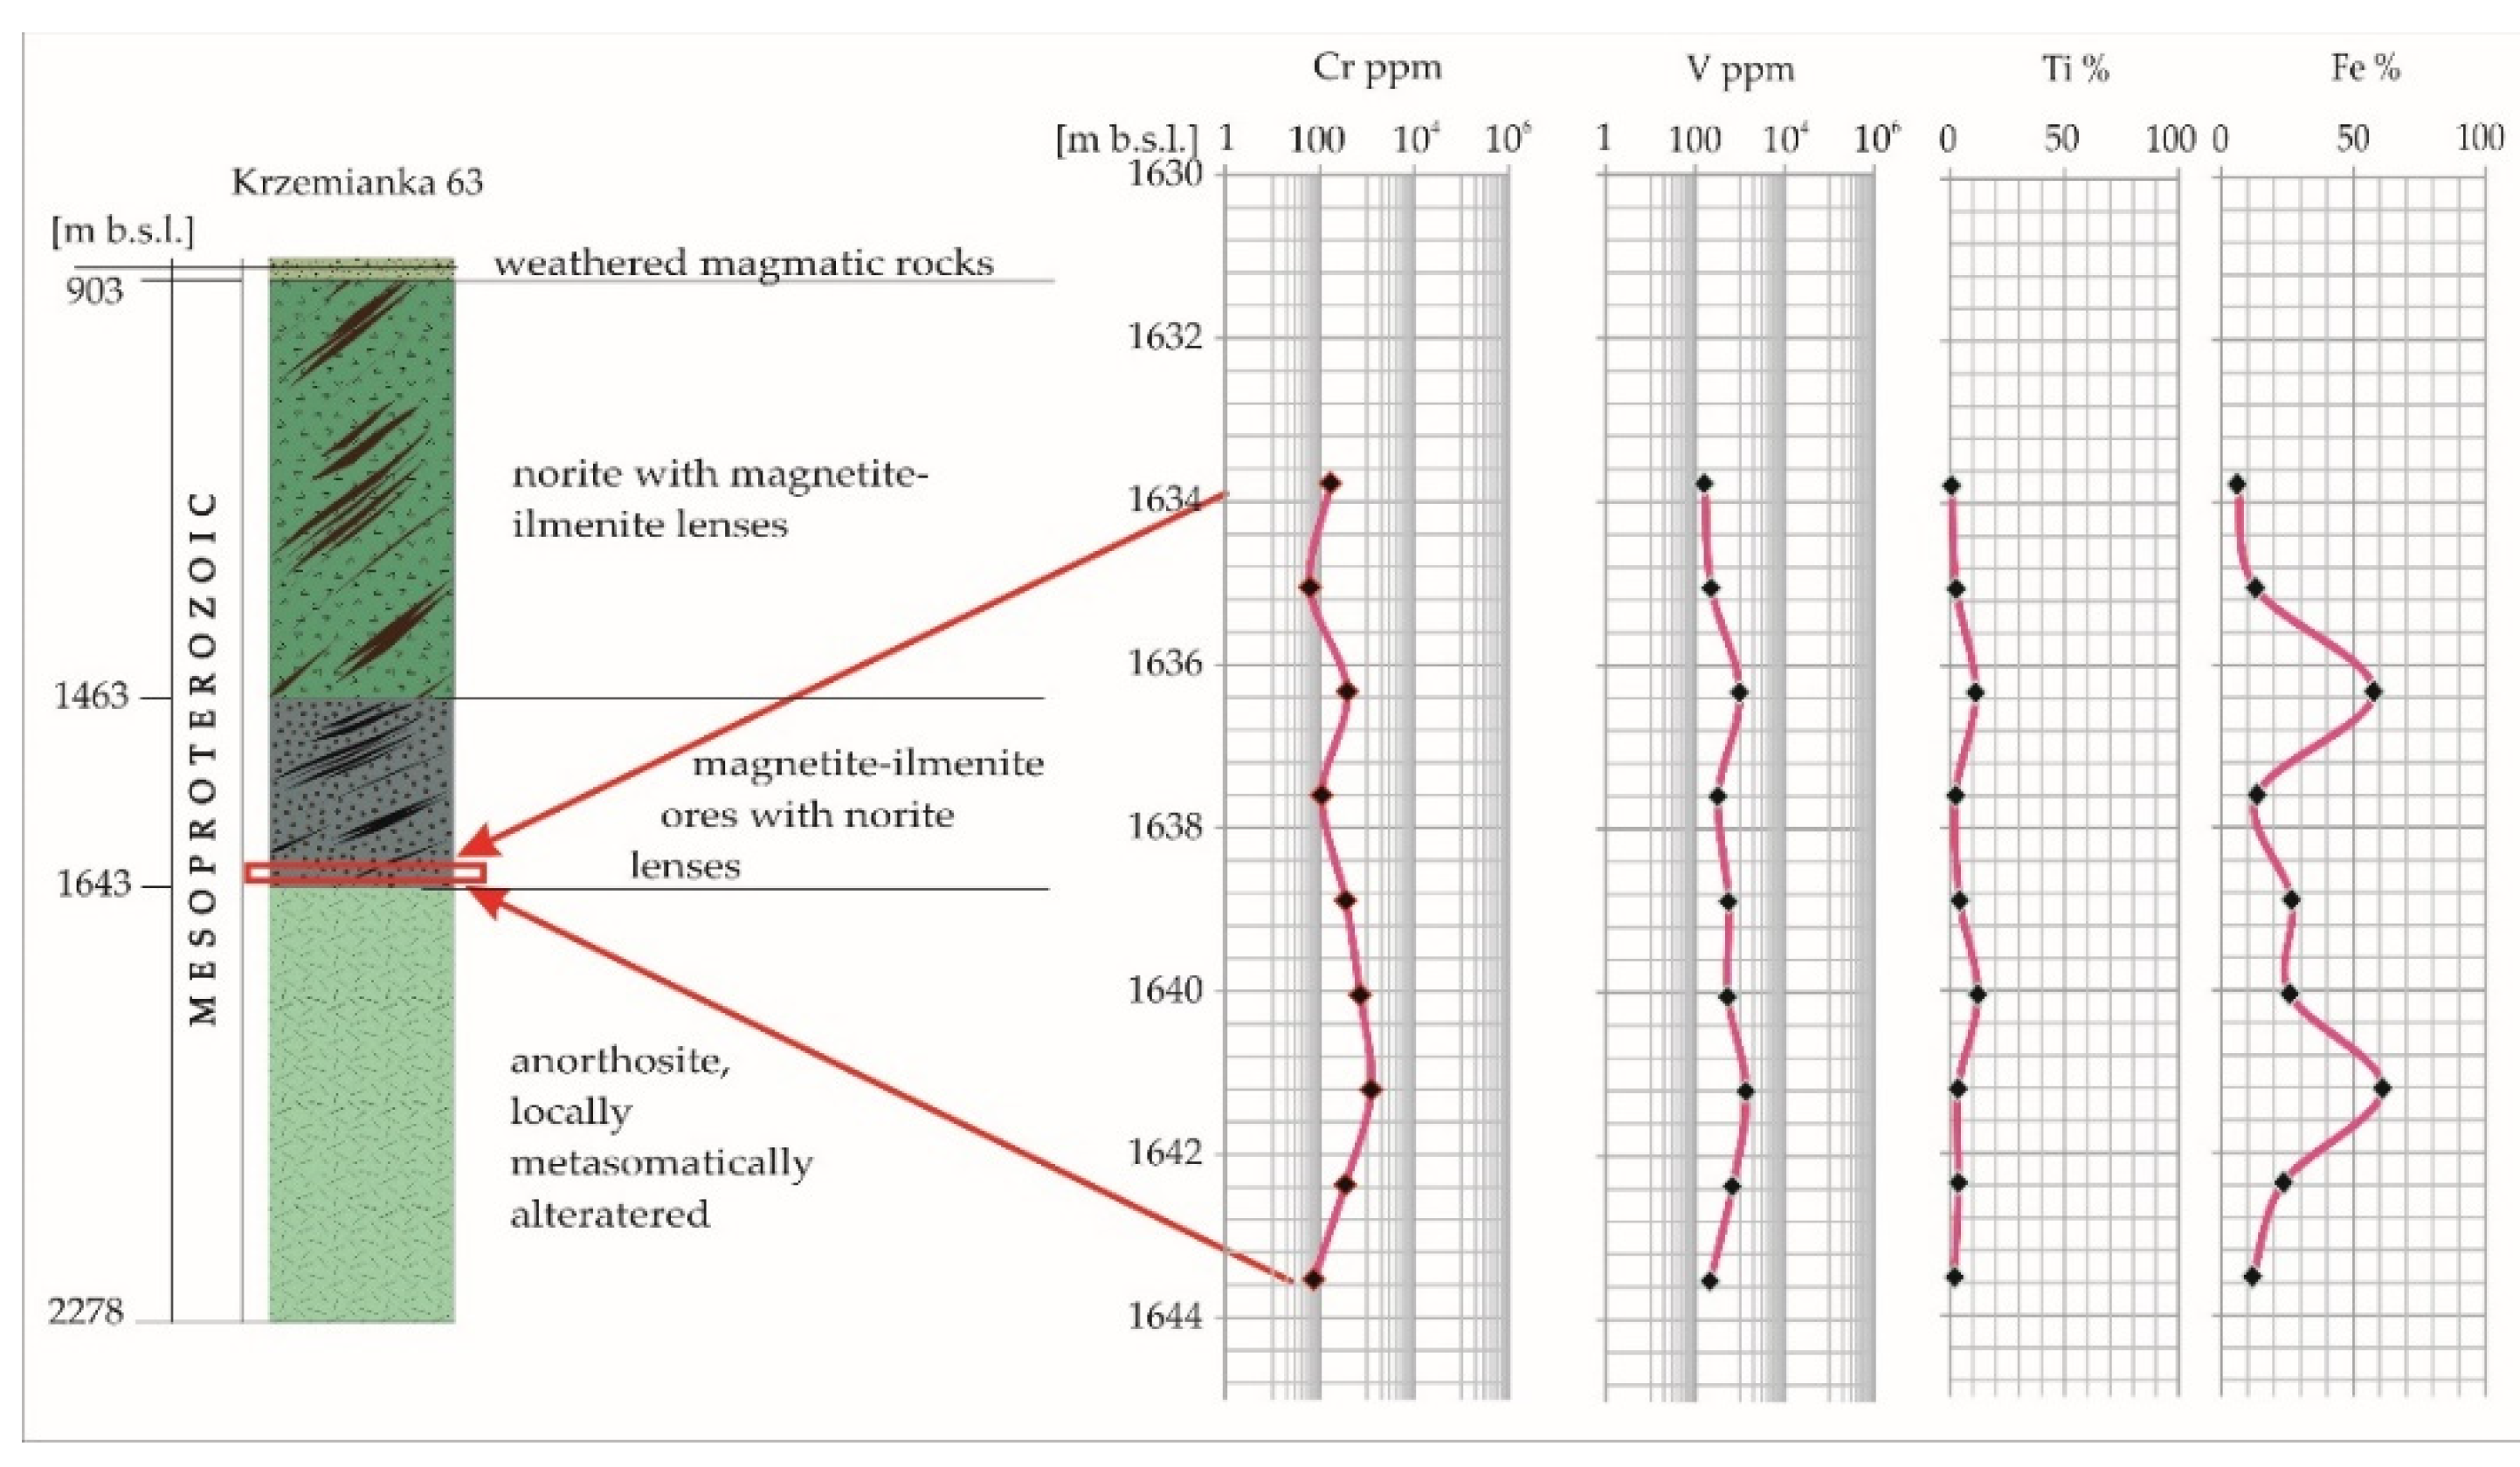
2.2.1. The Krzemianka Fe-Ti-V Oxide Deposit
2.2.2. The Udryn Fe-Ti-V Oxide Deposit and Other Prospects
3. Analytical Methods
3.1. The Whole-Rock Geochemistry
3.2. The Ore Microscope and Microprobe Studies
4. Results
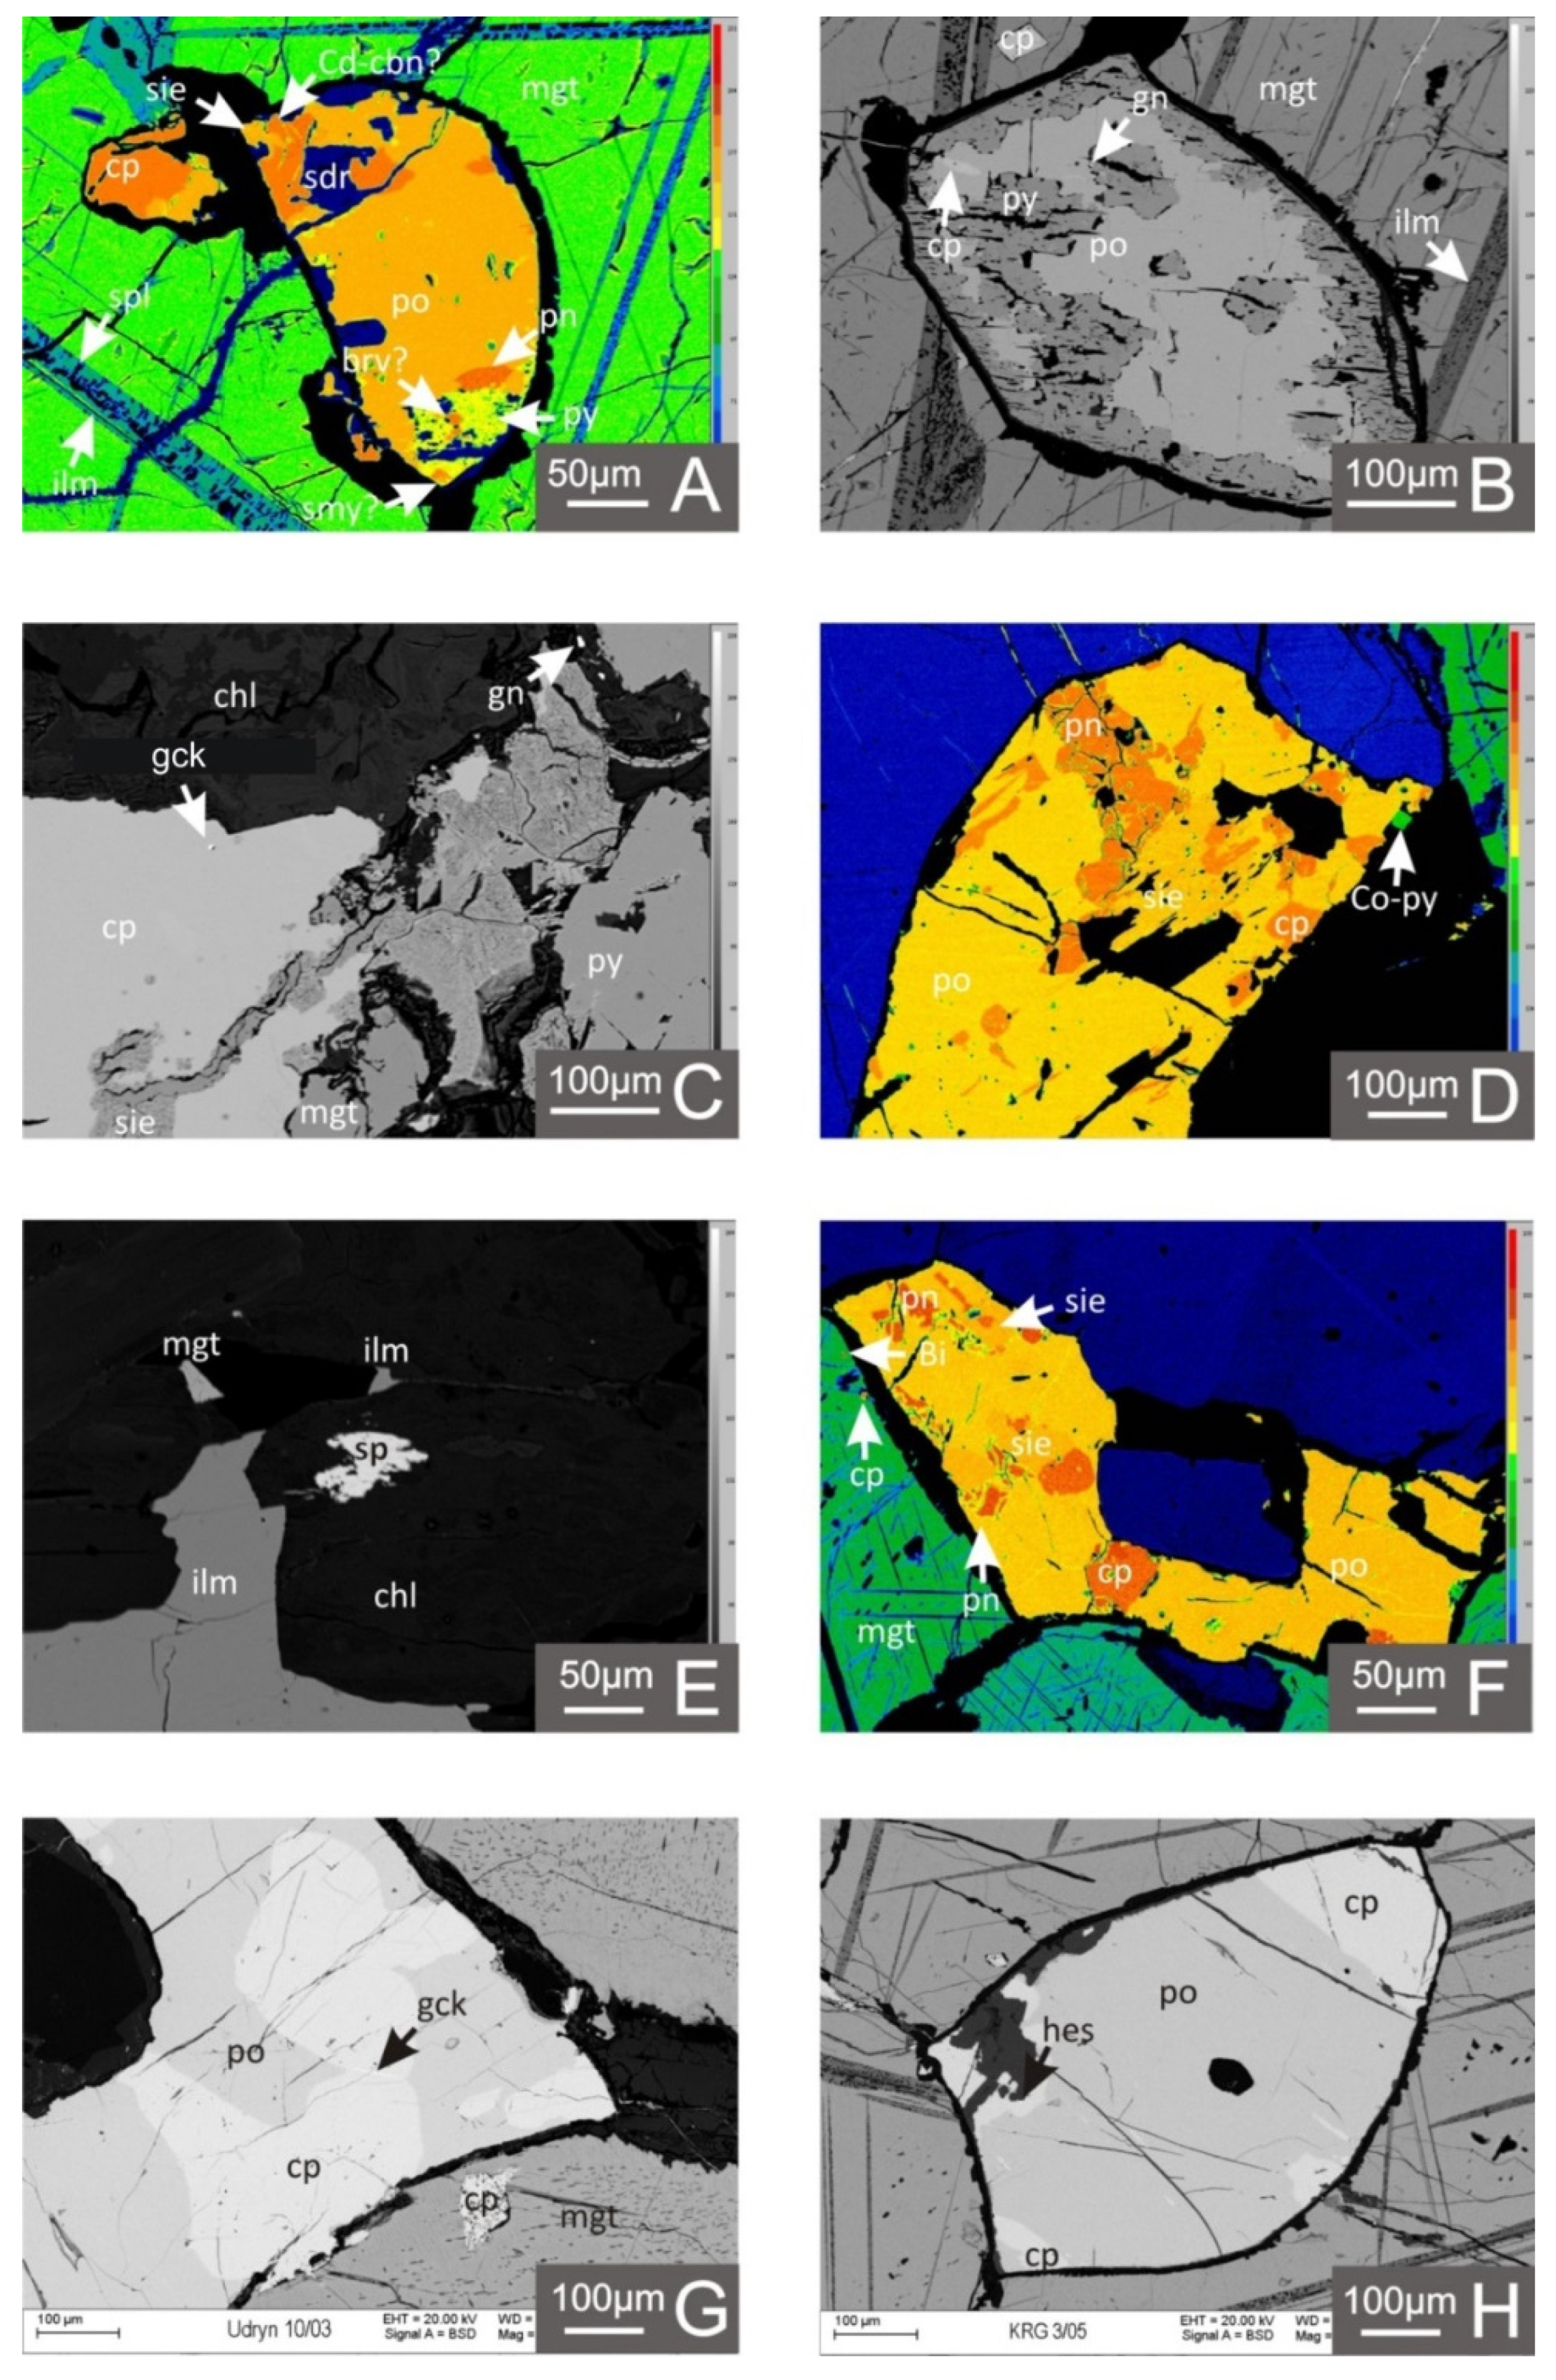
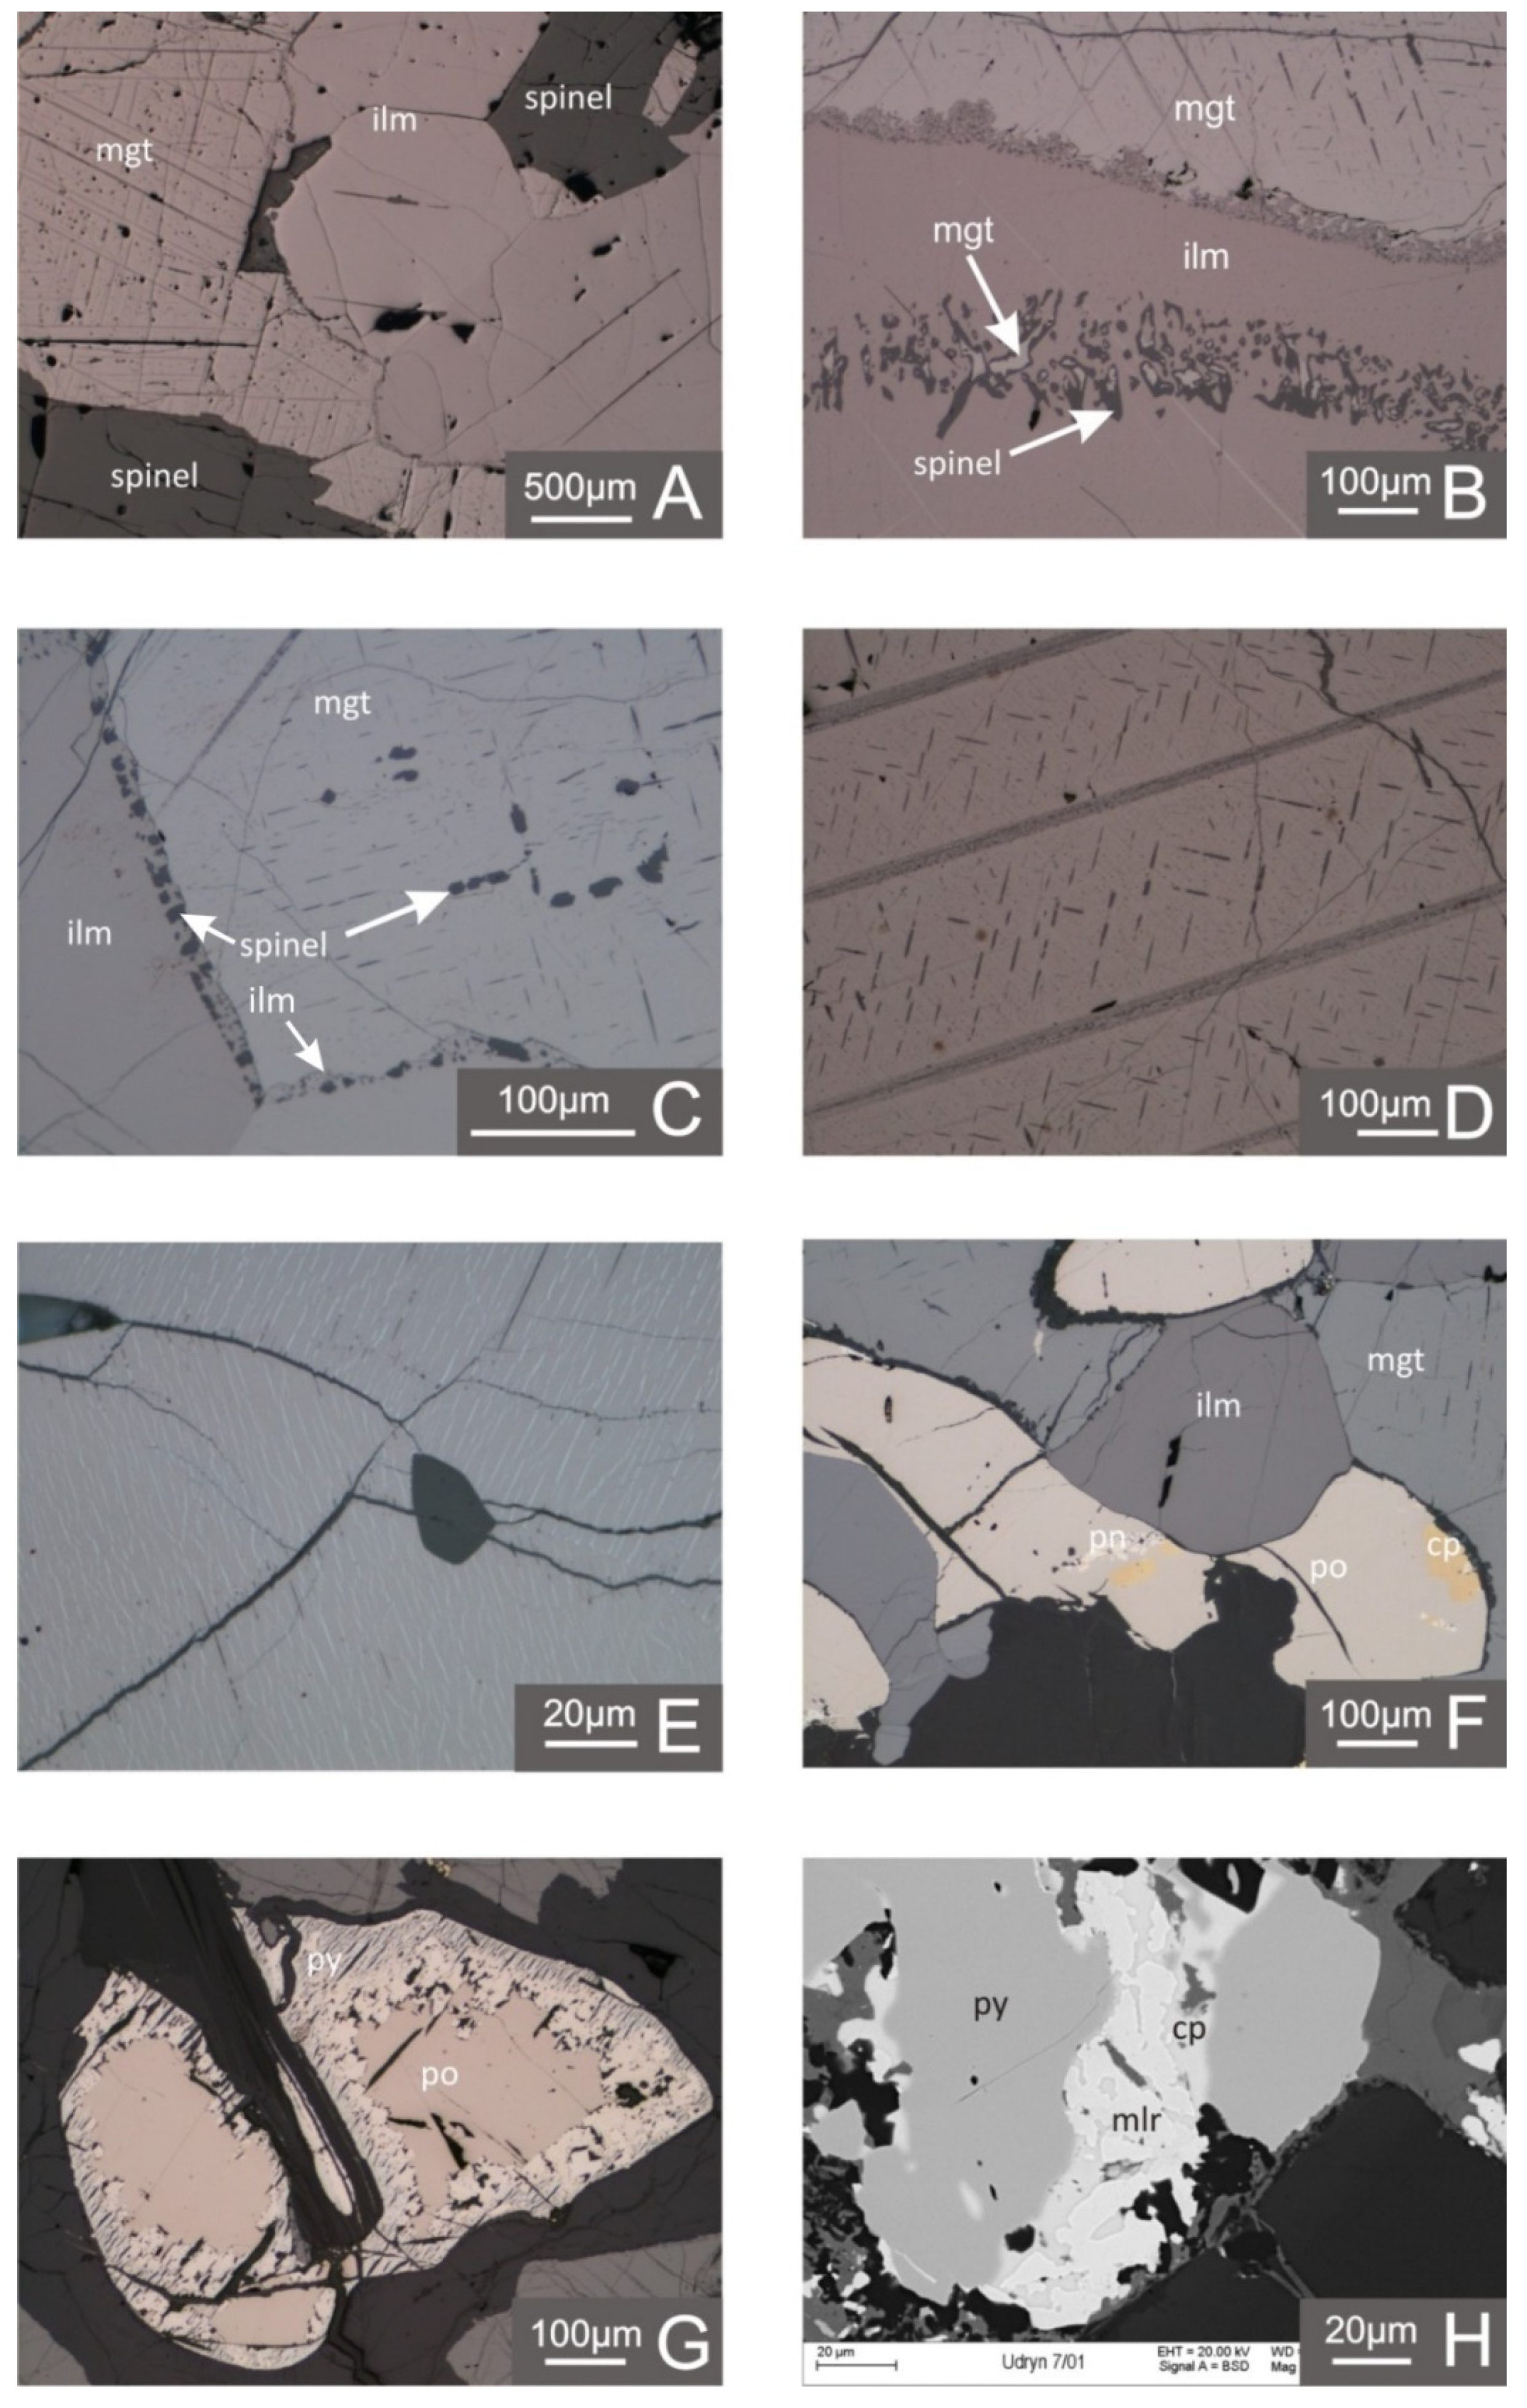
4.1. Metallic Mineralization in Light of the Microscopic and EPMA Studies
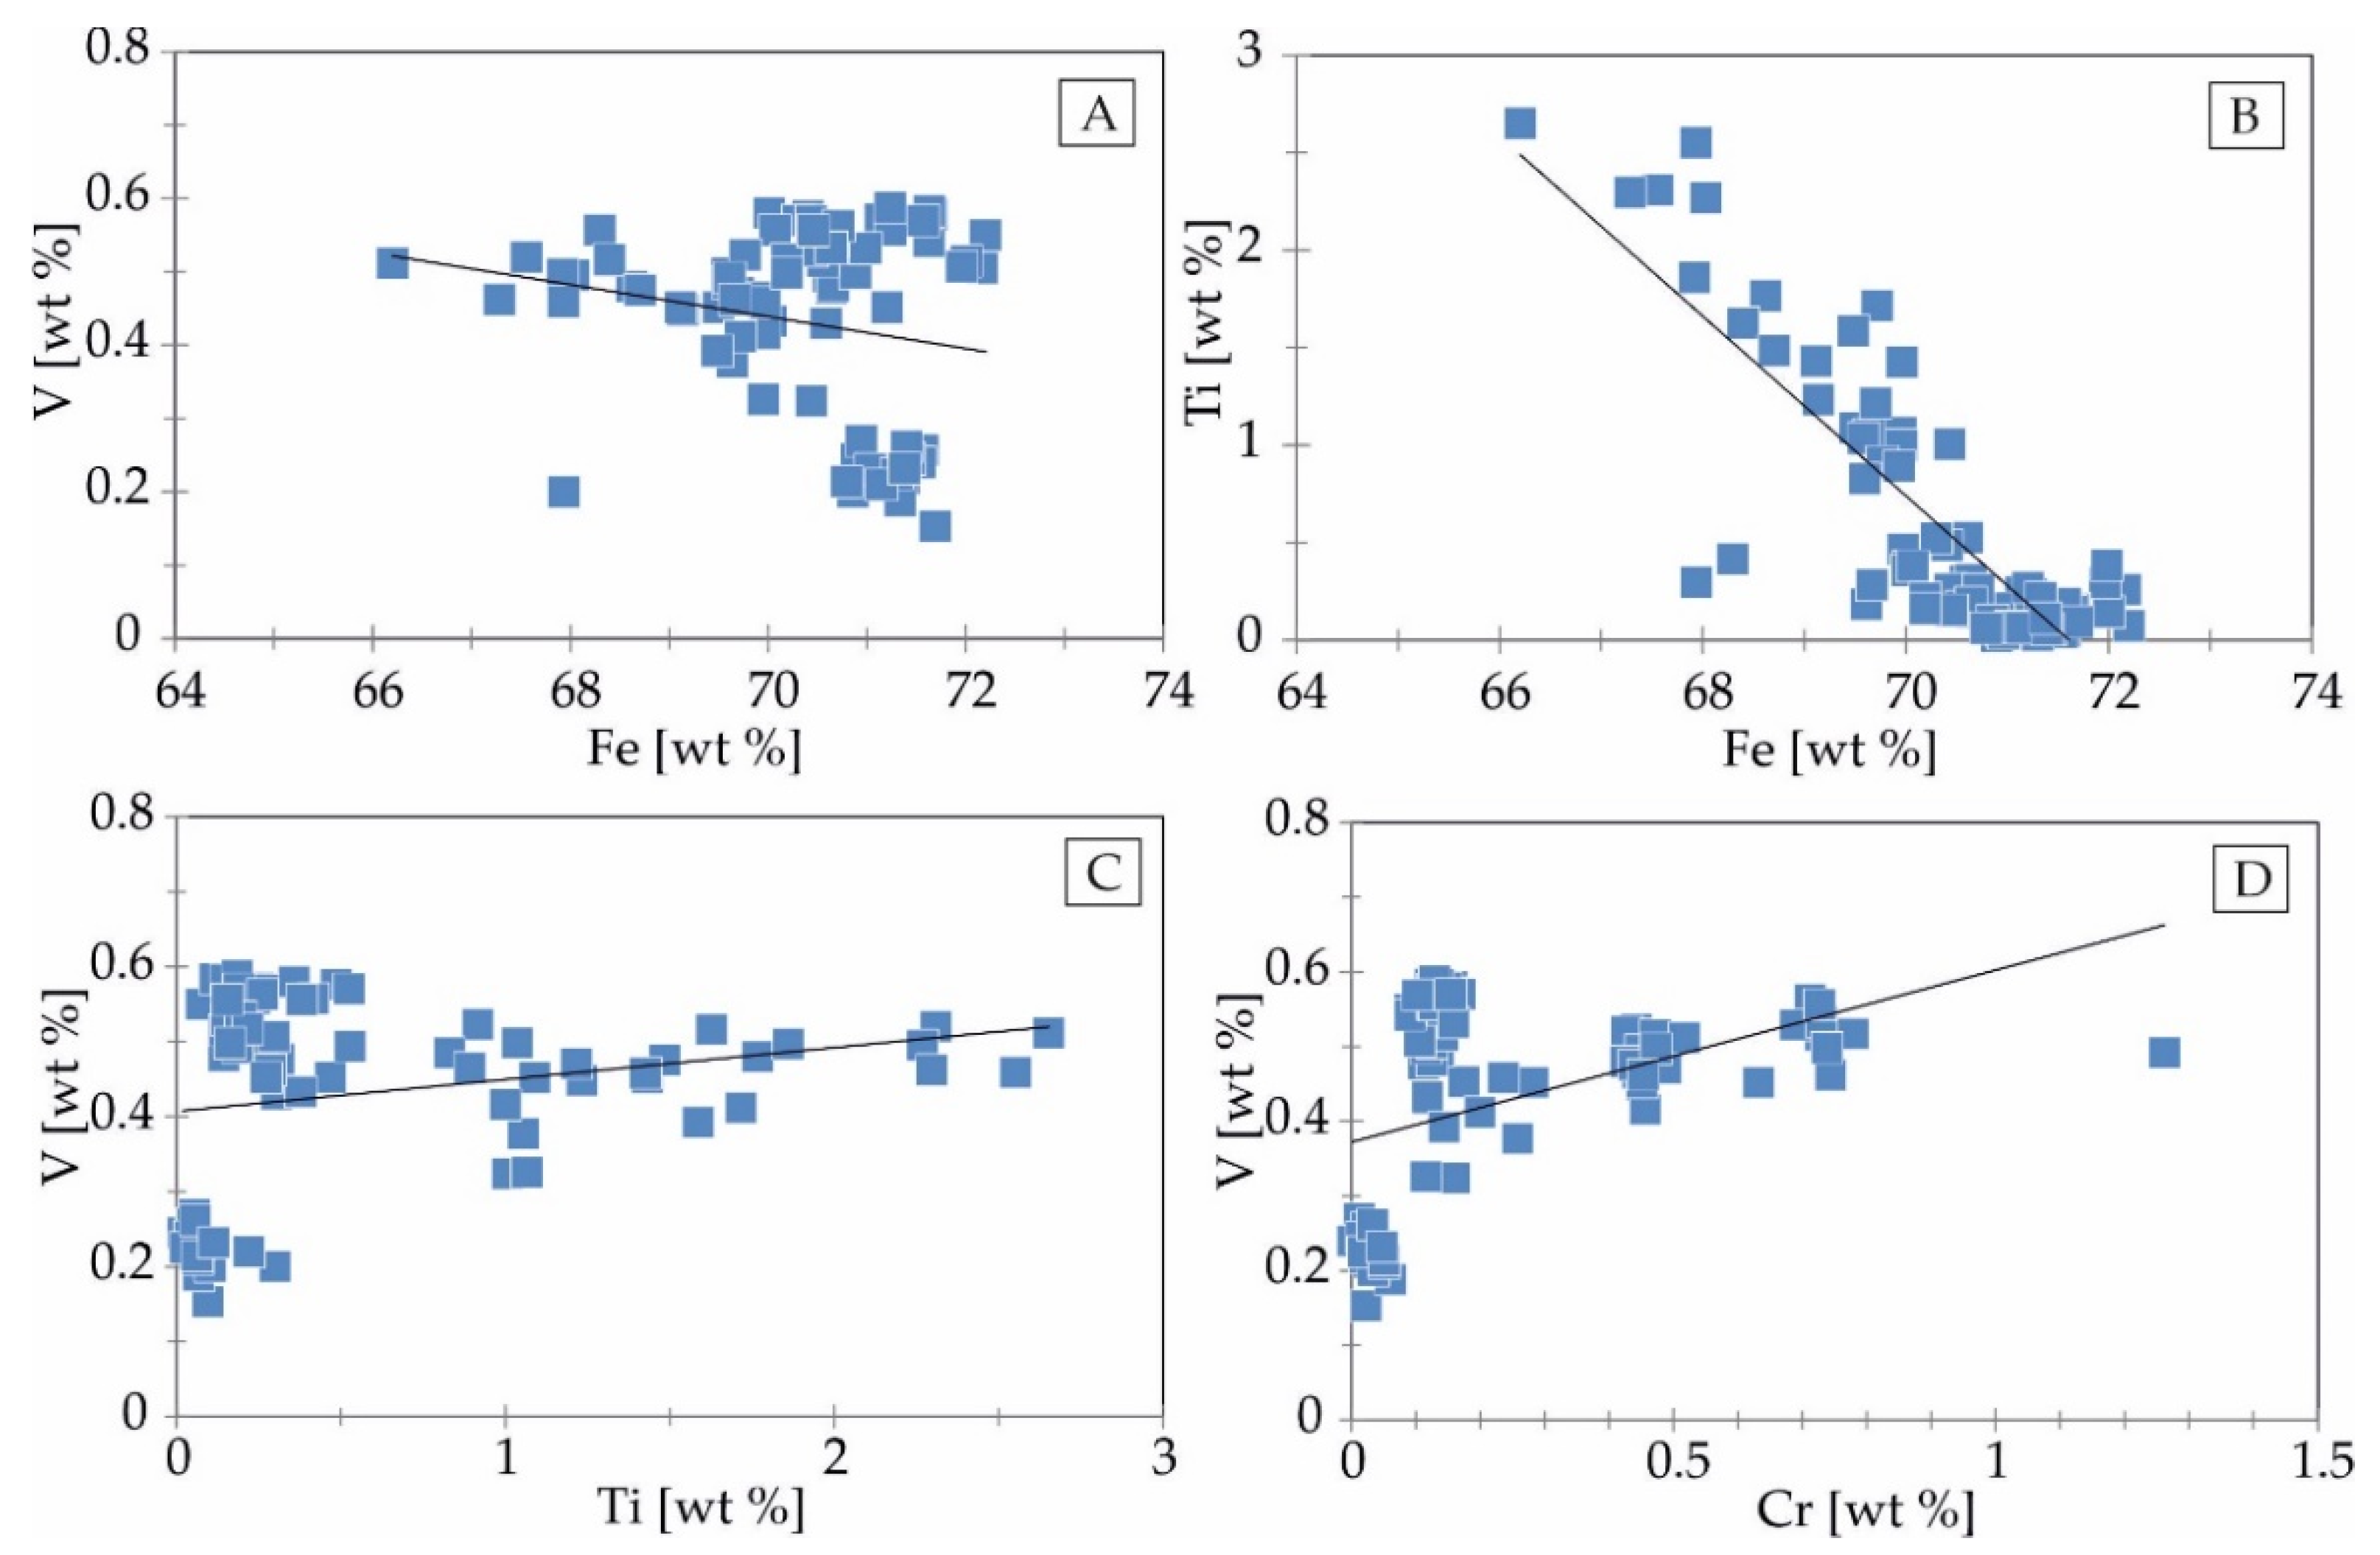
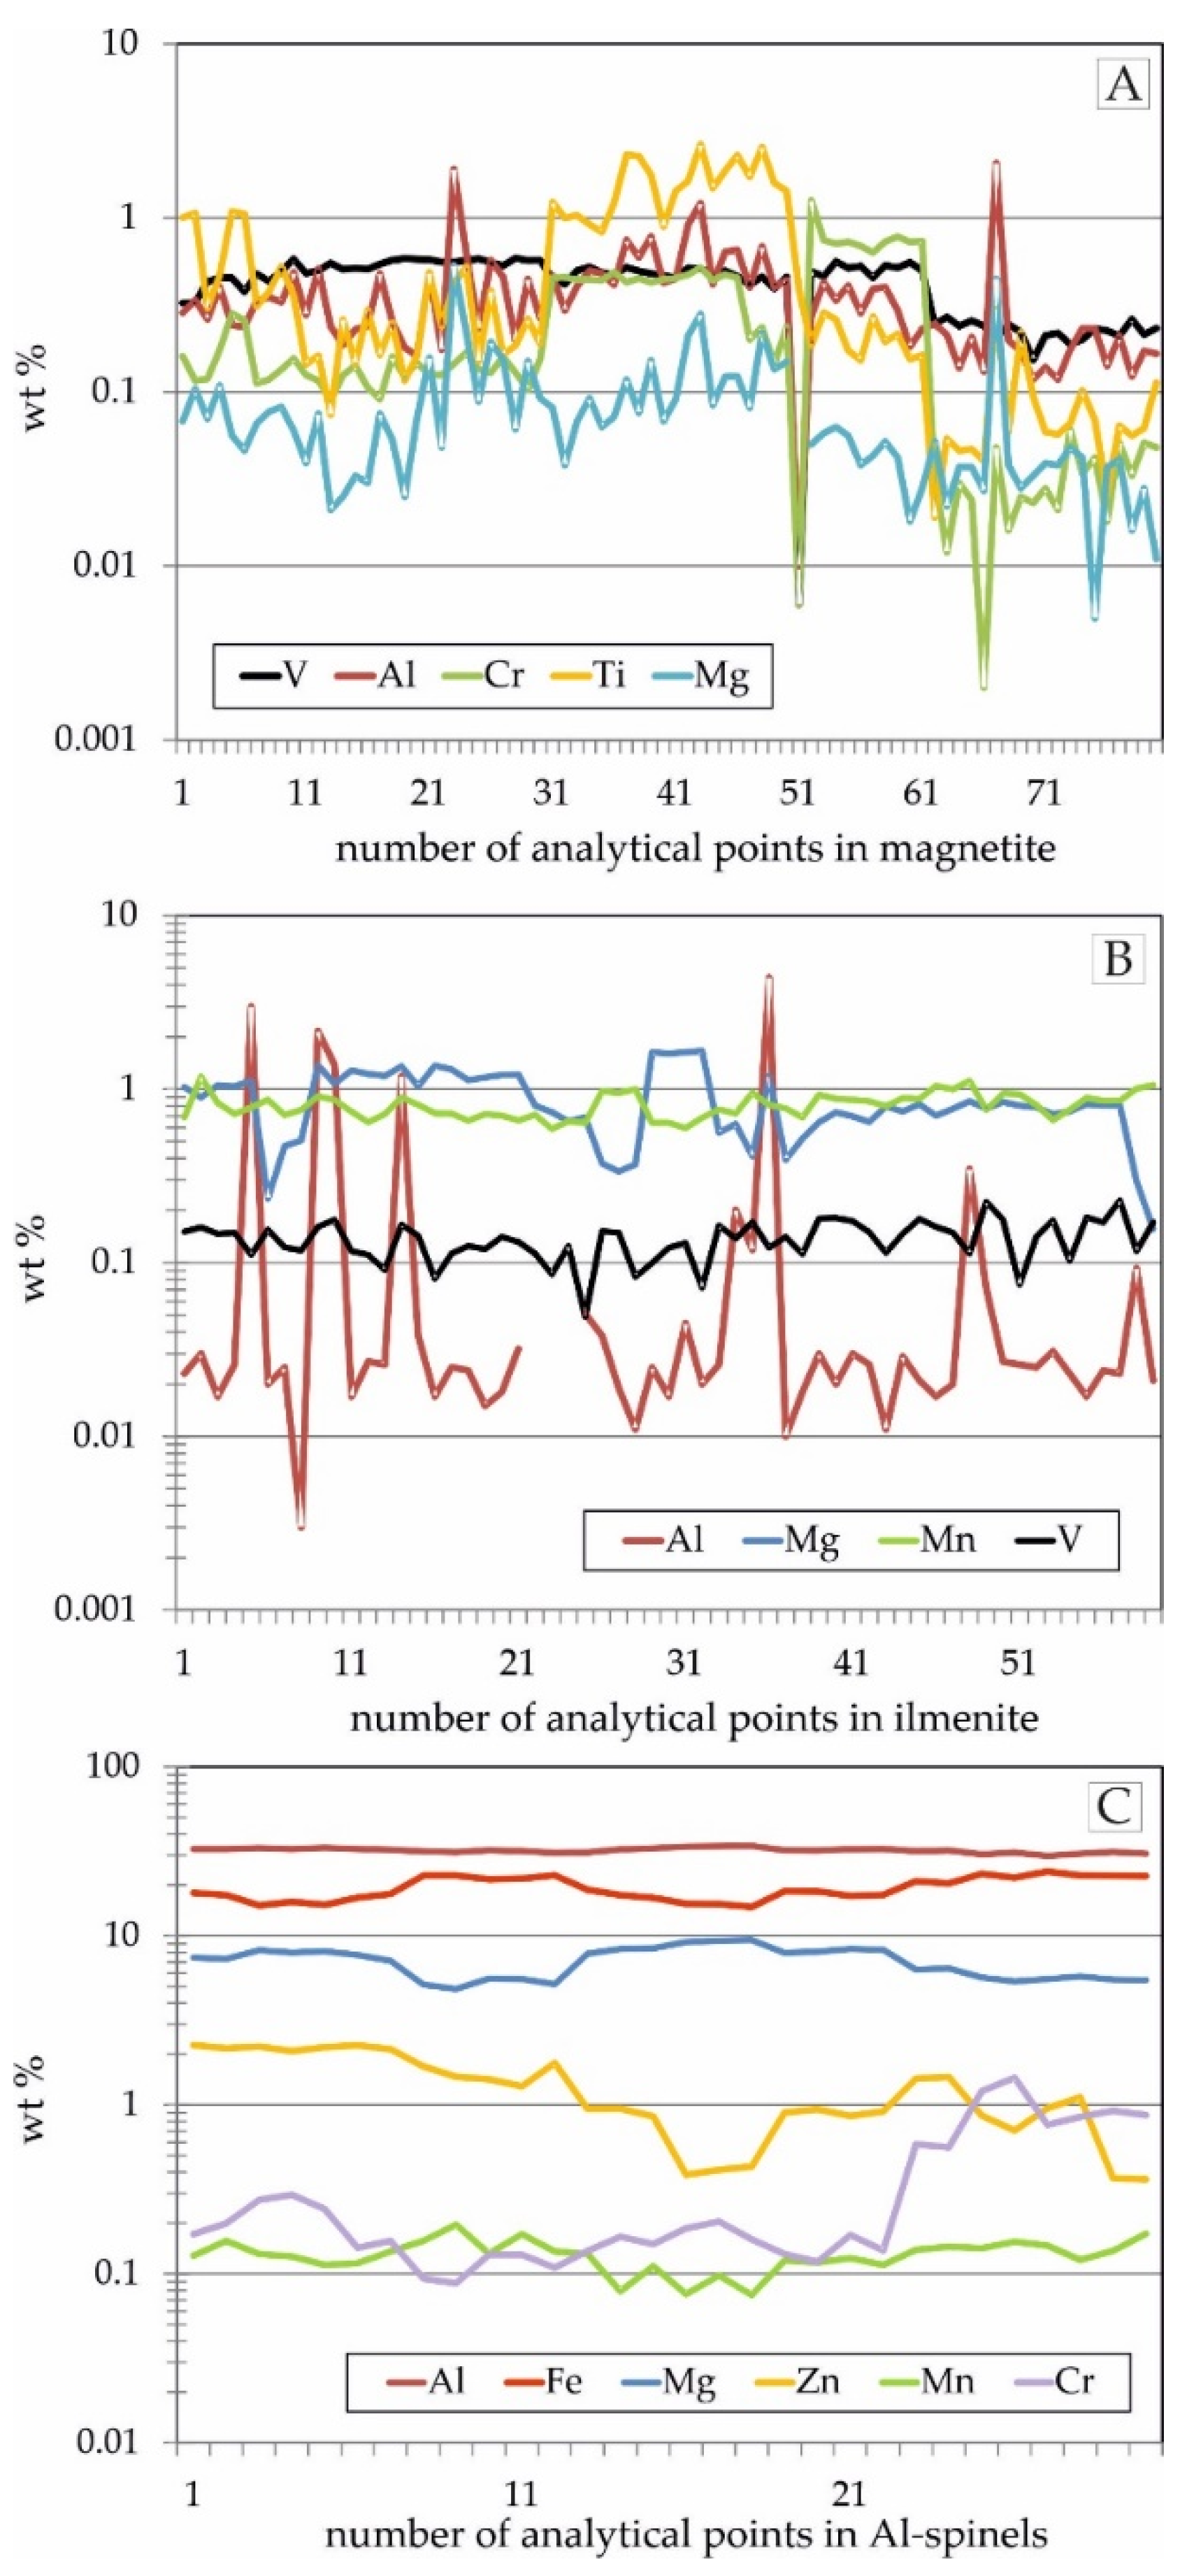
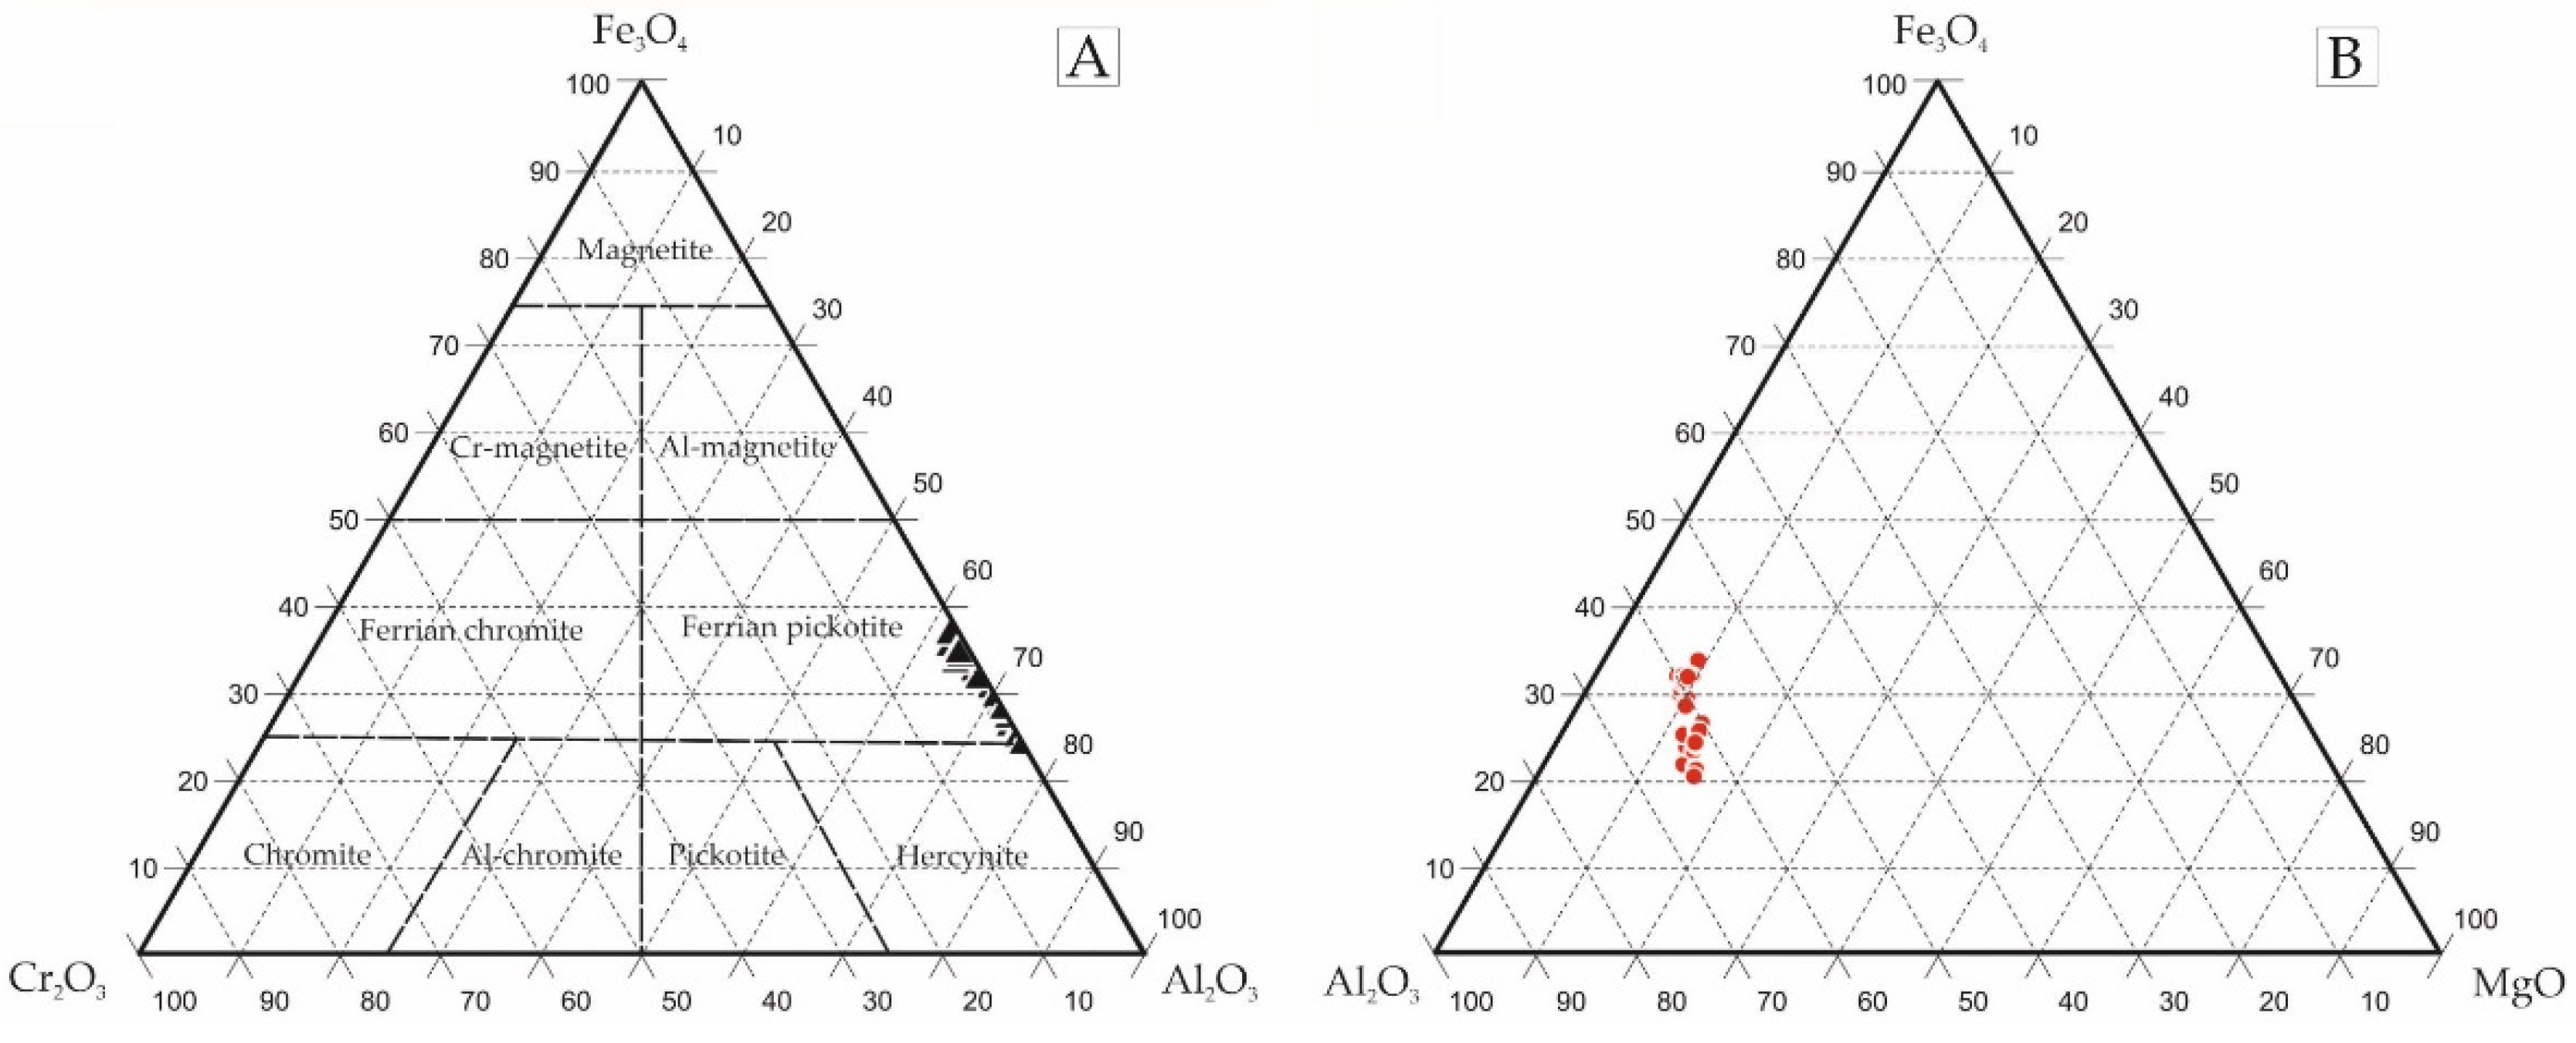
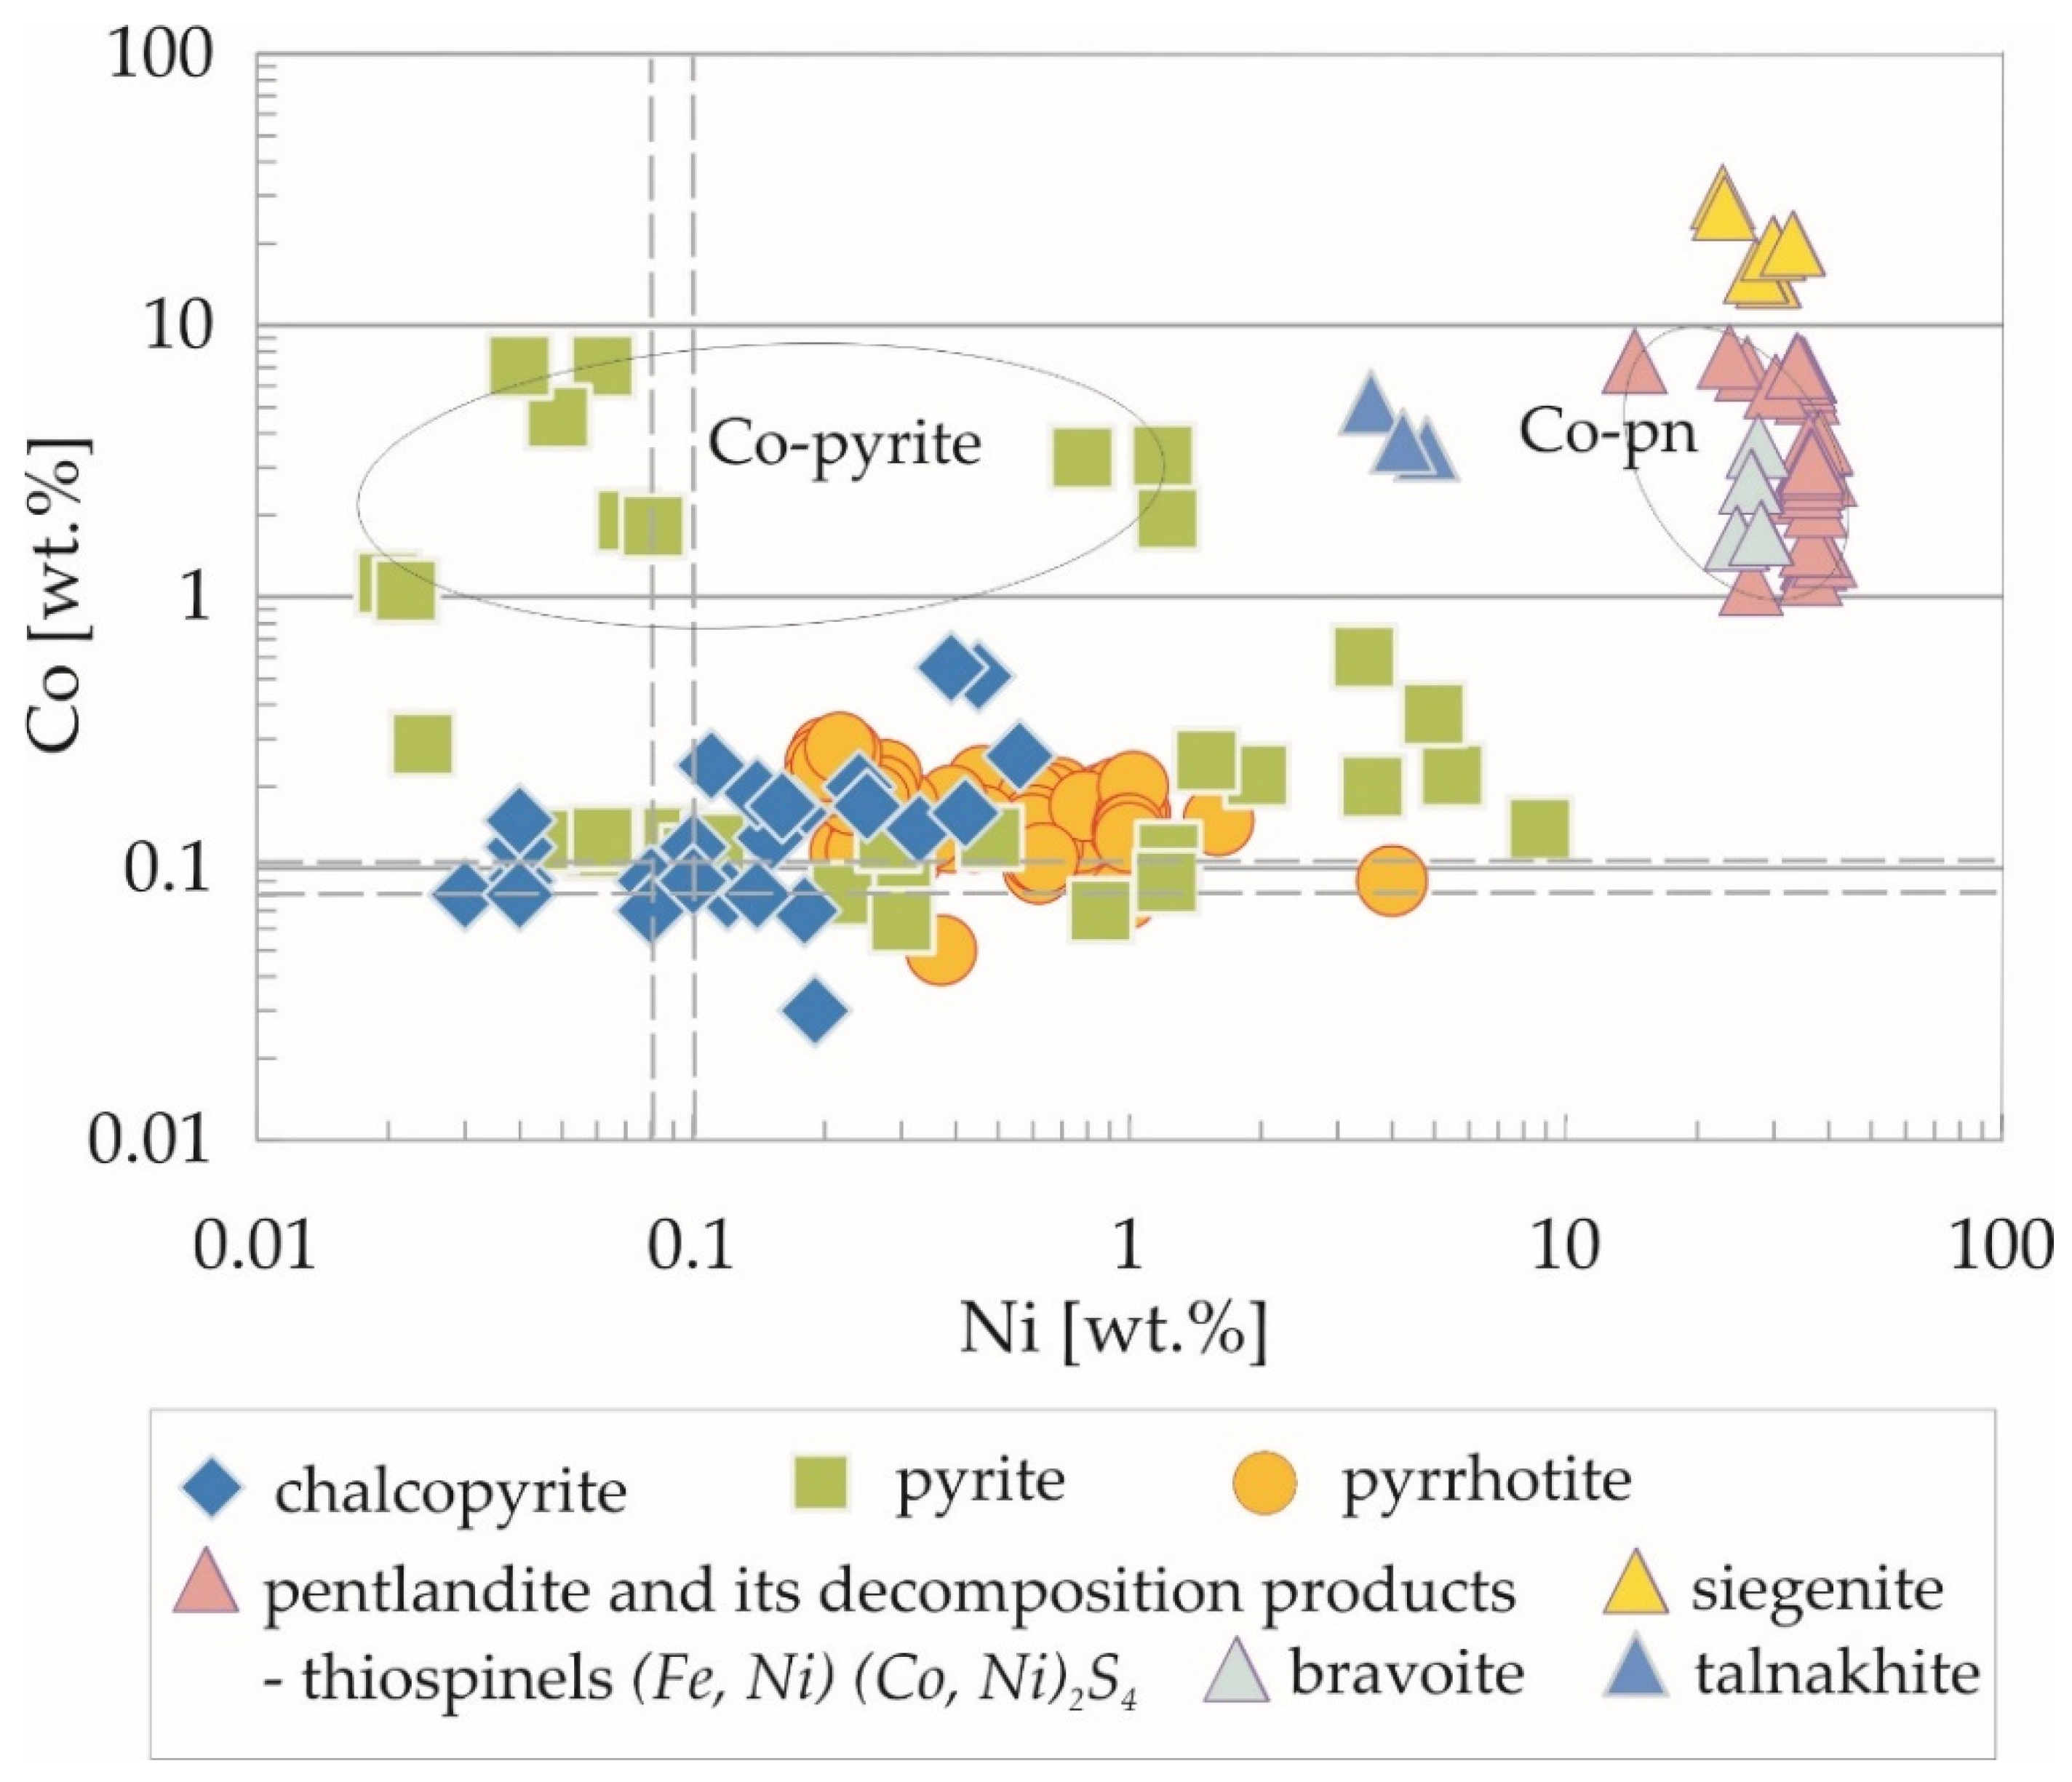
4.2. Trace Element Distribution in Fe-Ti-Oxides and Sulphides Mineralization Determined by EPMA
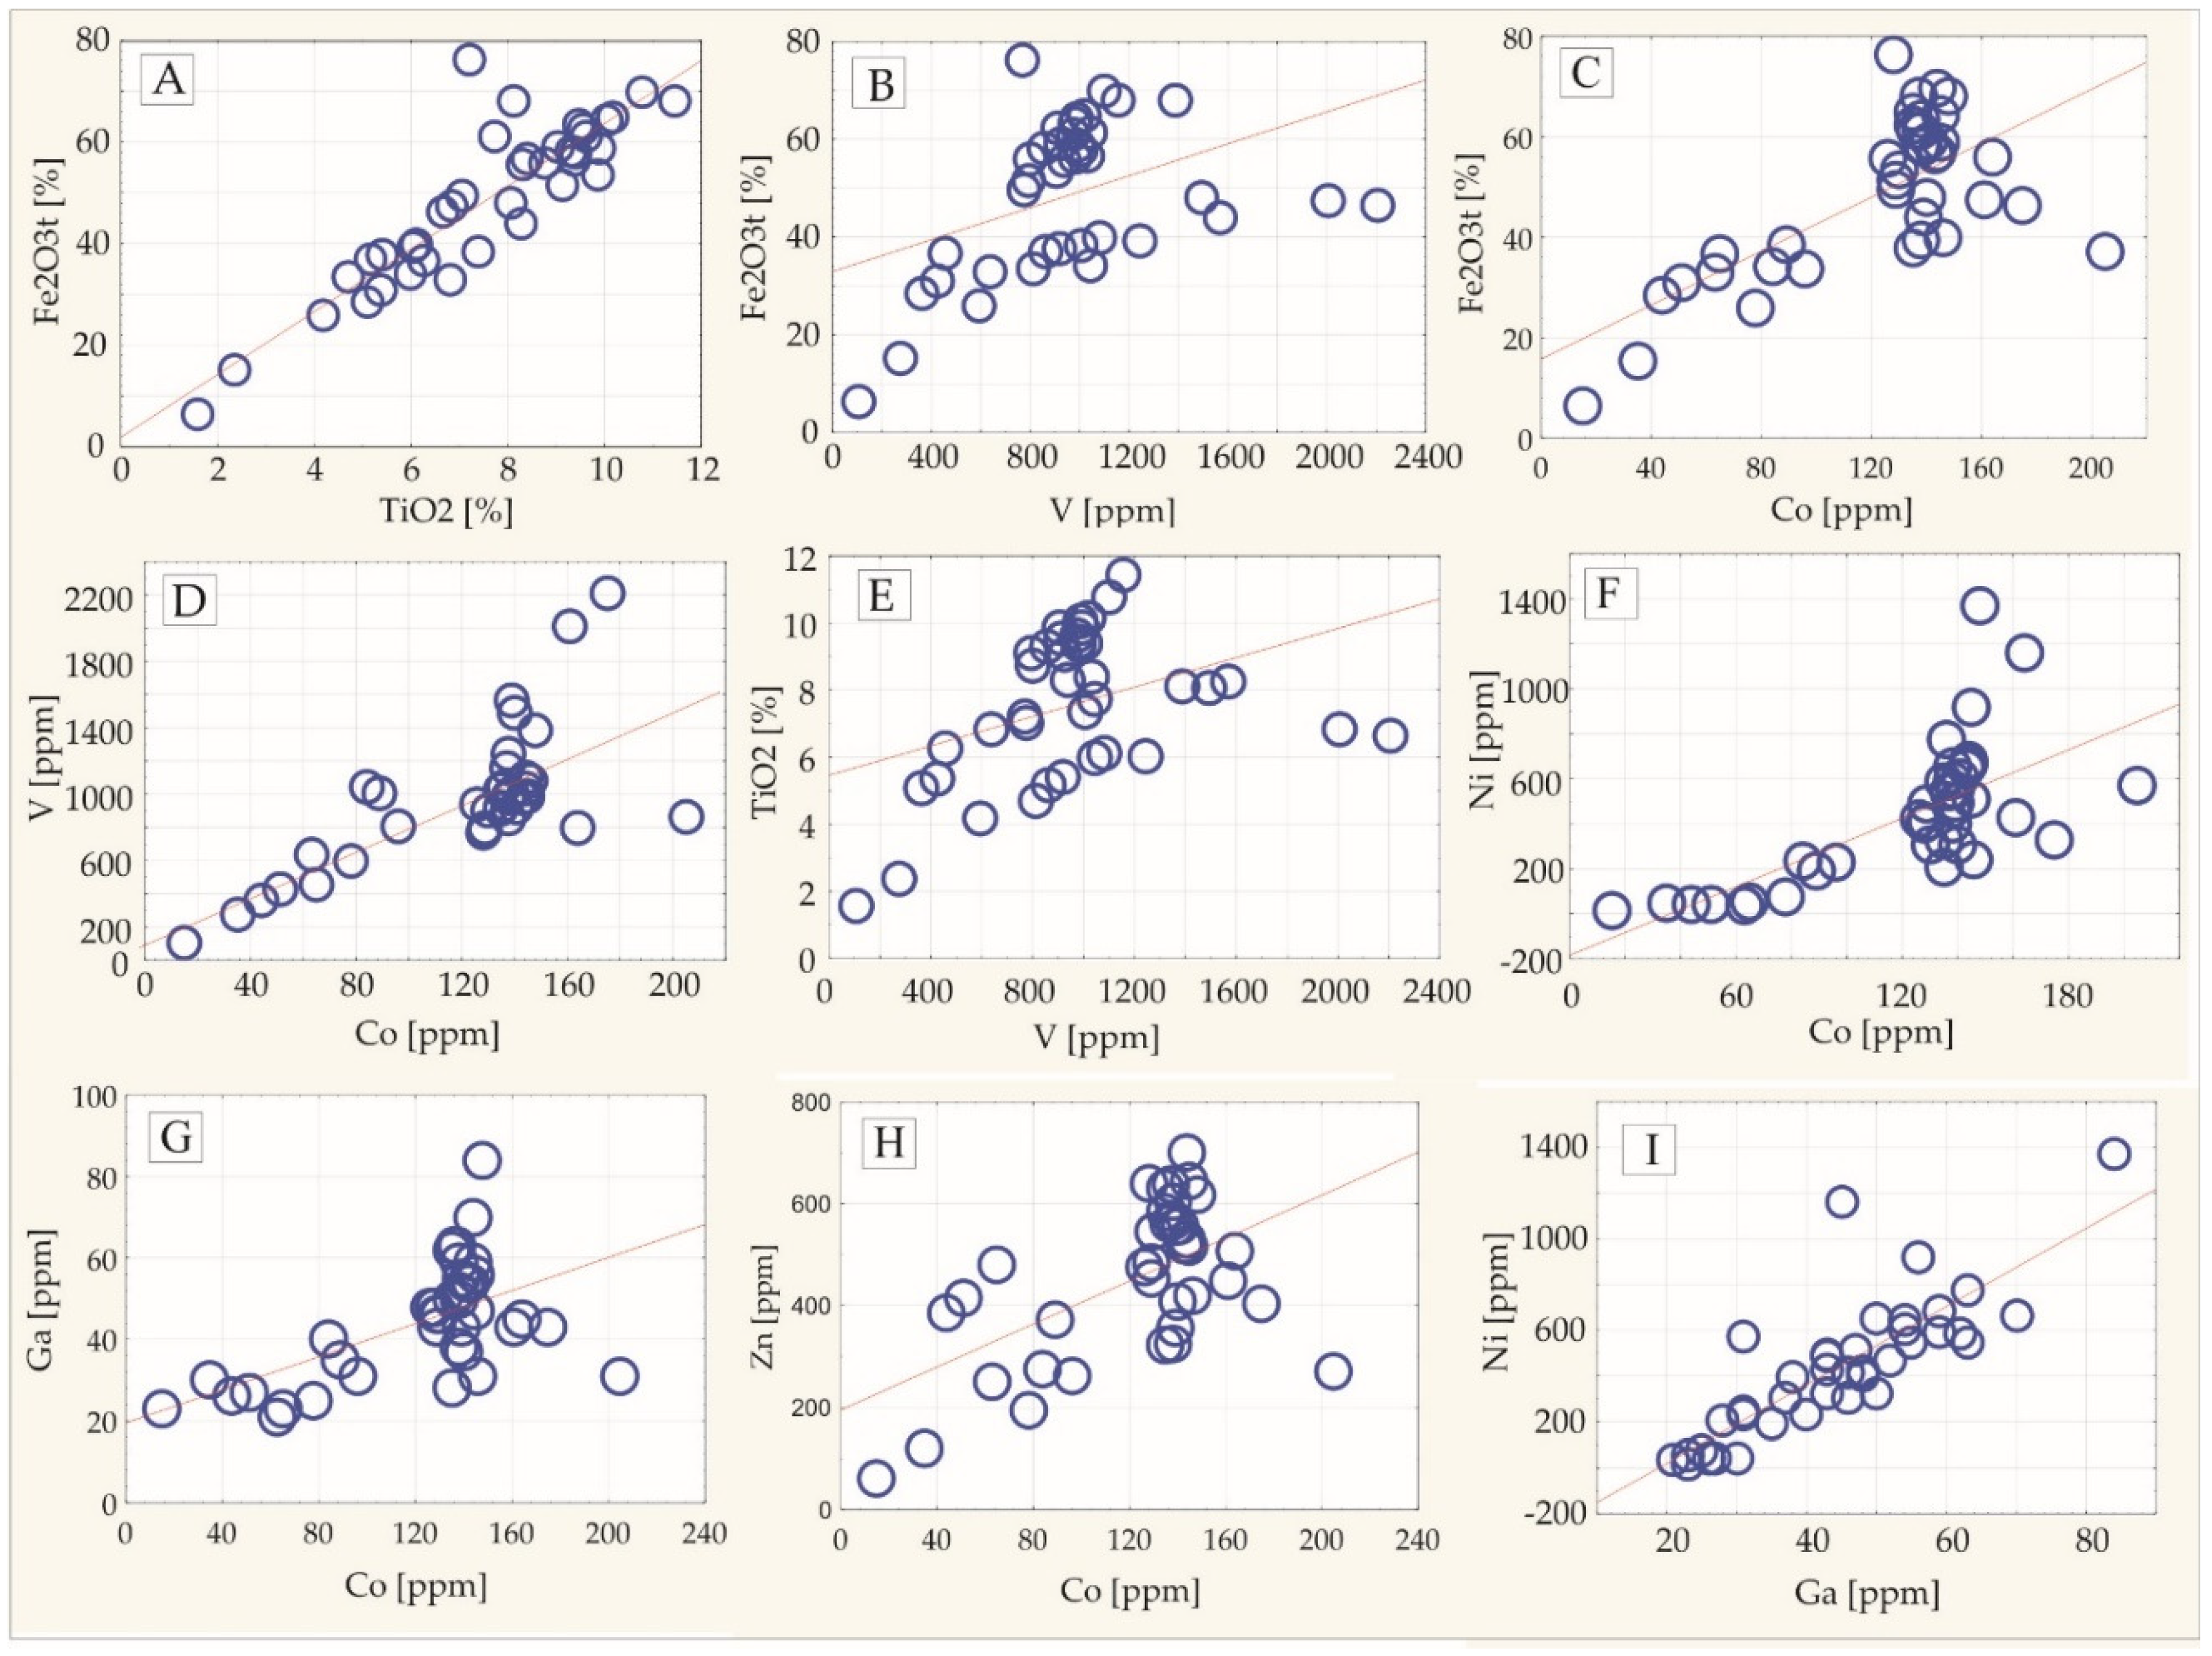
4.3. Bulk-Rock Geochemical Investigation of Fe-Ti-V Oxide and Sulphide Ores
5. Discussion
5.1. Genetic Implications for Vanadium and Cobalt Occurrence in the SAM
5.2. Economic Potential of Vanadium and Cobalt in the SAM
6. Conclusions
Author Contributions
Funding
Institutional Review Board Statement
Informed Consent Statement
Data Availability Statement
Acknowledgments
Conflicts of Interest
Appendix A

| Analytical Point | Fe | Al | Mn | V | Cr | Mg | Ti | O | Total | Fe/Ti | Al + V + Cr | Mg + Mn |
|---|---|---|---|---|---|---|---|---|---|---|---|---|
| KR-24_03_obsz-01_fot-1.1 | 70.436 | 0.285 | 0.027 | 0.324 | 0.16 | 0.068 | 1.006 | 21.394 | 93.751 | 70.0 | 0.769 | 0.095 |
| KR-24_03_obsz-01_fot-1.2 | 69.954 | 0.338 | 0.015 | 0.326 | 0.116 | 0.104 | 1.065 | 21.359 | 93.349 | 65.7 | 0.78 | 0.119 |
| KR-24_03_obsz-01_fot-1.3 | 70.587 | 0.261 | 0.025 | 0.43 | 0.119 | 0.07 | 0.303 | 20.985 | 92.817 | 233.0 | 0.81 | 0.095 |
| KR-24_03_obsz-01_fot-1.4 | 69.974 | 0.402 | 0.052 | 0.453 | 0.175 | 0.109 | 0.468 | 21.108 | 92.783 | 149.5 | 1.03 | 0.161 |
| KR-24_03_obsz-03_fot-6.6 | 69.5 | 0.241 | 0.026 | 0.452 | 0.282 | 0.056 | 1.089 | 21.271 | 93.042 | 63.8 | 0.975 | 0.082 |
| KR-24_03_obsz-03_fot-6.7 | 69.64 | 0.238 | 0.019 | 0.377 | 0.258 | 0.046 | 1.055 | 21.224 | 92.959 | 66.0 | 0.873 | 0.065 |
| KR-24_03_obsz-03_fot-6.8 | 70.639 | 0.334 | 0.033 | 0.477 | 0.112 | 0.066 | 0.31 | 21.1 | 93.165 | 227.9 | 0.923 | 0.099 |
| KR-24_03_obsz-03_fot-6.9 | 70.027 | 0.35 | 0.014 | 0.433 | 0.118 | 0.077 | 0.377 | 20.954 | 92.398 | 185.7 | 0.901 | 0.091 |
| KR-24_03_obsz-03_fot-6.10 | 70.611 | 0.328 | 0.014 | 0.494 | 0.135 | 0.082 | 0.527 | 21.26 | 93.567 | 134.0 | 0.957 | 0.096 |
| KRZ-56_02_obsz-01_fot-1.1 | 70.011 | 0.487 | 0.033 | 0.58 | 0.156 | 0.06 | 0.357 | 21.152 | 92.935 | 196.1 | 1.223 | 0.093 |
| KRZ-56_02_obsz-01_fot-1.2 | 70.66 | 0.276 | b.d.l. | 0.481 | 0.125 | 0.039 | 0.144 | 20.912 | 92.676 | 490.7 | 0.882 | 0.039 |
| KRZ-56_02_obsz-01_fot-1.3 | 70.883 | 0.51 | 0.011 | 0.498 | 0.116 | 0.075 | 0.162 | 21.26 | 93.683 | 437.5 | 1.124 | 0.086 |
| KRZ-56_02_obsz-01_fot-2.6 | 72.198 | 0.238 | 0.005 | 0.55 | 0.09 | 0.021 | 0.074 | 21.272 | 94.483 | 975.6 | 0.878 | 0.026 |
| KRZ-56_02_obsz-01_fot-2.7 | 72.164 | 0.186 | b.d.l. | 0.505 | 0.125 | 0.025 | 0.261 | 21.373 | 94.863 | 276.5 | 0.816 | 0.025 |
| KRZ-56_02_obsz-01_fot-2.8 | 72.002 | 0.229 | 0.014 | 0.515 | 0.142 | 0.033 | 0.145 | 21.289 | 94.442 | 496.6 | 0.886 | 0.047 |
| KRZ-56_02_obsz-01_fot-2.9 | 71.958 | 0.24 | 0.035 | 0.507 | 0.106 | 0.03 | 0.296 | 21.392 | 94.734 | 243.1 | 0.853 | 0.065 |
| KRZ-56_02_obsz-01_fot-2.10 | 71.627 | 0.48 | 0.037 | 0.542 | 0.091 | 0.075 | 0.163 | 21.443 | 94.527 | 439.4 | 1.113 | 0.112 |
| KR-63_05_obsz-02_fot-1.3 | 71.136 | 0.252 | 0.018 | 0.572 | 0.159 | 0.053 | 0.249 | 21.169 | 93.675 | 285.7 | 0.983 | 0.071 |
| KR-63_05_obsz-02_fot-1.4 | 71.634 | 0.18 | 0.012 | 0.584 | 0.122 | 0.025 | 0.116 | 21.139 | 93.927 | 617.5 | 0.886 | 0.037 |
| KR-63_05_obsz-03_fot-1.1 | 71.659 | 0.161 | 0.008 | 0.579 | 0.147 | 0.07 | 0.161 | 21.179 | 94.007 | 445.1 | 0.887 | 0.078 |
| KR-63_05_obsz-03_fot-1.2 | 70.406 | 0.484 | 0.016 | 0.576 | 0.126 | 0.157 | 0.485 | 21.372 | 93.649 | 145.2 | 1.186 | 0.173 |
| KR-63_05_obsz-03_fot-1.3 | 71.237 | 0.175 | 0.001 | 0.557 | 0.125 | 0.048 | 0.238 | 21.091 | 93.54 | 299.3 | 0.857 | 0.049 |
| KR-63_05_obsz-04_fot-1.5 | 68.297 | 1.903 | 0.051 | 0.557 | 0.145 | 0.534 | 0.416 | 22.244 | 94.19 | 164.2 | 2.605 | 0.585 |
| KR-63_05_obsz-04_fot-1.6 | 70.304 | 0.619 | 0.019 | 0.57 | 0.169 | 0.219 | 0.525 | 21.568 | 94.126 | 133.9 | 1.358 | 0.238 |
| KR-63_05_obsz-05_fot-1.10 | 71.631 | 0.231 | 0.034 | 0.583 | 0.135 | 0.088 | 0.15 | 21.268 | 94.269 | 477.5 | 0.949 | 0.122 |
| KR-63_05_obsz-05_fot-1.11 | 70.069 | 0.573 | 0.007 | 0.556 | 0.129 | 0.194 | 0.381 | 21.309 | 93.287 | 183.9 | 1.258 | 0.201 |
| KR-63_05_obsz-05_fot-1.12 | 70.988 | 0.458 | b.d.l. | 0.532 | 0.159 | 0.154 | 0.164 | 21.297 | 93.789 | 432.9 | 1.149 | 0.154 |
| KR-63_05_obsz-08_fot-1.5 | 71.235 | 0.197 | 0.017 | 0.588 | 0.129 | 0.061 | 0.185 | 21.117 | 93.649 | 385.1 | 0.914 | 0.078 |
| KR-63_05_obsz-08_fot-1.6 | 70.437 | 0.446 | 0.015 | 0.569 | 0.103 | 0.15 | 0.263 | 21.19 | 93.223 | 267.8 | 1.118 | 0.165 |
| KR-63_05_obsz-08_fot-1.7 | 71.57 | 0.266 | 0.013 | 0.57 | 0.154 | 0.092 | 0.189 | 21.318 | 94.304 | 378.7 | 0.99 | 0.105 |
| UDR-7_01_obsz-01_fot-1.1 | 69.137 | 0.465 | 0.062 | 0.448 | 0.451 | 0.081 | 1.233 | 21.564 | 93.523 | 56.1 | 1.364 | 0.143 |
| UDR-7_01_obsz-01_fot-1.2 | 69.962 | 0.294 | 0.027 | 0.416 | 0.456 | 0.038 | 1 | 21.434 | 93.719 | 70.0 | 1.166 | 0.065 |
| UDR-7_01_obsz-01_fot-1.3 | 69.586 | 0.405 | 0.028 | 0.498 | 0.441 | 0.068 | 1.036 | 21.499 | 93.642 | 67.2 | 1.344 | 0.096 |
| UDR-7_01_obsz-01_fot-1.4 | 69.769 | 0.498 | 0.019 | 0.523 | 0.442 | 0.092 | 0.916 | 21.582 | 93.934 | 76.2 | 1.463 | 0.111 |
| UDR-7_01_obsz-01_fot-1.5 | 69.595 | 0.481 | 0.019 | 0.485 | 0.439 | 0.063 | 0.829 | 21.411 | 93.392 | 84.0 | 1.405 | 0.082 |
| UDR-7_01_obsz-01_fot-1.6 | 69.702 | 0.412 | 0.075 | 0.471 | 0.488 | 0.072 | 1.216 | 21.688 | 94.174 | 57.3 | 1.371 | 0.147 |
| UDR-7_01_obsz-01_fot-1.7 | 67.557 | 0.746 | 0.102 | 0.52 | 0.427 | 0.118 | 2.31 | 22.134 | 93.98 | 29.2 | 1.693 | 0.22 |
| UDR-7_01_obsz-01_fot-1.8 | 68.033 | 0.593 | 0.08 | 0.495 | 0.449 | 0.076 | 2.268 | 22.082 | 94.222 | 30.0 | 1.537 | 0.156 |
| UDR-7_01_obsz-01_fot-1.9 | 68.621 | 0.783 | 0.075 | 0.48 | 0.426 | 0.152 | 1.767 | 22.096 | 94.457 | 38.8 | 1.689 | 0.227 |
| UDR-7_01_obsz-01_fot-1.10 | 69.937 | 0.425 | 0.048 | 0.465 | 0.444 | 0.068 | 0.892 | 21.517 | 93.883 | 78.4 | 1.334 | 0.116 |
| UDR-7_01_obsz-02_fot-1.1 | 69.115 | 0.448 | 0.066 | 0.452 | 0.451 | 0.091 | 1.432 | 21.673 | 93.805 | 48.3 | 1.351 | 0.157 |
| UDR-7_01_obsz-02_fot-1.2 | 68.396 | 0.914 | 0.051 | 0.516 | 0.472 | 0.21 | 1.627 | 22.121 | 94.356 | 42.0 | 1.902 | 0.261 |
| UDR-7_01_obsz-02_fot-1.3 | 66.203 | 1.216 | 0.128 | 0.512 | 0.517 | 0.28 | 2.652 | 22.543 | 94.139 | 25.0 | 2.245 | 0.408 |
| UDR-7_01_obsz-03_fot-1.1 | 68.706 | 0.415 | 0.053 | 0.475 | 0.439 | 0.084 | 1.484 | 21.56 | 93.246 | 46.3 | 1.329 | 0.137 |
| UDR-7_01_obsz-03_fot-1.2 | 67.921 | 0.639 | 0.094 | 0.497 | 0.473 | 0.122 | 1.86 | 21.862 | 93.551 | 36.5 | 1.609 | 0.216 |
| UDR-7_01_obsz-03_fot-1.3 | 67.283 | 0.656 | 0.1 | 0.462 | 0.453 | 0.123 | 2.297 | 21.946 | 93.363 | 29.3 | 1.571 | 0.223 |
| UDR-10_3_obsz-03_fot-2.5 | 69.72 | 0.4 | 0.069 | 0.412 | 0.2 | 0.081 | 1.717 | 21.865 | 94.515 | 40.6 | 1.012 | 0.15 |
| UDR-10_3_obsz-03_fot-2.6 | 67.932 | 0.686 | 0.1 | 0.459 | 0.235 | 0.219 | 2.552 | 22.293 | 94.551 | 26.6 | 1.38 | 0.319 |
| UDR-10_3_obsz-03_fot-2.7 | 69.483 | 0.4 | 0.076 | 0.392 | 0.144 | 0.135 | 1.586 | 21.691 | 93.932 | 43.8 | 0.936 | 0.211 |
| UDR-10_3_obsz-03_fot-2.8 | 69.964 | 0.44 | 0.1 | 0.458 | 0.236 | 0.149 | 1.426 | 21.851 | 94.682 | 49.1 | 1.134 | 0.249 |
| UDR-10_3_obsz-03_fot-2.9 | 71.984 | 0.01 | b.d.l. | 0.006 | 0.006 | b.d.l. | 0.387 | 20.916 | 93.349 | 186.0 | 0.022 | b.d.l. |
| DR-10_4_obsz-03_fot-1.5 | 69.612 | 0.272 | b.d.l. | 0.492 | 1.262 | 0.05 | 0.185 | 21.183 | 93.166 | 376.3 | 2.026 | 0.05 |
| UDR-10_4_obsz-03_fot-1.6 | 69.668 | 0.428 | 0.031 | 0.462 | 0.744 | 0.058 | 0.285 | 21.156 | 92.868 | 244.4 | 1.634 | 0.089 |
| UDR-10_4_obsz-04_fot-1.5 | 70.716 | 0.336 | 0.004 | 0.563 | 0.712 | 0.063 | 0.261 | 21.378 | 94.063 | 270.9 | 1.611 | 0.067 |
| UDR-11_05_obsz-04_fot-1.5 | 71.428 | 0.198 | 0.009 | 0.245 | 0.016 | 0.038 | 0.059 | 20.856 | 92.907 | 1210.6 | 0.459 | 0.047 |
| UDR-11_05_obsz-04_fot-1.6 | 71.334 | 0.171 | 0.014 | 0.22 | 0.025 | 0.028 | 0.22 | 20.924 | 93.078 | 324.2 | 0.416 | 0.042 |
| UDR-11_06_obsz-02_fot-1.7 | 71.689 | 0.118 | b.d.l. | 0.153 | 0.023 | 0.033 | 0.094 | 20.851 | 93.049 | 762.6 | 0.294 | 0.033 |
| UDR-11_06_obsz-02_fot-1.8 | 71.301 | 0.139 | 0.002 | 0.211 | 0.028 | 0.039 | 0.059 | 20.77 | 92.684 | 1208.5 | 0.378 | 0.041 |
| UDR-11_06_obsz-02_fot-1.9 | 71.372 | 0.118 | 0.026 | 0.218 | 0.021 | 0.038 | 0.057 | 20.788 | 92.786 | 1252.1 | 0.357 | 0.064 |
| UDR-11_06_obsz-02_fot-1.10 | 71.334 | 0.175 | b.d.l. | 0.188 | 0.061 | 0.048 | 0.066 | 20.84 | 92.88 | 1080.8 | 0.424 | 0.048 |
| UDR-11_06_obsz-02_fot-1.11 | 70.858 | 0.232 | 0.041 | 0.2 | 0.034 | 0.042 | 0.102 | 20.766 | 92.39 | 694.7 | 0.466 | 0.083 |
| UDR-11_06_obsz-04_fot-1.1 | 71.036 | 0.231 | 0.013 | 0.231 | 0.042 | 0.005 | 0.069 | 20.781 | 92.515 | 1029.5 | 0.504 | 0.018 |
| UDR-11_06_obsz-04_fot-1.2 | 71.3 | 0.141 | b.d.l. | 0.225 | 0.018 | 0.037 | 0.026 | 20.76 | 92.65 | 2742.3 | 0.384 | 0.037 |
| UDR-11_06_obsz-04_fot-1.3 | 71.144 | 0.21 | 0.006 | 0.21 | 0.051 | 0.041 | 0.064 | 20.825 | 92.697 | 1111.6 | 0.471 | 0.047 |
| UDR-11_06_obsz-04_fot-1.4 | 71.397 | 0.123 | 0.002 | 0.262 | 0.033 | 0.016 | 0.056 | 20.791 | 92.855 | 1274.9 | 0.418 | 0.018 |
| UDR-11_06_obsz-06_fot-1.1 | 70.791 | 0.172 | 0.013 | 0.214 | 0.051 | 0.028 | 0.062 | 20.659 | 92.072 | 1141.8 | 0.437 | 0.041 |
| UDR-11_06_obsz-06_fot-1.2 | 71.377 | 0.166 | 0.023 | 0.232 | 0.048 | 0.011 | 0.113 | 20.858 | 92.937 | 631.7 | 0.446 | 0.034 |
Appendix B
| Analytical Point | Fe | Al | Mn | V | Cr | Mg | Ti | O | Total | Fe/Ti | Al + V + Cr | Mn + Mg |
|---|---|---|---|---|---|---|---|---|---|---|---|---|
| KR-24_03_obsz-01_fot-1.5 | 34.816 | 0.023 | 0.687 | 0.151 | 0.027 | 1.029 | 31.097 | 31.771 | 99.727 | 1.12 | 0.201 | 1.716 |
| KR-24_03_obsz-03_fot-6.11 | 33.898 | 0.03 | 1.179 | 0.16 | 0.006 | 0.897 | 31.864 | 32.056 | 100.191 | 1.06 | 0.196 | 2.076 |
| KR-24_03_obsz-03_fot-6.12 | 34.182 | 0.017 | 0.832 | 0.147 | 0.037 | 1.053 | 31.891 | 32.162 | 100.388 | 1.07 | 0.201 | 1.885 |
| KR-24_03_obsz-03_fot-6.13 | 34.43 | 0.026 | 0.72 | 0.149 | b.d.l. | 1.038 | 31.324 | 31.782 | 99.477 | 1.10 | 0.175 | 1.758 |
| KRZ-56_02_obsz-01_fot-1.4 | 33.751 | 2.994 | 0.785 | 0.111 | 0.125 | 1.115 | 28.613 | 32.547 | 100.156 | 1.18 | 3.23 | 1.9 |
| KRZ-56_02_obsz-01_fot-1.5 | 35.652 | 0.02 | 0.87 | 0.155 | 0.041 | 0.234 | 31.475 | 31.793 | 100.391 | 1.13 | 0.216 | 1.104 |
| KRZ-56_02_obsz-01_fot-2.1 | 35.859 | 0.025 | 0.709 | 0.123 | 0.043 | 0.47 | 29.858 | 30.845 | 97.982 | 1.20 | 0.191 | 1.179 |
| KRZ-56_02_obsz-01_fot-2.2 | 35.583 | 0.003 | 0.76 | 0.118 | 0.018 | 0.507 | 31.219 | 31.716 | 100.081 | 1.14 | 0.139 | 1.267 |
| KR-63_05_obsz-02_fot-1.7 | 33.15 | 2.163 | 0.91 | 0.161 | 0.067 | 1.375 | 29.353 | 32.331 | 99.599 | 1.13 | 2.391 | 2.285 |
| KR-63_05_obsz-02_fot-1.8 | 34.189 | 1.378 | 0.866 | 0.177 | 0.074 | 1.075 | 30.45 | 32.457 | 100.688 | 1.12 | 1.629 | 1.941 |
| KR-63_05_obsz-03_fot-1.4 | 34.242 | 0.017 | 0.741 | 0.117 | b.d.l. | 1.284 | 31.416 | 31.95 | 99.839 | 1.09 | 0.134 | 2.025 |
| KR-63_05_obsz-03_fot-1.5 | 35.033 | 0.027 | 0.645 | 0.111 | 0.022 | 1.226 | 31.196 | 31.984 | 100.332 | 1.12 | 0.16 | 1.871 |
| KR-63_05_obsz-04_fot-1.4 | 34.668 | 0.026 | 0.719 | 0.091 | 0.036 | 1.194 | 31.272 | 31.932 | 100.062 | 1.11 | 0.153 | 1.913 |
| KR-63_05_obsz-05_fot-1.6 | 33.937 | 1.186 | 0.896 | 0.166 | 0.082 | 1.352 | 29.661 | 31.888 | 99.261 | 1.14 | 1.434 | 2.248 |
| KR-63_05_obsz-05_fot-1.7 | 34.769 | 0.038 | 0.813 | 0.143 | 0.042 | 1.037 | 30.583 | 31.45 | 98.931 | 1.14 | 0.223 | 1.85 |
| KR-63_05_obsz-05_fot-1.8 | 34.142 | 0.017 | 0.727 | 0.081 | 0.033 | 1.366 | 31.603 | 32.076 | 100.058 | 1.08 | 0.131 | 2.093 |
| KR-63_05_obsz-05_fot-1.9 | 33.966 | 0.025 | 0.722 | 0.113 | 0.019 | 1.3 | 31.214 | 31.753 | 99.173 | 1.09 | 0.157 | 2.022 |
| KR-63_05_obsz-08_fot-1.1 | 35.008 | 0.024 | 0.66 | 0.125 | 0.003 | 1.127 | 30.302 | 31.318 | 98.699 | 1.16 | 0.152 | 1.787 |
| KR-63_05_obsz-08_fot-1.2 | 34.613 | 0.015 | 0.718 | 0.12 | 0.012 | 1.168 | 31.365 | 31.953 | 100.038 | 1.10 | 0.147 | 1.886 |
| KR-63_05_obsz-08_fot-1.3 | 35.232 | 0.018 | 0.703 | 0.141 | 0.016 | 1.208 | 30.875 | 31.818 | 100.052 | 1.14 | 0.175 | 1.911 |
| KR-63_05_obsz-08_fot-1.4 | 35.008 | 0.032 | 0.661 | 0.132 | 0.019 | 1.211 | 30.839 | 31.755 | 99.77 | 1.14 | 0.183 | 1.872 |
| UDR-7_01_obsz-02_fot-1.4 | 35.119 | b.d.l. | 0.712 | 0.113 | b.d.l | 0.803 | 31.191 | 31.721 | 99.782 | 1.13 | 0.113 | 1.515 |
| UDR-7_01_obsz-02_fot-1.5 | 35.459 | 0.007 | 0.592 | 0.086 | 0.025 | 0.737 | 30.943 | 31.577 | 99.564 | 1.15 | 0.118 | 1.329 |
| UDR-7_01_obsz-02_fot-1.6 | 35.309 | b.d.l. | 0.654 | 0.125 | b.d.l. | 0.651 | 31.45 | 31.848 | 100.177 | 1.12 | 0.125 | 1.305 |
| UDR-7_01_obsz-02_fot-1.7 | 35.122 | 0.051 | 0.639 | 0.049 | 0.005 | 0.689 | 31.568 | 31.883 | 100.1 | 1.11 | 0.105 | 1.328 |
| UDR-7_01_obsz-03_fot-1.4 | 35.19 | 0.038 | 0.974 | 0.152 | 0.051 | 0.373 | 30.946 | 31.439 | 99.259 | 1.14 | 0.241 | 1.347 |
| UDR-7_01_obsz-03_fot-1.5 | 35.495 | 0.019 | 0.951 | 0.149 | 0.027 | 0.336 | 31.009 | 31.505 | 99.582 | 1.14 | 0.195 | 1.287 |
| UDR-7_01_obsz-03_fot-1.6 | 35.526 | 0.011 | 1 | 0.083 | 0.028 | 0.369 | 31.096 | 31.561 | 99.733 | 1.14 | 0.122 | 1.369 |
| UDR-10_3_obsz-03_fot-2.1 | 34.103 | 0.025 | 0.641 | 0.1 | 0.04 | 1.63 | 31.384 | 32.11 | 100.084 | 1.09 | 0.165 | 2.271 |
| UDR-10_3_obsz-03_fot-2.2 | 33.651 | 0.017 | 0.641 | 0.122 | 0.007 | 1.603 | 31.745 | 32.176 | 100.029 | 1.06 | 0.146 | 2.244 |
| UDR-10_3_obsz-03_fot-2.3 | 34.205 | 0.045 | 0.596 | 0.13 | b.d.l. | 1.631 | 31.516 | 32.21 | 100.379 | 1.09 | 0.175 | 2.227 |
| UDR-10_3_obsz-03_fot-2.4 | 33.959 | 0.02 | 0.685 | 0.072 | 0.015 | 1.659 | 31.636 | 32.245 | 100.436 | 1.07 | 0.107 | 2.344 |
| UDR-10_4_obsz-03_fot-1.3 | 35.145 | 0.026 | 0.763 | 0.164 | 0.033 | 0.56 | 31.681 | 31.941 | 100.318 | 1.11 | 0.223 | 1.323 |
| UDR-10_4_obsz-03_fot-1.4 | 34.935 | 0.202 | 0.724 | 0.138 | 0.082 | 0.631 | 31.478 | 31.96 | 100.21 | 1.11 | 0.422 | 1.355 |
| UDR-10_4_obsz-04_fot-1.9 | 35.536 | 0.119 | 0.954 | 0.172 | 0.073 | 0.411 | 31.27 | 31.854 | 100.448 | 1.14 | 0.364 | 1.365 |
| UDR-10_4_obsz-04_fot-1.10 | 34.149 | 4.388 | 0.81 | 0.122 | 0.586 | 1.189 | 26.678 | 32.885 | 100.889 | 1.28 | 5.096 | 1.999 |
| UDR-10_4_obsz-01_fot-1.5 | 35.32 | 0.01 | 0.776 | 0.141 | 0.027 | 0.392 | 31.523 | 31.764 | 99.999 | 1.12 | 0.178 | 1.168 |
| UDR-10_4_obsz-01_fot-1.6 | 35.792 | 0.018 | 0.688 | 0.112 | b.d.l. | 0.52 | 31.344 | 31.822 | 100.358 | 1.14 | 0.13 | 1.208 |
| UDR-11_04_obsz-02_fot-2.11 | 36.507 | 0.03 | 0.928 | 0.18 | 0.027 | 0.646 | 30.642 | 31.789 | 100.875 | 1.19 | 0.237 | 1.574 |
| UDR-11_04_obsz-01_fot-4.11 | 37.156 | 0.02 | 0.881 | 0.181 | b.d.l. | 0.736 | 30.086 | 31.624 | 100.793 | 1.23 | 0.201 | 1.617 |
| UDR-11_04_obsz-01_fot-4.12 | 38.197 | 0.03 | 0.867 | 0.174 | 0.016 | 0.697 | 28.812 | 31.05 | 99.937 | 1.33 | 0.22 | 1.564 |
| UDR-11_05_obsz-01_fot-1.7 | 37.282 | 0.026 | 0.851 | 0.15 | 0.026 | 0.647 | 29.766 | 31.396 | 100.29 | 1.25 | 0.202 | 1.498 |
| UDR-11_05_obsz-01_fot-1.8 | 36.302 | 0.011 | 0.798 | 0.114 | b.d.l. | 0.797 | 30.146 | 31.38 | 99.615 | 1.20 | 0.125 | 1.595 |
| UDR-11_06_obsz-02_fot-1.2 | 36.005 | 0.027 | 0.941 | 0.177 | 0 | 0.845 | 30.63 | 31.787 | 100.611 | 1.18 | 0.204 | 1.786 |
| UDR-11_06_obsz-02_fot-1.3 | 36.247 | 0.026 | 0.935 | 0.075 | 0.028 | 0.804 | 30.118 | 31.434 | 99.863 | 1.20 | 0.129 | 1.739 |
| UDR-11_06_obsz-02_fot-1.4 | 38.566 | 0.025 | 0.811 | 0.141 | 0.003 | 0.786 | 28.496 | 30.989 | 99.985 | 1.35 | 0.169 | 1.597 |
| UDR-11_06_obsz-02_fot-1.5 | 39.905 | 0.031 | 0.663 | 0.176 | 0.037 | 0.717 | 26.826 | 30.172 | 98.608 | 1.49 | 0.244 | 1.38 |
| UDR-11_06_obsz-02_fot-1.6 | 39.352 | 0.023 | 0.762 | 0.103 | 0.061 | 0.743 | 28.445 | 31.145 | 100.82 | 1.38 | 0.187 | 1.505 |
| UDR-11_06_obsz-04_fot-1.5 | 36.368 | 0.017 | 0.89 | 0.183 | 0.035 | 0.821 | 30.057 | 31.46 | 99.967 | 1.21 | 0.235 | 1.711 |
| UDR-11_06_obsz-04_fot-1.6 | 36.796 | 0.024 | 0.858 | 0.171 | b.d.l. | 0.808 | 29.522 | 31.206 | 99.514 | 1.25 | 0.195 | 1.666 |
| UDR-11_06_obsz-04_fot-1.7 | 36.502 | 0.023 | 0.858 | 0.229 | b.d.l. | 0.806 | 30.188 | 31.606 | 100.415 | 1.21 | 0.252 | 1.664 |
| UDR-11_06_obsz-06_fot-1.3 | 35.281 | 0.093 | 1.009 | 0.117 | 0.024 | 0.295 | 31.791 | 32.033 | 100.78 | 1.11 | 0.234 | 1.304 |
| UDR-11_05_obsz-03_fot-1.7 | 36.408 | 0.029 | 0.889 | 0.147 | 0.031 | 0.745 | 30.365 | 31.612 | 100.376 | 1.20 | 0.207 | 1.634 |
| UDR-11_05_obsz-03_fot-1.8 | 37.015 | 0.021 | 0.878 | 0.179 | b.d.l. | 0.818 | 29.643 | 31.372 | 100.097 | 1.25 | 0.2 | 1.696 |
| UDR-11_05_obsz-04_fot-1.7 | 34.846 | 0.017 | 1.045 | 0.161 | 0.039 | 0.703 | 31.466 | 31.913 | 100.3 | 1.11 | 0.217 | 1.748 |
| UDR-11_05_obsz-04_fot-1.8 | 34.359 | 0.02 | 0.999 | 0.149 | 0.011 | 0.771 | 31.327 | 31.705 | 99.431 | 1.10 | 0.18 | 1.77 |
| UDR-11_05_obsz-04_fot-1.9 | 33.303 | 0.348 | 1.117 | 0.113 | 0.001 | 0.853 | 31.636 | 31.976 | 99.537 | 1.05 | 0.462 | 1.97 |
| UDR-11_06_obsz-02_fot-1.1 | 39.206 | 0.071 | 0.759 | 0.225 | 0.019 | 0.772 | 27.528 | 30.563 | 99.24 | 1.42 | 0.315 | 1.531 |
Appendix C
| Analytical Point | Fe | Al | Mn | V | Cr | Mg | Ti | Zn | O | Total | Fe/Ti | Al + V + Cr | Mn + Mg |
|---|---|---|---|---|---|---|---|---|---|---|---|---|---|
| KR-24_03_obsz-01_fot-1.6 | 17.956 | 32.652 | 0.128 | 0.029 | 0.172 | 7.44 | 0.179 | 2.254 | 39.913 | 100.782 | 100.3 | 32.853 | 7.568 |
| KR-24_03_obsz-01_fot-1.7 | 17.446 | 32.675 | 0.157 | 0.031 | 0.199 | 7.301 | 0.244 | 2.163 | 39.737 | 100.031 | 71.5 | 32.905 | 7.458 |
| KR-24_03_obsz-03_fot-6.1 | 15.136 | 33.091 | 0.131 | 0.023 | 0.274 | 8.223 | 0.317 | 2.217 | 40.127 | 99.559 | 47.7 | 33.388 | 8.354 |
| KR-24_03_obsz-03_fot-6.2 | 15.922 | 32.714 | 0.127 | 0.046 | 0.294 | 7.955 | 0.427 | 2.084 | 39.896 | 99.479 | 37.3 | 33.054 | 8.082 |
| KR-24_03_obsz-03_fot-6.3 | 15.281 | 33.157 | 0.113 | 0.001 | 0.242 | 8.111 | 0.313 | 2.197 | 40.121 | 99.605 | 48.8 | 33.4 | 8.224 |
| KR-24_03_obsz-03_fot-6.4 | 16.837 | 32.689 | 0.116 | 0.033 | 0.143 | 7.717 | 0.069 | 2.246 | 39.711 | 99.617 | 244.0 | 32.865 | 7.833 |
| KR-24_03_obsz-03_fot-6.5 | 17.716 | 32.332 | 0.136 | 0.041 | 0.157 | 7.119 | 0.026 | 2.141 | 39.202 | 98.9 | 681.4 | 32.53 | 7.255 |
| KRZ-56_02_obsz-01_fot-1.6 | 22.707 | 31.653 | 0.157 | 0.041 | 0.094 | 5.144 | 0.02 | 1.69 | 38.612 | 100.184 | 1135.4 | 31.788 | 5.301 |
| KRZ-56_02_obsz-01_fot-1.7 | 22.74 | 31.296 | 0.196 | 0.065 | 0.088 | 4.852 | 0.009 | 1.467 | 38.045 | 98.775 | 2526.7 | 31.449 | 5.048 |
| KRZ-56_02_obsz-01_fot-2.3 | 21.653 | 32.146 | 0.132 | 0.028 | 0.13 | 5.584 | 0.519 | 1.42 | 39.288 | 100.916 | 41.7 | 32.304 | 5.716 |
| KRZ-56_02_obsz-01_fot-2.4 | 21.852 | 31.73 | 0.172 | 0.038 | 0.13 | 5.556 | 0.61 | 1.286 | 38.998 | 100.39 | 35.8 | 31.898 | 5.728 |
| KRZ-56_02_obsz-01_fot-2.5 | 22.833 | 31.003 | 0.136 | 0.06 | 0.109 | 5.18 | 0.023 | 1.773 | 38.097 | 99.225 | 992.7 | 31.172 | 5.316 |
| KR-63_05_obsz-02_fot-1.5 | 18.734 | 31.2 | 0.131 | 0.063 | 0.137 | 7.849 | 0.029 | 0.946 | 38.678 | 97.781 | 646.0 | 31.4 | 7.98 |
| KR-63_05_obsz-04_fot-1.2 | 17.419 | 32.533 | 0.079 | 0.017 | 0.166 | 8.368 | 0.179 | 0.95 | 39.917 | 99.719 | 97.3 | 32.716 | 8.447 |
| KR-63_05_obsz-04_fot-1.3 | 16.769 | 32.971 | 0.111 | 0.054 | 0.15 | 8.439 | 0.28 | 0.855 | 40.231 | 99.901 | 59.9 | 33.175 | 8.55 |
| KR-63_05_obsz-05_fot-1.1 | 15.522 | 33.757 | 0.076 | 0.057 | 0.186 | 9.205 | 0.078 | 0.387 | 40.826 | 100.185 | 199.0 | 34 | 9.281 |
| KR-63_05_obsz-05_fot-1.2 | 15.406 | 33.842 | 0.098 | 0.052 | 0.204 | 9.352 | 0.092 | 0.413 | 40.993 | 100.513 | 167.5 | 34.098 | 9.45 |
| KR-63_05_obsz-05_fot-1.3 | 14.822 | 34.099 | 0.075 | 0.055 | 0.16 | 9.441 | 0.066 | 0.431 | 41.082 | 100.288 | 224.6 | 34.314 | 9.516 |
| KR-63_05_obsz-05_fot-1.4 | 18.37 | 32.113 | 0.12 | 0.042 | 0.131 | 7.931 | 0.019 | 0.902 | 39.406 | 99.051 | 966.8 | 32.286 | 8.051 |
| KR-63_05_obsz-05_fot-1.5 | 18.331 | 31.976 | 0.117 | 0.072 | 0.118 | 8.062 | 0.032 | 0.941 | 39.399 | 99.131 | 572.8 | 32.166 | 8.179 |
| KR-63_05_obsz-08_fot-1.8 | 17.23 | 32.582 | 0.124 | 0.032 | 0.17 | 8.36 | 0.244 | 0.859 | 39.952 | 99.667 | 70.6 | 32.784 | 8.484 |
| KR-63_05_obsz-08_fot-1.9 | 17.483 | 32.697 | 0.113 | 0.054 | 0.138 | 8.264 | 0.213 | 0.916 | 40.028 | 99.93 | 82.1 | 32.889 | 8.377 |
| UDR-7_01_obsz-01_fot-1.11 | 21.062 | 31.72 | 0.139 | 0.05 | 0.585 | 6.315 | 0.035 | 1.432 | 39.13 | 100.516 | 601.8 | 32.355 | 6.454 |
| UDR-7_01_obsz-01_fot-1.12 | 20.479 | 32.037 | 0.145 | 0.043 | 0.561 | 6.419 | 0.024 | 1.461 | 39.302 | 100.523 | 853.3 | 32.641 | 6.564 |
| UDR-10_4_obsz-03_fot-1.1 | 23.269 | 30.323 | 0.142 | 0.055 | 1.206 | 5.678 | 0.342 | 0.865 | 38.461 | 100.443 | 68.0 | 31.584 | 5.82 |
| UDR-10_4_obsz-03_fot-1.2 | 22.083 | 31.074 | 0.155 | 0.047 | 1.449 | 5.378 | 0.459 | 0.705 | 38.732 | 100.121 | 48.1 | 32.57 | 5.533 |
| UDR-10_4_obsz-04_fot-1.1 | 24.015 | 29.755 | 0.147 | 0.064 | 0.761 | 5.562 | 0.035 | 0.957 | 37.696 | 99.007 | 686.1 | 30.58 | 5.709 |
| UDR-10_4_obsz-04_fot-1.2 | 22.769 | 30.63 | 0.121 | 0.04 | 0.851 | 5.761 | 0.016 | 1.109 | 38.298 | 99.621 | 1423.1 | 31.521 | 5.882 |
| UDR-10_4_obsz-04_fot-1.3 | 22.656 | 31.383 | 0.137 | 0.06 | 0.924 | 5.501 | 0.049 | 0.369 | 38.661 | 99.8 | 462.4 | 32.367 | 5.638 |
| UDR-10_4_obsz-04_fot-1.4 | 22.583 | 30.658 | 0.173 | 0.052 | 0.871 | 5.478 | 0.121 | 0.362 | 38.037 | 98.486 | 186.6 | 31.581 | 5.651 |
Appendix D
| Analytical Point | S | Ni | Co | Fe | Total | Analytical Point | S | Ni | Co | Fe | Total |
|---|---|---|---|---|---|---|---|---|---|---|---|
| 10/1 | 39.45 | 0.55 | 0.23 | 59.12 | 99.35 | 4/1 | 38.87 | 0.79 | 0.17 | 59.82 | 99.65 |
| 11/1 | 39.5 | 0.46 | 0.21 | 58.85 | 99.02 | 6/1 | 39.3 | 1.01 | 0.16 | 59.32 | 99.79 |
| 11/1 | 39 | 0.66 | 0.18 | 59.53 | 99.37 | 8/1 | 38.55 | 1.02 | 0.2 | 59.33 | 99.1 |
| 12/1 | 39.27 | 0.76 | 0.12 | 59.22 | 99.37 | 9/1 | 38.61 | 0.99 | 0.14 | 59.4 | 99.14 |
| 6/1 | 38.72 | 0.67 | 0.12 | 59.68 | 99.19 | 10/1 | 38.99 | 0.97 | 0.08 | 59.12 | 99.16 |
| 7/1 | 38.72 | 0.75 | 0.13 | 59.57 | 99.17 | 8/1 | 38.82 | 1 | 0.14 | 59.48 | 99.44 |
| 8/1 | 38.65 | 0.72 | 0.13 | 59.37 | 98.87 | 12/1 | 39.1 | 1 | 0.13 | 59.25 | 99.48 |
| 3/1 | 39.41 | 0.62 | 0.1 | 59.74 | 99.87 | 1/1 | 39.052 | 0.223 | 0.115 | 60.038 | 99.428 |
| 4/1 | 39.74 | 0.62 | 0.11 | 59.69 | 100.16 | 2/1 | 38.991 | 0.249 | 0.136 | 59.738 | 99.114 |
| 9/1 | 38.58 | 0.76 | 0.16 | 59.61 | 99.11 | 7/1 | 39.117 | 0.258 | 0.099 | 59.08 | 98.554 |
| 10/1 | 39.36 | 0.77 | 0.13 | 59.56 | 99.82 | 5/1 | 38.627 | 0.392 | 0.178 | 60.288 | 99.485 |
| 11/1 | 39.21 | 0.37 | 0.05 | 59.58 | 99.21 | 6/1 | 38.742 | 0.347 | 0.134 | 60.183 | 99.406 |
| 6/1 | 39.23 | 0.6 | 0.16 | 59.56 | 99.55 | 7/1 | 38.883 | 0.303 | 0.171 | 60.215 | 99.572 |
| 7/1 | 39.34 | 0.6 | 0.18 | 59.79 | 99.91 | 3/1 | 39.73 | 0.275 | 0.098 | 59.715 | 99.818 |
| 7/1 | 38.55 | 0.87 | 0.18 | 59.6 | 99.2 | 4/1 | 39.42 | 0.246 | 0.186 | 59.794 | 99.646 |
| 3/1 | 39.02 | 0.65 | 0.12 | 59.36 | 99.15 | 3/1 | 39.685 | 0.635 | 0.109 | 59.315 | 99.744 |
| 4/1 | 39.29 | 0.61 | 0.15 | 59.74 | 99.79 | 1/1 | 39.028 | 0.227 | 0.185 | 59.493 | 98.933 |
| 10/1 | 38.49 | 1 | 0.13 | 59.94 | 99.56 | 2/1 | 39.093 | 0.277 | 0.221 | 59.403 | 98.994 |
| 11/1 | 38.75 | 1.03 | 0.16 | 59.9 | 99.84 | 3/1 | 38.891 | 0.272 | 0.193 | 59.794 | 99.15 |
| 2/1 | 38.34 | 1.6 | 0.15 | 59.02 | 99.11 | 1/1 | 39.478 | 0.26 | 0.179 | 59.396 | 99.313 |
| 3/1 | 38.76 | 4 | 0.09 | 56.13 | 98.98 | 2/1 | 39.542 | 0.225 | 0.264 | 59.564 | 99.595 |
| 10/1 | 38.77 | 0.6 | 0.14 | 59.71 | 99.22 | 1/1 | 39.459 | 0.201 | 0.266 | 59.151 | 99.077 |
| 6/1 | 39.25 | 0.44 | 0.13 | 59.44 | 99.26 | 2/1 | 39.054 | 0.196 | 0.245 | 59.589 | 99.084 |
| 7/1 | 39.22 | 0.31 | 0.11 | 59.75 | 99.39 | 1/1 | 38.969 | 0.243 | 0.116 | 60.198 | 99.526 |
| 9/1 | 39.01 | 0.23 | 0.15 | 59.56 | 98.95 | 2/1 | 38.689 | 0.232 | 0.179 | 60.526 | 99.626 |
| 10/1 | 39.14 | 0.24 | 0.12 | 59.76 | 99.26 | 1/1 | 39.699 | 0.19 | 0.201 | 59.761 | 99.851 |
| 1/1 | 39.04 | 0.46 | 0.15 | 59.26 | 98.91 | 2/1 | 39.751 | 0.213 | 0.21 | 59.684 | 99.858 |
| 2/1 | 39.04 | 0.39 | 0.13 | 59.48 | 99.04 | 9/1 | 38.914 | 0.214 | 0.237 | 60.323 | 99.688 |
| 5/1 | 38.97 | 0.94 | 0.19 | 59.41 | 99.51 | 5/1 | 38.952 | 0.202 | 0.239 | 59.41 | 98.803 |
| 6/1 | 38.76 | 0.94 | 0.16 | 59.26 | 99.12 | 6/1 | 38.996 | 0.217 | 0.278 | 59.065 | 98.556 |
| 3/1 | 39.11 | 0.97 | 0.14 | 59.62 | 99.84 |
Appendix E
| Analytical Point | S | Cu | Ni | Co | Fe | Total | Analytical Point | S | Cu | Ni | Co | Fe | Total |
|---|---|---|---|---|---|---|---|---|---|---|---|---|---|
| 5/1 | 33.51 | 0.07 | 26.06 | 6.93 | 32.57 | 99.14 | 3/1 | 33.22 | 0.09 | 34.45 | 6.71 | 26.1 | 100.57 |
| 6/1 | 32.15 | 0.09 | 29.24 | 15.3 | 22.74 | 99.52 | 4/1 | 33.44 | 4.38 | 30.33 | 5.97 | 26.62 | 100.74 |
| 7/1 | 32.95 | 0.09 | 29.08 | 15.23 | 22.26 | 99.61 | 5/1 | 33.61 | 0.21 | 33.94 | 7.04 | 25.86 | 100.66 |
| 5/1 | 32.96 | 0.21 | 35.78 | 2.57 | 28.2 | 99.72 | 2/1 | 32.74 | 0.12 | 37.4 | 2.18 | 27.58 | 100.02 |
| 6/1 | 33.21 | 3.2 | 33.01 | 2.44 | 27.95 | 99.81 | 3/1 | 32.73 | 0.07 | 36.95 | 3.38 | 26.99 | 100.12 |
| 1/1 | 32.8 | 0.11 | 36.76 | 1.4 | 28.54 | 99.61 | 4/1 | 32.91 | 0.05 | 36.79 | 3.02 | 26.99 | 99.76 |
| 2/1 | 33.09 | 0.06 | 37.19 | 1.39 | 28.9 | 100.63 | 1/1 | 33.08 | 0.11 | 35.92 | 2.65 | 26.37 | 98.13 |
| 3/1 | 33.2 | 0.11 | 36.33 | 1.22 | 28.19 | 99.05 | 2/1 | 33.25 | 0.01 | 36.11 | 2.74 | 27.1 | 99.21 |
| 4/1 | 35.26 | 0.23 | 26.59 | 1.12 | 37.35 | 100.55 | 3/1 | 33.41 | 0.41 | 36.41 | 2.56 | 27.11 | 99.9 |
| 8/1 | 33.82 | 0.06 | 33.58 | 6.89 | 26.7 | 101.05 | 4/1 | 33.22 | 0.05 | 36.58 | 3.32 | 26.96 | 100.13 |
| 9/1 | 33.5 | 0.03 | 33.49 | 6.94 | 26.64 | 100.6 | 3/1 | 33.03 | 0.19 | 39.22 | 2.82 | 27.12 | 102.38 |
| 1/1 | 32.24 | 0.13 | 33.92 | 7.15 | 26.73 | 100.17 | 4/1 | 33.02 | 0.05 | 38.35 | 3.67 | 27.37 | 102.46 |
| 4/1 | 32.89 | 0.11 | 36.33 | 3.16 | 27.23 | 99.72 | 12/1 | 32.93 | 0.05 | 38.08 | 3.72 | 27.28 | 102.06 |
| 5/1 | 32.7 | 0.07 | 36.42 | 3.09 | 27.14 | 99.42 | 13/1 | 32.72 | 0.07 | 38.42 | 3.73 | 26.95 | 101.89 |
| 6/1 | 32.43 | 0.05 | 36.65 | 2.96 | 27.27 | 99.36 | 5/1 | 33.01 | 0.11 | 36.14 | 3.6 | 27.06 | 99.92 |
| 1/1 | 33.01 | 0.36 | 39.23 | 1.43 | 26.47 | 100.5 | 6/1 | 33.09 | 0.11 | 36.36 | 3.19 | 27.57 | 100.32 |
| 2/1 | 32.74 | 1.05 | 38.06 | 1.55 | 26.28 | 99.68 | 7/1 | 41.19 | 0.08 | 27.63 | 3.6 | 27.22 | 99.72 |
| 3/1 | 32.96 | 2.5 | 36.54 | 1.56 | 26.57 | 100.13 | 3/1 | 32.88 | 0.11 | 36.89 | 2.76 | 27.29 | 99.93 |
| 1/1 | 32.54 | 0.07 | 35.25 | 6.86 | 25.88 | 100.6 | 4/1 | 32.83 | 0.03 | 36.73 | 3.16 | 27.3 | 100.05 |
| 2/1 | 32.5 | 0.16 | 35.14 | 6.8 | 25.77 | 100.37 | 5/1 | 32.81 | 0.04 | 36.71 | 2.99 | 27.33 | 99.88 |
| 3/1 | 32.59 | 0.13 | 35.78 | 5.67 | 26.22 | 100.39 | 6/1 | 33 | 0.09 | 36.67 | 3.11 | 27.31 | 100.18 |
| 6/1 | 32.32 | 0.11 | 35.25 | 6.31 | 26.34 | 100.33 | 7/1 | 39.03 | 0 | 23.7 | 7.67 | 29.29 | 99.69 |
| 7/1 | 32.14 | 0.12 | 34.71 | 6.94 | 25.7 | 99.61 |
Appendix F
| Analytical Point | S | Cu | Ni | Co | Fe | Total |
|---|---|---|---|---|---|---|
| 2/1 | 42.1 | 0.19 | 25.05 | 20.82 | 12.52 | 100.68 |
| 3/1 | 41.59 | 0.03 | 25.1 | 20.9 | 12.77 | 100.39 |
| 4/1 | 41.57 | 0.17 | 25.51 | 19.57 | 14.34 | 101.16 |
| 3/1 | 37.71 | 0.2 | 33.22 | 19.63 | 4.33 | 95.09 |
| 4/1 | 40.37 | 0.16 | 32.13 | 18.84 | 7.28 | 98.78 |
| 1/1 | 40.72 | 0.09 | 25.15 | 23.2 | 10.39 | 99.55 |
| 2/1 | 40.88 | 0.09 | 25.4 | 22.4 | 10.84 | 99.61 |
| 3/1 | 40.86 | 0.05 | 25.47 | 23.04 | 10.23 | 99.65 |
| 1/1 | 41.87 | 0.08 | 25.89 | 21.6 | 10.65 | 100.09 |
| 2/1 | 42.09 | 0.15 | 25.67 | 21.54 | 10.75 | 100.2 |
| 5/1 | 41.44 | b.d.l. | 27.05 | 23.61 | 10.84 | 102.94 |
| 6/1 | 41.54 | b.d.l. | 26.64 | 23.29 | 11.37 | 102.84 |
| 7/1 | 41.84 | 0.05 | 26.63 | 23.31 | 11.39 | 103.22 |
| 1/1 | 42.04 | 0.04 | 25.49 | 21.94 | 11.05 | 100.56 |
| 2/1 | 41.56 | 0.13 | 25.2 | 22.34 | 11.05 | 100.28 |
| 8/1 | 41.53 | 0.07 | 27.85 | 13.84 | 17.21 | 100.5 |
| 8/1 | 40.61 | 0.07 | 22.89 | 29.67 | 6.75 | 99.99 |
| 9/1 | 40.19 | 0.02 | 23.15 | 27.03 | 9.78 | 100.17 |
Appendix G
| Analytical Point | S | Zn | Cu | Ni | Co | Fe | Total | Analytical Point | S | Zn | Cu | Ni | Co | Fe | Total |
|---|---|---|---|---|---|---|---|---|---|---|---|---|---|---|---|
| 4/1 | 34.65 | 0.08 | 34.24 | 0.45 | 0.51 | 30.05 | 99.98 | 2/1 | 34.54 | 0.03 | 34.49 | 0.15 | 0.13 | 30.42 | 99.76 |
| 7/1 | 34.52 | 0.1 | 34.26 | 0.24 | 0.2 | 30.26 | 99.58 | 1/1 | 34.6 | 0.05 | 34.96 | 0.05 | 0.05 | 30.24 | 99.95 |
| 8/1 | 34.57 | b.d.l. | 34.65 | 0.08 | 0.09 | 30.25 | 99.64 | 2/1 | 34.57 | 0.16 | 34.7 | 0.04 | 0.04 | 30.43 | 99.94 |
| 9/1 | 34.8 | b.d.l. | 34.38 | 0.04 | 0.09 | 30.85 | 100.16 | 4/1 | 34.34 | 0.05 | 34.66 | 0.01 | 0.1 | 30.38 | 99.54 |
| 9/1 | 33.83 | 0.06 | 33.73 | 0.12 | 0.08 | 31.17 | 98.99 | 5/1 | 34.32 | 1.01 | 33.92 | 0.11 | 0.24 | 30.46 | 100.06 |
| 10/1 | 33.89 | 0.11 | 34.5 | 0.01 | 0.06 | 30.75 | 99.32 | 5/1 | 34.71 | 0.08 | 34.53 | 0.01 | 0.08 | 30.32 | 99.73 |
| 1/1 | 34.43 | 0.09 | 34.87 | 0.01 | 0.06 | 30.95 | 100.41 | 6/1 | 34.61 | 0.13 | 34.63 | 0.01 | 0.07 | 30.38 | 99.83 |
| 2/1 | 34.32 | 0.15 | 34.22 | 0.03 | 0.08 | 30.83 | 99.63 | 7/1 | 34.55 | b.d.l. | 34.71 | 0.01 | 0.08 | 30.52 | 99.87 |
| 10/1 | 34.38 | 0.07 | 34.75 | 0.08 | 0.07 | 30.6 | 99.95 | 5/1 | 34.31 | 0.02 | 34.6 | 0.14 | 0.19 | 30.46 | 99.72 |
| 11/1 | 34.58 | 0.02 | 35.11 | 0.1 | 0.12 | 30.31 | 100.24 | 1/1 | 34.19 | 0.13 | 35.37 | 0.05 | 0.07 | 30.46 | 100.27 |
| 2/1 | 34.28 | 0.02 | 34.37 | 0.25 | 0.17 | 30.68 | 99.77 | 2/1 | 34.22 | 0.01 | 35.12 | 0.04 | 0.15 | 30.27 | 99.81 |
| 6/1 | 34.74 | 0.03 | 34.69 | 0.04 | 0.12 | 30.05 | 99.67 | 11/1 | 34.15 | 0.01 | 35.17 | 0.16 | 0.17 | 30.09 | 99.75 |
| 7/1 | 34.54 | 0.06 | 34.05 | 0.39 | 0.55 | 30.05 | 99.64 | 3/1 | 34.27 | 0.12 | 34.64 | 0.33 | 0.14 | 30.71 | 100.21 |
| 7/1 | 34.07 | 0.05 | 34.23 | 0.02 | 0.03 | 30.65 | 99.05 | 4/1 | 34.22 | 0.02 | 34.47 | 0.14 | 0.08 | 30.96 | 99.89 |
| 8/1 | 34.15 | 0.1 | 34.37 | 0.02 | 0.05 | 30.5 | 99.19 | 1/1 | 34.2 | 0.05 | 34.61 | 0.42 | 0.16 | 30.44 | 99.88 |
| 9/1 | 34.56 | 0.01 | 34.97 | 0.04 | 0.08 | 30.36 | 100.02 | 2/1 | 34.05 | 0.1 | 34.59 | 0.56 | 0.26 | 30.07 | 99.63 |
| 1/1 | 33.87 | 0.13 | 34.38 | 0.07 | 0.06 | 31.35 | 99.86 | 4/1 | 33.995 | 0.055 | 34.321 | 0.006 | 0.047 | 30.455 | 98.879 |
| 4/1 | 34.03 | 0.03 | 34.94 | 0.19 | 0.03 | 30.47 | 99.69 | 6/1 | 34.265 | 0.031 | 34.158 | 0.047 | 0.074 | 30.76 | 99.335 |
| 5/1 | 34.13 | 0.11 | 35.22 | 0.07 | 0.07 | 30.4 | 100 | 8/1 | 34.443 | 0.114 | 34.55 | 0.01 | 0.071 | 30.491 | 99.679 |
| 4/1 | 33.97 | 0.06 | 34.83 | 0.18 | 0.07 | 30.4 | 99.51 | 9/1 | 34.692 | 0.011 | 34.194 | 0.01 | 0.117 | 30.724 | 99.748 |
| 5/1 | 34.01 | b.d.l. | 34.7 | 0.1 | 0.09 | 30.64 | 99.54 | 4/1 | 34.482 | b.d.l. | 34.051 | 0.075 | 0.063 | 29.875 | 98.546 |
| 6/1 | 34.17 | 0.13 | 34.63 | 0.08 | 0.05 | 30.22 | 99.28 | 3/1 | 34.523 | 0.125 | 34.495 | 0.049 | 0.065 | 30.407 | 99.664 |
| 1/1 | 34.34 | b.d.l. | 34.34 | 0.03 | 0.05 | 31.18 | 99.94 | 3/1 | 34.698 | 0.104 | 34.452 | 0.018 | 0.058 | 30.417 | 99.747 |
| 2/1 | 34.39 | 0.1 | 34.14 | 0.04 | 0.05 | 30.51 | 99.23 | 3/1 | 34.871 | b.d.l. | 34.3 | 0.042 | 0.02 | 30.705 | 99.938 |
| 1/1 | 34.59 | 0.15 | 34.12 | 0.17 | 0.16 | 30.35 | 99.54 | 7/1 | 34.451 | b.d.l. | 33.651 | 0.074 | 0.053 | 30.864 | 99.093 |
Appendix H
| Analytical Point | S | Zn | Cu | Ni | Co | Fe | Total |
|---|---|---|---|---|---|---|---|
| 4/1 | 35.11 | 0.13 | 23.22 | 0.14 | 0.14 | 40.79 | 99.53 |
| 5/1 | 35.19 | 0.01 | 23.63 | 0.06 | 0.06 | 40.34 | 99.29 |
| 8/1 | 34.82 | 0.01 | 23.23 | 0.08 | 0.1 | 40.97 | 99.21 |
| 9/1 | 34.95 | 0.01 | 22.24 | 0.09 | 0.1 | 41.98 | 99.37 |
| 3/1 | 35.1 | 0.01 | 23.56 | 0.01 | 0.11 | 41.03 | 99.82 |
| 6/1 | 34.72 | 0.01 | 23.31 | 0.05 | 0.05 | 40.85 | 98.99 |
| 7/1 | 34.9 | 0.06 | 23.21 | 0.01 | 0.09 | 40.96 | 99.23 |
| 8/1 | 34.89 | 0.03 | 22.81 | 0.04 | 0.05 | 40.88 | 98.7 |
| 3/1 | 35 | 0.04 | 23.4 | 0.01 | 0.04 | 40.76 | 99.25 |
| 4/1 | 35.44 | 0.06 | 23.24 | 0.01 | 0.04 | 41.12 | 99.91 |
Appendix I
| Analytical Point | S | Zn | Cu | Ni | Co | Fe | Total | Analytical Point | S | Zn | Cu | Ni | Co | Fe | Total |
|---|---|---|---|---|---|---|---|---|---|---|---|---|---|---|---|
| 13/1 | 52.87 | 0.07 | 0.03 | 1.22 | 1.95 | 43.99 | 100.29 | 1/1 | 52.201 | b.d.l. | 0.01 | 0.005 | 1.268 | 46.165 | 99.74 |
| 14/1 | 51.96 | 0.03 | 0.18 | 3.45 | 0.6 | 42.81 | 100.35 | 2/1 | 52.639 | b.d.l. | 0.031 | 0.071 | 1.902 | 45.437 | 100.105 |
| 11/1 | 53.13 | 0.01 | 0.1 | 0.06 | 0.12 | 47.12 | 100.64 | 3/1 | 52.292 | 0.074 | 0.01 | 0.01 | 1.552 | 45.972 | 99.964 |
| 12/1 | 52.8 | b.d.l. | 0.2 | 5.49 | 0.22 | 41.88 | 100.77 | 4/1 | 52.006 | 0.027 | 0.01 | 0.081 | 1.815 | 46.01 | 100.052 |
| 5/1 | 53.11 | 0.03 | 0.09 | 3.61 | 0.2 | 43.21 | 100.37 | 5/1 | 53.069 | 0.039 | 0.047 | 1.192 | 3.314 | 42.133 | 99.957 |
| 6/1 | 53.18 | b.d.l. | 0.02 | 0.48 | 0.13 | 46.83 | 100.67 | 6/1 | 53.099 | 0.028 | 0.01 | 1.23 | 0.113 | 45.376 | 99.897 |
| 1/1 | 52.33 | b.d.l. | 0.01 | 4.98 | 0.37 | 41.68 | 99.45 | 1/1 | 53.001 | 0.01 | 0.074 | 0.022 | 1.054 | 45.853 | 100.05 |
| 2/1 | 52.79 | 0.06 | 0.01 | 1.96 | 0.22 | 44.88 | 100 | 2/1 | 53.492 | 0.124 | 0.033 | 0.28 | 0.128 | 45.97 | 100.085 |
| 8/1 | 52.27 | 0.03 | 0.01 | 1.5 | 0.25 | 44.74 | 99.28 | 4/1 | 53.323 | b.d.l. | 0.056 | 0.062 | 7.063 | 39.434 | 100.05 |
| 12/1 | 53.09 | b.d.l. | 0.08 | 0.01 | 4.59 | 42.04 | 100 | 5/1 | 52.962 | 0.046 | 0.016 | 0.049 | 4.594 | 42.067 | 99.93 |
| 6/1 | 53.56 | 0.05 | 0.18 | 0.09 | 0.13 | 46.07 | 100.15 | 6/1 | 52.846 | 0.003 | 0.03 | 0.009 | 8.608 | 38.347 | 99.911 |
| 7/1 | 53.46 | b.d.l. | 0.21 | 0.1 | 0.11 | 46.04 | 99.96 | 7/1 | 52.794 | 0.045 | 0.042 | 0.04 | 7.059 | 39.602 | 99.724 |
| 7/1 | 53.73 | 0.03 | 0.13 | 0.3 | 0.09 | 45.84 | 100.24 | 3/1 | 53.136 | 0.036 | 0.052 | 1.215 | 0.089 | 45.618 | 100.283 |
| 8/1 | 53.57 | 0.02 | 0.08 | 0.22 | 0.08 | 45.81 | 99.87 | 10/1 | 53.418 | 0.127 | 0.003 | 0.024 | 0.288 | 46.37 | 100.321 |
| 9/1 | 53.17 | 0.07 | 0.2 | 0.86 | 0.07 | 45.62 | 100.17 | 1/1 | 53.977 | 0.01 | 0.017 | 0.112 | 0.123 | 45.972 | 100.394 |
| 8/1 | 53 | 0.06 | 0.06 | 8.72 | 0.14 | 38.02 | 100.1 | 2/1 | 53.927 | 0.084 | 0.001 | 0.301 | 0.064 | 45.56 | 100.073 |
| 9/1 | 53.21 | 0.03 | 0.01 | 0.78 | 3.26 | 43.53 | 100.91 | 3/1 | 53.453 | 0.073 | 0.01 | 0.046 | 0.127 | 45.435 | 99.575 |
| 5/1 | 52.678 | b.d.l. | 0.066 | 0.02 | 1.122 | 45.388 | 99.345 | 4/1 | 52.871 | 0.042 | 0.087 | 0.062 | 0.13 | 45.448 | 99.253 |
| 3/1 | 52.451 | 0.038 | 0.062 | 0.082 | 6.373 | 40.552 | 99.67 |
References
- Moss, R.L.; Tzimas, E.; Kara, H.; Willis, P.; Kooroshy, J. Critical metals in strategic energy technologies. Assessing rare metals as Supply-chain bottlenecks in low-carbon energy technologies. In European Commission Joint Research Centre Institute for Energy and Transport; Publication Office of the European Union: Luxembourg, 2011; pp. 1–159. [Google Scholar]
- Jowitt, S.M.; Mudd, G.M.; Werner, T.T.; Weng, Z.; Barkoff, D.W.; McCaffrey, D. The critical metals: An overview and opportunities and concerns for the future. SEG Spec. Publ. 2018, 21, 25–38. [Google Scholar]
- Communication from the Commission to the European Parliament; The Council; The European Economic and Social Committee and the Committee of the Regions. Critical Raw Materials Resilience: Charting a Path towards Greater Security and Sustainability; COM(2020)474 Final; European Commission: Brussels, Belgium, 2020; pp. 1–8. [Google Scholar]
- Alves Dias, P.; Blagodeva, D.; Pavel, C.; Arvanititdis, N. Cobalt: Demand-supply balances in the transition to electric mobility. EUR 29381 EN. In Science for Policy Report 2018; Joint Research Centre: Luxembourg, 2018. [Google Scholar]
- Mudd, G.M.; Weng, Z.; Jowitt, S.M.; Turnbull, I.D.; Graedel, T.E. Quantifying the recoverable resources of by-product metals: The case of cobalt. Ore Geol. Rev. 2013, 55, 87–98. [Google Scholar] [CrossRef]
- US Geological Survey. Mineral Commodity Summaries 2021. Cobalt, 50–51. Vanadium, 180–181; USGS: Reston VA, USA, 2021.
- Bolewski, A. (Ed.) Mineral Resources of the World, Nickel—Ni, Cobalt—Co; Wyd. Geol.: Warszawa, Poland, 1984; pp. 211–248. (In Polish) [Google Scholar]
- Bolewski, A. (Ed.) Mineral Resources of the World, Vanadium—V, Titanium—Ti, Zirconium—Zr, Hafnium—Hf; Wyd. Geol.: Warszawa, Poland, 1982; pp. 11–74. (In Polish) [Google Scholar]
- Petecki, Z.; Wiszniewska, J. Internal structure of the buried Suwałki Anorthosite Massif (East European Craton, NE Poland) based on borehole, magnetic and gravity data combined with new petrological results. Geol. Q. 2021, 65, 1–17. [Google Scholar] [CrossRef]
- Juskowiak, O. Occurrence, structure and mineral diversity of rocks from the Suwałki Anorthosite Massif. Pr. Państw. Inst. Geol. 1998, 161, 53–80. [Google Scholar]
- Ryka, W.; Subieta, M.; Kubicki, S.; Kurbiel, H. The Geological Map of the Suwałki Intrusion. 1:100,000; Wyd. Geol.: Warszawa, Poland, 1982. [Google Scholar]
- Ryka, W. Geological position of the Suwałki Anorthosite Massif. Prace Państ. Inst. Geol. 1998, 161, 19–26. [Google Scholar]
- Krzemińska, E.; Krzemiński, L.; Petecki, Z.; Wiszniewska, J.; Salwa, S.; Żaba, J.; Gaidzik, K.; Williams, I.S.; Rosowiecka, O.; Taran, L.; et al. Geological Map of Crystalline Basement in the Polish Part of the East European Platform 1:1,000,000; Państwowy Instytut Geologiczny: Warszawa, Poland, 2017.
- Skridlaite, G.; Wiszniewska, J.; Duchesne, J.C. Ferro-potassic A-type granites and related rocks in NE Poland and S Lithuania: West of the East European Craton. Precambrian Res. 2003, 124, 305–326. [Google Scholar] [CrossRef]
- Wiszniewska, J.; Krzemińska, E. Advances in geochronology in the Suwałki Anorthosite Massif and subsequent granite veins, northeastern Poland. Precambrian Res. 2021, 361, 106–265. [Google Scholar] [CrossRef]
- Wiszniewska, J.; Claesson, S.; Stein, H.; Vander Auwera, J.; Duchesne, J.C. The north-eastern Polish anorthosite massifs: Petrological, geochemical and isotopic evidence for a crustal derivation. Terra Nova 2002, 14, 451–461. [Google Scholar] [CrossRef]
- Krzemiński, L.; Tyda, R.; Wiszniewska, J. Mineralogic and geochemical study of ore-bearing apatite rocks (nelsonites) from the Suwałki Massif (NE Poland). Miner. Pol. 1988, 19, 35–54. (In Polish) [Google Scholar]
- Wiszniewska, J. Suwałki nelsonites: New mineralogical and geochemical data. Przegl. Geol. 1997, 45, 883–892. [Google Scholar]
- Kozłowski, A.; Wiszniewska, J. The nelsonite problem: The origin by melt immiscibility. NGU Spec. Publ. 2003, 9, 35–37. [Google Scholar]
- Duchesne, J.C.; Liégeois, J.P. The origin of nelsonite and high-Zr ferrodiorite associated with Proterozoic anorthosite. Ore Geol. Rev. 2015, 71, 40–56. [Google Scholar] [CrossRef]
- Cieśla, E.; Wybraniec, S. Geophysical studies of the Suwałki Anorthosite Massif. Pr. Państ. Inst. Geol. 1998, 161, 39–46. [Google Scholar]
- Graniczny, M. Tectonics of the Suwałki Anorthosite Massif in the light of the analysis of satellite images and geophysical data. Pr. Państw. Inst. Geol. 1998, 161, 47–52. [Google Scholar]
- Kubicki, S.; Siemiątkowski, J. Ore mineralization of the Suwałki Basic Massif. Biul. Inst. Geol. 1979, 316, 5–136. [Google Scholar]
- Speczik, S.; Wiszniewska, J.; Diedel, R. Minerals, exsolution features and geochemistry of Fe-Ti ores of the Suwałki district (northeast Poland). Miner. Depos. 1988, 23, 200–210. [Google Scholar] [CrossRef]
- Kozłowska, A.; Wiszniewska, J. Genetic aspects of ore minerals texture and structure in the Suwałki Massif. Arch. Miner. 1991, 44, 69–88. (In Polish) [Google Scholar]
- Wiszniewska, J. Mineralogy of the Fe-Ti-V ores of the Suwałki anorthosite massif. In Geology of the Suwałki Anorthosite Massif (Northeastern Poland); Ryka, W., Podemski, M., Eds.; Prace Państwowy Instytut Geologiczny: Warsaw, Poland, 1998; Volume 161, pp. 137–150. [Google Scholar]
- Marcinkowski, B. The regularity of occurrence of ore mineralization in selected complexes of the crystalline basement of north-eastern Poland. Biul. Państw. Inst. Geol. 2006, 421, 53–90. (In Polish) [Google Scholar]
- Parecki, A. Geological structure of Krzemianka and Udryn deposits. Prace Państ. Inst. Geol. 1998, 161, 123–136. [Google Scholar]
- Wiszniewska, J. An age and genesis of Fe-Ti-V ores and associated rocks in the Suwałki Anorthosite Massif (NE Poland). Biul. Państw. Inst. Geol. 2002, 401, 1–96. (In Polish) [Google Scholar]
- Malon, A.; Tymiński, M.; Mikulski, S.Z.; Oszczepalski, S. Metallic Raw Materials. In The Balance of Mineral Resources Deposits in Poland as of 31.12.2018; Szuflicki, M., Malon, A., Tymiński, M., Eds.; Państwowy Instytut Geologiczny-Państwowy Instytut Badawczy: Warszawa, Poland, 2018; pp. 49–63. (In Polish) [Google Scholar]
- Nieć, M. Geo-economic evaluation of vanadiferous titanomagnetite deposits in Suwałki massif in Poland. Gospod. Surowcami Miner. 2003, 19, 5–27. (In Polish) [Google Scholar]
- Ryka, W.; Szczepanowski, H. Trace elements of the Suwałki Anorthosite Massif. Pr. Państ. Inst. Geol. 1998, 161, 105–110. [Google Scholar]
- Mikulski, S.Z.; Oszczepalski, S.; Sadłowska, K.; Chmielewski, A.; Małek, R. The occurrence of associated and critical elements in selected documented Zn-Pb, Cu-Ag, Fe-Ti-V, Mo-Cu-W, Sn, Au-As and Ni deposits in Poland. Biul. Państw. Inst. Geol. 2018, 472, 21–52. [Google Scholar] [CrossRef]
- Wiszniewska, J.; Krzemińska, E.; Rosowiecka, O.; Petecki, Z.; Ruszkowski, M.; Salwa, S. New results of polymetallic, PGE and REE mineralizations research in the Suwałki Anorthosite massif (NE Poland). Biul. Państw. Inst. Geol. 2018, 472, 271–284. (In Polish) [Google Scholar] [CrossRef]
- Sadłowska, K.; Mikulski, S.Z. Electron microprobe study of V, Co, Ni and Au substitutions in ore minerals from Fe-Ti-V deposits (NE Poland). Przegląd Geol. 2019, 67, 192–195. (In Polish) [Google Scholar] [CrossRef]
- Mikulski, S.Z.; Sadłowska, K. Critical The critical elements (V, Co, Ga, Sc, REE) enrichment of Fe-Ti-V oxide deposits related to Mesoproterozoic AMCG complex in Poland. In Proceedings of the 15th SGA Biennial Meeting, Glasgow, UK, 27–30 August 2019; Volume 4, pp. 1814–1817. [Google Scholar]
- Morgan, J.W.; Stein, H.J.; Hannah, J.L.; Markey, R.J.; Wiszniewska, J. Re-Os study of Fe-Ti-V Oxide and Fe-Cu-Ni sulphide deposits, Suwałki Anorthosite Massif. Northeast Poland. Miner. Depos. 2000, 35, 391–401. [Google Scholar] [CrossRef]
- Stein, H.J.; Morgan, J.W.; Markey, R.J.; Wiszniewska, J. A Re-Os study of the Suwałki anorthosite massif, northeast Poland. Geophys. J. 1998, 4, 111–114. [Google Scholar]
- Kubicki, S.; Osika, R. Magmatic ores. In Geology of Poland. Mineral Deposits; Osika, R., Ed.; Wyd. Geol.: Warszawa, Poland, 1990; Volume 6, pp. 131–137. [Google Scholar]
- Namur, O.; Hatert, F.; Grandjean, F.; Long, G.J.; Krins, N.; Vander Auwera, J.; Charlier, B. Ti substitution mechanisms in phlogopites from the Suwalki massif-type anorthosite, NE Poland. Eur. J. Miner. 2009, 21, 397–406. [Google Scholar] [CrossRef]
- Kucha, H.; Piestrzyński, A.; Salamon, W. Geochemical and mineralogical study of sulphide minerals occurring in magnetite rocks of NE Poland. Miner. Pol. 1977, 2, 23–36. [Google Scholar]
- Esmailiy, D.; Zakizadeh, S.; Sepidbar, F.; Kanaanian, A.; Niroomand, S. The Shaytor Apatite-Magnetite Deposit in the Kashmar-Kerman Tectonic Zone (Central Iran): A Kirun-Type iron deposit. Open J. Geol. 2016, 6, 895–910. [Google Scholar] [CrossRef]
- McDonough, W.F.; Sun, S.S. The composition of the Earth. Chem. Geol. 1995, 120, 223–253. [Google Scholar] [CrossRef]
- Scoates, J.S. The plagioclase-magma density paradox re-examined and crystallization of Proterozoic anorthosites. J. Petrol. 2000, 41, 627–649. [Google Scholar] [CrossRef]
- Charlier, B.; Duchesne, J.C.; Vander Auwera, J. Magma chamber processes in the Tellnes ilmenite deposit (Rogaland anorthosite province; SW Norway) and the formation of Fe-Ti ores in massif-type anorthosites. Chem. Geol. 2006, 234, 264–290. [Google Scholar] [CrossRef]
- Charlier, B.; Namur, O.; Duchesne, J.C.; Wiszniewska, J.; Parecki, A.; Vander Auwera, J. Cumulate origin and polybaric crystallization of Fe-Ti oxide ores in the Suwałki anorthosite, northeastern Poland. Econ. Geol. 2009, 104, 205–221. [Google Scholar] [CrossRef]
- Charlier, B.; Namur, O.; Malpas, S.; De Marneffe, C.; Duchesne, J.C.; Vander Auwera, J.; Bolle, O. Origin of the giant Allard Lake ilmenite ore deposit (Canada) by fractional crystallization, multiple magma pulses and mixing. Lithos 2010, 117, 119–134. [Google Scholar] [CrossRef]
- Philpotts, A.R. Origin of certain iron-titanium oxide and apatite rocks. Econ. Geol. 1967, 62, 303–315. [Google Scholar] [CrossRef]
- Kohlstedt, D.L.; Zimmerman, M.E.; Mackwell, S.J. Stress-driven melt segregation in partially molten feldspathic rocks. J. Petrol. 2010, 117, 119–134. [Google Scholar] [CrossRef]
- Paludan, J.; Hansen, U.B.; Olesen, N.Ø. Structural evolution of the Precambrian Bjerkreim–Sokndal intrusion, South Norway. Nor. Geol. Tidsskr. 1994, 74, 185–198. [Google Scholar]
- Wilson, J.R.; Robins, B.; Nielsen, F.; Duchesne, J.C.; Vander Auwera, J. The Bjerkreim-Sokndal layered intrusion, Southwest Norway. In Layered Intrusions; Cawthorn, R.G., Ed.; Elsevier: Amsterdam, The Netherlands, 1996; pp. 231–256. [Google Scholar]
- Li, L.; Li, H.; Chen, Z.; Wang, D.; Chen, W. Hydrothermal mineralization and fluid inclusion study on the Heishan iron deposit, Chengde County, Hebei Province, China. Acta Petrol. Sin. 2010, 26, 858–870. [Google Scholar]
- Duchesne, J.C.; Liégeois, J.P.; Vander Auwera, J.; Longhi, J. The crustal tongue melting model and the origin of massive anorthosites. Terra Nova 1999, 11, 100–105. [Google Scholar] [CrossRef]
- Duchesne, J.C. Iron-titanium oxide minerals in the Bjerkrem-Sogndal Massif, South-western Norway. J. Petrol. 1972, 13, 57–81. [Google Scholar] [CrossRef] [Green Version]
- Duchesne, J.C. Liquid ilmenite or liquidus ilmenite: A comment on the nature of ilmenite vein deposits. In Petrology and Geochemistry of Magmatic Suites of Rocks in the Continental and Oceanic Crusts; Michot, J., Demaiffe, D., Eds.; Université Libre de Bruxelles: Brussels, Belgium; Royal Museum for Central Africa (Tervuren): Tervuren, Belgium, 1996; pp. 73–82. [Google Scholar]
- Sauerzapf, U.; Lattard, D.; Burchard, M.; Engelmann, R. The titanomagnetite-ilmenite equilibrium: New experimental data and thermo-oxybarometric application to the crystallization of basic to intermediate rocks. J. Petrol. 2008, 49, 1161–1185. [Google Scholar] [CrossRef] [Green Version]
- Ryka, W. Views of the origin of the Suwałki Anorthosite Massif. Pr. Państ. Inst. Geol. 1998, 161, 161–169. [Google Scholar]
- Barbalance, K. Periodic Table of Elements. Available online: https://environmentalchemistry.com/yogi/periodic (accessed on 19 November 2021).
- Mikulski, S.Z. Cobalt potential from the metallic deposits in Poland. In Proceedings of the 16th SGA Biennial Meeting, Rotorua, New Zealand, 28–31 March 2022; Volume 1, pp. 247–251. [Google Scholar]
- Force, E.R. Descriptive model of anorthosite Ti. In Mineral Deposit Models; USGS Bull 1693; Cox, D., Singer, J., Eds.; US Government Printing Office: Washington, DC, USA, 1986; pp. 32–33. [Google Scholar]
- Reynolds, I.M. Vanadium-bearing titaniferous iron ores of the Rooiwater complex in the North-Eastern Transval. In Mineral Deposits of Southern Africa; Anhaeusser, C.R., Maske, S., Eds.; Geological Society of South Africa: Johannesburg, South Africa, 1986; Volume 1, pp. 451–460. [Google Scholar]
- Hébert, C.; Cadieux, A.M.; van Breemen, O. Temporal evolution and nature of Ti-Fe-P mineralization in the anorthosite-mangerite-charnockite-granite (AMCG) suites of the south-central Grenville Province, Saguenay-Lac St. Jean area, Quebec, Canada. Can. J. Earth Sci. 2005, 42, 1865–1880. [Google Scholar] [CrossRef]
- Maier, W.D.; Rasmussen, B.; Fletcher, I.R.; Li, C.; Barnes, S.J.; Huhma, H. The Kunene anorthosite complex, Namibia, and its satellite intrusions: Geochemistry, geochronology, and economic potential. Econ. Geol. 2013, 108, 953–986. [Google Scholar] [CrossRef]
- Charlier, B.; Namur, O.; Bolle, O.; Latypov, R.; Duchesne, J.C. Fe-Ti-V-P ore deposits associated with Proterozoic massif-type anorthosites and related rocks. Earth Sci. Rev. 2015, 141, 56–81. [Google Scholar] [CrossRef]
- Villanova-de-Benavent, C.; Torro, L.; Castillo-Oliver, M.; Campeny, M.; Melgarejo, J.C.; Llovet, X.; Gali, S.; Goncalves, A.O. Fe-Ti(-V) oxide deposits of the Kunene Anorthosite Complex (SW Angola): Mineralogy and Thermo-Oxybarometry. Minerals 2017, 7, 246. [Google Scholar] [CrossRef] [Green Version]
- Corriveau, L.; Perreault, S.; Davidson, A. Prospective metallogenic settings of the Grenville Province. In Mineral Deposits of Canada: A Synthesis of Major Deposit-Types, District Metallogeny, the Evolution of Geological Provinces, and Exploration Methods; Goodfellow, W.D., Ed.; Mineral Deposits Division, Geological Survey of Canada: Ottawa, ON, Canada, 2007; pp. 819–847. [Google Scholar]


| WDS-XRF [ppm] | ||||||||||||
| As | Ba | Bi | Br | Cd | Ce | Co | Cr | Cu | Ga | Hf | La | Mo |
| 3 | 10 | 3 | 1 | 3 | 5 | 3 | 5 | 5 | 3 | 3 | 5 | 2 |
| Nb | Ni | Pb | Rb | Sn | Sr | Th | U | V | Y | Zn | Zr | |
| 2 | 3 | 3 | 3 | 2 | 2 | 3 | 2 | 5 | 3 | 2 | 3 | |
| ICP-MS [ppm] | GF AAS [ppm] | |||||||||||
| Sc | Y | La | Ce | Pr | Nd | Eu | Sm | Au | Pd | Pt | ||
| 0.5 | 0.5 | 0.5 | 0.5 | 0.5 | 0.5 | 0.05 | 0.05 | 0.001 | 0.005 | 0.01 | ||
| Gd | Tb | Dy | Ho | Er | Tm | Yb | Lu | |||||
| 0.05 | 0.05 | 0.05 | 0.05 | 0.05 | 0.05 | 0.05 | 0.05 | |||||
| ICP-MS [ppm] | ||||||||||||
| Ag | Cd | In | Mn | Re | Sb | Se | Sn | Ta | V | Te | Tl | W |
| 0.1 | 0.5 | 0.05 | 1 | 0.05 | 0.5 | 2 | 1 | 0.05 | 5 | 0.5 | 0.05 | 0.1 |
| As | Bi | Co | Cu | Hf | Ni | Nb | Mo | Th | ||||
| 2 | 0.05 | 0.5 | 0.5 | 0.05 | 0.5 | 0.5 | 0.5 | 0.05 | ||||
| WDS-XRF [%] | ||||||||||||
| SiO2 | TiO2 | Al2O3 | Fe2O3 | MnO | MgO | CaO | Na2O | K2O | P2O5 | SO3 | Cl | F |
| 0.1 | 0.01 | 0.05 | 0.01 | 0.001 | 0.01 | 0.01 | 0.01 | 0.01 | 0.001 | 0.01 | 0.001 | 0.01 |
| Mineral | Value | Fe | Al | Mn | V | Cr | Mg | Ti | Zn | O |
|---|---|---|---|---|---|---|---|---|---|---|
| wt% | wt% | wt% | wt% | wt% | wt% | wt% | wt% | wt% | ||
| magnetite | arithmetic mean | 70.34 | 0.38 | 0.03 | 0.42 | 0.26 | 0.08 | 0.59 | 0.03 | 21.29 |
| Fe2+Fe3+2O4 | standard deviation | 1.25 | 0.33 | 0.03 | 0.14 | 0.25 | 0.09 | 0.68 | 0.02 | 0.43 |
| geometric mean | 70.33 | 0.30 | 0.02 | 0.37 | 0.14 | 0.06 | 0.29 | 0.02 | 21.29 | |
| median | 70.59 | 0.29 | 0.02 | 0.48 | 0.14 | 0.06 | 0.26 | 0.02 | 21.26 | |
| minimum content | 66.20 | 0.01 | b.d.l. | 0.01 | b.d.l. | 0.01 | 0.02 | b.d.l. | 20.46 | |
| maximum content | 72.20 | 2.06 | 0.13 | 0.59 | 1.26 | 0.53 | 2.65 | 0.08 | 22.54 | |
| number of analyses a.d.l. | 81 | 81 | 69 | 81 | 80 | 80 | 81 | 45 | 81 | |
| ilmenite | arithmetic mean | 35.44 | 0.25 | 0.81 | 0.14 | 0.04 | 0.87 | 30.59 | 0.04 | 31.72 |
| FeTiO3 | standard deviation | 1.47 | 0.77 | 0.14 | 0.04 | 0.08 | 0.37 | 1.22 | 0.03 | 0.45 |
| geometric mean | 35.41 | 0.04 | 0.80 | 0.13 | 0.03 | 0.79 | 30.56 | 0.02 | 31.72 | |
| median | 35.19 | 0.03 | 0.80 | 0.14 | 0.03 | 0.80 | 31.10 | 0.03 | 31.78 | |
| minimum content | 33.15 | b.d.l. | 0.59 | 0.05 | b.d.l. | 0.16 | 26.68 | b.d.l. | 30.17 | |
| maximum content | 39.91 | 4.39 | 1.18 | 0.24 | 0.59 | 1.66 | 31.89 | 0.12 | 32.89 | |
| number of analyses a.d.l. | 59 | 57 | 59 | 59 | 47 | 59 | 59 | 31 | 59 | |
| Al-spinels | arithmetic mean | 19.24 | 32.08 | 0.13 | 0.04 | 0.36 | 7.05 | 0.17 | 1.26 | 39.35 |
| *M2+M3+2O4 | standard deviation | 2.99 | 1.06 | 0.03 | 0.02 | 0.37 | 1.43 | 0.17 | 0.64 | 0.90 |
| geometric mean | 19.01 | 32.07 | 0.13 | 0.04 | 0.25 | 6.91 | 0.09 | 1.09 | 39.34 | |
| median | 18.35 | 32.13 | 0.13 | 0.05 | 0.17 | 7.37 | 0.09 | 1.03 | 39.35 | |
| minimum content | 14.82 | 29.76 | 0.08 | b.d.l. | 0.09 | 4.85 | 0.01 | 0.36 | 37.70 | |
| maximum content | 24.02 | 34.10 | 0.20 | 0.07 | 1.45 | 9.44 | 0.61 | 2.25 | 41.08 | |
| number of analyses a.d.l. | 30 | 30 | 30 | 30 | 30 | 30 | 30 | 30 | 30 |
| Mineral | Value | Fe | S | Ni | Co | Cu | Zn |
| wt% | wt% | wt% | wt% | wt% | wt% | ||
| pyrrhotite | arithmetic mean | 59.53 | 39.06 | 0.61 | 0.16 | 0.04 | 0.03 |
| (FeS) | standard deviation | 0.56 | 0.34 | 0.54 | 0.05 | 0.03 | 0.04 |
| geometric mean | 59.53 | 39.06 | 0.48 | 0.15 | 0.51 (n = 46) | 0.38 (n = 42) | |
| median | 59.56 | 39.03 | 0.55 | 0.15 | 0.04 | 0.03 | |
| (n = 61) | minimum content | 56.13 | 38.34 | 0.19 | 0.05 | b.d.l. | b.d.l. |
| maximum content | 60.53 | 39.75 | 4.00 | 0.28 | 0.14 | 0.16 | |
| pyrite | arithmetic mean | 44.13 | 53.00 | 1.05 | 1.60 | 0.06 | 0.04 |
| FeS2 | standard deviation | 2.49 | 0.50 | 1.90 | 2.36 | 0.06 | 0.03 |
| geometric mean | 44.06 | 52.99 | 0.20 | 0.49 | 0.03 | 0.03 | |
| median | 45.44 | 53.07 | 0.11 | 0.25 | 0.04 | 0.03 | |
| (n = 37) | minimum content | 38.02 | 51.96 | 0.01 | 0.06 | b.d.l. | b.d.l. |
| maximum content | 47.12 | 53.98 | 8.72 | 8.61 | 0.21 | 0.13 | |
| Mineral | Value | Cu | Fe | S | Ni | Co | Zn |
| wt% | wt% | wt% | wt% | wt% | wt% | ||
| chalcopyrite | arithmetic mean | 34.52 | 30.50 | 34.36 | 0.11 | 0.11 | 0.08 |
| CuFeS2 | standard deviation | 0.37 | 0.31 | 0.26 | 0.13 | 0.10 | 0.14 |
| geometric mean | 34.52 | 30.50 | 34.36 | 0.06 | 0.09 | 0.06 (n = 42) | |
| median | 34.52 | 30.46 | 34.36 | 0.06 | 0.08 | 0.06 | |
| (n = 50) | minimum content | 33.65 | 29.88 | 33.83 | 0.01 | 0.02 | b.d.l. |
| maximum content | 35.37 | 31.35 | 34.87 | 0.56 | 0.55 | 1.01 | |
| cubanite | arithmetic mean | 23.19 | 40.97 | 35.01 | 0.05 | 0.08 | 0.04 |
| CuFe2S3 | standard deviation | 0.40 | 0.41 | 0.21 | 0.04 | 0.035 | 0.04 |
| geometric mean | 23.18 | 40.97 | 35.01 | 0.03 | 0.07 | 0.02 | |
| median | 23.24 | 40.92 | 34.98 | 0.05 | 0.08 | 0.02 | |
| (n = 10) | minimum content | 22.24 | 40.34 | 34.72 | 0.01 | 0.04 | 0.01 |
| maximum content | 23.63 | 41.98 | 35.44 | 0.14 | 0.14 | 0.13 | |
| talnakhite | arithmetic mean | 27.09 | 29.05 | 35.00 | 4.20 | 3.94 | 0.30 |
| Cu9(Fe,Ni)8S3 | standard deviation | 0.47 | 0.80 | 0.71 | 0.93 | 1.20 | 0.16 |
| geometric mean | 27.09 | 29.04 | 35.00 | 4.15 | 3.84 | 0.27 | |
| median | 27.09 | 29.05 | 35.00 | 4.20 | 3.94 | 0.30 | |
| (n = 3) | minimum content | 26.76 | 28.48 | 34.50 | 3.54 | 3.09 | 0.18 |
| maximum content | 27.42 | 29.61 | 35.50 | 4.86 | 4.78 | 0.41 |
| Mineral | Value | Ni | Fe | Co | Cu | Zn | S |
|---|---|---|---|---|---|---|---|
| wt% | wt% | wt% | wt% | wt% | wt% | ||
| pentlandite | arithmetic mean | 34.89 | 27.21 | 4.41 | 0.35 | 0.05 | 33.30 |
| (Fe,Ni)9S8 | standard deviation | 3.58 | 2.15 | 3.09 | 0.85 | 0.04 | 1.59 |
| geometric mean | 34.69 | 27.13 | 3.63 | 0.12 (n = 42) | 0.04 | 33.27 | |
| median | 36.33 | 27.10 | 3.19 | 0.11 | 0.05 | 32.96 | |
| (n = 45) | minimum content | 23.70 | 22.26 | 1.12 | b.d.l. | b.d.l. | 32.14 |
| maximum content | 39.23 | 37.35 | 15.30 | 4.38 | 0.15 | 41.19 | |
| siegenite | arithmetic mean | 26.31 | 10.75 | 22.03 | 0.09 | 0.04 (n = 16) | 41.14 |
| (Ni,Co)3S4 | standard deviation | 2.61 | 2.80 | 3.29 | 0.06 | 0.03 | 1.04 |
| geometric mean | 26.19 | 10.35 | 21.79 | 0.07 | 0.03 | 41.13 | |
| median | 25.50 | 10.84 | 22.14 | 0.08 | 0.04 | 41.54 | |
| (n = 18) | minimum content | 22.89 | 4.33 | 13.84 | b.d.l. | b.d.l. | 37.71 |
| maximum content | 33.22 | 17.21 | 29.67 | 0.20 | 0.12 | 42.10 | |
| bravoite | arithmetic mean | 28.10 | 28.26 | 2.66 | 0.45 | - | 39.38 |
| (Fe,Ni,Co)S2 | standard deviation | 2.19 | 2.24 | 1.14 | 0.74 | - | 0.48 |
| geometric mean | 28.04 | 28.20 | 2.45 | - | - | 39.38 | |
| median | 27.94 | 28.29 | 3.22 | 0.05 | - | 39.12 | |
| (n = 7) | minimum content | 25.99 | 26.01 | 1.35 | b.d.l. | b.d.l. | 39.09 |
| maximum content | 30.36 | 30.48 | 3.40 | 1.31 | 0.04 | 39.94 |
| Mineral | Element | S | Cu | Ni | Co | Fe | Mineral |
|---|---|---|---|---|---|---|---|
| pentlandite | S | 1.00 | 0.08 | −0.34 | 0.08 | −0.01 | pyrrhotite |
| Cu | −0.03 | 1.00 | −0.12 | −0.04 | 0.13 | ||
| Ni | −0.62 | −0.13 | 1.00 | −0.31 | −0.76 | ||
| Co | −0.02 | −0.09 | −0.54 | 1.00 | 0.10 | ||
| Fe | 0.30 | −0.02 | −0.29 | −0.50 | 1.00 | ||
| chalcopyrite | S | 1.00 | 0.11 | −0.22 | −0.19 | 0.22 | pyrite |
| Cu | −0.08 | 1.00 | 0.18 | −0.20 | 0.01 | ||
| Ni | −0.14 | −0.08 | 1.00 | −0.27 | −0.46 | ||
| Co | 0.14 | −0.18 | 0.73 | 1.00 | −0.71 | ||
| Fe | −0.31 | −0.28 | −0.31 | −0.41 | 1.00 | ||
| cubanite | S | 1.00 | −0.39 | −0.78 | 0.16 | 0.73 | siegenite |
| Cu | 0.26 | 1.00 | 0.38 | −0.36 | −0.31 | ||
| Ni | −0.15 | −0.33 | 1.00 | −0.42 | −0.62 | ||
| Co | −0.08 | −0.13 | 0.62 | 1.00 | −0.34 | ||
| Fe | −0.09 | −0.83 | 0.12 | 0.25 | 1.00 |
| Sample | K24/01 | K50/05 | K56/06 | U11/05 | K63/06 | U10/04 | K24/03 | U7/03 | K56/05 |
|---|---|---|---|---|---|---|---|---|---|
| Anorthosite | Norite | Jotunite | Ferrolite | ||||||
| SiO2 (%) | 45.39 | 28.37 | 31.32 | 26.72 | 8.27 | 7.27 | 13.53 | 16.34 | 24.16 |
| TiO2 | 1.573 | 6.037 | 5.153 | 6.269 | 7.221 | 10.78 | 9.562 | 9.372 | 6.838 |
| Al2O3 | 27.28 | 13.88 | 12.2 | 7.53 | 5.74 | 7.87 | 8.94 | 8.95 | 11.3 |
| Fe2O3 | 6.4 | 39.34 | 37.1 | 36.64 | 76.23 | 69.78 | 62.47 | 56.38 | 47.38 |
| MnO | 0.061 | 0.217 | 0.296 | 0.52 | 0.394 | 0.269 | 0.276 | 0.271 | 0.278 |
| MgO | 1.25 | 4.43 | 5.1 | 8.03 | 1.25 | 2.33 | 2.48 | 4.07 | 3.79 |
| CaO | 11.98 | 5.02 | 5.11 | 9.77 | 1.29 | 1.57 | 2.55 | 2.77 | 4.47 |
| Na2O | 4.58 | 2.28 | 1.84 | 1.47 | 0.62 | 0.69 | 0.97 | 0.89 | 1.51 |
| K2O | 0.72 | 0.4 | 0.56 | 0.27 | 0.97 | 0.19 | 0.19 | 0.22 | 0.55 |
| P2O5 | 0.332 | 0.054 | 0.177 | 2.388 | 0.027 | 0.028 | 0.009 | 0.022 | 0.364 |
| SO3 | 0.06 | 0.44 | 0.03 | 1.49 | 0.2 | <0.01 | <0.01 | 0.03 | <0.01 |
| Cl | 0.082 | 0.144 | 0.085 | 0.089 | 0.127 | 0.129 | 0.091 | 0.115 | 0.087 |
| LOI | 0.3 | 0.5 | 1 | 0.9 | 2 | 1.3 | 1.1 | 0.2 | 0.9 |
| SUM | 99.71 | 99.17 | 99.21 | 99.29 | 98.91 | 98.14 | 99.02 | 98.08 | 99.17 |
| Ag ppm | 0.6 | 0.5 | 0.9 | 0.7 | 0.3 | 0.6 | 0.6 | <0.3 | 1.2 |
| Au ppb | <1 | 6 | 7 | 2 | 1 | 5 | 4 | 1 | 7 |
| Ba | 272 | 171 | 259 | 106 | <10 | <10 | <10 | <10 | 706 |
| Cd | 3 | 14 | 9 | 15 | 17 | 17 | 11 | 14 | 8 |
| Ce | 26.8 | 12.6 | 38.1 | 285,0 | 6.5 | 6.3 | 2.9 | 4.8 | 35.4 |
| Co | 15 | 138 | 205 | 65 | 128 | 144 | 135 | 143 | 161 |
| Cr | 2.5 | 362 | 34 | <5 | 133 | 2159 | 218 | 3777 | 217 |
| Cu | 38 | 325 | 604 | 117 | 247 | 94 | 231 | 61 | 658 |
| Dy | 1.89 | 0.64 | 2.79 | 23.56 | 0.3 | 0.38 | 0.15 | 0.29 | 2.19 |
| Er | 0.86 | 0.37 | 1.46 | 11.44 | 0.17 | 0.25 | 0.11 | 0.19 | 1.11 |
| Eu | 2.9 | 0.91 | 3.81 | 36.85 | 0.59 | 0.52 | 0.19 | 0.31 | 3.32 |
| Ga | 23 | 38 | 31 | 23 | 48 | 70 | 50 | 54 | 43 |
| Gd | 2.63 | 0.76 | 3.4 | 32.5 | 0.47 | 0.46 | 0.17 | 0.28 | 3,00 |
| Ge | 0.05 | 0.2 | 0.3 | 0.7 | 0.4 | 0.4 | 0.4 | 0.3 | 0.3 |
| Hf | <3 | <3 | 6 | 14 | 5 | 12 | 5 | 8 | <3 |
| Ho | 0.35 | 0.13 | 0.55 | 4.52 | 0.05 | 0.08 | <0.05 | 0.06 | 0.43 |
| In | 0.025 | 0.08 | 0.11 | 0.3 | 0.23 | 0.13 | 0.16 | 0.11 | 0.15 |
| La | 12.7 | 6.8 | 19.1 | 114.4 | 3.2 | 3,0 | 1.7 | 2.7 | 18.3 |
| Lu | 0.08 | <0.05 | 0.18 | 1.1 | <0.05 | <0.05 | <0.05 | <0.05 | 0.13 |
| Nb | 5 | 6 | 9 | 31 | 14 | 7 | 7 | 9 | 8 |
| Nd | 14.9 | 5.5 | 19.1 | 182.7 | 2.8 | 2.9 | 1.2 | 2,0 | 17.9 |
| Ni | 16 | 398 | 570 | 56 | 401 | 664 | 326 | 646 | 426 |
| Pb | 13 | 4 | 8 | 6 | <3 | <3 | <3 | <3 | 8 |
| Pd ppb | <5 | <5 | <5 | <5 | 12 | 5 | 5 | <5 | <5 |
| Pr | 3.6 | 1.5 | 4.8 | 41.3 | 0.8 | 0.8 | 0.25 | 0.6 | 4.5 |
| Pt ppb | <10 | <10 | <10 | <10 | <10 | <10 | 12 | 12 | <10 |
| Rb | 6 | 9 | 20 | 11 | 181 | 9 | 7 | 7 | 20 |
| Sc | 11.7 | 16.9 | 24.2 | 74.9 | 14.6 | 17.8 | 23.8 | 21.9 | 21.3 |
| Sm | 1.62 | 0.62 | 1.29 | 5.08 | 0.14 | 0.22 | 0.29 | 0.38 | 1.39 |
| Sn | 2 | 2 | 3 | 5 | 10 | 3 | 4 | 3 | 3 |
| Sr | 678 | 383 | 339 | 234 | 86 | 129 | 204 | 198 | 285 |
| Ta | 0.16 | 0.12 | 0.39 | 1.77 | 0.6 | 0.2 | 0.18 | 0.18 | 0.25 |
| Tb | 0.34 | 0.1 | 0.48 | 4.35 | 0.06 | 0.06 | <0.05 | <0.05 | 0.38 |
| Th | 0.56 | 0.77 | 1.36 | 2.59 | 1.31 | 0.27 | 0.07 | 0.18 | 1.05 |
| Tm | 0.1 | 0.05 | 0.2 | 1.41 | <0.05 | <0.05 | <0.05 | <0.05 | 0.15 |
| V | 104 | 1242 | 860 | 456 | 767 | 1099 | 915 | 980 | 2009 |
| W | 0.3 | 0.3 | 0.5 | 0.3 | 2.2 | 0.1 | 0.5 | 0.3 | 1.3 |
| Y | 8.3 | 3.2 | 13,00 | 105.6 | 1.4 | 1.8 | 0.8 | 1.5 | 10.3 |
| Yb | 0.57 | 0.33 | 1.21 | 7.79 | 0.24 | 0.23 | 0.14 | 0.27 | 0.89 |
| Zn | 62 | 324 | 271 | 481 | 641 | 701 | 630 | 519 | 448 |
| Zr | 86 | 51 | 99 | 595 | 28 | 46 | 54 | 53 | 110 |
| Element/ Compound | Arithmetic Mean | Geometric Mean | Median | Minimum Content | Maximum Content | Standard Deviation |
|---|---|---|---|---|---|---|
| Fe2O3 total (%) | 48.61 | 44.99 | 51.43 | 6.4 | 76.23 | 15.69 |
| TiO2 (%) | 7.56 | 7.11 | 8.05 | 1.57 | 11.44 | 2.26 |
| V (ppm) | 960.23 | 861.84 | 977 | 104 | 2208 | 403.57 |
| Co | 122.33 | 111.75 | 137 | 15 | 205 | 40.44 |
| Ga | 44.33 | 41.98 | 45 | 21 | 84 | 14.46 |
| Ge | 0.29 | 0.27 | 0.3 | 0.05 | 0.7 | 0.12 |
| Hf | 0.95 | 0.87 | 0.93 | 0.38 | 2.09 | 0.4 |
| In | 0.13 | 0.12 | 0.12 | 0.03 | 0.3 | 0.06 |
| Nb | 9.38 | 8.27 | 8 | 5 | 32 | 6.42 |
| Sc | 24.29 | 21.63 | 19.8 | 10.8 | 74.9 | 15 |
| W | 3.59 | 0.46 | 0.3 | 0.1 | 101 | 16.17 |
| Y | 11.38 | 3.98 | 3.8 | 0.25 | 105.6 | 25.4 |
| La | 15.13 | 7.07 | 6.8 | 0.8 | 118.3 | 28.69 |
| Ce | 33.93 | 13.8 | 12.6 | 1.3 | 285 | 71.17 |
| Pr | 4.59 | 1.63 | 1.7 | 0.25 | 41.3 | 10.27 |
| Nd | 19.36 | 6.51 | 6.8 | 0.5 | 182.7 | 45.06 |
| Eu | 3.76 | 1.16 | 1.23 | 0.07 | 36.85 | 8.94 |
| Sm | 0.97 | 0.61 | 0.62 | 0.09 | 5.27 | 1.27 |
| Gd | 3.3 | 1.03 | 0.92 | 0.07 | 32.5 | 7.8 |
| Tb | 0.44 | 0.14 | 0.13 | 0.03 | 4.35 | 1.03 |
| Dy | 2.48 | 0.83 | 0.83 | 0.06 | 23.56 | 5.63 |
| Ho | 0.48 | 0.16 | 0.16 | 0.03 | 4.52 | 1.07 |
| Er | 1.25 | 0.47 | 0.44 | 0.03 | 11.44 | 2.71 |
| Yb | 0.94 | 0.42 | 0.38 | 0.03 | 7.79 | 1.83 |
| Cr | 678.22 | 219.58 | 171 | 2.5 | 5705 | 1164.87 |
| Cu | 328.54 | 226.55 | 231 | 38 | 1756 | 323.94 |
| Ni | 436.36 | 302.06 | 421 | 16 | 1370 | 301.16 |
| Zn (ppm) | 453 | 415.65 | 481 | 62 | 701 | 152.79 |
| Au (ppb) | 6.62 | 3.46 | 4 | <1 | 37 | 8.32 |
| Ag (ppm) | 0.66 | 0.5 | 0.6 | <0.30 | 2.5 | 0.54 |
| Cd | 13.77 | 12.9 | 14 | 3 | 24 | 4.37 |
| Br | 4.64 | 4.55 | 5 | 3 | 7 | 0.93 |
| Rb | 16.97 | 11.55 | 9 | 6 | 181 | 29.56 |
| Sr | 271.49 | 247.15 | 254 | 86 | 678 | 123.62 |
| Sn | 3.15 | 2.96 | 3 | 2 | 10 | 1.41 |
| Ta | 0.34 | 0.24 | 0.23 | 0.08 | 1.77 | 0.4 |
| Th | 0.75 | 0.52 | 0.5 | 0.07 | 2.83 | 0.68 |
| U | 2.9 | 2.55 | 3 | 1 | 5 | 1.29 |
| Zr | 105 | 72.31 | 66 | 25 | 737 | 142.92 |
| SiO2 (%) | 21.47 | 19.1 | 18.44 | 6.27 | 45.39 | 10.15 |
| Al2O3 | 11.27 | 10.72 | 10.35 | 5.74 | 27.28 | 4.14 |
| MnO | 0.26 | 0.25 | 0.26 | 0.06 | 0.52 | 0.08 |
| MgO | 3.88 | 3.47 | 3.43 | 1.25 | 8.97 | 1.9 |
| CaO | 4.46 | 3.77 | 3.69 | 1.29 | 11.98 | 2.75 |
| Na2O | 1.62 | 1.45 | 1.51 | 0.62 | 4.58 | 0.84 |
| K2O | 0.38 | 0.34 | 0.34 | 0.11 | 1.11 | 0.21 |
| P2O5 | 0.23 | 0.07 | 0.05 | 0.01 | 2.39 | 0.54 |
| (SO3) | 0.33 | 0.09 | 0.21 | 0.01 | 1.7 | 0.47 |
| (Cl) | 0.11 | 0.11 | 0.12 | 0.08 | 0.17 | 0.02 |
| SiO2 | TiO2 | Al2O3 | Fe2O3 | MnO | MgO | CaO | Na2O | K2O | P2O5 | SO3 | Ag | Au | Br | Cd | Ce | Co | Cr | Cu | Ga | Ge | Hf | In | La | Nb | Ni | Rb | Sc | Sr | Ta | Th | U | V | Y | Zn | Zr | |
|---|---|---|---|---|---|---|---|---|---|---|---|---|---|---|---|---|---|---|---|---|---|---|---|---|---|---|---|---|---|---|---|---|---|---|---|---|
| SiO2 | 1.00 | |||||||||||||||||||||||||||||||||||
| TiO2 | 0.90 | 1.00 | ||||||||||||||||||||||||||||||||||
| Al2O3 | 0.71 | −0.74 | 1.00 | |||||||||||||||||||||||||||||||||
| Fe2O3 | −0.98 | 0.89 | −0.75 | 1.00 | ||||||||||||||||||||||||||||||||
| MnO | −0.14 | 0.16 | −0.67 | 0.17 | 1.00 | |||||||||||||||||||||||||||||||
| MgO | 0.45 | −0.34 | −0.14 | −0.42 | 0.47 | 1.00 | ||||||||||||||||||||||||||||||
| CaO | 0.83 | −0.81 | 0.61 | −0.89 | 0.07 | 0.31 | 1.00 | |||||||||||||||||||||||||||||
| Na2O | 0.86 | −0.84 | 0.94 | −0.90 | −0.46 | 0.06 | 0.78 | 1.00 | ||||||||||||||||||||||||||||
| K2O | 0.32 | −0.39 | 0.31 | −0.27 | −0.10 | −0.21 | 0.22 | 0.35 | 1.00 | |||||||||||||||||||||||||||
| P2O5 | 0.33 | −0.29 | −0.10 | −0.34 | 0.73 | 0.46 | 0.58 | 0.09 | −0.03 | 1.00 | ||||||||||||||||||||||||||
| SO3 | 0.02 | 0.00 | −0.11 | −0.05 | 0.30 | 0.20 | 0.11 | −0.01 | −0.14 | 0.26 | 1.00 | |||||||||||||||||||||||||
| Ag | −0.11 | 0.17 | −0.06 | 0.07 | 0.02 | −0.11 | −0.08 | −0.05 | 0.06 | −0.04 | 0.50 | 1.00 | ||||||||||||||||||||||||
| Au | −0.35 | 0.36 | −0.23 | 0.35 | −0.07 | −0.27 | −0.33 | −0.27 | −0.13 | −0.18 | 0.32 | 0.54 | 1.00 | |||||||||||||||||||||||
| Br | −0.59 | 0.56 | −0.44 | 0.56 | 0.09 | −0.21 | −0.46 | −0.51 | −0.26 | −0.12 | −0.04 | 0.18 | 0.53 | 1.00 | ||||||||||||||||||||||
| Cd | −0.65 | 0.61 | −0.59 | 0.64 | 0.28 | −0.05 | −0.54 | −0.64 | −0.36 | −0.08 | 0.20 | −0.11 | 0.19 | 0.50 | 1.00 | |||||||||||||||||||||
| Ce | 0.35 | −0.30 | −0.10 | −0.36 | 0.72 | 0.46 | 0.58 | 0.10 | −0.01 | 0.99 | 0.22 | −0.05 | −0.19 | −0.13 | −0.08 | 1.00 | ||||||||||||||||||||
| Co | −0.64 | 0.61 | −0.53 | 0.69 | 0.00 | −0.21 | −0.75 | −0.67 | −0.21 | −0.50 | −0.05 | 0.14 | 0.39 | 0.41 | 0.42 | −0.50 | 1.00 | |||||||||||||||||||
| Cr | −0.25 | 0.29 | −0.08 | 0.23 | −0.13 | −0.14 | −0.25 | −0.21 | −0.25 | −0.18 | −0.28 | −0.23 | −0.12 | 0.18 | 0.20 | −0.18 | 0.21 | 1.00 | ||||||||||||||||||
| Cu | −0.28 | 0.29 | −0.25 | 0.30 | −0.02 | −0.20 | −0.33 | −0.28 | 0.01 | −0.18 | 0.41 | 0.65 | 0.85 | 0.41 | 0.14 | −0.19 | 0.48 | −0.28 | 1.00 | |||||||||||||||||
| Ga | −0.87 | 0.75 | −0.41 | 0.86 | −0.17 | −0.58 | −0.78 | −0.67 | −0.34 | −0.42 | −0.16 | −0.01 | 0.28 | 0.50 | 0.57 | −0.43 | 0.57 | 0.39 | 0.16 | 1.00 | ||||||||||||||||
| Ge | −0.21 | 0.23 | −0.58 | 0.24 | 0.86 | 0.25 | 0.02 | −0.47 | −0.17 | 0.78 | 0.17 | −0.04 | −0.01 | 0.21 | 0.26 | 0.78 | −0.06 | 0.04 | −0.03 | 0.05 | 1.00 | |||||||||||||||
| Hf | −0.04 | 0.23 | −0.38 | 0.03 | 0.49 | 0.23 | 0.06 | −0.23 | −0.05 | 0.45 | 0.09 | 0.26 | 0.13 | 0.17 | 0.01 | 0.47 | −0.11 | 0.00 | 0.05 | −0.13 | 0.55 | 1.00 | ||||||||||||||
| In | −0.15 | 0.17 | −0.61 | 0.19 | 0.92 | 0.29 | 0.06 | −0.42 | −0.02 | 0.77 | 0.29 | 0.10 | −0.02 | 0.08 | 0.21 | 0.77 | −0.14 | −0.14 | 0.02 | −0.10 | 0.92 | 0.56 | 1.00 | |||||||||||||
| La | 0.35 | −0.29 | −0.03 | −0.35 | 0.58 | 0.41 | 0.50 | 0.15 | 0.01 | 0.83 | 0.18 | −0.11 | −0.18 | −0.15 | −0.06 | 0.84 | −0.38 | −0.12 | −0.19 | −0.40 | 0.63 | 0.36 | 0.59 | 1.00 | ||||||||||||
| Nb | 0.23 | −0.17 | −0.25 | −0.22 | 0.82 | 0.41 | 0.45 | −0.03 | 0.05 | 0.94 | 0.27 | 0.01 | −0.14 | −0.06 | 0.01 | 0.96 | −0.45 | −0.14 | −0.15 | −0.37 | 0.84 | 0.54 | 0.87 | 0.79 | 1.00 | |||||||||||
| Ni | −0.73 | 0.61 | −0.39 | 0.72 | −0.15 | −0.39 | −0.71 | −0.62 | −0.32 | −0.40 | 0.04 | 0.24 | 0.62 | 0.64 | 0.51 | −0.41 | 0.68 | 0.32 | 0.55 | 0.82 | 0.01 | −0.09 | −0.13 | −0.35 | −0.35 | 1.00 | ||||||||||
| Rb | −0.19 | 0.01 | −0.24 | 0.28 | 0.24 | −0.24 | −0.22 | −0.21 | 0.70 | −0.07 | −0.10 | −0.04 | −0.08 | 0.06 | 0.07 | −0.06 | 0.05 | −0.13 | 0.02 | 0.02 | 0.13 | −0.05 | 0.30 | −0.08 | 0.12 | −0.03 | 1.00 | |||||||||
| Sc | 0.37 | −0.23 | −0.25 | −0.36 | 0.72 | 0.74 | 0.47 | 0.00 | −0.12 | 0.86 | 0.21 | −0.06 | −0.25 | −0.13 | −0.07 | 0.86 | −0.49 | −0.16 | −0.23 | −0.53 | 0.68 | 0.57 | 0.73 | 0.69 | 0.84 | −0.48 | −0.10 | 1.00 | ||||||||
| Sr | 0.85 | −0.81 | 0.94 | −0.86 | −0.44 | 0.01 | 0.75 | 0.97 | 0.28 | 0.12 | 0.02 | −0.03 | −0.20 | −0.50 | −0.63 | 0.13 | −0.58 | −0.17 | −0.20 | −0.61 | −0.40 | −0.24 | −0.41 | 0.19 | −0.01 | −0.53 | −0.28 | −0.03 | 1.00 | |||||||
| Ta | 0.24 | −0.18 | −0.25 | −0.23 | 0.81 | 0.41 | 0.45 | −0.03 | 0.12 | 0.94 | 0.28 | 0.04 | −0.11 | −0.04 | 0.00 | 0.95 | −0.43 | −0.19 | −0.10 | −0.40 | 0.83 | 0.57 | 0.87 | 0.79 | 0.99 | −0.35 | 0.15 | 0.85 | −0.01 | 1.00 | ||||||
| Th | 0.27 | −0.23 | −0.19 | −0.24 | 0.68 | 0.32 | 0.40 | 0.00 | 0.41 | 0.80 | 0.12 | 0.04 | −0.18 | −0.19 | −0.11 | 0.83 | −0.33 | −0.28 | −0.08 | −0.40 | 0.68 | 0.51 | 0.75 | 0.72 | 0.83 | −0.38 | 0.29 | 0.69 | 0.00 | 0.87 | 1.00 | |||||
| U | −0.67 | 0.63 | −0.64 | 0.65 | 0.28 | −0.15 | −0.53 | −0.66 | −0.09 | −0.09 | 0.13 | 0.06 | 0.06 | 0.32 | 0.46 | −0.09 | 0.29 | −0.03 | 0.09 | 0.47 | 0.21 | 0.18 | 0.30 | −0.08 | 0.03 | 0.32 | 0.34 | −0.02 | −0.73 | 0.04 | 0.04 | 1.00 | ||||
| V | −0.43 | 0.39 | −0.28 | 0.42 | −0.08 | −0.13 | −0.44 | −0.38 | −0.21 | −0.39 | −0.09 | 0.01 | 0.10 | 0.16 | 0.39 | −0.40 | 0.70 | 0.32 | 0.15 | 0.42 | −0.18 | −0.23 | −0.19 | −0.26 | −0.40 | 0.37 | −0.08 | −0.39 | −0.35 | −0.42 | −0.35 | 0.17 | 1.00 | |||
| Y | 0.36 | −0.30 | −0.12 | −0.36 | 0.73 | 0.50 | 0.59 | 0.09 | −0.02 | 0.99 | 0.23 | −0.06 | −0.21 | −0.13 | −0.09 | 1.00 | −0.51 | −0.18 | −0.21 | −0.45 | 0.78 | 0.48 | 0.77 | 0.83 | 0.95 | −0.42 | −0.06 | 0.89 | 0.11 | 0.95 | 0.82 | −0.09 | −0.41 | 1.00 | ||
| Zn | −0.92 | 0.88 | −0.79 | 0.94 | 0.35 | −0.34 | −0.77 | −0.90 | −0.36 | −0.08 | 0.03 | 0.09 | 0.34 | 0.53 | 0.64 | −0.10 | 0.56 | 0.17 | 0.26 | 0.80 | 0.46 | 0.18 | 0.40 | −0.15 | 0.03 | 0.64 | 0.18 | −0.15 | −0.84 | 0.01 | −0.06 | 0.64 | 0.31 | −0.11 | 1.00 | |
| Zr | 0.32 | −0.25 | −0.12 | −0.32 | 0.67 | 0.42 | 0.52 | 0.08 | −0.03 | 0.92 | 0.29 | 0.01 | −0.12 | −0.14 | −0.09 | 0.94 | −0.46 | −0.15 | −0.11 | −0.39 | 0.74 | 0.54 | 0.76 | 0.80 | 0.92 | −0.35 | −0.09 | 0.81 | 0.11 | 0.92 | 0.78 | −0.04 | −0.39 | 0.93 | −0.08 | 1.00 |
Publisher’s Note: MDPI stays neutral with regard to jurisdictional claims in published maps and institutional affiliations. |
© 2022 by the authors. Licensee MDPI, Basel, Switzerland. This article is an open access article distributed under the terms and conditions of the Creative Commons Attribution (CC BY) license (https://creativecommons.org/licenses/by/4.0/).
Share and Cite
Mikulski, S.Z.; Sadłowska, K.; Wiszniewska, J.; Małek, R. Vanadium and Cobalt Occurrence in the Fe-Ti-V Oxide Deposits Related to Mesoproterozoic AMCG Complex in NE Poland. Appl. Sci. 2022, 12, 6277. https://doi.org/10.3390/app12126277
Mikulski SZ, Sadłowska K, Wiszniewska J, Małek R. Vanadium and Cobalt Occurrence in the Fe-Ti-V Oxide Deposits Related to Mesoproterozoic AMCG Complex in NE Poland. Applied Sciences. 2022; 12(12):6277. https://doi.org/10.3390/app12126277
Chicago/Turabian StyleMikulski, Stanisław Z., Katarzyna Sadłowska, Janina Wiszniewska, and Rafał Małek. 2022. "Vanadium and Cobalt Occurrence in the Fe-Ti-V Oxide Deposits Related to Mesoproterozoic AMCG Complex in NE Poland" Applied Sciences 12, no. 12: 6277. https://doi.org/10.3390/app12126277
APA StyleMikulski, S. Z., Sadłowska, K., Wiszniewska, J., & Małek, R. (2022). Vanadium and Cobalt Occurrence in the Fe-Ti-V Oxide Deposits Related to Mesoproterozoic AMCG Complex in NE Poland. Applied Sciences, 12(12), 6277. https://doi.org/10.3390/app12126277