Article

Two-Phase Anaerobic Digestion of Corn Steep Liquor in Pilot Scale Biogas Plant with Automatic Control System with Simultaneous Hydrogen and Methane Production

The Stephan Angeloff Institute of Microbiology, Bulgarian Academy of Sciences, Acad. G. Bonchev Str., Bl. 26, 1113 Sofia, Bulgaria
*
Author to whom correspondence should be addressed.
Appl. Sci. 2022, 12(12), 6274; https://doi.org/10.3390/app12126274
Submission received: 12 May 2022 / Revised: 8 June 2022 / Accepted: 17 June 2022 / Published: 20 June 2022
(This article belongs to the Section Applied Biosciences and Bioengineering)

Abstract

:
Experimental studies of two-phase anaerobic digestion of corn steep liquor in semi-continuous automatic and semi-automatic modes of operation of a cascade of two anaerobic bioreactors with monitoring and control systems were performed. Corn steep liquor—a waste product from the process of treating corn grain for starch extraction—was used as a substrate in the process of anaerobic digestion with simultaneous hydrogen and methane production. The daily yields of biohydrogen in bioreactor 1 of the cascade (with a working volume of 8 dm3) are variable. In good operation, they are in the range of 0.7 to 1.0 L of biogas from a 1 dm3 working volume of the bioreactor, and the optimal pH is in the range of 5.0–5.5. The concentration of hydrogen in the biogas from the hydrogen bioreactor 1 is in the range of 14–34.7%. The daily yields of biomethane in bioreactor 2 of the cascade (with a working volume of 80 dm3) vary in the range 0.4 to 0.85 L of biogas from a 1 dm3 working volume of the bioreactor, and the concentration of methane in the biogas from bioreactor 2 is high and remains practically constant (in the range 65–69%). At a dilution rate of 0.4 day−1 and an organic loading rate of 20 gL for bioreactor 1, respectively, and a dilution rate of 0.05 day−1 for bioreactor 2, the best results were obtained. The computer control system is presented. Some energetical considerations were discussed.

1. Introduction

Anaerobic digestion (AD) of organic waste is an attractive biotechnology, in which the microorganisms degrade the complex organic matter to simpler components under anaerobic conditions to produce biogas and fertilizer [1,2]. After AD processes, the biogas can be upgraded to biomethane, which is considered an attractive renewable energy alternative to natural gas. Furthermore, the use of the resulting digestate for enriching agricultural soils also contributes to creating carbon sinks.
AD has many environmental benefits, such as: green energy production; treatment of heavily polluted with organics wastewater, industrial and municipal waste; environmental protection; and greenhouse gas (GHG) emissions reduction.
To become climate neutral by 2050, the transport sector must decrease current GHG emissions by 90%. In this context, the use of biofuels, such as bioethanol, biodiesel, and biogas, may contribute to overcoming this challenge. In the European Union, the long-term decarbonization strategy expects an increase in biomass and waste-derived energy from 140 million tons of oil equivalent (Mtoe) in 2015 to over 250 Mtoe in 2050. From them, biogas will represent about 54–71 Mtoe. Biomethane produced from waste streams via AD has currently the lowest cost (40–50 EUR/MWh) among advanced biofuels. The full use of the potential production of biogas and biomethane could cover up to 20% of the worldwide gas demand [3].
It is known that more than 95% of industrial biogas plants operate with so-called bioreactors with continuous stirring (CSTR) [4].
The biodegradation of the complex organic matter undergoes four main steps: hydrolysis, acidogenesis, acetogenesis, and methanogenesis [1,5]. Biogas consists mainly of methane (CH4) and carbon dioxide (CO2); however, hydrogen (H2) and hydrogen sulfide (H2S) also exist in low quantities. In traditional AD, H2 is not high in general (around 1% or less) and it is consumed by hydrogenotrophic bacteria immediately in the production of CH4 and CO2 [1].
During the fermentation process, energy-rich reducing compounds (i.e., NAD(P)H and FADH) are generated during metabolic reactions, followed by reoxidation through respiratory chains with a terminal electron acceptor. Thus energy-rich molecules (ATP) are formed. In aerobic respiration, an oxygen molecule is a final electron acceptor and ATP is generated with concurrent regeneration of the reducing powers. Anaerobic respiration uses a variety of organic and inorganic compounds (e.g., NO3 and SO42−, among others) as terminal electron acceptors with their concurrent reduction and regeneration of reducing powers. Glycolysis is the key metabolic pathway in which a substrate can be transformed into pyruvate, a central metabolic intermediate. Under anaerobic conditions, pyruvate enters into the acidogenic pathway coupled with H2 production, which results in the formation of volatile fatty acids (VFAs) [6].
The oxidation of organic acids such as propionic, butyric, valeric acids, and alcohols leads to acetate production. It is driven by heterotrophic microorganisms. Acetate formation by autotrophic acetogenic microorganisms (homoacetogens) through CO2 reduction with H2 is named homoacetogenesis. Briefly, acetogenesis produces H2 and CO2 while homoacetogenesis consumes H2 and CO2, although both processes lead to acetate production [7].
At the same time, it has long been known that acidogenic and methanogenic microorganisms in mixed anaerobic culture in AD differ in many respects and the optimal conditions for their growth and development are different [5]. For example, optimal pH and organic load for acidogens (optimal pH 5.0–5.5) can lead to inhibition of methanogens (optimal pH 6.5–8.5). Therefore, in AD in a single BR (single-phase process), they are selected taking into account the slow-growing methanogens at the expense of fast-growing acidogens, which affect the efficiency of the whole process. This has led to the development of two-phase (or two-stage) AD, in which the processes are divided into two separate BRs with different working volumes, as the rapid processes of hydrolysis and acidogenesis are in the first BR and are accompanied by hydrogen evolution, and more slow-moving processes of acetogenesis and methanogenesis—in the second BR (with a larger working volume), which releases methane [4,8,9]. It is known that this division of the processes into two consecutive BRs leads to significantly higher energy yields (by over 40%) for the two-phase system (H2 + CH4), compared to the traditional single-stage CH4 production process [4,8,10]. Lately, an idea to divide the processes into three separate BRs (hydrolytic, acidogenic, and methanogenic) has occurred [11].
At the same time, in the two-phase anaerobic biodegradation (TPAD) with CSTR, the waste organic substances are 9–16 times lower than the incoming ones, i.e., the degree of biodegradation (DBD = 89–93%). In our laboratory experimental studies for AD of mixtures of milk whey and waste-activated sludge from a wastewater treatment plant in a two-stage process (with biomethane production only), a DBD of 95% was obtained [12]. In the case of TPAD, the waste obtained can also be used as natural fertilizer in agriculture. The corn steep liquor (CSL) selected as the raw material was used (alone or in mixtures) to produce biohydrogen or biomethane [13,14]. Corn steep liquor is a cheap alternative to yeast extract for numerous biotechnological industrial processes. At the same time, because of the rapid development of the production of corn starch, substantial amounts of CSL have been produced. Many starch manufacturers discharge corn soak water directly into the environment, which has a negative impact on the environment [15]. According to our known information, it is not used in TPAD for simultaneous production of hydrogen and methane.
The aim of this paper is to investigate and present some of our results on the simultaneous production of hydrogen and methane in a pilot-scale automated system for TPAD of CSL with CSTRs.

2. Materials and Methods

2.1. Substrates

Glucose was used as a sole carbon source for initial experiments and proving the activity of the inoculum.
As a substrate in the process of AD with hydrogen production, CSL was used—a waste product from the process of processing corn grain to extract starch. The corn extract was provided by ADM Razgrad EAD. ADM Razfrad EAD is a Bulgarian company with the main activities: production, marketing, and sale of starch and all derivatives of this type, and processing of maize. Some of its characteristics are shown in Table 1.

2.2. Analytical Methods

The reducing sugars content was analyzed using the Miller method [16]. The method is based on the redox reaction between reducing sugars and sodium dinitrosalicylate which gives a reddish-brown derivative. Absorption was measured at a wavelength of 530 nm. Protein content was analyzed according to the Bradford method [17]. The method is based on the reaction of Coomassie Brilliant Blue G-250 with proteins resulting in a shift in the dye color to blue with maximum absorption at 595 nm. Cellulose was determined by the spectrophotometric method [18]. Cellulose-containing materials are released from impurities such as lignin, hemicellulose, xylosans, and other low molecular weight compounds by extraction with an acetate–nitrite mixture. The purified cellulose was dissolved in 67% H2SO4, followed by a color reaction with an anthrone reagent. The cellulose concentration was determined after measuring the absorbance at 620 nm. Determination of total solids (TS) and volatile solids (VS) was performed by a standard method by drying a certain volume of sample to constant weight at 105 ± 3 °C (for determining TS) and subsequent annealing at 575 ± 25 °C (for determining the ash content). The difference between TS and ash content shows the amount of vs. in the sample [19]. Because of the high organic content (and to avoid some losses during the annealing), the samples were heated slowly to ensure slow oxidation of organics and to prevent the sample from igniting. The heating, annealing, and cooling down to room temperature (in a desiccator) were repeated to reach a constant weight in two consistent measurements. The concentration of volatile fatty acids was determined by a Thermo Scientific gas chromatograph (Focus GC model) equipped with a Split/Splitless injector, column: TG-WAXMS A, (length 30 m, diameter 0.25 mm, film thickness 0.25 μm), and flame ionization detector (FID). Prior to injection, the pH of the sample taken from the bioreactor was adjusted to pH 2.0 with 37% H3PO4. After one hour, the sample was centrifuged at 15,000 rpm for 10 min and a liquor of the supernatant was mixed with an equal volume of 1% 2.2-dimethyl-butyric acid (as an internal standard). During each run of the chromatographic analysis, the temperature of the oven started from 110 °C and was set to increase to 210 °C and held for 2 min. The FID temperature was set at 210 °C. Biogas content of the gas produced from BR1 (containing hydrogen) and gas produced from BR2 (containing methane) was estimated as follows: with a device model “Gasboard 3100P” (Cubic Sensor and Instrument Co., Ltd., Wuhan, China), equipped with infrared sensors for measuring the relative content of CO2 and H2 (in % by volume); with the instrument model “Dräger, X-am7000” (Germany), equipped with infrared sensors for measuring the relative content of CH4 and CO2 in percentage by volume and a catalytic sensor for H2S (in ppm).

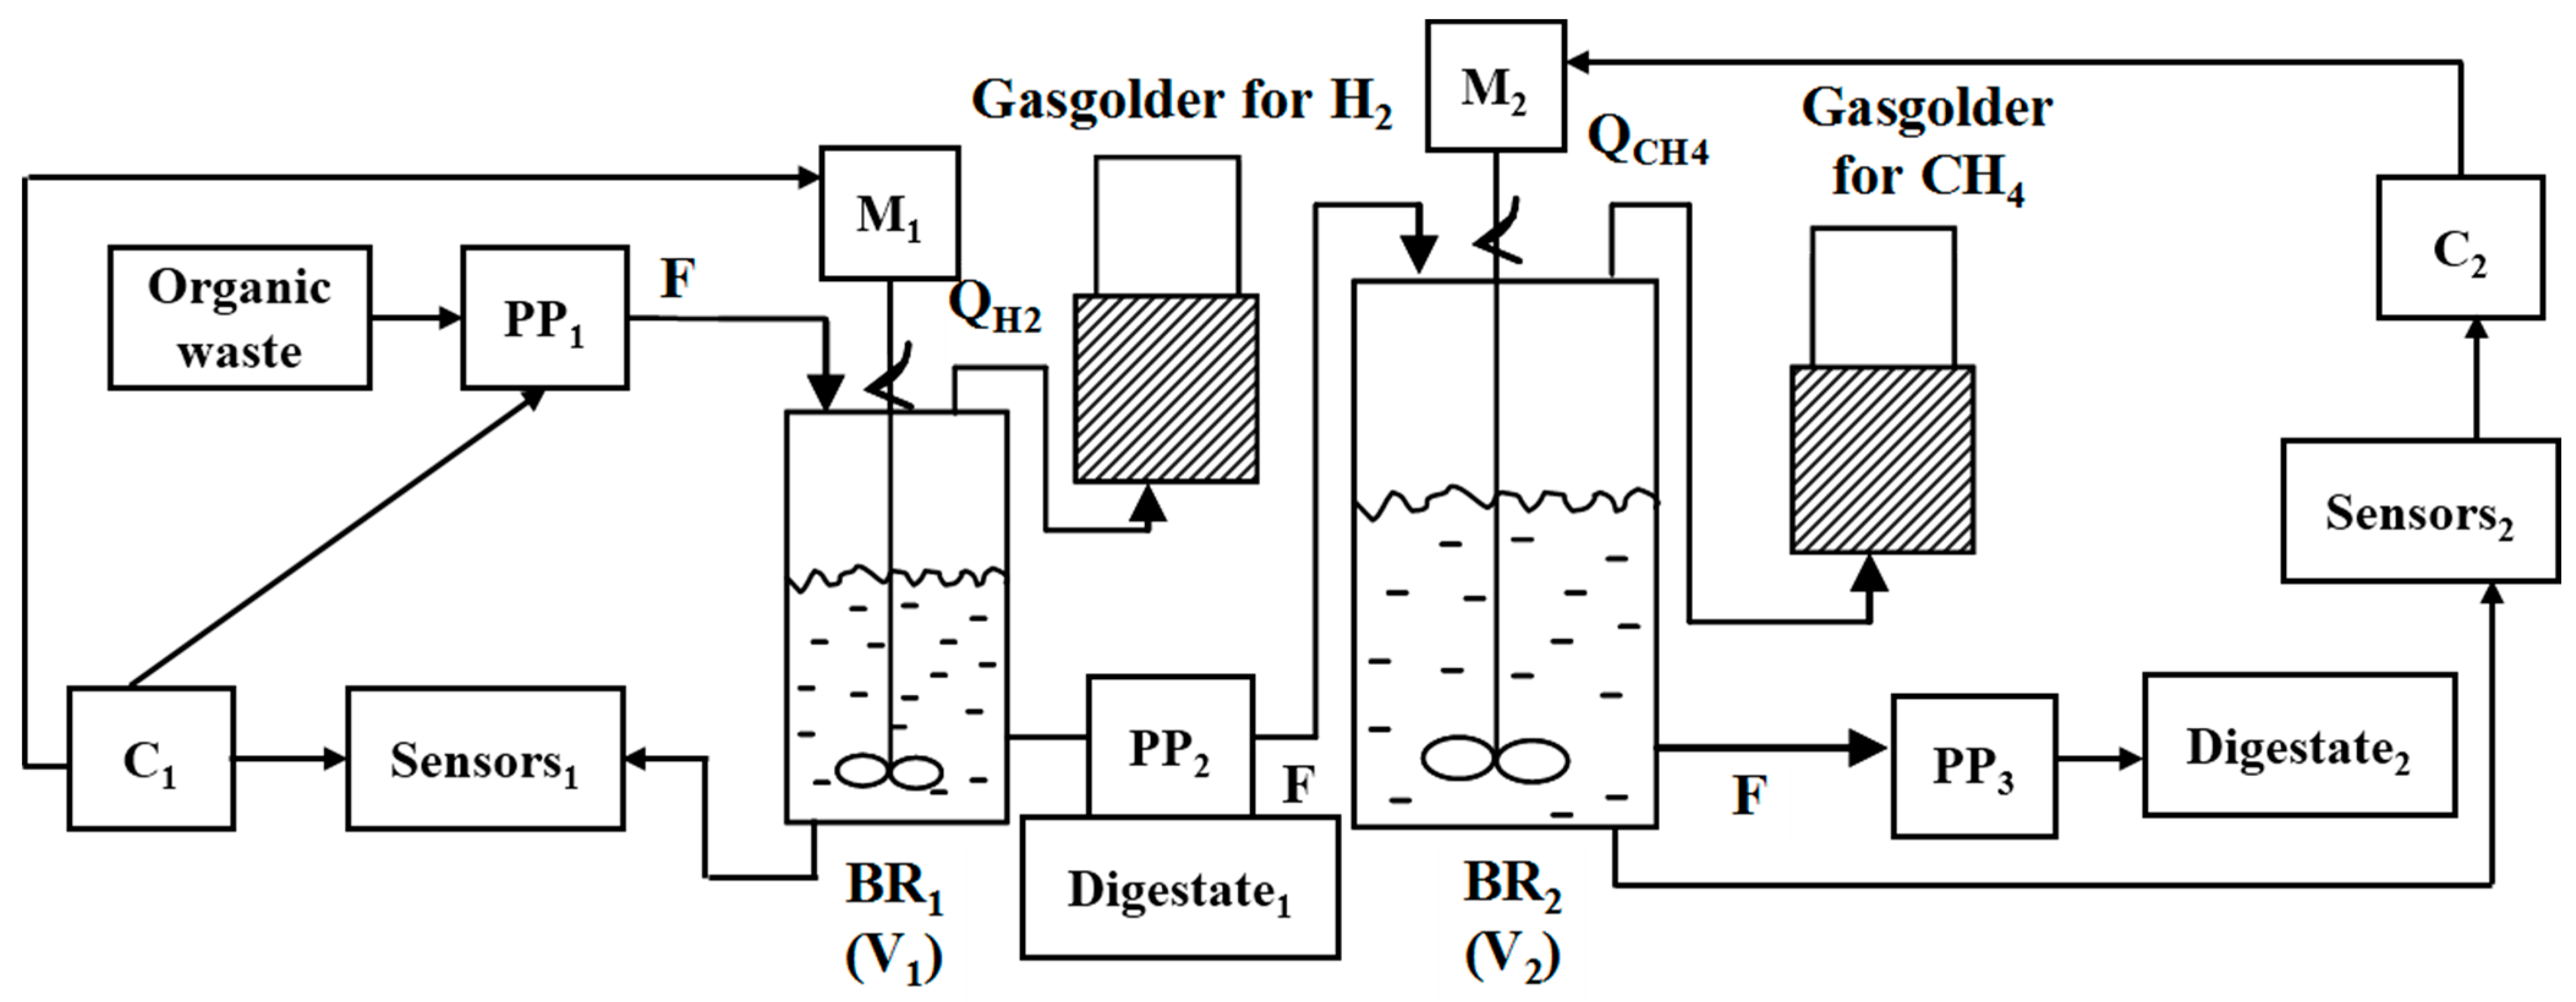
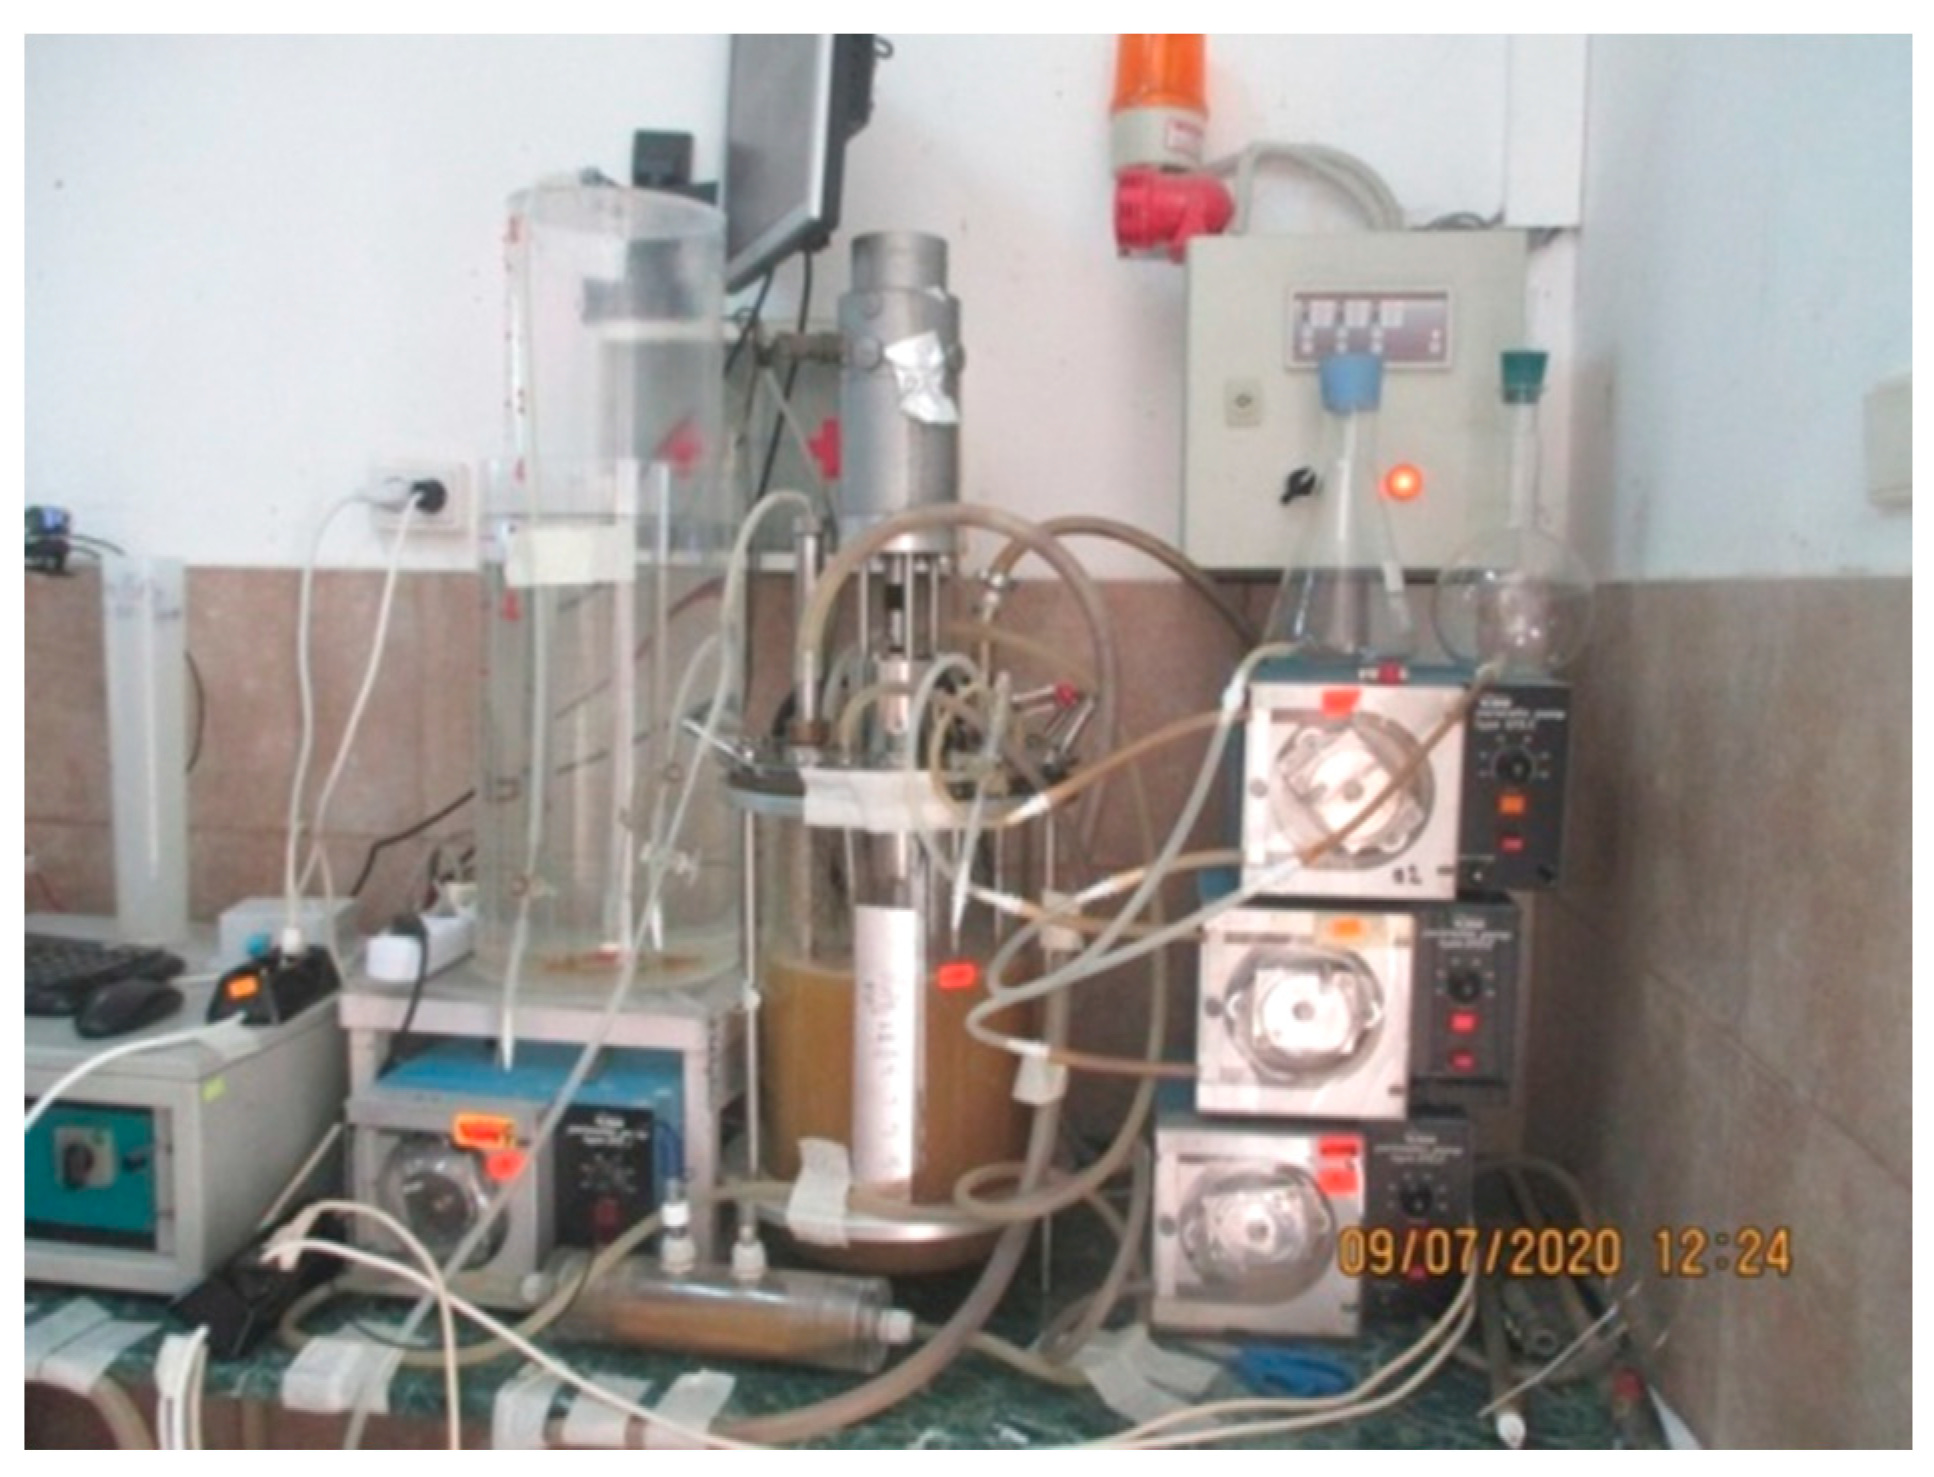
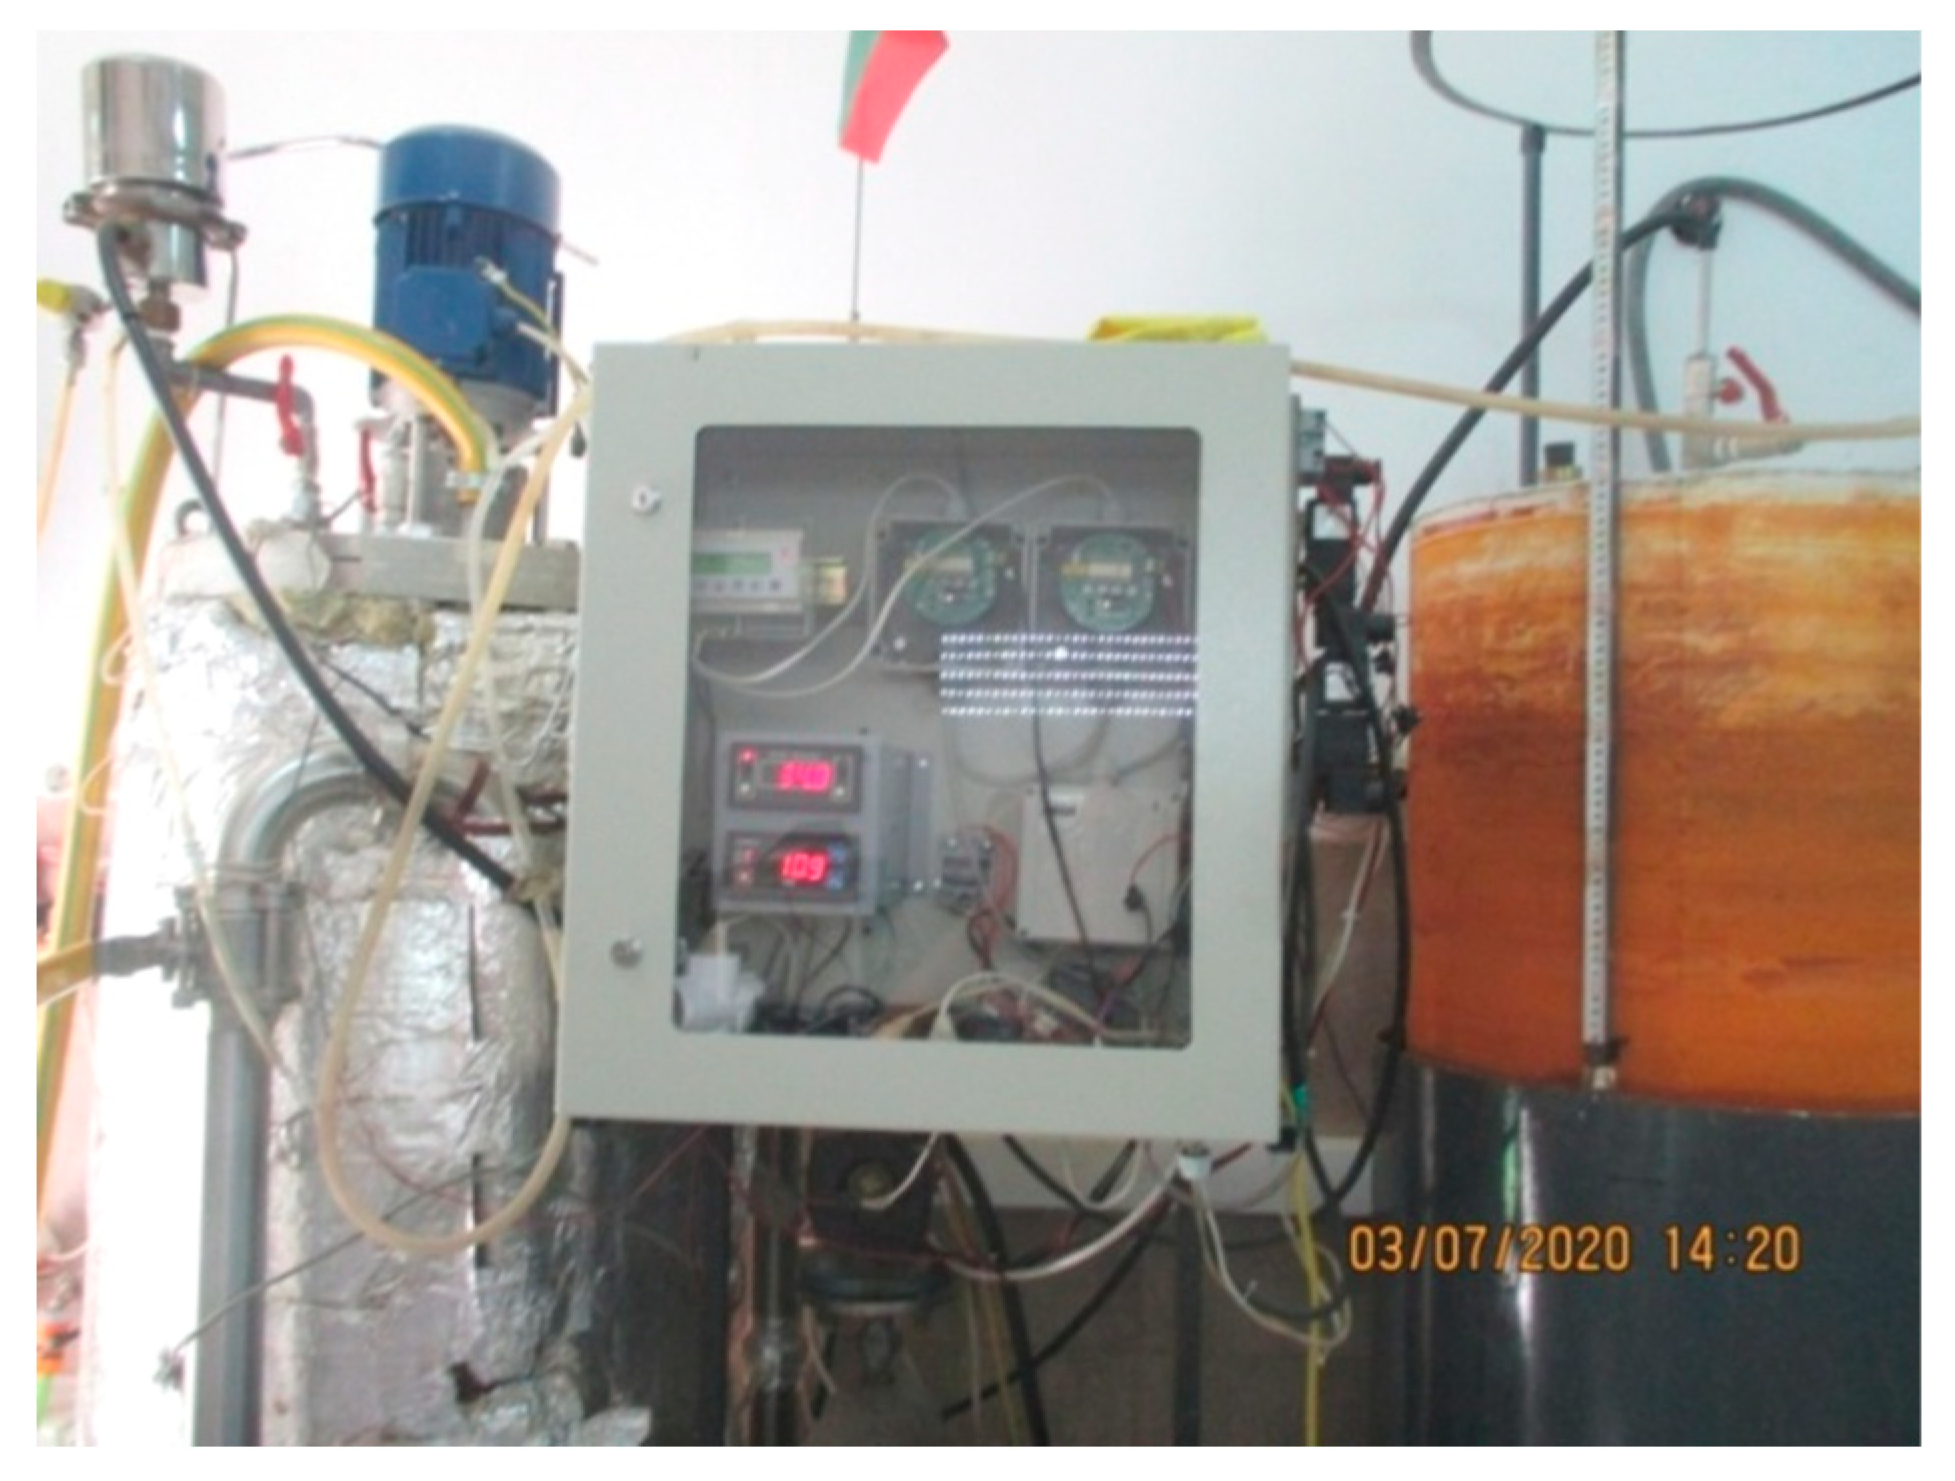
2.3. Experimental Setup

Experiments were conducted in a two-phase pilot biogas plant (PBP) with a computer control system (Figure 1).
Initial experiments as well as inoculum maintenance were carried out in two laboratory-scale bioreactors each one with a working volume of 1 dm3 and 2 dm3. In all experiments, mesophilic temperature (35 °C) and a continuous stirring mode were maintained.
The PBP system was constructed in our laboratory at the Institute of Microbiology as a cascade of two bioreactors BR1 and BR2. The first version of this PBP was created only for one-stage AD processes with methane production [20,21,22].
BR1 (with hydrogen production) is a glass vessel with a stirrer driven by an electric motor, stainless steel flanges, and the upper flange has a large number of holes (for substrate inlet, outlet liquid, biogas outlet, sampling, feeding based on acid, etc.), with a total volume of 20 dm3, and 8 and 10 dm3 were used as working volumes. In BR1, the mesophilic temperature of 35 °C was maintained by means of a hardware regulator (heating only). The separated biogas was collected in a transparent plastic graduated gasholder (GH), working on the principle of water displacement. Due to the lack of a flow sensor, biogas yields were reported visually once a day. An overview, including bioreactor, plastic gasholder, peristaltic pumps, and control devices, is shown in Figure 2.
BR2 (with methane production) is made of stainless steel, thermally insulated, with a total volume of 100 dm3, a working volume of 80 dm3, with a double jacket for heating and auxiliary equipment. The obtained biogas is collected in metal GH, working on the principle of water displacement. The flow rate of the received biogas is measured with a specialized sensor by the German company Ritter. A general view of BR2 with his GH and measuring board is presented in Figure 3.
BR1 and BR2 are connected with a plastic tube for the transfer of the liquid effluent of BR1 to BR2 by the pump PP2. The corresponding gasholders collect the gas outlets of both bioreactors. The control system of the two-phase PBP was developed as two separate subsystems for BR1 and BR2.

2.3.1. BR1 (Hydrogen) Control System

As a result of several months of experiments, it was found that the pH of the medium of hydrogen BR1 is constantly changing in both directions (towards acidification and alkalization). It was found experimentally that with the formed bacterial community, the optimal pH range is in the range 5.0–5.5. At pH values below 5.0, the hydrogen production process stops, and at values above 5.5, the process often deviates to methane formation. At long intervals, pH adjustments with sodium hydroxide and hydrochloric acid were made manually, but this proved unsuccessful and led to the deterioration of the processes. Therefore, pH regulators have been developed in two variants—hardware (classic) and software (with the specialized LabVIEW package).
For the measurement of pH and oxidation–reduction potential (rH) in real time, a flow cell was constructed and fabricated, and the circulation of the culture medium from the hydrogen BR1 through it can be carried out continuously or at set intervals by means of a peristaltic pump. After appropriate adjustment of the parameters of the pH controller with hysteresis, the necessary pH stabilization (with the addition automatically of sodium hydroxide and hydrochloric acid in appropriate concentrations using two peristaltic pumps) was achieved in the specified optimal range.
A system for monitoring and controlling hydrogen-producing BR1 from organic waste has been developed and tested. A personal computer and the LabVIEW software package were used for the implementation.
The system with a software sensor for the specific growth rate of microorganisms and biomass, with the possibility to control the process, with an interface, is shown in Figure 4.
Possibilities are provided for recording the measurements of the next process parameters: current time period from the beginning of reporting, cultivation temperature, and pH in the bioreactor; content of H2 and CO2 in the obtained biogas; biogas flow rate per day; biogas flow for one period of time (for example, for 1 h).
The system has the ability to automatically control the supply of nutrient solution from a tank at the inlet to BR1 (inlet) through a peristaltic pump P1, as well as for the automatic withdrawal of liquid (outlet) and transfer to BR2 by pump P2. The time period between two feeds can be controlled from the interface by setting the monitor to see how many minutes the unit time period should be. It is also possible to set the operating times of both pumps from the monitor. These capabilities provide an interactive mode of operation between the software and the user.
A software sensor for the specific growth rate of H2-producing microorganisms and biomass in BR1 was implemented, based on the following equations [23]:
{ z = D z + Q H 2 μ ^ = Q H 2 z X ^ = z Y H 2
where D is the dilution rate in BR1, QH2 is the current measurement of H2 yield in biogas, μ ^ is the estimate of the specific growth rate of H2-producing microorganisms, X ^ is the estimate of biomass in BR1, YH2 is the yield coefficient determined by mathematical modeling of the process, and z is an auxiliary variable. The estimates of the two variables are visualized on the monitor.
The system is able to control the pH of the bioreactor in the optimal range between 5.1 and 5.4 by supplying base and acid, respectively, below and above these limits by means of two peristaltic pumps (see Figure 3).

2.3.2. BR2 (Methane) Control System

The second bioreactor of the cascade BR2 (named pilot BR) has a working volume of 80 dm3 (total volume of 100 dm3) with a double jacket for heating and auxiliary equipment and is connected to a computer system for monitoring and control. The resulting biogas is collected in a metal GH, operating on the principle of water displacement. The flow rate of the received biogas is measured with a specialized sensor by the German company Ritter. Further information can be found in [20,21,22].
The computer system for monitoring and control of the pilot BR2 was developed on the basis of a programmable logic controller (PLC) of Beckhoff and a personal computer with the Windows operating system. The following parameters are monitored and regulated:
  • The temperature in the bioreactor (in this case, mesophilic = 35 °C);
  • Feeding the influent of BR1 into the bioreactor with PP2;
  • Measurement of CH4 and CO2 in biogas;
  • Measurement of the biogas flow rate;
  • Control of the pressure in the BR2 and at its inlet (against clogging of the pipelines);
  • Stirring control in the bioreactor.
Control algorithms (P and PI) for the regulation of the obtained biogas from BR2 are realized.

2.4. Inoculum

As an inoculum, the liquid fraction from an anaerobic digestor operating at mesophilic conditions was used. The fraction was prepared and thermally treated as it was previously described [24]. Volatile solids of the final inoculum were 2.63 ± 0.07 g/dm3, and pH was 6.83 ± 0.1.

3. Results and Discussion

3.1. Experimental Studies in Laboratory Bioreactors

Experimental studies were performed in batch and semi-continuous modes of operations in laboratory bioreactors and in a two-phase pilot biogas plant with a computer control system. The “bottleneck” was the hydrogen production because of the hydrolysis/acidification as a hybrid first stage. Using mixed microbial consortia seemed to be the easiest way to realize fermentative hydrogen production. However, there are a lot of factors that must be specified such as temperature, pH, organic load, and hydraulic retention time. These consortia must be enriched in hydrogen-producing bacteria and hydrogen-consuming microorganisms must be properly inhibited. Its necessity to strengthen the competitiveness of hydrogen-producing bacteria over hydrolyzing ones to improve volatile fatty acids production remains an open issue [4]. Such kinds of experiments were carried out in our laboratory bioreactors with different substrates.
  • Glucose—batch and continuous mode of operation with organic loads of 2, 3, 4, and 6 g/L);
  • Corn steep liquor.
All experimental data obtained on day 3 for biogas yield and the maximal value of the H2 content in the biogas are represented in Table 2.
As can be seen in Table 2, even 2 g of pure glucose led to high hydrogen production. Even though at an organic load of 6 g a higher hydrogen content was obtained, the biogas quantity is less, and the overall hydrogen yield is smaller. In this case, the other substrate (CSL) was used, the 15 mL load led to a longer process duration (5 days) and higher hydrogen content along with bigger biogas volume. The semi-continuous process of daily addition of substrate (Figure 5) showed that a higher hydrogen content (up to about 50%) might be obtained, but the process maintained without automation control of pH is quite unstable for a long period of bioreactor operation (longer than about 30 days).
The experiments were transposed to slightly bigger laboratory bioreactors with a working volume of 2 dm3. The biogas and the hydrogen yield increased with the substrate addition. However, the H2S content also increased when CSL was used as a substrate. It might be due to the sulfur content in this substrate based on the technology of corn seeds treatment. The Draeger X-am 7000 device was used for biogas analysis. It has a limitation on H2S measurement above 1000 ppm. Even in a small concentration (18 mL) of CSL, about 705 ppm of H2S was reached. The subsequent increase in CSL addition led to an H2S content greater than the maximum limitation of the device. The results concerning the batch and continuous experiments are demonstrated in Table 3.
The preliminary experiment showed that in the two-stage process, pH monitoring and continuous control have a great impact (Table 4). The biogas yield decrease at the pH means lower than pH 4.5 which might be reached on the 7th day of cultivation.
Although the graphics in Figure 6 show that the daily hydrogen yield is greater during the first 5–6 days of the process, the overall methane yield is greater for the whole process (2.46 dm3 biogas/L working volume) in comparison with the hydrogen yield (1.74 dm3/L working volume).

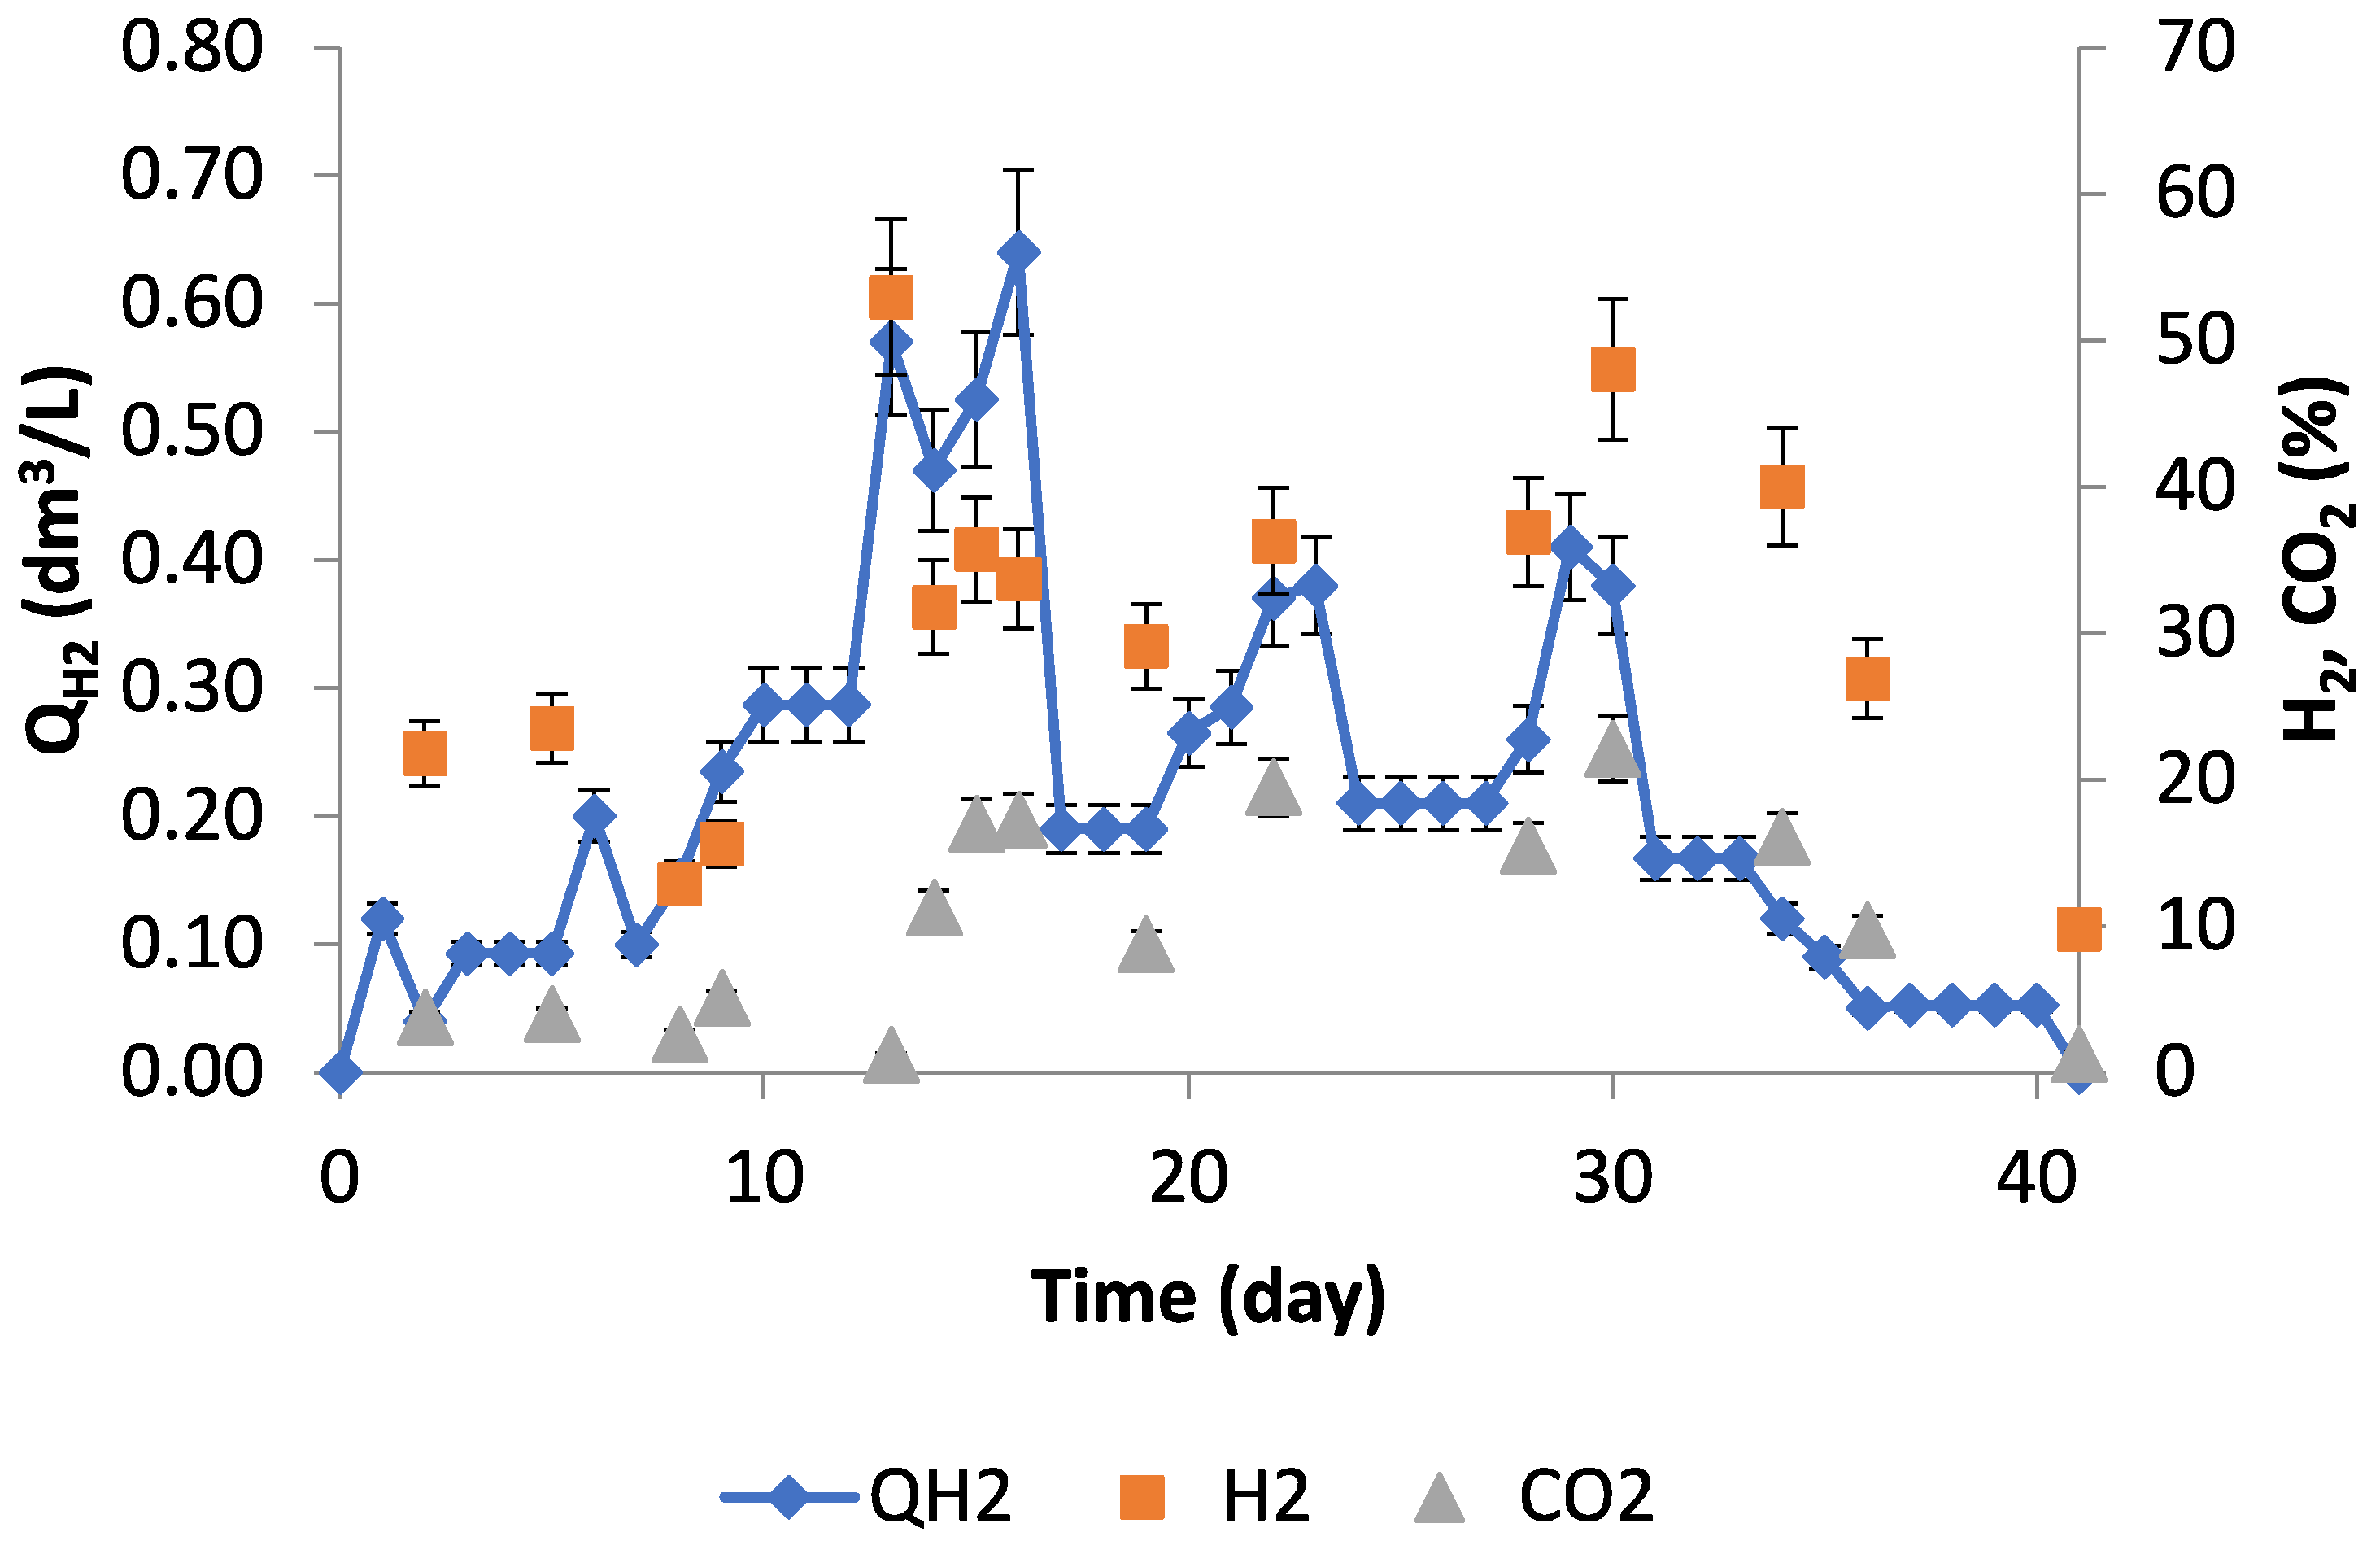
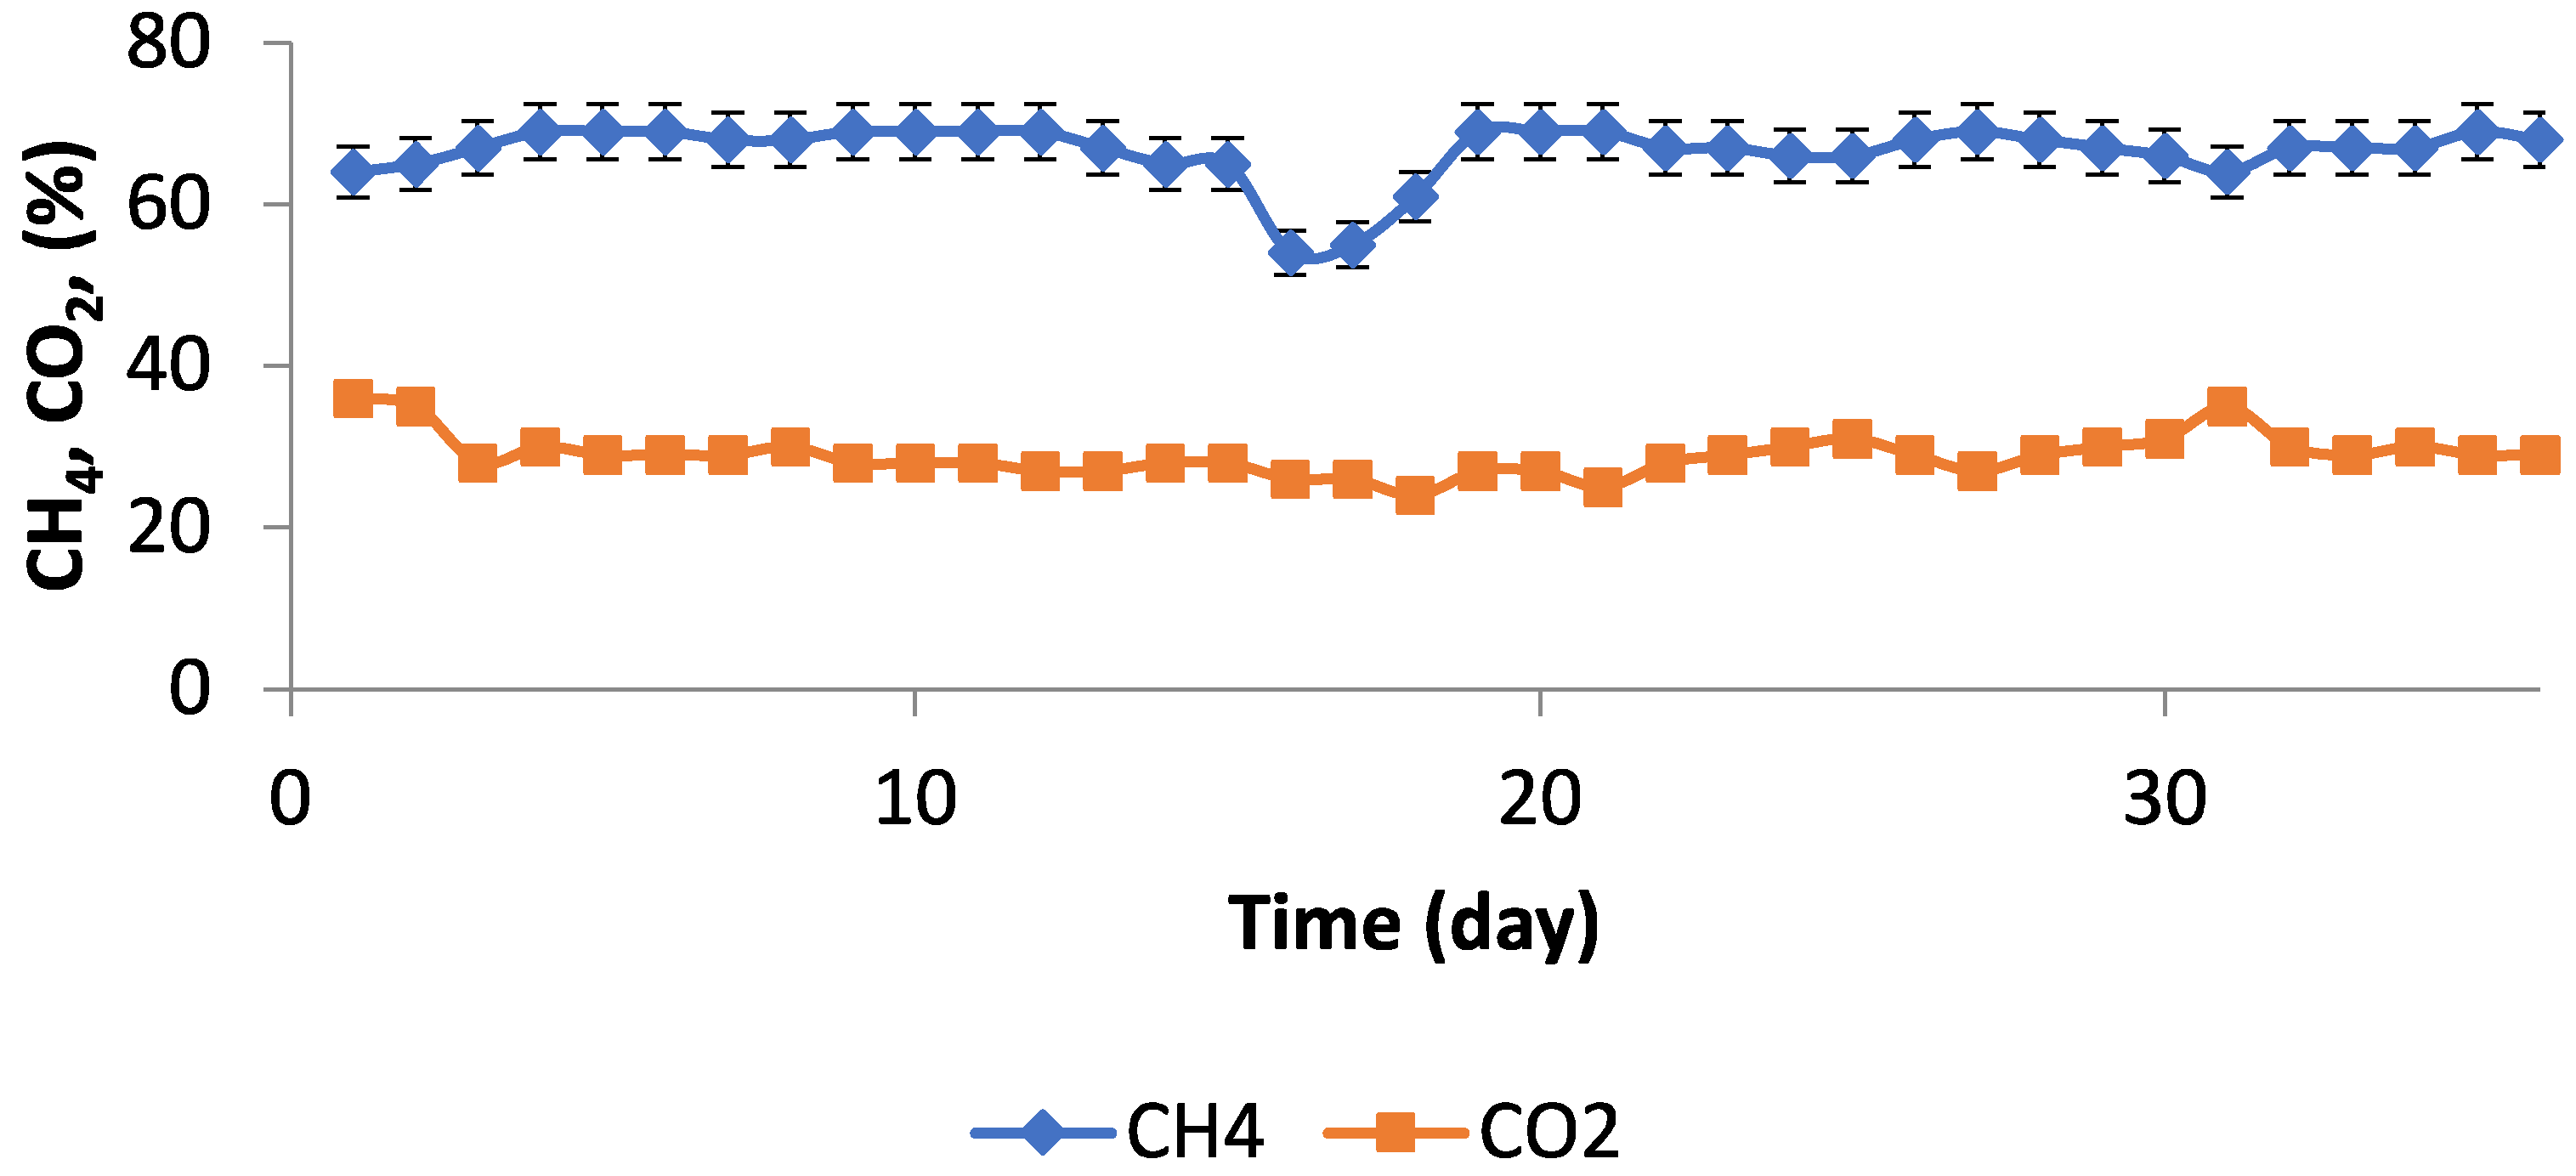
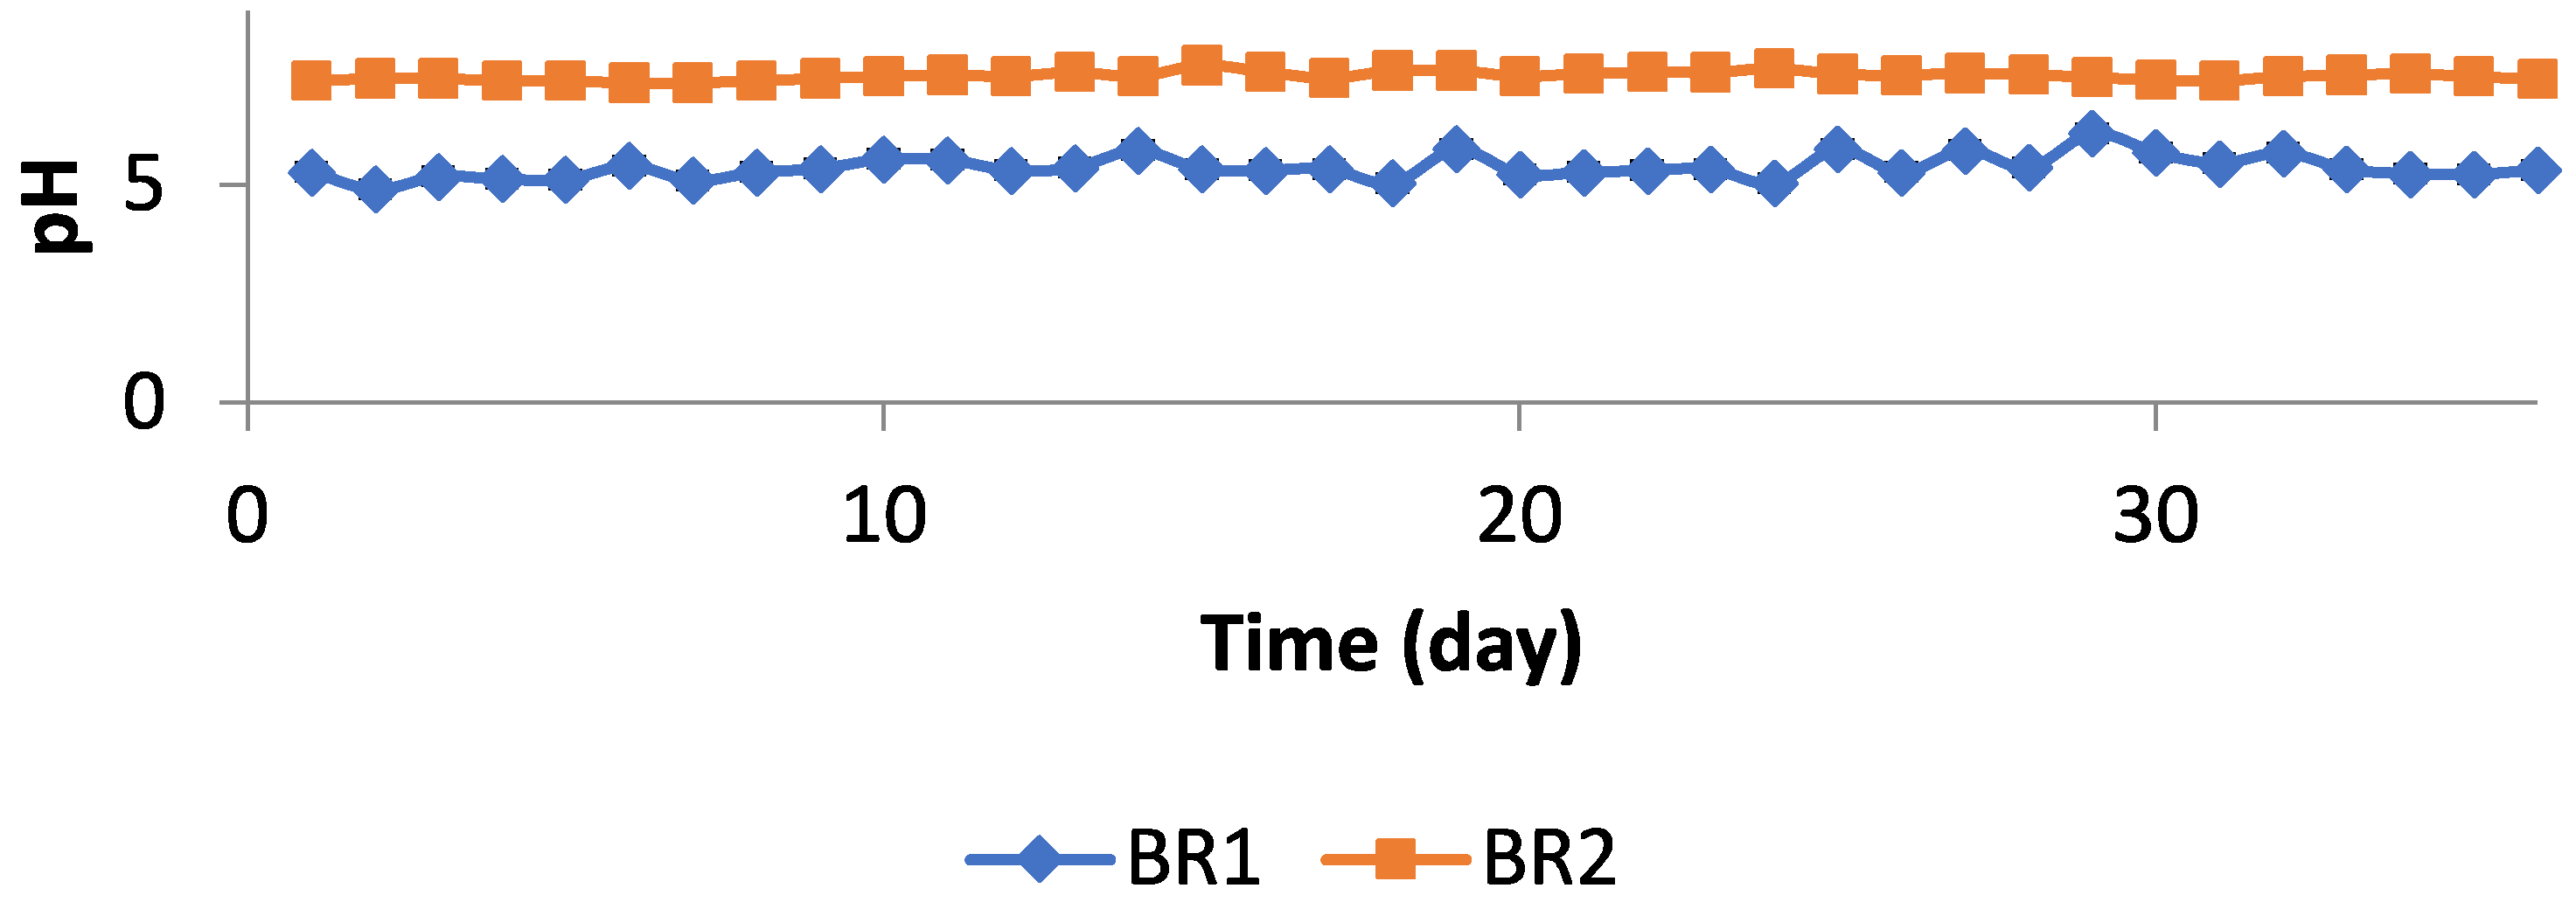
3.2. Experimental Studies in Pilot Scale Biogas Plant

Experimental studies of the TPAD of CSL in automatic and semi-automatic modes of the cascade system with simultaneous operation of both monitoring and control systems have been carried out. The supply of the feeding substrate from the tank at the inlet of BR1 with peristaltic pump P1 and the monitoring and control of BR1 is carried out hourly by the system built on LabVIEW. The withdrawal of culture medium from BR1 and its supply to BR2 is carried out with a peristaltic pump P2 and a connecting pipeline. This function, as well as the monitoring and control of BR2, was performed twice a day by the system built on the Beckhoff industrial controller. Draining of the culture medium from BR2 and leveling of the volumes is performed manually every 2–3 days. A mode of automatic regulation of biogas yields in BR2 was also tested with the help of an intermediate tank with pulse operation of the pump.
After long experiments separately with the two bioreactors (hydrogen BR1 with a working volume of 8 L; methane BR2 with a working volume of 80 L, i.e., the ratio is 1:10), it was switched to work as TPAD of CSL. Initially, the experimental work was conducted with an intermediate tank, i.e., a certain amount of culture fluid was drained from the hydrogen BR1 into an intermediate tank with a volume of 50 L, from which a certain amount was fed into the pilot BR2. In order to set up the two-phase system, this was carried out either manually or automatically. Then, a fully automatic mode of operation was initiated, where a certain amount of culture fluid from the hydrogen BR1 was fed directly into the methane BR2. Our literature studies show that this is the first automatic mode implemented in a two-phase AD system. Initially, 4 L of hydrogen BR1 is removed every day and 4 L of water (D = 0.4 day−1) with 200 mL of CSL is introduced, i.e., the concentration of the input solution S0i = 50 g/L, which is fed into the methane BR2, from which 4 L of culture fluid is taken out once a day. From the 22nd day of the experiment, the amount of culture medium to be removed is the same, but the concentration of CSL is twice lower (100 mL per 4 L of water, i.e., S0i = 25 g/L). In the first case, the organic load is 20 g/L day−1, and in the second is 10 g/L day−1.
As can be seen in Figure 7, Figure 8 and Figure 9, the biogas yields from the two bioreactors, as well as the content of biohydrogen and biomethane, are quite high. The pH change in BR1 and BR2 is shown in Figure 10. Biomethane yields are approximately 50% higher compared to a single-stage process with the same substrate (performed early). The fluctuations in the daily yields of the biogases from BR1 and BR2 are mainly due to technical issues. Irregularities in the evolution of biohydrogen are also due to fluctuations in pH in BR1, which sometimes go beyond the allowable range (Figure 10). The biodegradation process in BR2 proceeds at a slower rate compared to BR1, with smaller deviations in the content of methane and carbon dioxide in the resulting biogas.
The only larger deviation (around the 15th day) is due to technical malfunctions of the system.

3.3. Discussion

The pH in the hydrogen BR1 changes in both directions during the ongoing processes and its continuous adjustment is necessary. For industrial applications, sodium hydroxide and hydrochloric acid might be replaced (because of the high costs) by some industrial waste liquids. After a certain time for adjustments, the pH controller (supply of two normal sodium hydroxide and hydrochloric acid for corrections) performs relatively well and maintains it in the range of 4.9–5.6.
The pH in the methane BR2 is kept practically constant (7.3–7.7) despite the acidity of the substrate introduced by the hydrogen BR1, which could be explained by the buffer capacity of the medium in the methane BR2.
The yields of biohydrogen in BR1 from the cascade are variable and in the range from 0.7 to 1.0 dm3 of biogas from 1 L working volume of the bioreactor. The concentration of hydrogen in the biogas from the hydrogen BR1 varies greatly in the range of 14–34.7% volumetric.
The yields of biomethane in BR2 from the cascade are variable (depending on the incoming substrate from BR1) and vary in the range from 0.4 to 0.85 dm3 of biogas from 1 L working volume of the bioreactor. The concentration of methane in biogas from BR2 is high and remains practically constant (in the range of 65–69% volumetric).
H2S in BR1 exceeds 1000 ppm (this is the highest measurable value with our instrument) in all measurements, which is explained by the large amount of protein in CSL. H2S in BR2 exceeds 1000 ppm in almost all measurements, which shows that the protein is poorly absorbed in hydrogen BR1 and is in high concentrations in methane BR2.
CO2 in BR1 varies in the range of 21.8–60.6% volumetric, and in BR2—28–30% volumetric.
The total volatile fatty acids concentration in BR1 varies in the range 4.02–6.5 g/L, and in BR2—always below 1 g/L.
The concentration of cellulose in BR1 varies in the range of 0.163–0.484 g/L, and in BR2—in the range 0.972–2.9 g/L with a gradual decrease, which can be explained by the presence of residual cellulose from previous experiments with wheat straw.
The concentration of glucose in BR1 varies in the range 0.686–1.636 g/L, and in BR2–in the range 0.916–1.073 g/L.
The concentration of protein in BR1 varies in the range 0.33–3.2 g/L, and in BR2—in the range 0.696–3.88 g/L.
At a dilution rate D1 = 0.4 day−1 and a concentration of the inlet solution of 50 g/L (for BR1), respectively, a dilution rate D2 = 0.04 day−1 for BR2, the best results are obtained as follows: For BR1, the daily yield of biohydrogen is 0,74 dm3/L at a concentration of hydrogen in the biogas of 32.6% volumetric, pH = 5.25, concentration of TS = 8.85 g/L, concentration of VS = 5.1 g/L, concentrations of cellulose, glucose, and protein, respectively, 0.29 g/L, 0.97 g/L, and 1.64 g/L; For BR2, the daily yield of biomethane is 0.587 dm3/L at a methane concentration in biogas of 69% volumetric, pH = 7.56, TS concentration = 9.92 g/L, VS concentration = 5.0 g/L, concentrations of cellulose, glucose, and protein, respectively, 1.39 g/L, 1.01 g/L and 1.08 g/L.
At a dilution rate of D1 = 0.4 day−1 and a concentration of the effluent of 25 g/L (for BR1), respectively, a dilution rate of D2 = 0.05 day−1 for BR2 for the 30th day of the experiment, the following results are obtained: for BR1, the daily yield of biohydrogen is 0.319 dm3 of biogas from a 1 L working volume at a concentration of hydrogen in biogas of 5.35% volumetric, pH = 5.35; for BR2, the daily yield of biomethane is 0.392 dm3 of biogas from a 1 L working volume at a methane concentration in biogas of 68% volumetric, pH = 7.4. Biohydrogen yields are close to those presented in [13], where biohydrogen is obtained from a mixture of CSL and a type of grass (cassava). Biomethane yields are higher than those reported in [25], where biomethane is derived from poorer organic urban wastewater.

4. Energetical Considerations

To meet the increased demand for energy needs and to reduce greenhouse gas emissions, the capacity of worldwide installed renewable energy systems has doubled over the past decade [26]. This also applies to biogas as a source of renewable energy, where the number of biogas plants installed in Europe has increased from 6227 in 2009 to reach 18,202 by the end of 2018 [27]. The total produced electricity from biogas reached 88 TWh in 2017, 40% of which was generated in Germany [28]. Hence, Germany is a leading country in this field. Due to more than 9000 large-scale anaerobic digestion plants, biogas technology is making a significant contribution to the sustainable energy supply in Germany [29]. With a total of around 5901 MWel of installed electrical capacity (on-site electricity generation), electricity generated from biogas amounted to around 31.6 TWh in 2019 and thus accounts for over 58% of total electricity generation from biomass. In Germany, anaerobic digestion plants usually use renewable raw materials and animal excrements (manure and dung) to operate.
The presented above experimental results of the authors are summarized from an energetical point of view in Table 5.
Our experiments for TPAD of CSL are in the initial phase of technology development and were at low organic loads on both BRs.
Other representative results [4] for TPAD of organic wastes are presented in Table 6, where the operative conditions for the continuous tests, the specific hydrogen and methane production (mean value), the total energy harvest by TPAD, and the efficiency values are given.
The efficiency can be evaluated as:
η = Produced   energy   ( H 2 + CH 4 ) Initial   energy   embedded   in   the   substrate 100 %
Comparing Table 5 and Table 6, it may be concluded that our results for total energy production are close to those presented in [5].

5. Conclusions

Experimental studies of two-phase anaerobic biodegradation of corn extract—a waste product from corn grain processing for starch extraction—were performed with mesophilic temperatures in both bioreactors. The obtained data will be used for calibration of the developed early mathematical models [29,30].
For the first time, an automatic mode was implemented in continuous two-phase ABD with simultaneous production of hydrogen and methane using the developed computer system for monitoring and control. The best results for daily biogas yield were obtained at an organic load of 20 g/L for hydrogen-producing BR1, with a daily biohydrogen yield of 0.74 dm3/L at a hydrogen concentration in biogas of 32.6% volumetric, and the daily yield of biomethane is 0.587 dm3/L at a methane concentration in biogas of 69% volumetric. This means that the obtained energy is over 40% higher compared to the traditional single-stage CH4 production process. Biohythane obtained from TPAD (hydrogen + methane = hythane) is a biofuel used in vehicles [31,32].
Comparing TPAD with one-stage AD using different organic wastes, it was concluded that energy recovery was in the range of 9–19 MJ/kg VSadded; the overall energy was significantly higher (8–43%) for the TPAD than one-step AD in the large majority of the laboratory experimental conditions tested [4]. These preliminary results should evoke further research to better understand the conditions for achieving higher performance using TPAD.
The temperature-phased anaerobic digestion biogas plants are an interesting and promising concept [33]. In our future work, the influence of a thermophilic temperature in the first bioreactor will be studied.
A disadvantage is the need for additional purification from hydrogen sulphide (H2S) of both gases before obtaining electricity and/or heat.
Our results are a good base for the transition to industrial two-phase biogas plants for simultaneous production of biohydrogen and biomethane, which have not yet been well studied due to the complexity of this biotechnology.

Author Contributions

Conceptualization, E.C. and I.S.; methodology, I.S.; software, E.C.; validation, E.C., V.H., Y.G. and I.S.; formal analysis, V.H., Y.G. and I.S.; investigation, E.C., V.H. and I.S.; resources, E.C., V.H., Y.G. and I.S.; data curation, V.H. and Y.G.; writing—original draft preparation, E.C., V.H., Y.G. and I.S.; writing—review and editing, E.C., V.H. and I.S.; visualization, E.C. and I.S.; supervision, I.S.; project administration, E.C.; funding acquisition, E.C. All authors have read and agreed to the published version of the manuscript.

Funding

This research was funded by the Bulgarian National Science Fund, grant number KP-06-H46/4 “Experimental studies, modeling and optimal technologies for biodegradation of agricultural waste with hydrogen and methane production”.

Institutional Review Board Statement

Not applicable.

Informed Consent Statement

Not applicable.

Data Availability Statement

Not applicable.

Acknowledgments

The authors thank the plant ADM Razgrad EAD for the provided corn extract, used as a substrate in the present study.

Conflicts of Interest

The authors declare no conflict of interest.

References

  1. Deublein, D.; Steinhauser, A. Biogas from Waste and Renewable Resources; John Wiley & Sons: Weinheim, Germany, 2008. [Google Scholar]
  2. Buivydas, E.; Navickas, K.; Venslauskas, K.; Žalys, B.; Župerka, V.; Rubežius, M. Biogas Production Enhancement through Chicken Manure Co-Digestion with Pig Fat. Appl. Sci. 2022, 12, 4652. [Google Scholar] [CrossRef]
  3. Iglesias, R.; Muñoz, R.; Polanco, M.; Díaz, I.; Susmozas, A.; Moreno, A.D.; Guirado, M.; Carrerasand, N.; Ballesteros, M. Biogas from Anaerobic Digestion as an Energy Vector: CurrentUpgrading Development. Energies 2021, 14, 2742. [Google Scholar] [CrossRef]
  4. Ruggeri, B.; Tommasi, T.; Sanfilippo, S. BioH2&BioCH4 through Anaerobic Digestion (From Research to Full-Scale Applications); Springer: Berlin/Heidelberg, Germany, 2015; 215p. [Google Scholar]
  5. Gerardi, M.H. The Microbiology of Anaerobic Digesters; John Wiley & Sons Inc.: Hoboken, NJ, USA, 2003. [Google Scholar]
  6. Chandrasekhar, K.; Lee, Y.J.; Lee, D.W. Biohydrogen Production: Strategies to Improve Process Efficiency through Microbial Routes. Int. J. Mol. Sci. 2015, 16, 8266–8293. [Google Scholar] [CrossRef] [PubMed] [Green Version]
  7. Saady, N.M.C. Homoacetogenesis during hydrogen production by mixed cultures dark fermentation: Unresolved challenge. Int. J. Hydrogen Energy 2013, 38, 13172–13191. [Google Scholar] [CrossRef]
  8. Schievano, A.; Tenca, A.; Lonati, S.; Manzini, E.; Adani, F. Can two-stage instead one-stage anaerobic digestion really increase energy recovery from biomass? Appl. Energy 2014, 124, 335–342. [Google Scholar] [CrossRef]
  9. Xiao, K.; Maspolim, Y.; Zhou, Y.; Guo, C.; Ng, W.J. Effect of Sodium on Methanogens in a Two-Stage Anaerobic System. Appl. Sci. 2022, 12, 956. [Google Scholar] [CrossRef]
  10. Markphan, W.; Mamimin, C.; Suksong, W.; Prasertsan, P.; Sompong, O. Comparative assessment of single-stage and two-stage anaerobic digestion for biogas production from high moisture municipal solid waste. PeerJ 2020, 8, e9693. [Google Scholar] [CrossRef]
  11. Chatterjee, B.; Mazumder, D. Performance evaluation of three-stage AD for stabilization of fruit and vegetable waste. J. Indian Chem. Soc. 2018, 95, 65–80. [Google Scholar]
  12. Simeonov, I. Laboratory studies and mathematical modeling of the anaerobic digestion in a cascade of two bioreactors. Ecol. Eng. Environ. Prot. 2005, 2, 51–57. (In Bulgarian) [Google Scholar]
  13. Martinez-Burgos, W.J.; Sydney, E.B.; Rodrigues de Paula, D.; Medeirosa, A.B.P.; Cesar de Carvalho, J.; Molina, D.; Soccol, C.R. Hydrogen production by dark fermentation using a new low-cost culture medium composed of corn steep liquor and cassava processing water: Process optimization and scale-up. Bioresour. Technol. 2021, 320, 124370. [Google Scholar] [CrossRef]
  14. Zhang, W.; Xie, Q.; Rouse, J.D.; Qiao, S.; Furukawa, K. Treatment of high-strength corn steep liquor using cultivated Polyvinyl alcohol gelbeads in an anaerobic fluidized-bed reactor. J. Biosci. Bioeng. 2009, 107, 49–53. [Google Scholar] [CrossRef] [PubMed]
  15. Li, X.; Xu, W.; Yang, J.; Zhao, H.; Xin, H.; Zhang, Y. Effect of different levels of corn steep liquor addition on fermentation characteristics and aerobic stability of fresh rice straw silage. Anim. Nutr. 2016, 2, 345–350. [Google Scholar] [CrossRef] [PubMed]
  16. Miller, G.L. Use of dinitrosalicylic acid reagent for determination of reducing sugar. Anal. Chem. 1959, 31, 426–428. [Google Scholar] [CrossRef]
  17. Bradford, M.M. A rapid and sensitive method for the quantitation of microgram quantities of protein utilizing the principle of protein-dye binding. Anal. Biochem. 1976, 72, 248–254. [Google Scholar] [CrossRef]
  18. Updegraff, D.M. Semimicro determination of cellulose in biological materials. Anal. Biochem. 1969, 32, 420–424. [Google Scholar] [CrossRef]
  19. American Public Health Association (APHA). Standard Methods for Examination of Water and Waste Water, 23rd ed.; American Public Health Association (APHA): Washington, DC, USA, 2003. [Google Scholar]
  20. Simeonov, I.; Kalchev, B.; Mihaylova, S.; Hubenov, V.; Valevski, G.; Aleksandrov, A.; Georgiev, R. Pilot-scale biogas plant for research and development of new technologies. Ecol. Eng. Environ. Prot. 2012, 2, 63–71. (In Bulgarian) [Google Scholar]
  21. Simeonov, I.; Chorukova, E.; Diop, S.; Christov, N. Pilot scale biogas reactor with computer system for monitoring and control. In Proceedings of the Septième édition du Colloque Francophone en Energie, Environnement, Economie et Thermodynamique—COFRET’14, Paris, France, 23–25 April 2014; pp. 711–723. [Google Scholar]
  22. Simeonov, I.; Chorukova, E.; Akivanov, V.; Lakov, V.; Mihailova, S. Experimental pilot scale biogas plant with computer system for monitoring and control. In Proceedings of the International Conference Automatics and Informatics, Sofia, Bulgaria, 4–6 October 2017; pp. 239–242. [Google Scholar]
  23. Denchev, D.; Hubenov, V.; Simeonov, I.; Kabaivanova, L. Biohydrogen production from lignocellulosic waste with anaerobic bacteria. In Proceedings of the 4th International Conference on Water, Energy and Environment (ICWEE), Burgas, Bulgaria, 1–3 June 2016; pp. 7–12. [Google Scholar]
  24. Diop, S.; Chorukova, E.; Simeonov, I. Modeling and Specific Growth Rates Estimation of a Two-Stage Anaerobic Digestion Process for Hydrogen and Methane Production. IFAC PapersOnLine 2017, 50, 12641–12646. [Google Scholar] [CrossRef]
  25. Salomoni, C.; Caputo, A.; Bonoli, M.; Francioso, O.; Rodriguez-Estrada, M.T.; Palenzona, D. Enhanced methane production in a two-phase anaerobic digestion plant, after CO2 capture and addition to organic wastes. Bioresour. Technol. 2011, 102, 6443–6448. [Google Scholar] [CrossRef]
  26. Nsair, A.; Cinar, S.O.; Alassali, A.; Qdais, H.A.; Kuchta, K. Operational Parameters of Biogas Plants: A Review and Evaluation Study. Energies 2020, 13, 3761. [Google Scholar] [CrossRef]
  27. Sevillano, C.A.; Pesantes, A.A.; Carpio, E.P.; Martínez, E.J.; Gómez, X. Anaerobic Digestion for Producing Renewable Energy—The Evolution of This Technology in a New Uncertain Scenario. Entropy 2021, 23, 145. [Google Scholar] [CrossRef]
  28. Weinrich, S.; Nelles, M. Basics of Anaerobic Digestion—Biochemical Conversion and Process Modelling; DBFZ: Leipzig, Germany, 2021; Volume VIII, pp. 9–76. ISBN 978-3-946629-72-6. [Google Scholar]
  29. Chorukova, E.; Simeonov, I. Mathematical modeling of the anaerobic digestion in two-stage system with production of hydrogen and methane including three intermediate products. Int. J. Hydrogen Energy 2020, 45, 11550–11558. [Google Scholar] [CrossRef]
  30. Borisov, M.; Dimitrova, N.; Simeonov, I. Mathematical Modelling and Stability Analysis of a Two-phase Biosystem. Processes 2020, 8, 791. [Google Scholar] [CrossRef]
  31. Sompong, O.; Mamimin, C.; Prasertsan, P. Biohythane production from organic wastes by two-stage anaerobic fermentation technology. In Advances in Biofuels and Bioenergy; Intech Open: London, UK, 2018; p. 83. [Google Scholar]
  32. Liu, Z.; Si, B.; Li, J.; He, J.; Zhang, C.; Lu, Y.; Zhang, Y.; Xing, X.H. Bioprocess engineering for biohythane production from low-grade waste biomass: Technical challenges towards scale up. Curr. Opin. Biotechnol. 2018, 50, 25–31. [Google Scholar] [CrossRef] [PubMed]
  33. Cremonez, P.A.; Teleken, J.G.; Meier, T.R.W.; Alves, H.J. Two-Stage anaerobic digestion in agroindustrial waste treatment: A review. J. Environ. Manag. 2021, 281, 111854. [Google Scholar] [CrossRef]
Figure 1. Scheme of the experimental setup. (PP1—peristaltic pump for the influent of BR1; PP2—peristaltic pump for the effluent of BR1 and influent of BR2; PP3—peristaltic pump for the effluent of BR2; M1—electrical motor for stirring in BR1; M2—electrical motor for stirring in BR1; Sensors1—block for sensors for BR1 (t°, pH, H2, CO2, H2S); Sensors2—block for sensors for BR2 (t°, pH, CH4, CO2, H2S); F—flow rate of liquid; V1—working volume of BR1; V2—working volume of BR2; QH2—flow rate of biohydrogen; QCH4—flow rate of biomethane; C1—personal computer for BR1; C2—computer for BR2).
Applsci 12 06274 g001
Figure 2. Hydrogen producing BR1 with auxiliary equipment.
Applsci 12 06274 g002
Figure 3. General view of BR2, GH, and measuring board.
Applsci 12 06274 g003
Figure 4. Monitor showing the main measured and calculated values of processes in BR1.
Applsci 12 06274 g004
Figure 5. Daily biogas (biohydrogen) production (QH2) and volumetric content of H2 and CO2 in the biogas (%) from glucose in semi-continuous mode of operation.
Applsci 12 06274 g005
Figure 6. Dynamics in biogas production from two-phase anaerobic digestion with hydrogen (BR1) and methane (BR2) production.
Applsci 12 06274 g006
Figure 7. Biogas yields in BR1 and in BR2 in continuous mode of TPAD of CSL.
Applsci 12 06274 g007
Figure 8. Volume content of H2 and CO2 in the biogas from BR1 in the continuous mode of TPAD of CSL.
Applsci 12 06274 g008
Figure 9. Volumetric content of CH4 and CO2 in BR2 biogas in the continuous mode of TPAD of CSL.
Applsci 12 06274 g009
Figure 10. The profile of pH values for the biohydrogen (BR1) and biomethane (BR2) bioreactors during the continuous mode of TPAD of CSL).
Applsci 12 06274 g010
Table 1. Characteristics of CSL—104 (ADM Razgrad EAD).
LotpH *TS *, %VS *, %Proteins, g/LReducing Sugars, g/LCellulose, g/L
Amilum, 20104.250.59110.2 ± 0.5282.4 ± 10.12.46 ± 0.1
ADM, 20184.250.59148.0 ± 0.6110.0 ± 5.7N/A
* The data are provided by ADM Razgrad EAD in the accompanying information sheet to the raw material.
Table 2. Influence of the organic load and the process duration on the hydrogen content and the biogas yield.
Substrate and Organic Loading (g/L)Experiment Duration (day)Cumulative Biogas Yield from 1 L of Working Volume (dm3)Maximal Value of the H2 Content in the Biogas (%)
Glucose (2 g/L)31.42 ± 0.1042.3 ± 0.02
Glucose (6 g/L)31.05 ± 0.1446.7 ± 0.02
CSL (10 mL/L)30.39 ± 0.124.7 ± 0.21
CSL (15 mL/L)50.80 ± 0.1821.0 ± 0.05
Table 3. Batch and semi-continuous experiments with glucose and CSL.
Type of Process, Substrate and Organic Loading (g/L)Experiment Duration (Day)Cumulative Biogas Yield from 1 L of Working Volume (dm3)Maximal Value of the H2 Content in the Biogas (%)Maximal Value of the H2S (ppm)
Semi-continuous process; 4 g glucose (D = 0.1 day−1)166.769 ± 0.025.7 ± 0.114 ± 1
Batch process; 15 g glucose 41.719 ± 0.0817.1 ± 0.34N/A
Batch process; 18 mL CSL152.751 ± 0.055.9 ± 0.12705 ± 35
Batch process; 300 mL CSL104.428 ± 0.0314.5 ± 0.29>1000
Semi-continuous process; 50 mL CSL
(D = 0.1 day−1)
101.319 ± 0.114.2 ± 0.08>1000
Table 4. Daily biogas production and hydrogen content from two-phase anaerobic digestion with hydrogen (BR1) and methane (BR2) production.
DayQ1 (dm3/L Working Volume)H2
[%]
CO2
[%]
pH
(F1out)
Q2 (dm3/L Working Volume)
10.00N/AN/A5.360.00
20.4027.523.85.050.26
30.29N/AN/AN/A0.14
40.29N/AN/AN/A0.14
50.2938.63424.720.14
60.12N/AN/A4.530.14
70.0921.6537.614.520.18
80.04N/AN/A4.490.00
90.04N/AN/A4.370.45
100.02N/A36.05N/A0.00
110.02N/AN/A4.360.00
120.02N/AN/AN/A0.00
130.00N/AN/A4.320.01
140.00N/AN/A4.620.00
Table 5. Experimental results obtained during the TPAD continuous tests (γ = 0.1and S0i = 50 g/L).
Hydraulic retention time for H2 reactor (days)2.5
Dilution rate D1 (days−1)0.4
Hydraulic retention time for CH4 reactor (days)25
Dilution rate D2 (days−1)0.04
Hydrogen production (dm3 L−1day−1)0.241
Methane production (dm3 L−1day−1)0.405
Total energy production (kWh/day)0.005028
Table 6. Experimental conditions and results for the TPAD continuous tests (γ = 0.1).
Hydraulic retention time for H2 reactor (days)0.2511.5
Dilution rate D1 (days−1)410.667
Hydraulic retention time for CH4 reactor (days)2.51015
Dilution rate D2 (days−1)0.40.10.0667
Hydrogen production (NL L−1day−1)1.670.490.19
Methane production (NL L−1day−1)4.521.310.99
Total energy production (kWh/day)0.00049970.144720.108
Efficiency η (%)495663
Publisher’s Note: MDPI stays neutral with regard to jurisdictional claims in published maps and institutional affiliations.

