1. Introduction
Codonopsis is a genus of the Campanulaceae family that includes three species found in Korea:
Codonopsis lanceolata,
C. pilosula, and
C. ussuriensis. For hundreds of years, the fresh or dried roots of
Codonopsis spp. have been widely used in folk medicine to decrease blood pressure, appetite, and gastric ulcers, improve poor gastrointestinal function, strengthen the immune system, and so on [
1]. They exhibit anti-tumor, anti-obesity, antioxidant, antimicrobial, and antimutagenic activities, as well as cognitive-enhancing and neuroprotective effects [
2,
3,
4,
5]. Different origins of the plant result in variations in its chemical constituents. Chemical constituents isolated from the roots include alkaloids, phenylpropanoids, triterpenoids, polyacetylenes, flavones, organic acids, and polysaccharides [
6,
7]. The major pharmacologically active compounds in this genus are water-insoluble polyacetylenes, including lobetyolinin and lobetyolin, and water-soluble phenylpropanoids, such as tangshenoside I, II, and IV [
1,
8]. However, since
C. ussuriensis grows in a limited area, only a few studies have been conducted on its physicochemical composition and physiological activity. While
C. ussuriensis is a well-known source of triterpenoids, it is also known to contain phenylpropanoids, encouraging us to search for potential bacterial neuraminidase (BNA) inhibitors [
9].
Sialic acids constitute a family of nine-carbon acidic monosaccharides present at sugar chain ends in humans and other animals, and their most widespread form is
N-acetylneuraminic acid (Neu5Ac, NANA, and Sia) [
10,
11]. Neuraminidase (commonly referred to as sialidase, EC 3.2.1.18) hydrolyzes terminal sialic acids in oligosaccharides, glycoproteins, glycolipids, and mucins, among other substrates [
12,
13,
14]. Many viruses and pathogenic bacteria colonizing mucous surfaces contain enzymes that contribute to their pathogenicity and virulence. Pathogenic bacteria that secrete neuraminidases follow the scavenger pathway to liberate sialic acid from various host sialoglycoconjugates [
15]. Additionally, neuraminidase participates in bacterial cell metabolism, providing it with free sialic acids as an alternative carbon and energy source [
16,
17]. The enzyme enhances bacterial survival outside microorganisms, particularly in environments containing sialic acids [
18]. These enzymes have served as candidates for inhibition in the development of antimicrobials [
19,
20,
21].
In this study, we aimed to examine and characterize the major components of C. ussuriensis roots. We used bioactivity-guided fractionation to isolate potential BNA inhibitors from the roots of C. ussuriensis. By using spectroscopic methods, the compounds were identified and investigated for their capacity to reduce the activity of bacterial neuraminidase. Lineweave–Burk and Dixon plots were used to determine their inhibitory mechanisms. Additionally, the chemical compounds in the root extracts were identified using ultra-performance liquid chromatography–quadrupole–time-of-flight mass spectrometry (UPLC-Q-TOF/MS).
2. Materials and Methods
2.1. Chemical and Instruments
Thin-layer chromatography (TLC) experiments were conducted using solid phases of Kieselgel 60 F254 (Merck, Kenilworth, NJ, USA) and RP-18 F254 (Merck, Kenilworth, NJ, USA). Ultra-violet (UV) light from a Spectroline ENF-240 C/F from Spectronics Corp. in Melville, New York, USA, or 10% aqueous H2SO4 sprayed on the TLC plate and heated to detect spots were used. The Biotage Isolera One Spektra Flash Purification System with SNAP Ultra C18 (400, 120, and 30 g) and SNAP Ultra (25 and 10 g) prepacked cartridges was used for flash chromatography (FC) (Biotage, Uppsala, Sweden). FC was performed using manually packed Biotage SNAP dry-load cartridges and Sephadex LH-20 (MilliporeSigma, St. Louis, MO, USA) (340, 100, and 10 g scales). A Bruker 700 spectrometer was used to record the nuclear magnetic resonance (NMR) spectra (700 MHz; Bruker, Karlsruhe, Germany). A Waters Xevo G2-S series instrument (Waters Corp., Milford, MA, USA) was used for the UPLC-Q-TOF/MS analysis, with the negative ion mode selected. To collect the infrared (IR) spectra, we used a Perkin Elmer Spectrum One FT-IR spectrometer (Buckinghamshire, UK).
2.2. Plant Materials
C. ussuriensis roots were harvested from two-year-old plants grown at the National Institute of Horticultural Research’s experimental field in Korea during October 2021. A specimen (voucher number MPS006563) was deposited in the Korea Medicinal Resources Herbarium of the Herbal Science (NIHHS) and authenticated by an expert on plant taxonomy.
2.3. Extract Preparation and Fractionation
Roots of C. ussuriensis (60 g) were dried and powdered, and then extracts were produced using 70% v/v methanol (MeOH; 1.5 L × 3) for 24 h at room temperature. Under reduced pressure at 45 °C, the extracts were evaporated to produce 16.4 g of the extract after being filtered through filter paper. A FC system with a SNAP Ultra C18 cartridge (400 g, water: ACN, 95:5–0:100) was used to obtain 43 subfractions (F1–F43) from the EtOH extract (10 g). Using a SNAP Ultra C18 cartridge (120 g, water: MeOH, 85:15), six subfractions (F23a–F23f) were obtained from the original F23 (620 mg). Sephadex LH-20 and SNAP Ultra cartridges (25 g, CHCl3: MeOH: water, 90:10:1) were used to separate 76 mg of F23e into compound 1 (31 mg). Compound 2, along with three subfractions (F23b1–F23b3), was obtained from F23b (65 mg) using a SNAP Ultra C18 cartridge (30 g, water: MeOH, 50:50). Fraction F23b1 (39 mg) was subjected to numerous chromatographic isolations in order to yield 17 mg of compound 2 using FCS with manually packed Sephadex LH-20 (100 g scale 2, water: MeOH, 50:50) cartridges.
2.4. BNA Inhibition Assay
These compounds were tested for their ability to inhibit Clostridium perfringens neuraminidase (EC 3.2.1.18) using the following protocols and compared with quercetin, which served as a positive control. We performed an evaluation of all methods used previously [
22]. Tris buffer (pH 7.5) was added to 90 μL of the 4-methylumbelliferyl-a-D-N-acetyl-neuraminic acid (MU-Neu5Ac) substrate (0.1 mM) at room temperature, and the reaction was carried out. Next, neuraminidase (0.2 units/mL) and the sample solution (ten microliters each) were added to each well of a 96-well microplate (SPL Life Sciences, Pocheon, Korea). This mixture was captured using Spectra Max M3 at fluorescence emission specific wavelengths of 365 nm and 450 nm, respectively (Molecular Device, Sunnyvale, CA, USA). A concentration of 21.5 μM of the 50% inhibitory concentration (IC
50) of quercetin was employed as the positive control in this test method. The dose–response curve was used to calculate the IC
50 for neuraminidase’s enzymatic activity. For each assay, we ran it three times.
2.5. Enzyme Kinetic Assay and Progress Linear Determination
The kinetics of enzyme inhibition by the isolated compounds were contrasted with data obtained in the absence of an inhibitor using Lineweaver–Burk plots. For neuraminidase, the steady-state rates at various inhibitor doses and variable substrate concentrations were acquired in order to establish the kinetic parameters associated with its inhibitory mechanism. Secondary plots of the slopes of the straight lines or the vertical intercept (1/
V), respectively) vs. the concentration of inhibitors were used to determine the two constants,
KI or
KIS, for inhibitor binding with either free or enzyme–substrate complexes.
KI and
KIS are represented by Equations (2) and (4), respectively [
23]:
The kinetic parameters were obtained by increasing the substrate and inhibitor concentrations using the Lineweaver–Burk double-reciprocal plot and Dixon plot. A Dixon plot was used to calculate the inhibition constants (Ki). All the parameters were determined by constructing a Sigma plot (SPCC Inc., Chicago, IL, USA).
2.6. Identification of Chemical Constituents of C. ussuriensis
The Waters UPLC I-Class system (Waters Corp., Milford, MA, USA) with an ACQUITY HSS T3 column (2.1 × 100 mm, 1.7 µm) was used to perform UPLC. The mobile phase was composed of water (A) containing 0.1% formic acid (v/v) and 0.1% formic acid (v/v) in acetonitrile (B). From 0 to 1 min, 10% B was used; from 1 to 18 min, 10% B was used; from 18 to 22 min, 40% B was used; and from 22 to 22.5 min, 100% B was used as the elution gradient. The injection volume for each run was 2 L, and the flow rate was 0.4 mL/min.
For qualitative analysis, UPLC-Q-TOF-MS was performed on a Waters Xevo G2-XS.
A QTOF mass spectrometer equipped with a photodiode array (PDA) detector and electrospray interface (ESI) was used (Waters Corp., Milford, MA, USA). The mass spectrometer was run in the negative ionization mode, with the scan range set from 50 to 1800 m/z. The source temperature was 120 °C, the desolvation temperature was 600 °C, the desolvation gas flow was 800 L per hour, the cone gas flow was 50 L per hour, and the collision energy was 30 eV; these were the typical conditions for ionization. The typical ionization source conditions were as follows: capillary voltage of 2.5 kV for negative ion modes, cone voltage of 40 V, source temperature of 120 °C, desolvation temperature of 600 °C, desolvation gas flow of 800 L/h, cone gas flow of 50 L/Hr, and collision energy of 30 eV. The instrument was controlled using MssLynx v. 4.2. Data acquisition and analysis were performed using UNIFI software (v. 1.9.4; Water, UK). The 1 mg samples were dissolved in 1 mL of MeOH to produce 1 mg/mL working solutions, which were stored at 4 °C.
2.7. Data Processing and Statistical Analysis
Each experiment was performed in triplicate. The results were analyzed for variance using Sigma Plot version 14.0. (Systat Software, Inc., San Jose, CA, USA). Statistically significant differences were defined at p < 0.05.
3. Results and Discussion
A crude methanolic extract of the roots of
C. ussuriensis was tested for its inhibitory activity against bacterial neuraminidase. To assess the inhibitory potency of the extracts, they were subjected to column chromatography on octadecyl silica gel, followed by purification through repeated preparative high-performance liquid chromatography (Prp-HPLC) and gel filtration on Sephadex LH-20, yielding two phenylpropanoids. By comparing their spectroscopic data (
1H- and
13C-NMR, UV, LC-QTOF/MS) with their values in the literature [
9,
24], two phenylpropanoids were identified: ussurienoside I (compound
1) and tanshenoside I (compound
2).
Compound
1 was obtained as a colorless gum that, after spraying with 10% H
2SO
4 and heating, exhibited an olive–green color on TLC. High-resolution electrospray ionization MS revealed a molecular formula of C
42H
46O
20 from the pseudomolecular ion at
m/
z 515 [M−H]
−. The IR (
vmax 3368, 2938, 1716, 1586, and 1505 cm
−1) and UV (λ
max 220 and 267 nm) spectra showed hydroxyl, aromatic ring, carbonyl, and α,β-unsaturated absorption systems. The
1H- and
13C-NMR spectra (
Table S1) exhibited characteristic signals that could be attributed to a 1,3,4,5-tetrasubstituted benzene ring (one aromatic proton at one glucose moiety with
δH 6.78), two methoxyl groups (six proton singlets at
δH 3.88), a pair of olefinic signals at
δH 6.32 and
δH 6.58, a 3-hydroxy-3-methyl-glutarate moiety (two pairs of methylene signals at
δH 2.68 and 2.69, a methyl signal at
δH 1.41, one acid signal at
δC 171.0, and one ester carbonyl signal at
δC 173.6), and a sugar moiety (anomeric proton signals at
δH 4.90). The overall NMR characteristics suggested that compound
1 bore a phenylpropanoid backbone. Spin–spin couplings and chemical signals were evaluated with the aid of 1H–1H correlated spectroscopy, heteronuclear multiple quantum coherence, and heteronuclear multiple bond correlation experiments.
Table S1 reveals the presence of one
β-glucopyranosyl unit.
It was discovered that compound
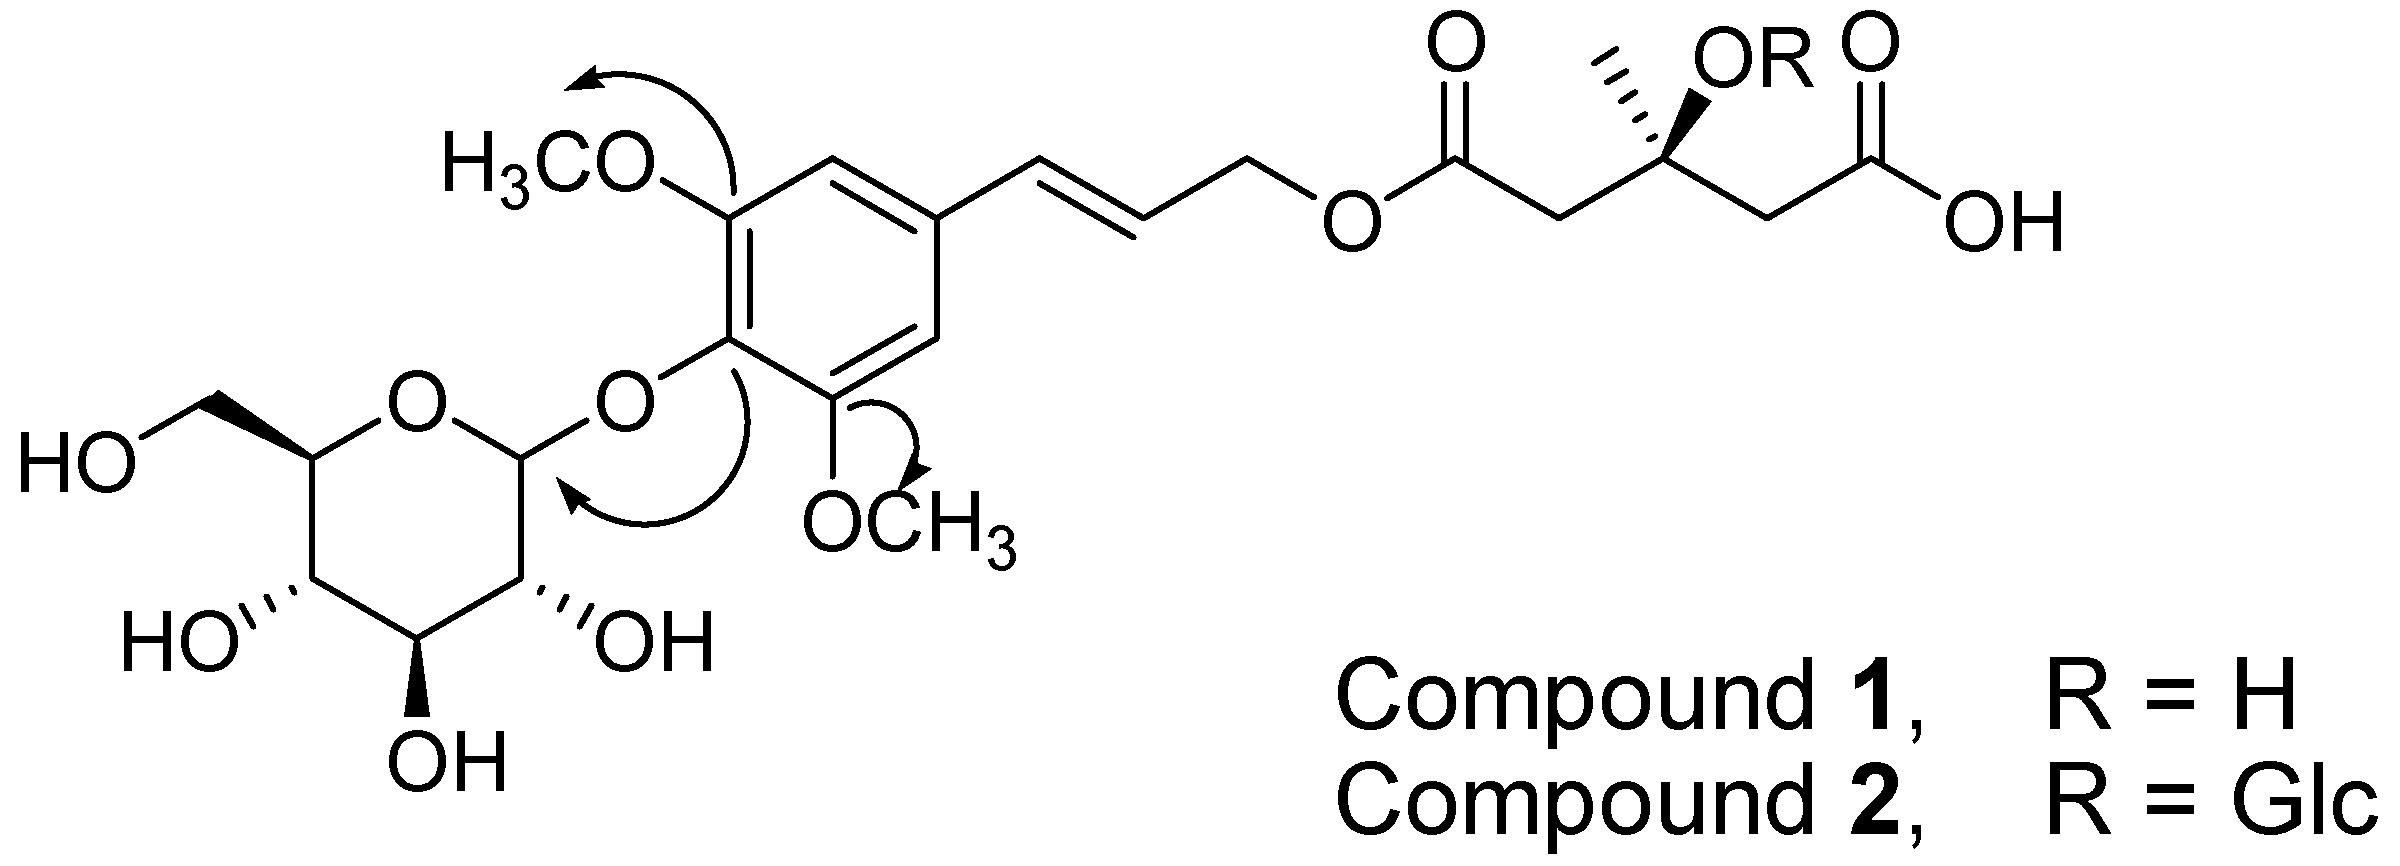
1 was a 3-hydroxy-3-methyl-glutarate ester of a phenylpropanoid glycoside. This structure is typical of a tangshenoside skeleton. A long-range correlation was observed in the gradient heteronuclear multiple bond correlation (gHMBC) spectrum between the anomeric proton signal (H 4.90 (H-1″)) and the oxygenated quaternary carbon signal of the aglycon (C 134.7 (C-4)), indicating that the glucopyranose was linked to the hydroxyl group at C-4 (
Figure 1). Furthermore, the association between the methoxy proton signal (H 3.88 (3,5-2OCH3)) and the oxygenated quaternary carbon signal (C 152.9 (C-3,5)) revealed that the methoxy group was associated with C-3,5 (
Figure 1). Accordingly, the structure of compound
1 was characterized as ussurienoside I.
The identification of compound
2 as tangshenoside I was based on comparisons of its NMR and MS data with those reported in the literature (
Figure 1) [
24]. The calculated purity of each compound was greater than 95%, as determined using HPLC analysis (
Figure 2).
The enzyme assay was based on a reported phenomenon in which the hydrolysis of MU-Neu5Ac is followed by an increase in fluorescence [
21]. As shown in
Figure 3a and
Table 1, compounds
1 and
2 exhibited significant dose-dependent neuraminidase inhibition, with IC
50 values of 56.0 μM and 203.3 μM, respectively. The IC
50 values suggested that compound
1 was four times more active than compound
2. The IC
50 of the positive control (quercetin) was 21.0 μM under the same conditions. The inhibition of neuraminidase by compound
1 is represented in
Figure 3b. When the initial velocity was plotted against the concentration of enzyme in the presence of varying concentrations of compound
1, a family of straight lines was obtained, all of which had their axes in the origin. The line gradients were reduced as the inhibitor concentration was increased, demonstrating that the chemical was a reversible inhibitor.
Our data reveal interesting facets in the structure–activity relationship of the compounds. Better inhibition was observed when a hydroxy group was present at C-3′. This could be seen by comparing C-3 hydroxy-substituted compound
1 (IC
50 = 56.0 μM) with the glucosyl analog of compound
2 (IC
50 = 203.3 μM). As shown in
Figure 3c,d, the inhibition kinetics analyzed using Dixon and Lineweaver–Burk plots showed that compound
1 (
Ki = 28.4 μM) was a mixed type-I inhibitor, because increasing the concentration of the substrate yielded a family of lines that intersected at a non-zero point on both the x- and y-axes (
Figure 3d). As a result of the mixed nature of the inhibition, the inhibitor had different degrees of affinity for the substrate-bound and free enzymes. Since the inhibitor could bind to either the free enzyme or the enzyme–substrate complex, we sought to separate the inhibition constants for these two states. Type-I inhibition occurred when the inhibitor was bound to the free enzyme, while type-II inhibition occurred when the inhibitor was bound to the enzyme–substrate complex. Both the free enzyme and the enzyme–substrate complex states are referred to as the enzymatic state. In order to conduct this analysis, the concentrations of the inhibitor and substrate were changed based on equations (2) through (4). The equilibrium constants for the two distinct binding events, inhibitor binding to the free enzyme (
KI), and inhibitor binding to the enzyme-substrate complex (
KIS), were determined using secondary plots of
Km/
Vmax and 1/
Vmax versus compound
1’s concentration, respectively. Thus, we established the following constants for compound
1:
KI = 27.79 μM and
KIS = 92.0 μM (
Figure 3 (insets)). These findings reveal that the inhibitor’s affinity for free enzymes was only slightly larger than its affinity for the enzyme–substrate complex. Accordingly, compound
1 was categorized as a type-I mixed inhibitor.
LC/Q-TOF/MS technology is useful for identifying the components of a plant extract. The chemical constituents of
C. ussuriensis roots extracted using 50% MeOH were identified using a LC/Q-TOF/MS method that we developed in the negative ion mode.
Figure 4 displays representative total ion chromatograms (TICs) with labeled peaks, indicating that an ion mode was used. Eight peaks were identified, including two for unknown compounds, as shown in
Table 2. Their chemical structures are detailed in
Supplementary Figure S8. Peak 1 (
m/
z 191.0198, C
6H
8O
7−) exhibited a fragmentation pattern of [M−H−CO
2]
− followed by [M−H−H
2O]
− in the negative ionization mode as a result of the elimination of the CO
2 group (−44 Da) and the H
2O molecule (−18 Da) from the deprotonated precursor ion (
Supplementary Figure S8). The compound was identified as citric acid (peak 1); the MS/MS spectrum was reported previously [
25]. Peak 2 (
m/
z 203.0827, C
11H
12N
2O
2−) initially produced an ion at
m/
z 159 due to CO
2 molecule loss (−44 Da), followed by a fragment ion at
m/
z 142 due to NH
3 and CO
2 molecule dissociation. The existence of the fragment ion at
m/
z 116, which was similar to indole’s molecular weight (116 g/mol), suggested that the chemical was tryptophan. Peak 3 was identified in the negative ionization mode as tangshenoside I (
m/
z 677 [M−H]
− and
m/
z 1355 [2M−H]
−, C
29H
42O
18− and C
58H
84O
36−). The precursor ion (M−H)
− produced fragments at
m/
z 497 [C
23H
29O
12]
−,
m/
z 261 [C
11H
17O
7]
−, and
m/
z 99 [C
5H
7O
2]
−, which are common fragmentation patterns of phenylpropanoid glycosides. Peak 5 showed molecular ions at
m/
z 515.1777 [M−H]
− and
m/
z 1030 [2M−H] in the negative ion mode, with the molecular formula C
22H
33O
55. Its MS
2 spectra exhibited ions at
m/
z 471.1 [M−H−CO
2]
−, 371 (C
5H
7O
2−), and 161 (C
6H
10O
5−). Based on the fragmentation information, peak 5 was tentatively identified as ussurienoside I. In the negative ion mode, peak 6 displayed a format adduct molecular ion [M+HCOO]
− at
m/
z 469.1355 and production at
m/
z 325.0,
m/
z 225.0, and 163.0. The detected diterpenoid trilactone was identified as ginkgolide B. For peak 8, adduct molecular ion
m/
z 441.1768 [C
44H
44O
44]
−, molecular ion
m/
z 395.1705 [M−H]
−, fragment ion
m/
z 305 [M−H−C
7H
6]
−, and
m/
z 179 [M−H-C
14H
16O
2]
− were observed in the negative ion mode. Peak 8 was tentatively characterized as lobetyolin.


 ,
, 


