1. Introduction
The use of solar photovoltaic technology (PV) has been widely promoted for power generation due to its free greenhouse gas (GHG) emission during operation, and its high cost competitiveness versus fossil fuel power plants [
1]. However, its use is limited by the discontinuity of production due to non-deterministic seasonal variations and complex predictability since it depends mainly on weather conditions. Therefore, a high level of penetration of this technology in distribution networks can negatively affect the quality and reliability of electric power service.
The high intermittency of the solar resource presents variations in time periods of hours, minutes, and even seconds. This dynamic behavior causes fluctuations in the power output of PV systems, which can be analyzed from several perspectives. A regulatory framework that defines the requirements for connecting PV plants to the grid, and the incorporation of energy storage systems at the point of common connection (PCC), can help to reduce VA- ratios at this node [
2].
From a regulatory point of view, several countries have established policies that limit the technical aspects of PV systems. These regulations define a range for the active power variation, also called the ramp rate [
3]. This ramp rate is the percentage of the nominal capacity of the PV plant in time intervals of minutes or seconds. For instance, the German Association of Energy and Water Industries (BDEW) sets a ramp rate of 1% of the nominal power per minute. The Romanian Energy Regulatory Agency (ANRE), the Federal Regulatory Commission of United States Energy (FERC), and the Puerto Rico Electric Power Authority (PREPA) consider a ramp equal to 10%/min of the nominal power of the PV plant [
4].
On the other hand, energy storage systems (ESS) can also contribute to managing and controlling the dynamic behavior of PV generation. With the increasing implementation of PV systems in distribution networks, there is a need for large-capacity ESS temporarily connected to the PCC as well. For instance, a study has developed an analysis of the impact of introducing both PV systems and electric vehicles in the Portuguese grid [
5]. The results indicate a remarkable decrease of the generated surplus energy due to the excellent match between the charging process and the PV production. Therefore, to ensure grid stability and large-scale dissemination of PV systems, a good management of the charging system of the battery bank of electric vehicles is necessary.
For this purpose, different techniques have been developed to control the electric vehicle charging to smooth PV variations. The most commonly used techniques to smooth the PV power output are the ramp-rate, moving average, and low pass filter techniques [
6]. There are also studies that allow for PV power output smoothing using moving window averaging techniques, which can be used in renewable generation to provide ancillary services for more than 15 min [
7].
In addition, there are studies based on the use of metaheuristics that allow for smoothing PV power variations by determining the optimal filtering times using battery storage systems (BES) [
8]; however, this type of technique may require high computational resources in implementation cases [
9].
Regarding the ramp-rate control, studies have been carried out using simple, symmetrical, exponential, and hierarchical moving average. Algorithms based on Kalman filters and lease square estimators, among others, are also used [
10]. Among these methods, the exponential moving average has been shown to require more battery capacitance, which is required for PV power to be delivered to the grid with minimal losses [
11].
The current study evaluates the dynamic behavior of PV solar energy generation under conditions of high variability of solar irradiation caused by the characteristic cloudiness of the mountainous region of the Andes. For this purpose, the application of a control strategy to reduce power fluctuations in the PCC is presented, also incorporating the ESS of the battery bank of electric vehicles. Thus, an analysis of the dynamic behavior of solar irradiation is carried out in an Andean city. As a result, an energy management system (EMS) is developed to reduce the variations of the output PV power, applying the algorithm proposed for the case study determining the changes of the power of the charging system of an electric vehicle, under instructions of the EMS. The main contributions of the article are as follows:
Use of the ramp-rate algorithm in scenarios of high variation of PV power.
A 14% reduction in the rate of change of PV power variation.
Application of ramp-rate control in EV charging.
Decrease in voltage in terminals on customer bars, in scenarios with high PV and EV penetration.
This study is an extension of the article “Charge management of electric vehicles from unwanted dynamics in solar photovoltaic generation” presented at the IV Ibero-American Congress of Smart Cities.
2. Power Photovoltaic Fluctuations
Photovoltaic (PV) systems use solar power as their primary resource for energy production. Their production capacity depends mainly on the variability of the incident solar radiation on the surface of the PV panels. Therefore, the output energy can reach values above or below the required power demand [
12]. The fluctuating behavior of the output power is related to weather conditions, especially to the density of the cloudiness between the panel surface and the sun [
13].
It is necessary to use maximum power point tracking (MPPT) techniques [
2] to optimize the energy supplied by the PV solar system. There are several MPPT algorithms, such as perturb and observe (P&O), incremental conductance (IC), fuzzy logic control (FLC), and fractional short circuit current (FSC), among others [
14]. Regardless of variations in weather conditions, these methods seek to extract the maximum energy from the PV array (PV module + DC/AC converter) [
2], In addition, these algorithms can reduce the variation of output energy, reducing the efficiency of the system, an aspect that compromises the profitability of the solar system.
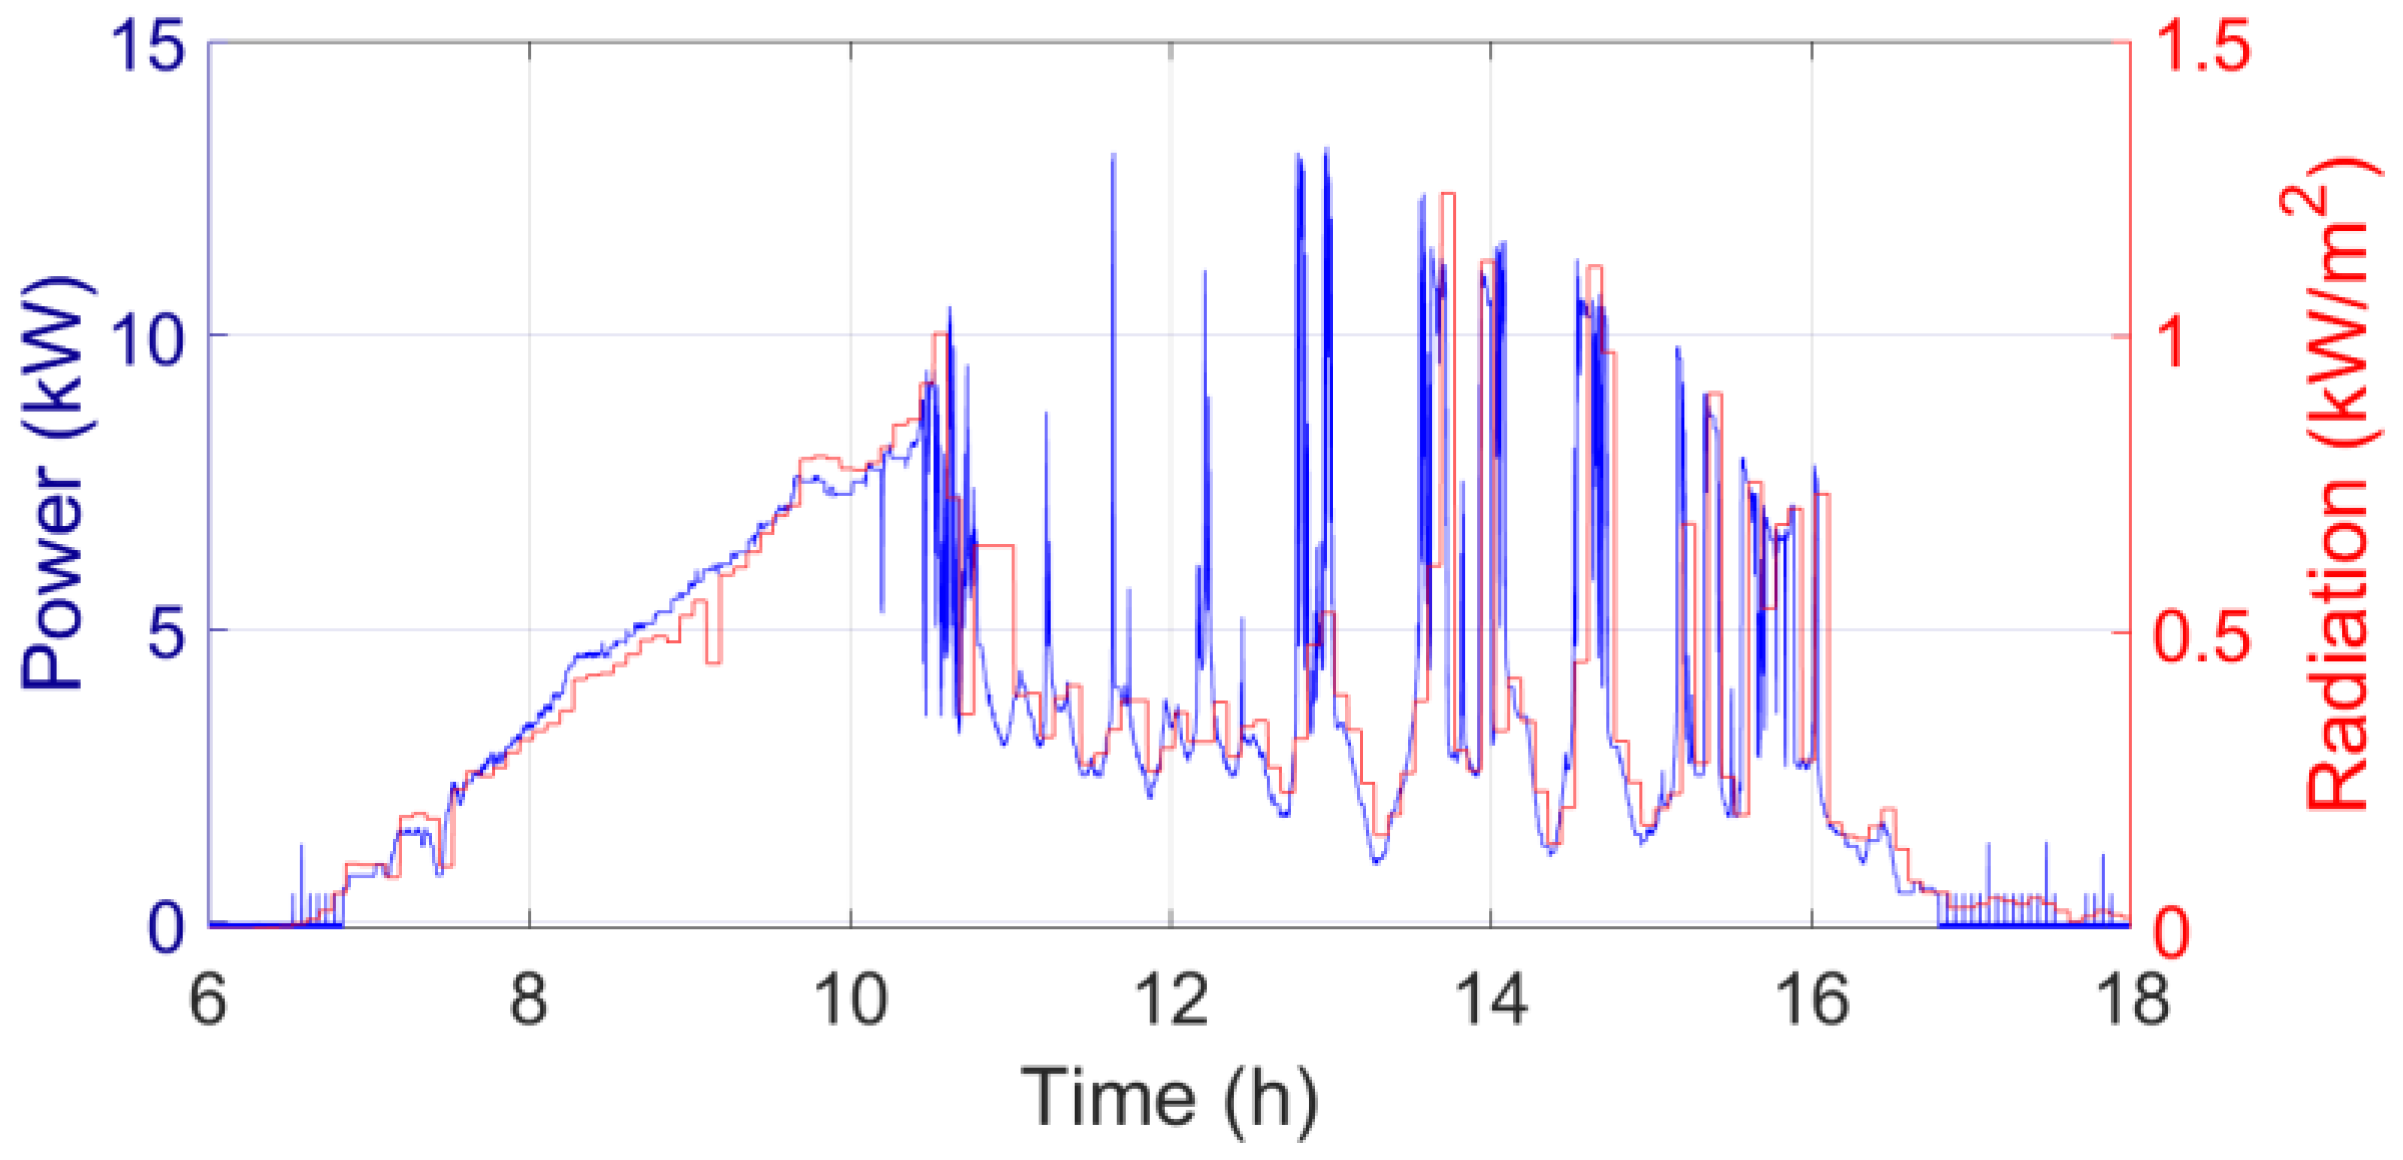
The dynamic behavior of solar radiation in the measurement area shows fluctuations with periods in the order of hours, minutes, or even seconds. These variations depend mainly on the cloud density, with an atypical behavior, as shown in
Figure 1. The data in the figure come from the meteorological station available at the microgrid laboratory of the University of Cuenca (Campus Balzay) [
15], which is located in the city of Cuenca-Ecuador, belonging to the mountainous region of the Andes at the coordinates 2°53′31.0″ S 79°02′18.7″ W.
The city of Cuenca presents the typical meteorological behavior of the Andean mountain regions with only two seasons. Between March and April and October and November is the rainy season, and June and July are the dry seasons. These particular conditions influence the behavior of solar irradiation and temperature [
2].
The study developed by [
2] presents an analysis of the dynamic behavior of solar radiation for this same Andean city, and the results showed that the PV power ramp-rate can reach between 50% and 70% of the nominal power of the system in intervals close to 15 s. This study evaluates the use of electrical-type storage systems with supercapacitors at the point of common coupling (PCC) to reduce the variations in PV power output. Using this technology, the decrease in the power ramp rate was nearly 6.66 times. Moreover, among other technologies of energy storage that could be used for this purpose include batteries, fuel cells, and recently, electric vehicle (EV) batteries [
6,
13,
16].
The energy storage system (ESS) of EV batteries contributes to the flexibility of the power system. This storage system helps to store excess electricity and provide ancillary services to the grid, such as frequency regulation, peak demand reduction, and improved operation and reserve capacity to secure the grid [
17]. From a technical point of view, the massive insertion of EVs plays an important role in the integration of PV solar power generation systems into existing distribution grids. It constitutes a feasible solution for the control and reduction of PV power fluctuations in the PCC. For instance, an evaluation found that the good process matching between EV charging and PV generation makes it possible to manage the surplus energy produced by this source [
17].
Despite the benefits of the high share of EVs in controlling PV power fluctuations, it can affect power quality and grid reliability. The EV charging process causes an increase in the load profile during peak hours, overloading of power system components, voltage deviations, harmonics, and system stability problems [
18].
3. Methodology
This section introduces the methodological approach and data sources that form the basis of this analysis. First, a brief description of the components of the energy management system (EMS) is presented. This system is used to test the control technique. Next, the power ramp-rate algorithm is presented.
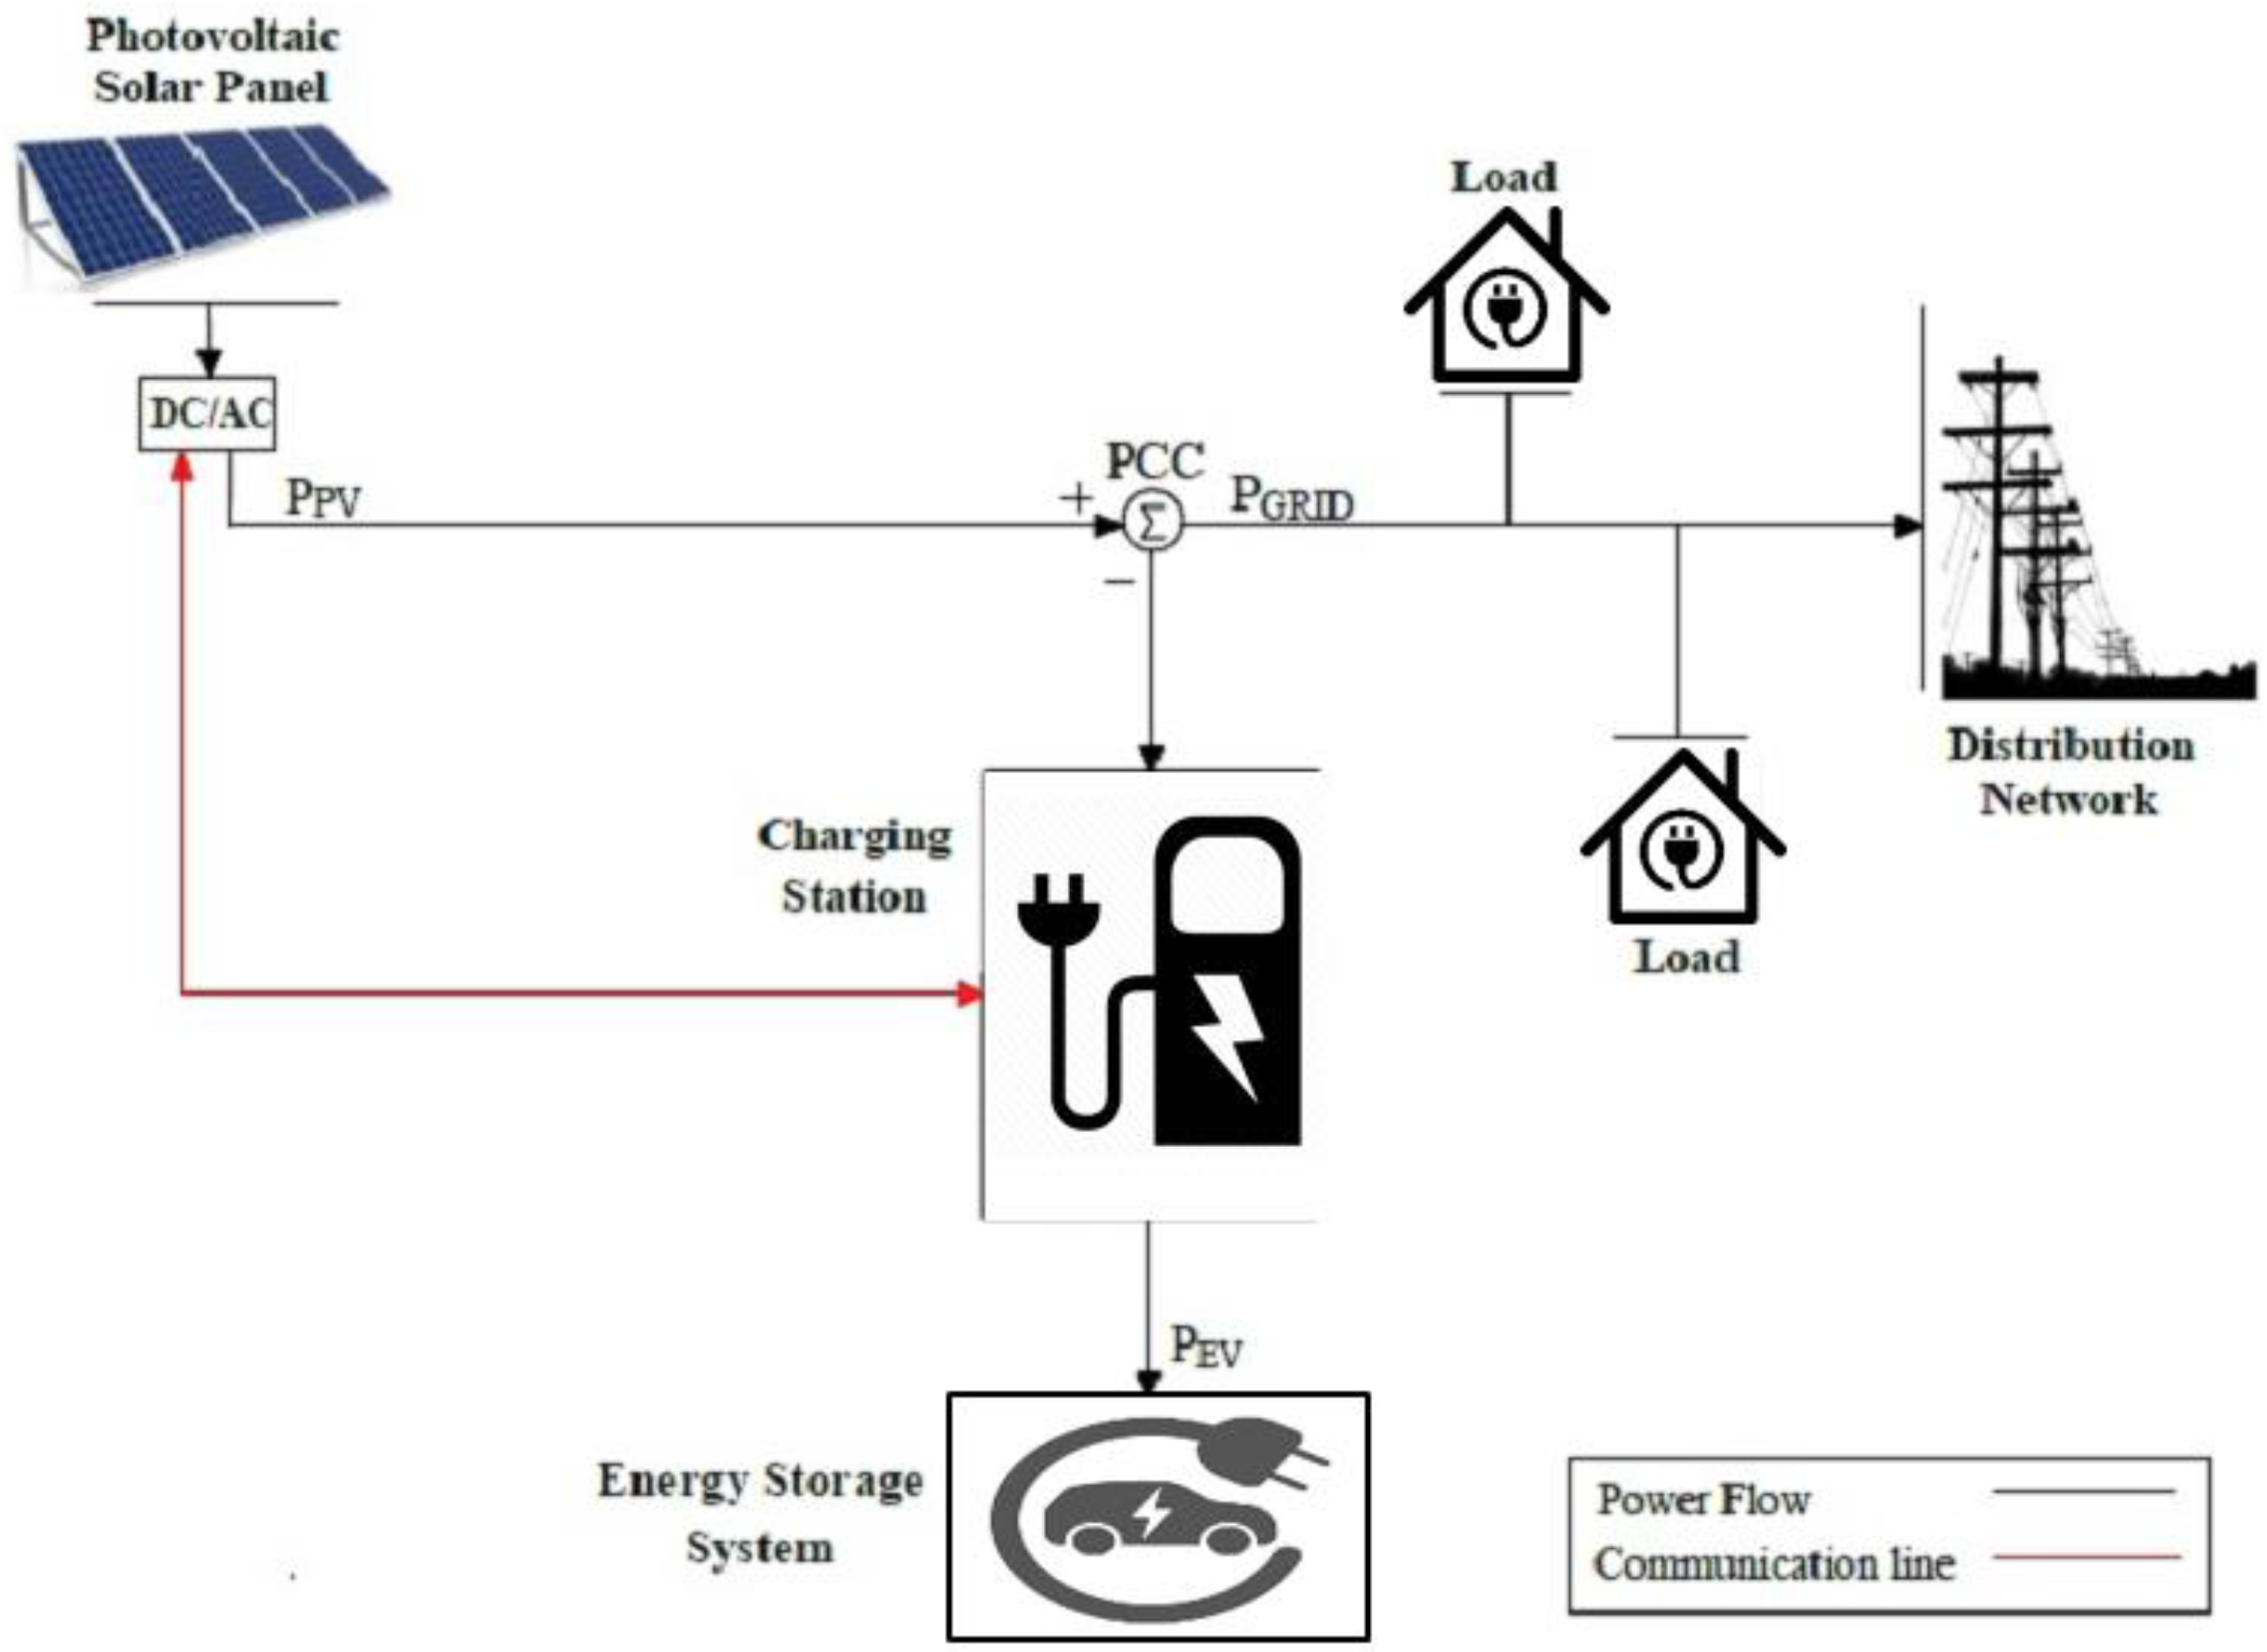
The starting point of the EMS in
Figure 2 corresponds to the database of the historical information of the PV solar power system, which is obtained from the records of the supervisory control and data acquisition (SCADA) system of the microgrid laboratory of the University of Cuenca [
15]. This PV system, also available in this laboratory, has four strings of 15 panels of the poly-Si type connected in series. Each one has a nominal power of 250 Wp, reaching a total of 15 kWp. The array is managed by a two-level three-phase DC/AC converter with Pulse Wide Modulation [
2]. The system is connected directly to the distribution grid and is operated by an MPPT algorithm.
The dynamic behavior of PV systems presents a wide range of power fluctuations over short periods. An increasing insertion of these systems can lead to instability in the grid [
1]. Therefore, the study applies the method of control of ramp-rate power and uses the storage system of the EV battery bank to manage these power fluctuations. According to the EMS diagram (
Figure 2), the charging system has the function of modifying the supply power to the batteries according to the dynamic behavior of the PV generation.
The range of the charging power variation (PEV) must be within the established limits, which come from the electrical characteristics of the vehicle model and what SAE J1772 norm states [
19]. The maximum P
EV follows the standard of the single-phase slow charge of some EV models. The minimum P
EV considers the power obtained with the lowest current level necessary to start the charging process. Hence, the variation range goes from 7.2 kW to 1.32 kW, due to the restrictions of the J1772 standard. Finally, 50% of the power range sets a reference level for this variation; for example, if an EV has a maximum charging power of 6.5 kW, the set power is 3.91 kW.
Changes in the PEV may not be immediately reflected in the EV battery system, as was the case in the study that developed some tests with two different models of EVs. The goal was to assess their battery system response time [
20]. With a 30% to 50% variation of the duty cycle, this system reacted in 2 and 0.68 s, respectively. Therefore, to observe the reaction of this parameter in the case of the study will take different values.
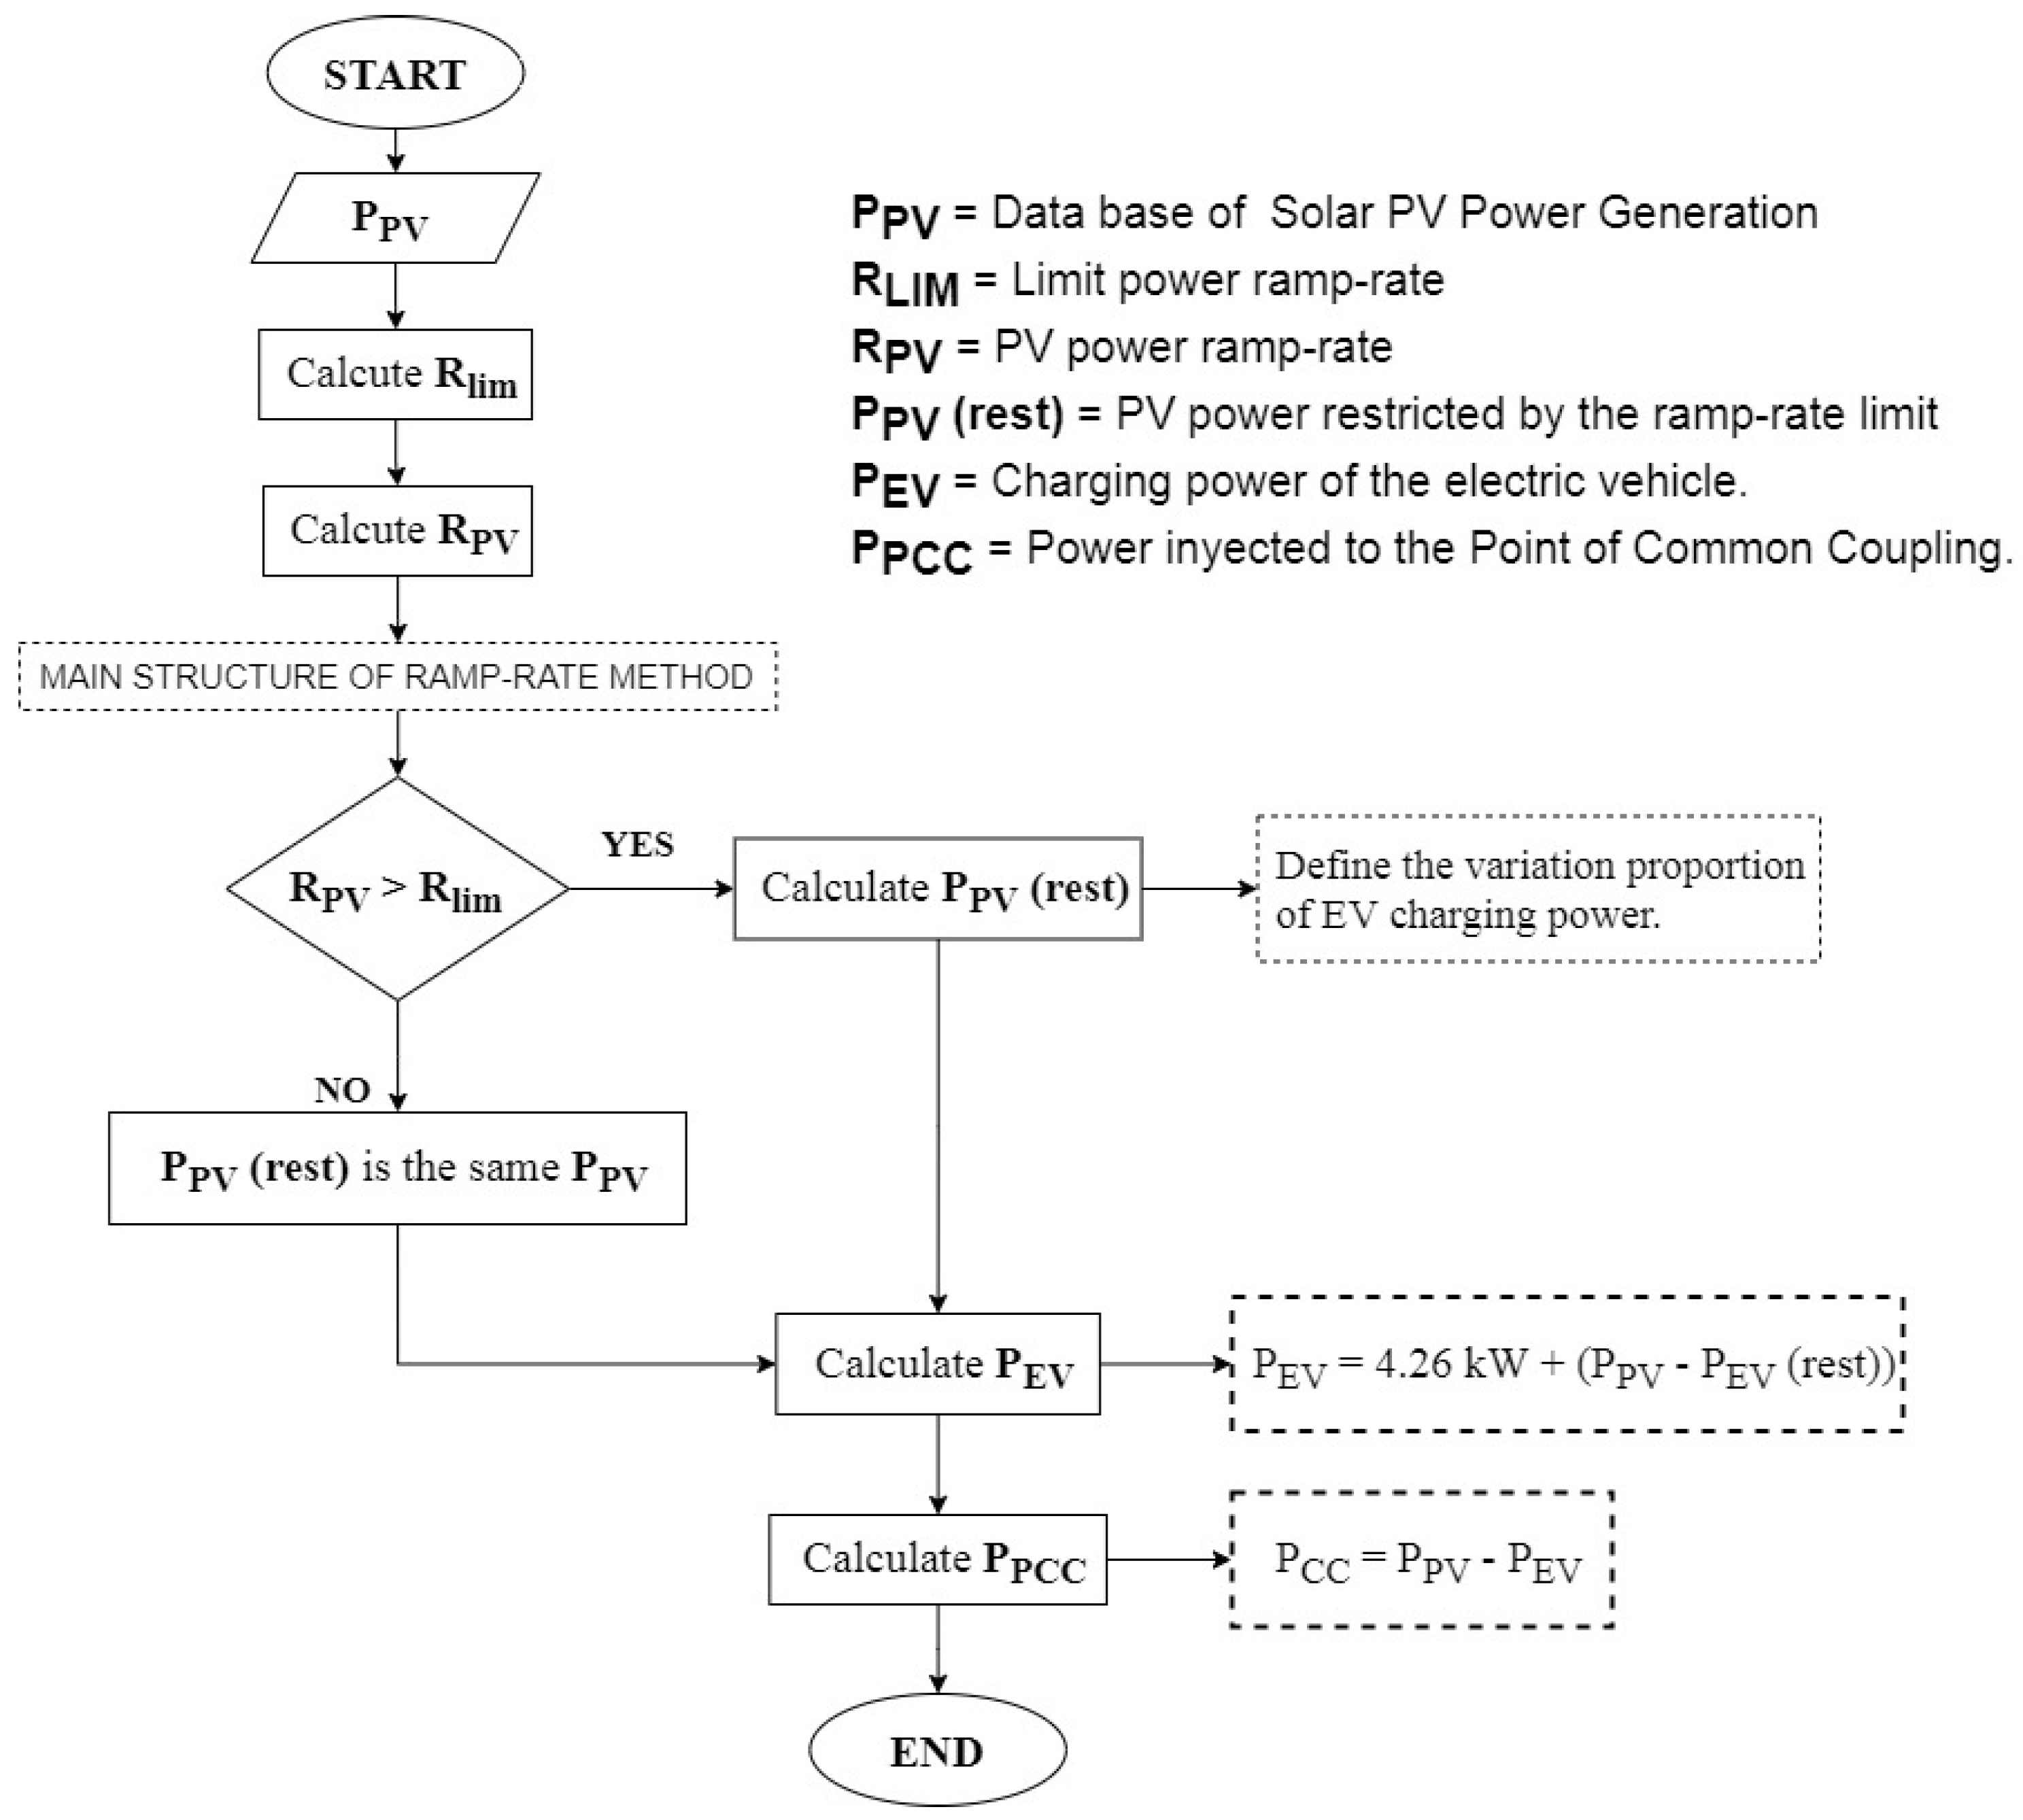
The method developed for the ramp-rate algorithm calculates the PV power ramp rate (Equation (1)) (R
PV) and constrains its value to the PV power ramp limit for this case study (Equation (2)) (R
LIM). The condition of R
LIM is to keep the active power variation below 10% of the nominal power per minute. This condition considers the regulations accepted by PREPA since the Republic of Ecuador has no statutes in this regard. The algorithm of ramp-rate control applied for the study is presented in
Figure 3.
In Equation (1), n represents the discrete sampling time. This paper considers a discrete sampling time of 1 s, which means that every second a value of PV power is read.
Following the operation process of the ramp-rate (RR) algorithm shown in
Figure 3, it starts by reading the PV output power. Then, it sets R
LIM. Therefore, according to Equation (2), with a solar generation capacity of 15 kWp, the maximum supported rate of change in this study reaches |RR| < 1.5 kW/min. The algorithm evaluates whether R
PV is greater or less than the desired limit to estimate the dynamic power fluctuations at the PCC. As a result of this evaluation, the P
EV may increase, decrease, or remain unchanged.
For the case where RPV > |RLIM| is satisfied, PEV changes the quantity given by the constrained PV power and follows the instantaneous behavior of the slope of the PV output. Conversely, if RPV is less than RLIM, then the charging power does not change. Finally, the PV power at the PCC comes from the difference between the PV output power and the EV charging power.
4. Results
4.1. Dynamic of Photovoltaic Power Generation
The presence of cloudiness between the panel surface and the sun is the most important factor in the dynamic behavior of PV generation. During the study period, PV power recorded an average variation of 0.52 ± 0.7 kW/min, with a coefficient of variation of 13.3%.
The study develops a probabilistic analysis of the daily data of the instantaneous variations of the PV system output power.
Figure 4 shows the data used, which correspond to September. The information indicates a high level of variability over the 30 days, with a mean variation of 7.20 kW/min, a standard deviation of 2.32 kW/min, and a coefficient of variation of 32.09%.
The highest average fluctuations were recorded on the 28th of September. This day presents a maximum and average rate of 8.95 kW/min and 67 W/min, respectively. Conversely, the day with the average profile of solar radiation is the 6th of September. This day records a maximum variation level of 9 kW/min, with a mean rate of 36 W/min.
Besides, the analysis determined that the dynamic behavior of PV generation presents a greater variability between 11:00 and 15:00, which corresponds to the times when the sun is at its highest altitude. In this time interval on the 28th, the ramp rate reaches values above 8 kW/min.
Figure 5 shows the behavior for these two days.
4.2. Energy Storage System
An assessment of the required number of EVs connected at the PCC to reduce instantaneous PV variations determined that a total of five charging stations are required near this node. The amount of power that the EMS must compensate for to reduce PV fluctuations is divided by the set of EVs connected. Therefore, the algorithm will designate the same level of charging power for each EMS.
The response of a single EV charging system to the dynamic behavior of the PV power generation is shown in
Figure 6. It is observed that the charging profile stays within the desired range. Two areas are marked in
Figure 6 to highlight the performance of the
ramp-rate algorithm. In section A, the charging system detects rapid changes in the PV output power above the desired limit. Hence, it starts to vary its charging power. In contrast, in section B, it is observed that the variation in PV generation grows slowly, and is almost constant; therefore, the change in the charging system power is small. For both scenarios, the charging power varies following the same direction of the power PV rate of change. In addition, the PEV tends to return to the charging reference point after each control action. The variation of PEV allows the EMS to ensure a PV power ramp rate of 25 W/s at the PCC.
In addition, the study also evaluates the case of having a single point of charge at the PCC. The results showed that the limits of the PEV prevent the EMS from completely restricting the PV power ramp rate. The charging system attempts to compensate for fluctuations but it saturates. The power ramp is larger than variation range of the system.
4.3. Photovoltaic Power Fluctuations
Figure 7a presents the rate of variation of the PV system power generation for the 28th of September (the most critical day), while
Figure 7b shows the behavior on the 6th of September (average day). These plots allow us to better interpret the performance of the algorithm under study. The PV fluctuations on the most critical day exceed the limit close to 10.3%, reaching a maximum variation of 8.98 kW/min. With the application of the control technique, considering the same time response for the EV charging system and the sampling time of the PV system, the power fluctuations decrease by 8.8%. The ramp then reaches a maximum of 1.53 kW/min. This result shows a favorable response of the EMS to the dynamic behavior of PV generation.
In the case of the average day, the PV generation shows a low level of power variations. The fluctuations over the limit ramp were 6.8%. The maximum rate reached 9.34 kW/min between 10:00 and 12:00. The power variations reduced by 4.8%, reaching a maximum ramp of 1.52 kW/min. This result indicates that this day will require less charge management from the EMS.
The relationships between the response time of the charging system, the reduction of PV fluctuations, and the number of EVs connected in the PCC are presented in
Figure 8. According to the trend observed in the graph, when the response time increases, the proportion of PV fluctuations greater than the ramp-rate limit also increases, but it is observed that the addition of charging stations in the PCC does not show a significant effect on the smoothness of these fluctuations. Therefore, for a response time of 1 and 2 s, the group of five charging stations achieved 97.23% and 96.53% reduction in the rate of change, respectively. The group of 10 charging stations achieved 97.1% and 96.53% reductions, respectively.
Figure 9 presents the final result of the mitigated PV fluctuations injected directly into the grid for both days. The power measured at the PCC demonstrates a significant reduction of the fluctuating dynamics of the PV generation. In
Figure 9a, two different areas are enlarged in which the softening effect of the ramp-rate control strategy can be better appreciated. It can be seen negative values of the power injected in the PCC, which indicate that the power flow at this node has been reversed. The PV generation is not sufficient to supply the charging demand of the group of EVs. Therefore, the missing power comes from the external energy sources connected to the PCC.
Moreover,
Figure 9b includes the rate of change of P
EV for the average day. As described above, the dynamics of the charging power follow the behavior of the PV generation.
5. Application Scenario in a Low-Voltage Network Feeder
To test the performance of the algorithm and its contribution to an electrical distribution network, a simulation was carried out in OpenDSS and Matlab of the IEEE European Low-Voltage Test Feeder case, analyzing two cases: (1) distributed photovoltaic generation and electric vehicles and (2) single PV and EV (see
Figure 10). EVs are modeled as 7.2 kW × 14 loads and PV systems have powers of 5 kW × 14 for case 1 and 70 kW × 1 for case 2. The values were selected for illustrative purposes and the simulation can be downloaded at
https://github.com/davilamds/EVRampControl (accessed on 31 May 2022).
By simulating the two cases indicated cases, the results of the power of the substation and the busbar voltages in the bars of the for customer 349 were obtained. Tests included the test of the base case (Base); test of the base case where EVs are connected without PV generation and without control (Only Evs); tests from case 1 of Evs connected to the system with photovoltaic generation and without the charge control algorithm (EV without control and PV case 1); and tests with connected Evs, PV generation, and control algorithm for both case 1 as for case 2.
The following scenarios were analyzed:
Base case;
Base case only with connected Evs, no PV generation and no control;
Case 1 (distributed EV and PV) without charge control;
Case 1 (distributed EV and PV) with charge control;
Case 2 (distributed EV and PV) with charge control.
The power of the substation was analyzed in the mentioned cases, where the effect of PV generation and Evs on the network was observed (see
Figure 11a). It is observed that the base power has its maximum in the case where only Evs are connected without the contribution of PV generation around 10:00, and that it reaches negative values that correspond to the fact that PV generation covers the system demand. For case 1, it is observed that the power generated by several PV systems allows for the power to be delivered by the substation to be the lowest of all scenarios, and in case 2, it is observed that the power delivered by the PV system is not enough to supply the demand, requiring the contribution of the main system.
Additionally, when reviewing the behavior of the voltage at the customer bus (see
Figure 11b), a similar behavior is observed, where the voltage at the terminals improves both in case 1 and case 2 with respect to the base case; however, for the case 2, the maximum voltages are lower.
Table 1 shows a summary of the results of the simulations. It is observed that the maximum power at the substation considering EVs and PV generation occurs in case 2 when the PV generation is located at a single point of the system, and the minimum power in case 1 where the generation is better distributed. Regarding the voltage at the customer terminals, case 2 has a better performance, having maximum and minimum voltages with less variation.


 ,
, 


