Article

Link Load Correlation-Based Blocking Performance Analysis for Tree-Type Data Center Networks

1
State Key Laboratory of Integrated Service Networks, Xidian University, Xi’an 710071, China
2
Guangzhou Institute of Technology, Xidian University, Guangzhou 510555, China
3
School of Software, Northwestern Polytechnical University, Xi’an 710071, China
*
Author to whom correspondence should be addressed.
Appl. Sci. 2022, 12(12), 6235; https://doi.org/10.3390/app12126235
Submission received: 20 April 2022 / Revised: 17 June 2022 / Accepted: 17 June 2022 / Published: 19 June 2022
(This article belongs to the Section Electrical, Electronics and Communications Engineering)

Abstract

:
With the explosive growth of cloud computing applications, the east-west traffic among servers has come to occupy the dominant proportion of the traffic in data center networks (DCNs). Cloud computing tasks need to be executed in a distributed manner on multiple servers, which exchange large amounts of intermediate data between the adjacent stages of each multi-stage task. Therefore, the congestion in DCNs can reduce the processing performance when conducting multi-stage tasks. To address this, the relationship between the blocking performance and the traffic load can be adopted as a theoretical basis for network planning and traffic engineering. In this paper, the traffic load correlation between edge links and aggregation links is considered, and an iterative blocking performance analysis method is proposed for two-layer tree-type DCNs. The simulation results show the good accuracy of the proposed method with respect to the theoretical results especially in the blocking rate range below 4% and with over-subscription ratio 1.5.

1. Introduction

Data centers are the critical infrastructure for cloud computing, where massive amounts of computing and storage servers are jointly managed and maintained. With the explosive growth of distributed cloud computing services, the east-west traffic resulting from frequent interactions among servers has exceeded the north-south traffic, thus occupying the largest traffic proportion in data center networks (DCNs) [1]. In typical cluster computing frameworks, such as MapReduce and Spark, one cloud computing task is typically decomposed into multiple computing stages, and servers must exchange a considerable amount of intermediate data between adjacent stages [2]. At present, the intermediate data’s transmission time accounts for 33–50% of the time required to complete cloud computing tasks [3]. As the time delay is a critical performance indicator for cloud computing services, the blocking of DCNs will directly impact server processing efficiency and, consequently, operators’ profits [4].
The goal of network operators is to reduce the network deployment cost on the premise of satisfying certain quality of service (QoS) indicators, such as blocking probability and delay. Operators can plan how many network resources should be deployed, according to the estimated traffic load and QoS requirements, or determine how much service load can be admitted according to the existing available network bandwidth. For example, cellular network operators determine the locations and frequency bands for base stations, on the basis of the statistical user distribution and acceptable blocking probability levels [5,6]. In the Infrastructure as a Service (IaaS) business model, traditional providers are decoupled into Infrastructure Providers (InPs) and Service Providers (SPs) [7]. InPs focus on deploying and maintaining network equipment, while SPs adopt virtualization technology, manage virtual machines, and configure virtual networks flexibly to meet the demands of cloud computing applications, in terms of computing and network resources. To improve their revenue-cost ratio while guaranteeing the QoS of applications at the same time, the SP should determine the allowable traffic load level and optimize the cloud computing task placements, according to the network configuration provided by the InP; meanwhile, the InP should design the network deployment and upgrade solutions on the basis of the traffic intensity provided by the SP. In this case, the relationship between the blocking performance and the traffic load acts as an important basis for network plan and task placement in cloud data centers.
In the beginning, blocking probability is defined as the statistical probability that a telephone connection cannot be established due to insufficient transmission resources in the network [8]. Later, blocking probability also applies to end-to-end connections or flows including a sequence of packets sharing the same five-tuple [9]. In the circuit switching networks or connection-oriented packet switching networks, a blocking means a call or connection cannot be established; while in the general connectionless mode transmission, if some packets are blocked, they may be temporarily stored in the buffer waiting for idle bandwidth or may be discarded if the buffer is full or timeout expires [10]. Thus, though there may be no actual blockings for the whole data flow, the blocking probability performance is also related to other QoS indicators such as delay and packet-loss ratio and can still act as an implicit network performance metric in packet switching networks.
Network blocking performance analysis can be traced back to computing the blocking probabilities of circuit switching networks. C. Y. Lee of the Bell Laboratories first considered analyzing the blocking rate of circuit switching networks with single-channel links [11]. Assuming that the loads of different links are independent, the blocking rate of a multi-stage circuit switching network can be obtained. Based on the link load independence assumption, the theoretical blocking rate obtained by Lee’s method is higher than that of the simulation result and, therefore, can be used as a conservative upper bound for the network blocking probability. N. Pippenger took into account the load correlation of the front and rear links in the crossbar circuit switching network, and derived the theoretical lower bound for the blocking probability [12]. E. Valdimarsson extended Lee’s and Pippenger’s blocking analysis models to multi-rate networks, such as asynchronous transfer mode (ATM) circuit switching networks and packet-switched networks [13], where the rate of each link can be continuous or discrete.
Besides multi-stage circuit switching networks, the blocking performance of optical switching networks has also been widely discussed. When full-wavelength converters are adopted, one transmission path may utilize different wavelengths in different links. Thus, an optical switching network can be treated as an equivalent multi-rate circuit switching network. On the basis of the link load independence assumption, the authors in [14] adopted the Erlang Fixed Point Approximation (EFPA) method to evaluate the blocking performance of optical switching networks with full-wavelength converters and static routing. In the EFPA method, the traffic at different links are considered to obey independent Poisson processes, the effective load on a link is equal to the effective accumulated loads from all of the connections passing through this link, and the blocking rates of links and connections are iteratively updated until convergence. In [14], the theoretical and simulation results of blocking probabilities have been separately compared in the star network, the ring network, and the mesh-torus network, where the theoretical and simulation results were found to match well, except for the ring network, due to the high load correlation between adjacent links in the ring network. Therefore, in this case, the link load independence assumption is not valid. The EFPA method has been widely used for blocking rate analysis in circuit switching and optical switching networks with general topologies [15,16,17,18,19]. In view of the high computational complexity of the EFPA method, E. Abramov et al. have proposed a simplified EFPA method, which is suitable for networks with large channel numbers in each link [20]. Besides theoretical analysis, the authors in [21] built a routing and spectrum assignment simulation framework to evaluate the blocking probabilities of existing spectrum assignment (SA) strategies under different network load conditions.
In addition to the link load independence assumption, some works have proposed blocking rate analysis methods based on the object independence assumption [22,23]. In the object independence assumption model, the correlation of links belonging to the same multi-hop connection is considered, and the individual free links and multi-hop connections are treated as independent objects. The object independence assumption-based analysis method was first proposed for the ring network, following which R.C. Almeida extended it to generic topologies, including linear, ring, tree, and mesh topologies [23]. Although the object independence assumption-based method can obtain higher approximation accuracy than that based on the link load independence assumption, it is only applicable to single-channel networks.
Compared with other networks, the DCN is characterized by topological symmetry and traffic aggregation. The over-subscription ratio of a DCN is defined as the ratio of the aggregated bandwidth demand from end servers to the aggregated capacity of core switch links [24]. The over-subscription ratio can be set to be more than one to reduce the numbers of aggregation switches and core switches, saving capital investment. With a high over-subscription ratio, the core layer links tend to be the bottleneck, and the aggregated traffic results in considerable load correlation among links in adjacent layers. The authors in [25,26] have analyzed the multi-cast blocking rates in fat-tree DCNs and proposed new multi-cast scheduling strategies to reduce blocking, based on the link load independence assumption. In [27], the blocking probabilities of different DCN architectures were compared through simulation and some congestion avoidance approaches were discussed, but a theoretical analysis was not carried out. Rahul et al. discussed how to minimize the occupied wavelengths by solving a optimization problem while obtaining the target blocking performance, with different wavelength converter distributions and buffer sizes [28]. The blocking performance analyses in [27,28] are all based on simulation rather than theoretical derivation. The authors in [10] gave the theoretical blocking performance of switches at different layers in optical data center networks, according to the Markov chain model. However, their analysis focused on the blocking at each switch’s ports rather than the blocking of a flow along the whole path.
In summary, there have been few works focused on the theoretical blocking performance of DCNs, and the conventional EFPA analysis method results in a relatively large approximation error, as the characteristics of DCNs are not taken into consideration. In this paper, a modified EFPA method is proposed for blocking performance analysis in tree-type DCNs, based on the traffic load correlation between edge links and aggregation links. The theoretical accuracy is verified by simulation. The proposed theoretical analysis method may act as the guideline for DCN configuration and traffic engineering.
The remainder of this paper is organized as follows. In Section 2, we introduce the system model. In Section 3, the proposed analysis method is introduced. The simulation results are presented in Section 4, and Section 5 concludes the paper.

2. System Model

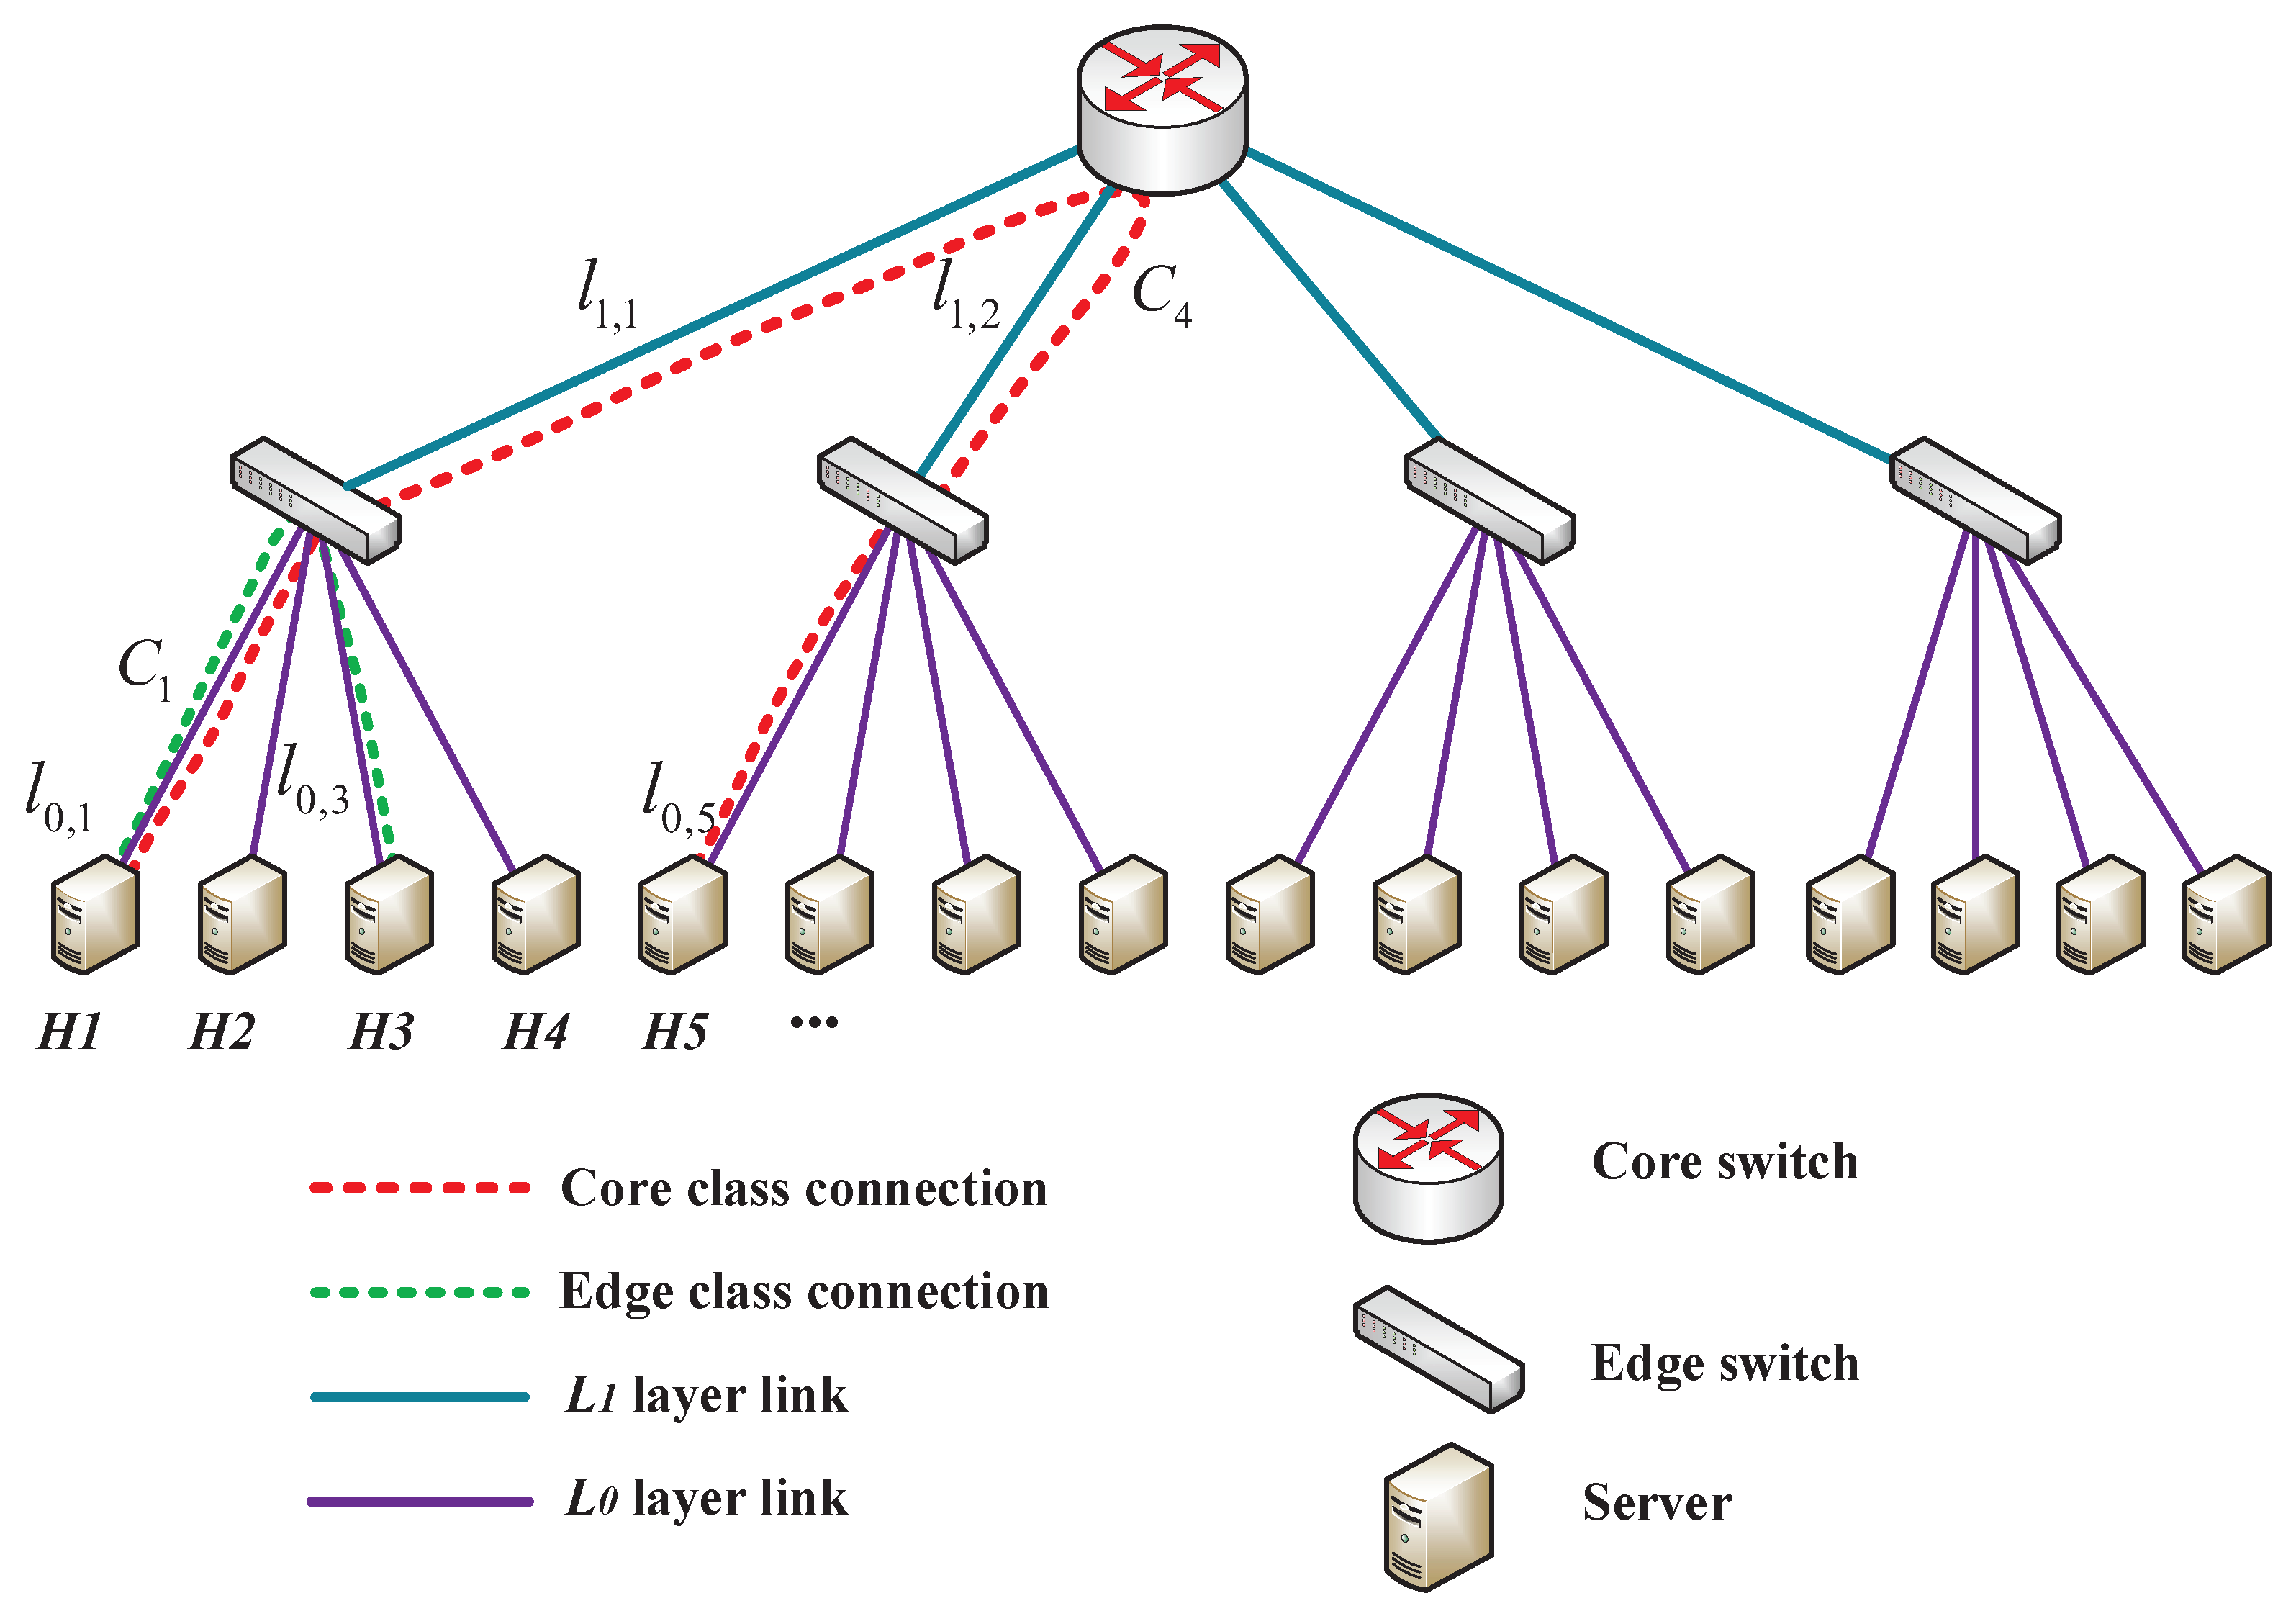
The switch-centric two-layer tree DCN architecture shown in Figure 1 is considered, where the tree factor is K, each core switch connects K edge switches, and each edge switch connects K physical servers. The total number of servers is N s = K 2 , and the servers are separately denoted by H 1 , H 2 , H N s . For simplicity, the edge links between edge switches and servers are called the L 0 layer links, while the aggregation links between the core and edge switches are called the L 1 layer links. The j-th L i layer link is denoted by l i , j . We assume that the L 0 and L 1 layer links separately contain M 0 and M 1 sub-channels, and the over-subscription ratio is F O S , i.e.,  M 1 = K M 0 / F O S . The logical sub-channels can be mapped to physical wavelengths/sub-carriers in optical networks [8] or time slots/cycles in time-deterministic IP networks [29].
In recent years, the spine-leaf network has become one of the most popular commercial DCN architectures. It is assumed that the core and edge switchers are aware of the link states and can determine the optimal link in the next hop. Therefore, ideal routing and load balancing can be achieved when an arrived connection chooses the path. In this case, the multiple spine/core switches can be treated as an equivalent large core switch, and all of the links from one leaf/edge switch to all spine switches can be seen as an equivalent aggregated link from the leaf switch to the large equivalent core switch. Thus, a spine-leaf DCN can be treated as an equivalent tree DCN, where the blocking rate of this tree DCN will be the lower bound for the original spine-leaf DCN. Due to the significant performance improvement of commercial switch products, a two-level spine-leaf DCN is capable of connecting tens of thousands of physical servers, which is sufficient for the networking requirements of most small- and medium-sized data centers.
In cloud data centers, each physical server can host multiple virtual machines (VM) or containers simultaneously, and end-to-end traffic transmissions may occur between VM or container pairs located in different physical servers. Assume that any two physical servers can generate multiple bi-directional end-to-end connections, and those connections between the same physical server pair are treated as having the same connection type. The DCN traffic matrix is the cumulation of all end-to-end connections. Each connection occupies one sub-channel, and different types of connections arrive independently. Assume that the i-th type connections are denoted by C i , they follow the Poisson process with arrival rate λ c , i , and their durations are exponentially distributed with mean 1 / μ c , i . Admission control is adopted, and an arriving connection will be accepted if all links in this connection’s path have at least one idle sub-channel. Otherwise, this new connection is blocked and discarded.

3. Blocking Performance Analysis for Tree-Type Data Center Networks

3.1. Network Blocking Probability Definition

According to [14], the blocking probability of the DCN is defined as the weighted sum blocking of all types of connections:
P n e t = i ρ c , i P c , i i ρ c , i = i P c , i r c , i ,
where ρ c , i = λ c , i / μ c , i and P c , i are the load and blocking probability of connections C i , respectively, and r c , i = ρ c , i i ρ c , i is the normalized arrival rate of C i , i.e., the ratio of the arrival rate of C i to the total arrival rate of all connections. In a two-layer tree DCN with tree factor K, N s physical servers are connected, and there are N = N s 2 connection types in total. The connections can be mainly classified into two main classes, according to whether they go through the core switch: one is the Edge Class (EC) connections, whose transmission path is composed of two L 0 layer links under the same edge switch; the other is the Core Class (CC) connections, whose path is composed of two L 0 layer links and two L 1 layer links. The EC and CC connections include N 1 = K K 2 and N 2 = N N 1 types of connections, respectively. We assume that the arrivals of all connection types are independently and identically distributed, (i.e., a uniform traffic distribution is considered) and, then, in the symmetric DCN, the connections of the same class have the same blocking rates. Thus, the blocking probability for the two-layer tree DCN with factor K can be simplified as
P n e t = P e c r e c + P c c r c c = P e c N 1 N + P c c N 2 N = P e c K + 1 + P c c K K + 1 ,
where r e c and r c c are separately the normalized total arrival rates of EC connections and CC connections, while P e c and P c c are the blocking probabilities of EC connections and CC connections, respectively.

3.2. Link Load Independence-Based Blocking Probability Performance Analysis

The blocking probability analysis methods based on link load independence assumption mainly include Lee’s method [11] and the EFPA method [14]. In Lee’s method, links in different stages of the crossbar network are assumed to be independent. The loads of adjacent links can be approximated as independently distributed, if most of the cumulative traffic on different links is aggregated from different connections. Thus, the blocking probability of connection C i can be directly approximated by
P c , i 1 l s C i 1 P l s ,
where l s C i represents the link l s which belongs to the path of connection C i , and  P l s is obtained according to the cumulative load on link l s . Lee’s method did not consider that the effective load of one link is not simply equal to the sum load from connections going through this link.
The classical EFPA method was founded on the flow conservation principle, where the effective flow in link l s is equal to the sum of effective flows from all connections going through link l s , denoted by
ρ l s 1 P l s = l s C i ρ c , i 1 P c , i ,
where ρ l s is the effective load on link l s , and  P l s is the blocking probability of link l s . Generally ρ c , i is known, while ρ l s is deduced from ρ c , i . The EFPA method also assumes that the effective loads on all links are independent and, therefore, the blocking probability of C i can be also approximated by (3). Thus, ρ l s , P l s , and  P c , i can be modified iteratively until convergence, and the final network blocking probability can be obtained.

3.3. Link Load Correlation-Based Blocking Probability Performance Analysis

As observed in [14], the EFPA method is not applicable to ring networks, as the loads of adjacent links are highly correlated. In the tree DCN shown in Figure 1, one L 1 layer link and K L 0 layer links, connected by the same edge switch, form a claw network. Under uniform traffic, each L 0 layer link carries N s 1 types of connection. Among them, K 1 types of connections occur locally and are distributed by the edge switch to the other K 1 L 0 layer links, while the other N s K types of connections will be transferred to the core switch and then distributed to the other edge switches. Therefore, in the local claw topology, most traffic in each L 0 layer link continues to pass through the following L 1 layer link, resulting in a relatively strong correlation between these two layer links. Taking this into consideration, we modified the EFPA method and revised the blocking probability calculation for CC connections, making it more applicable to tree DCNs. In the following subsection, the blocking rate calculation methods for EC connections and CC connections are provided, based on the link load correlation.

3.3.1. Blocking Probability for Edge Class Connections

In the tree DCN, all the L 0 layer links connecting to the same edge switch can be regarded as part of a star network, due to the symmetry of the traffic distribution. The link independence assumption still applies and, so, the EC connection loads in different L 0 layer links can be approximated by independent Poisson arrival distributions. The blocking probability of an L 0 layer link with effective load ρ L 0 can be obtained by using the Erlang B formula [14], given as
P L 0 = E B ρ L 0 , M 0 , M 0 = ρ L 0 M 0 / M 0 ! j = 0 M 0 ρ L 0 j / j ! .
Then, the blocking probability for EC connections is
P e c = 1 1 P L 0 2 .

3.3.2. Blocking Probabilities for Core Class Connections

Each CC connection includes two L 0 layer links and two L 1 layer links. Taking the C 4 connection in Figure 1 as an example, its path includes links l 0 , 1 , l 0 , 5 , l 1 , 1 , and l 1 , 2 . We divide the path of C 4 into two symmetric segments, one including l 0 , 1 and l 1 , 1 , and the other including l 0 , 5 and l 1 , 2 . Similarly, all L 1 layer links and the core switch form a star network, and the blocking rates of the two segments can be seen to be independent. When calculating the blocking segment of segment l 0 , 1 l 1 , 1 , which is denoted by P l 0 , 1 1 , 1 , we consider the load correlation between link l 0 , 1 and l 1 , 1 .
Define P l 0 , 1 1 , 1 as the probability that l 0 , 1 and l 1 , 1 are simultaneously fully occupied, which can be expressed by
P l 0 , 1 1 , 1 = P l 0 , 1 + P l 1 , 1 \ 0 , 1 ,
where P l 0 , 1 = E B ρ l 0 , 1 , M 0 , M 0 is the blocking probability of l 0 , 1 , and  P l 1 , 1 \ 0 , 1 is the probability that l 0 , 1 is not congested but l 1 , 1 is congested. Considering different possible connection numbers in l 0 , 1 , as well as the corresponding conditional blocking probabilities of l 1 , 1 , P l 1 , 1 \ 0 , 1 in the above equation can be rewritten as (8).
P l 1 , 1 \ 0 , 1 = i = 0 M 0 1 P l 1 , 1 congested | i connections in l 0 , 1 P i connections in l 0 , 1 = i = 0 M 0 1 P B ( i ) P A ( i )
The probability that l 0 , 1 is accommodating i connections can be represented by
P A ( i ) = E B ρ l 0 , 1 , M 0 , i ,
and the conditional probability that l 1 , 1 is blocked when l 0 , 1 is carrying i connections is denoted by P B ( i ) . In the two-layer tree DCN with tree factor K, l 0 , 1 hosts K 1 types of EC connections and N K types of CC connections. Therefore, if  l 0 , 1 is carrying i connections, the average number of CC connections among them is N K 1 P c c i K 1 1 P e c + N K 1 P c c . Those CC connections from l 0 , 1 will continue to occupy sub-channels at l 1 , 1 , and, thus, the average number of sub-channels available at l 1 , 1 is
N l 1 , 1 \ 0 , 1 i = M 1 N K 1 P c c i K 1 1 P e c + N K 1 P c c .
When l 1 , 1 is blocked, those N l 1 , 1 \ 0 , 1 i sub-channels will be fully occupied by the CC connections from L 0 layer links, except for l 0 , 1 , and their effective loads can be approximated by
ρ l 1 , 1 \ 0 , 1 = K K 1 2 ρ 0 1 P c c 1 P L 1 .
Thus, we have
P B ( i ) = E B ρ l 1 , 1 \ 0 , 1 , N l 1 , 1 \ 0 , 1 i , N l 1 , 1 \ 0 , 1 i ,
and thus the blocking probability of CC connections is
P c c = 1 ( 1 P l 0 , 1 \ 1 , 1 ) 2 = 1 1 E B ( ρ L 0 , M 0 , M 0 ) i = 0 M 0 1 P B ( i ) P A ( i ) 2 .
Based on the relationships among P e c , P c c , ρ l i , j , and  P l i , j , the network blocking probability P n e t can be determined iteratively. The detailed link load correlation (LLC)-based blocking performance analysis procedures for the two-layer tree-type DCN are shown in Algorithm 1. When a DCN topology and the load ρ 0 for each connection type is given, the effective loads and probabilities of L 0 and L 1 layer links are initialized and then updated during each iteration.
Algorithm 1: LLC-based Blocking Analysis Method.
1:
Initialization:
2:
Set n = 0 and initialize P n e t 0 = P c c 0 = P e c 0 = 0 , ρ L 0 0 = N 1 ρ 0 , ρ L 1 0 = N K ρ 0 , P L 0 0 = E B ρ L 0 0 , M 0 , M 0 , P L 1 0 = E B ρ L 1 0 , M 1 , M 1 .
3:
repeat
4:
     n n + 1 ,
5:
    update P e c ( n + 1 ) , ρ l 1 , 1 \ 0 , 1 ( n + 1 ) , P c c ( n + 1 ) , and P n e t ( n + 1 ) , according to (6), (11), (13), and (2), respectively;
6:
    update
7:
     ρ L 0 ( n + 1 ) = K 1 ρ 0 1 P e c n + N K ρ 0 1 P c c n 1 P L 0 n ,
8:
     ρ L 1 ( n + 1 ) = K N K ρ 0 1 P c c n 1 P L 1 n ,
9:
     P L 0 ( n + 1 ) = E B ρ L 0 n , M 0 , M 0 ,
10:
     P L 1 ( n + 1 ) = E B ρ L 1 n , M 1 , M 1 ;
11:
until  P n e t converges.

4. Simulation Results

We conducted Monte Carlo simulations to validate the performance of the proposed LLC-based network blocking analysis method. The simulation scenario is a symmetric two-layer tree DCN with tree factor K and over-subscription ratio F O S . A uniform traffic distribution was deployed, and the load of all connection types was ρ 0 . The blocking performance of four analysis methods were compared, including the Monte Carlo approach and three analytical approaches: Lee’s method [11], the classical EFPA method [14], and the proposed LLC-based method. Cases with different link capacities and over-subscription ratios were considered.
For cases with tree factor K = 4 and over-subscription ratio F O S = 1 , the simulated and analytical blocking rates under different sub-channel numbers are compared in Figure 2, Figure 3 and Figure 4, respectively. The curves of the EFPA and LLC-based methods both match well with the simulation curves, while the curves of the Lee’s method are always above them. When F O S = 1 , for each edge switch, the aggregated bandwidth of its L 0 layer links is equal to the bandwidth of its L 0 layer link. Thus, if one L 1 layer link of some CC connection is blocked, we can infer that at least one L 0 layer link of this CC connection must be blocked at the same time. In this case, we only need to consider the blockings in the edge links, and the load correlation between edge and core links is not necessarily considered. Therefore, for over-subscription ratio F O S = 1 , which is also called the fat-tree network case, the EFPA and LLC-based methods can both obtain satisfactory accuracy in blocking probability analysis.
For cases with tree factor K = 4 and over-subscription ratio F O S = 1.5 , the simulated and analytical blocking rates under different sub-channel numbers are compared in Figure 5, Figure 6 and Figure 7, respectively. As shown in these figures, the LLC-based method curve is closer to the simulation curve than both Lee’s method and the EFPA method. The LLC-based method curve agrees well with the simulation curve, especially in the blocking rate range below 4%. When the blocking rate is higher than 4%, the approximation errors of the LLC-based method and EFPA method both gradually increase with the traffic load and channel number. From the perspective of network deployment, blocking probabilities above 5% are generally unacceptable for users, and network operators should update the capacity or limit the subscribed users to reduce the network blocking rate. Therefore, the low blocking rate regime is much more important in blocking performance evaluations.
For cases with tree factor K = 4 and over-subscription ratio F O S = 2 , the simulated and analytical blocking rates under different sub-channel numbers are compared in Figure 8, Figure 9 and Figure 10, respectively. As shown in these figures, the LLC-based method curve is closer to the simulation curve than the other two in the blocking rate range of 1% to 4%. The EFPA method matches best with the simulation curve in the blocking rate range below 1%. For higher blocking rates, the curves of the LLC-based method and EFPA method gradually converge.
For cases with tree factor K = 5 , the simulated and analytical blocking rates under different over-subscription ratios and sub-channel numbers are compared in Figure 11 and Figure 12, respectively. Similar to the cases with K = 4 , the dominant blocking rate range of the LLC-based method is slightly different for F O S = 1.5 and F O S = 2 . With F O S = 1.5 , the LLC-based method curve matches best with the simulation curve especially in the blocking rate range below 4%; while the EFPA method still achieves the most accurate blocking rate in the range below 1% with F O S = 2 . Therefore, it can be concluded that, after the load correlation between adjacent layer links is taken into consideration, the network blocking rate analysis accuracy can be improved in a two-layer tree-type DCN through use of the proposed method, especially with over-subscription ratio 1.5.

5. Conclusions

In this paper, an improved blocking performance analysis method was proposed for a tree-type DCN. The load correlation relationship between adjacent links in different layers was considered, and the iterative LLC-based analysis method was described. The simulation results confirmed the validity of the proposed LLC-based method, especially in the low blocking rate range below 4% and with over-subscription ratio 1.5. In the future, we will continue to improve the accuracy and applicability of the LLC-based blocking analysis method in more complicated DCN scenarios and a wider blocking rate range, such as trying to adopt a multi-dimensional Markov chain model to more accurately analyze the influence of load correlation between adjacent links.

Author Contributions

Conceptualization and methodology, L.S.; formal analysis, validation, and writing—original draft preparation, L.Q.; validation and writing—review and editing, L.W. All authors have read and agreed to the published version of the manuscript.

Funding

This work was supported by the National Natural Science Foundation of China (61901388) and the Guangdong Basic and Applied Basic Research Foundation (2020A1515110757).

Institutional Review Board Statement

Not applicable.

Informed Consent Statement

Not applicable.

Data Availability Statement

Not applicable.

Acknowledgments

The authors would like to thank the Editor-in-Chief and anonymous Reviewers for their valuable reviews.

Conflicts of Interest

The authors declare no conflict of interest.

References

  1. Chandrasekaran, S.S. Understanding Traffic Characteristics in a Server to Server Data Center Network; Rochester Institute of Technology: Rochester, NY, USA, 2017. [Google Scholar]
  2. Dean, J.; Ghemawat, S. MapReduce: Simplified Data Processing on Large Clusters. Commun. ACM 2008, 51, 107–113. [Google Scholar] [CrossRef]
  3. Chowdhury, M.; Zaharia, M.; Ma, J. Managing Data Transfers in Computer Clusters with Orchestra. ACM SIGCOMM Comput. Commun. Rev. 2011, 41, 98–109. [Google Scholar] [CrossRef]
  4. Bozkurt, I.; Aguirre, A.; Chandrasekaran, B. Why is the Internet so Slow? Int. Conf. Passiv. Act. Netw. Meas. 2017, 10176, 173–187. [Google Scholar] [CrossRef]
  5. Alahmadi, A.; Liang, Y.; Tian, R.; Ren, J.; Li, T. Blocking Probability Analysis for Relay-Assisted OFDMA Networks using Stochastic Geometry. In Proceedings of the 2019 International Conference on Computing, Networking and Communications (ICNC), Honolulu, HI, USA, 18–21 February 2019; pp. 509–514. [Google Scholar] [CrossRef]
  6. Adamuz-Hinojosa, O.; Ameigeiras, P.; Muñoz, P.; Lopez-Soler, J.M. Analytical Model for the UE Blocking Probability in an OFDMA Cell providing GBR Slices. In Proceedings of the 2021 IEEE Wireless Communications and Networking Conference (WCNC), Nanjing, China, 29 March–1 April 2021; pp. 1–7. [Google Scholar] [CrossRef]
  7. Fischer, A.; Botero, J.F.; Beck, M.T.; de Meer, H.; Hesselbach, X. Virtual Network Embedding: A Survey. IEEE Commun. Surv. Tutor. 2013, 15, 1888–1906. [Google Scholar] [CrossRef]
  8. Saini, H.S.; Wason, A. Optimization of blocking probability in all-optical network. Optik 2016, 127, 8678–8684. [Google Scholar] [CrossRef]
  9. Claffy, K.; Braun, H.W.; Polyzos, G. A parameterizable methodology for Internet traffic flow profiling. IEEE J. Sel. Areas Commun. 1995, 13, 1481–1494. [Google Scholar] [CrossRef]
  10. Singh, A.; Tiwari, A.K.; Pathak, V.K.; Bhattacharya, P. Blocking performance of optically switched data networks. J. Opt. Commun. 2021. [Google Scholar] [CrossRef]
  11. Lee, C.Y. Analysis of switching networks. Bell Syst. Tech. J. 1955, 34, 1287–1315. [Google Scholar] [CrossRef]
  12. Pippenger, N. On Crossbar Switching Networks. IEEE Trans. Commun. 1975, 23, 646–659. [Google Scholar] [CrossRef]
  13. Valdimarsson, E. Blocking in multirate interconnection networks. IEEE Trans. Commun. 1994, 42, 2028–2035. [Google Scholar] [CrossRef]
  14. Kovacevic, M.; Acampora, A. Benefits of wavelength translation in all-optical clear-channel networks. IEEE J. Sel. Areas Commun. 1996, 14, 868–880. [Google Scholar] [CrossRef]
  15. Chung, S.-P.; Kashper, A.; Ross, K.W. Computing approximate blocking probabilities for large loss networks with state-dependent routing. IEEE/ACM Trans. Netw. 1993, 1, 105–115. [Google Scholar] [CrossRef]
  16. Birman, A. Computing approximate blocking probabilities for a class of all-optical networks. IEEE J. Sel. Areas Commun. 1996, 14, 852–857. [Google Scholar] [CrossRef] [Green Version]
  17. Rajalakshmi, P.; Jhunjhunwala, A. An Analytical Model for Wavelength-Convertible Optical Networks. In Proceedings of the 2007 IEEE International Conference on Communications, Glasgow, UK, 24–28 June 2007; pp. 2318–2323. [Google Scholar] [CrossRef]
  18. Röck, F.; Vardakas, J.S.; Moscholios, I.D.; Logothetis, M.D.; Leitgeb, E. A Simple Analytical Model for the Calculation of Packet Blocking Probability in an Optical Packet Switching Netw. In Proceedings of the 2010 14th Panhellenic Conference on Informatics, Tripoli, Greece, 10–12 September 2010; pp. 89–92. [Google Scholar] [CrossRef]
  19. Cui, Y.; Vokkarane, V.M. Analytical Blocking Model for Anycast RWA in Optical WDM Networks. J. Opt. Commun. Netw. 2016, 8, 787–799. [Google Scholar] [CrossRef]
  20. Abramov, V.; Li, S.; Wang, M.; Wong, E.W.M.; Zukerman, M. Computation of Blocking Probability for Large Circuit Switched Networks. IEEE Commun. Lett. 2012, 16, 1892–1895. [Google Scholar] [CrossRef] [Green Version]
  21. Sharma, D.; Kumar, S. Network blocking probability-based evaluation of proposed spectrum assignment strategy for a designed elastic optical network link. J. Opt. 2018, 47, 496–503. [Google Scholar] [CrossRef]
  22. Waldman, H.; Campelo, D.R. Asymptotic blocking probabilities in rings with single-circuit links. IEEE Commun. Lett. 2005, 9, 564–566. [Google Scholar] [CrossRef]
  23. Almeida, R.C.; Campelo, D.R.; Waldman, H.; Guild, K. Accounting for link load correlation in the estimation of blocking probabilities in arbitrary network topologies. IEEE Commun. Lett. 2007, 11, 625–627. [Google Scholar] [CrossRef]
  24. Guo, Z.; Duan, J.; Yang, Y. Oversubscription Bounded Multicast Scheduling in Fat-Tree Data Center Networks. In Proceedings of the 2013 IEEE 27th International Symposium on Parallel and Distributed Processing, Cambridge, MA, USA, 20–24 May 2013; pp. 589–600. [Google Scholar] [CrossRef]
  25. Li, G.; Guo, S.; Liu, G.; Yang, Y. Multicast Scheduling with Markov Chains in Fat-Tree Data Center Networks. In Proceedings of the 2017 International Conference on Networking, Architecture, and Storage (NAS), Shenzhen, China, 7–9 August 2017; pp. 1–7. [Google Scholar] [CrossRef]
  26. Li, G.; Guo, S.; Liu, G.; Yang, Y. Application and analysis of multicast blocking modelling in fat-tree data center networks. Complexity 2018, 2018, 7563170. [Google Scholar] [CrossRef] [Green Version]
  27. Fayyaz, M.; Aziz, K.; Mujtaba, G. Blocking probability in optical interconnects in data center networks. Photon. Netw. Commun. 2015, 30, 204–222. [Google Scholar] [CrossRef]
  28. Shukla, R.D.; Pratap, A.; Suryavanshi, R.S. Packet Blocking Performance of Cloud Computing Based Optical Data Centers Networks under Contention Resolution Mechanisms. J. Opt. Commun. 2020. [Google Scholar] [CrossRef]
  29. Krolikowski, J.; Martin, S.; Medagliani, P.; Leguay, J.; Chen, S.; Chang, X.; Geng, X. Joint routing and scheduling for large-scale deterministic IP networks. Comput. Commun. 2021, 165, 33–42. [Google Scholar] [CrossRef]
Figure 1. Links and connections in a Two-layer Tree DCN.
Applsci 12 06235 g001
Figure 2. Network blocking performance of different methods with tree factor K = 4 , over-subscription ratio F O S = 1 , and sub-channel number in edge links M 0 = 10 .
Applsci 12 06235 g002
Figure 3. Network blocking performance of different methods with K = 4 , F O S = 1 , and M 0 = 20 .
Applsci 12 06235 g003
Figure 4. Network blocking performance of different methods with K = 4 , F O S = 1 , and M 0 = 30 .
Applsci 12 06235 g004
Figure 5. Network blocking performance of different methods with K = 4 , F O S = 1.5 , and M 0 = 9 .
Applsci 12 06235 g005
Figure 6. Network blocking performance of different methods with K = 4 , F O S = 1.5 , and M 0 = 18 .
Applsci 12 06235 g006
Figure 7. Network blocking performance of different methods with K = 4 , F O S = 1.5 , and M 0 = 30 .
Applsci 12 06235 g007
Figure 8. Network blocking performance of different methods with K = 4 , F O S = 2 , and M 0 = 10 .
Applsci 12 06235 g008
Figure 9. Network blocking performance of different methods with K = 4 , F O S = 2 , and M 0 = 20 .
Applsci 12 06235 g009
Figure 10. Network blocking performance of different methods with K = 4 , F O S = 2 , and M 0 = 30 .
Applsci 12 06235 g010
Figure 11. Network blocking performance of different methods with K = 5 , F O S = 1.5 , and M 0 = 18 .
Applsci 12 06235 g011
Figure 12. Network blocking performance of different methods with K = 5 , F O S = 2 , and M 0 = 20 .
Applsci 12 06235 g012
Publisher’s Note: MDPI stays neutral with regard to jurisdictional claims in published maps and institutional affiliations.

