Article

CleanSeq: A Pipeline for Contamination Detection, Cleanup, and Mutation Verifications from Microbial Genome Sequencing Data

1
School of Software Engineering, East China Normal University, Shanghai 200062, China
2
Laboratory of Biology and Information Science, School of Life Sciences, East China Normal University, Shanghai 200062, China
*
Authors to whom correspondence should be addressed.
Appl. Sci. 2022, 12(12), 6209; https://doi.org/10.3390/app12126209
Submission received: 4 May 2022 / Revised: 15 June 2022 / Accepted: 16 June 2022 / Published: 18 June 2022
(This article belongs to the Section Applied Biosciences and Bioengineering)

Abstract

:
Contaminations frequently occur in bacterial cultures, which significantly affect the reproducibility and reliability of the results from whole-genome sequencing (WGS). Decontaminated WGS data with clean reads is the only desirable source for detecting possible variants correctly. Improvements in bioinformatics are essential to analyze the contaminated WGS dataset. Existing pipelines usually contain contamination detection, decontamination, and variant calling separately. The efficiency and results from existing pipelines fluctuate since distinctive computational models and parameters are applied. It is then promising to develop a bioinformatical tool containing functions to discriminate and remove contaminated reads and improve variant calling from clean reads. In this study, we established a Python-based pipeline named CleanSeq for automatic detection and removal of contaminating reads, analyzing possible genome variants with proper verifications via local re-alignments. The application and reproducibility are proven in either simulated, publicly available datasets or actual genome sequencing reads from our experimental evolution study in Escherichia coli. We successfully obtained decontaminated reads, called out all seven consistent mutations from the contaminated bacterial sample, and derived five colonies. Collectively, the results demonstrated that CleanSeq could effectively process the contaminated samples to achieve decontaminated reads, based on which reliable results (i.e., variant calling) could be obtained.

1. Introduction

Next-generation sequencing (NGS) technology has been widely employed as a standard procedure to distinguish diversities and variabilities (i.e., gene mutations and expressions) from environmental, laboratory, and clinical samples [1]. Following this trend, an enormous amount of sequencing data has been quickly accumulated. It is known that unexpected DNA sample contaminations are among the shared issues in NGS-based studies, especially in microbial samples where contaminants could be rapidly introduced during upstream (experimental procedures) or downstream (sample preparations or sequencing) stages [2,3]. Previous studies have shown that even a low contamination rate in the read pools, as low as 2%, could increase the inconsistency of genotyping by more than two-fold [4]. Those vulnerable conditions could negatively impact the reproducibility of the analytical results and conclusions from acquired sequencing reads [5]. Although the sequencing technology and the quality of most sequencing data have been improved significantly, computational and bioinformatical approaches for contamination and decontamination verification have become a challenge for biologists and bioinformaticians [6]. For most biologists, available experiments like PCR or sequencing of PCR products have been routinely employed to identify contaminants or mutations from genomic samples [7]. Decontaminated genomic sequencing data with clean reads are the only desirable source for detecting possible variants correctly. Thus, it is beneficial to have such bioinformatical tools containing functions in the discrimination and removal of contaminating reads and improving variant calling from clean reads.
For bioinformaticians, on the other hand, there have already been some tools or pipelines developed for distinguishing contaminated reads in microbial whole genomic sequencing (WGS) samples [5]. To avoid drawing false conclusions, one of the main tasks of quality check (QC) for raw reads is to perform taxonomic classification, based on which the possible contaminated species could be identified for further bioinformatical analysis [8]. Based on the Basic Local Alignment Search Tool (BLAST) [9], Burrows-Wheeler Aligner (BWA) [10], Sequence Alignment/Map (SAMtools) [11], or the Genome Analysis Toolkit (GATK) [12], integrated tools and pipelines, including CheckM [13], Kraken [14], ConFindr [15], FastQ Screen [16], MutScan [17], DecontaMiner [18], and microDecon [19] have been developed for contamination detection or cleanup. ConFindr [15] is a Python-based pipeline that could detect contaminant species automatically and demonstrates a better sensitivity for detecting intraspecies contamination. microDecon [19] is an R package that claims a high cleanup rate (98.1%) in simulated samples and could effectively remove contamination across a broad range of situations. DecontaMiner [18], DeconSeq [20], and FastQ Screen are all written in Perl, and DecontaMiner is mainly designed to deal with unmapped reads for a contamination screening [18]. DeconSeq [20] could be used to remove contaminated reads from metagenomic data based on the BWA-SW algorithm, which supports a web interface. FastQ Screen validates the origin of DNA samples by quantifying the proportion of reads mapping to multiply reference genomes. FastQ Screen generates reports for the source of all predictable contaminated reads and runs BLAST if there is no match for specific reads [16]. MutScan is a C++ algorithm that could detect and visualize target mutations by directly scanning FASTQ raw data. Multiple tools can be used continuously for complete contamination data processing and analysis [17].
The use of the above tools involves some preparation steps such as data format conversion, building a running environment suitable for local operating systems, tool debugging, etc., which seems a difficult task for biologists without a bioinformatical background [21]. Meanwhile, it has also been commonly recognized that the efficiency and results of those tools could fluctuate since they are generally operating as system-dependent and derived from distinctive computational models where specific parameters are applied [7,22,23]. Therefore, an automatic and easy-to-use pipeline for contamination detection and cleanup may be of great interest to improve the efficiency, reliability, and reproducibility of WGS data. Herein, we describe CleanSeq, a Python-based bioinformatics pipeline for (1) automatically detecting, (2) removing contaminating reads, and (3) analyzing and visualizing possible genome mutations from WGS data. The application and reproducibility are proven in both simulated and publicly available datasets. Further, we also examine real datasets from bacterial samples taken during experimental evolution experiments in our laboratory using Escherichia coli, where unexpected contaminations are found. The results show that the decontaminated reads are sufficient, and the called variants from CleanSeq analysis are consistent among cultures of the original contaminated bacterial group and independently selected single colonies, indicating that CleanSeq can effectively process the contaminated samples to achieve reliable results.

2. Materials and Methods

2.1. The Overall Flow of CleanSeq

CleanSeq was designed for contamination detection and decontamination, mutation detection, and verification from the WGS dataset. CleanSeq has the following dependencies from external tools: Trimmomatic [24], BLAST [9], SAMtools [11], GATK4 [12], BWA [10], and Clustal Omega [25]. As demonstrated in Figure 1, which explains the schematic flow of this pipeline, raw sequencing data (Input file), reference genome of target bacteria species (Refseq), and a nucleotide (nt) database for local BLAST+ acquired from NCBI (NTBLASTDB, https://ftp.ncbi.nlm.nih.gov/blast/db/v5/FASTA/, accessed on 30 January 2022) were all the materials required for sequential analysis. CleanSeq contains four main modules: taxonomic identification, cleanup (decontamination), mutation calling, and mutation verification. The whole pipeline has been made publicly available at https://github.com/bingxiao-wcy/cleanSeq, accessed on 30 January 2022.

2.2. Taxonomic Identification

Since it has been reported that the BLAST performs better than most existing tools as judged by speed and accuracy [14], we also choose to use local BLAST+ for our pipeline. The complete genome nt database was adopted from NCBI, and the BLAST command makeblastdb assembled a FASTA file to blast databases [18]. The raw reads were then mapped to all the available genomes [18] using the BLASTn algorithm with the following parameters:
e-value = 1 × 10⁻¹¹, max_target_seqs = 5
mismatches < 1, gap opens < 1, and the highest %identity value
As the first step, CleanSeq detected whether the raw data (trimmed by Trimmomatic [24], randomly selected 10,000 reads) were contaminated with unexpected reads other than the targets via local BLASTn. Subsequently, CleanSeq decided whether or not to execute the cleanup program if it met both the following criteria:
(i)
the contamination rate (contamination reads/all reads, threshold = 10%) was over 10%,
(ii)
genome similarity [26] between the contaminated and target species was less than 80%.
In other words, it was considered as one contamination if the proportion of a specific species other than the target exceeded 10% and the similarity between the target reference genome was less than 80%. Species information with total count and genome accession number, and the proportion out of total reads were collected.

2.3. Cleanup

Cleanup procedures were performed based on BLAST to remove contaminating reads [18,27]. Firstly, BLAST was used to map the raw data to the reference genome of target bacteria with a threshold e-value of 1 × 10⁻⁶. Any reads with an e-value over 1 × 10⁻⁶ were extracted as potential reads from the targeted species. Reads from these candidates were then mapped to the reference genome of contamination species with an e-value of 1 × 10⁻¹¹ and %identity over 95% to obtain all contaminated reads for each available species. The confirmed contaminating reads were continuously removed from the targeted reads pool, and the decontaminated file was generated for further analysis, i.e., mutation calling by GATK4.

2.4. Mutation Call

A universal variant calling pipeline combining BWA [10], SAMtools [11], and GATK [12] was employed in this study. BWA aligns clean reads with the reference genome to generate a bam file, SAMtools sort, and index the bam file. GATK4 HaplotypeCaller [12] was implemented to call variants and generate VCF files compared to the provided reference genome.

2.5. Mutation Verification

The mutation verification module was based on the mutation call information. The called variants in VCF files and the reference genome were employed to generate k-mers (all possible substrings of length k) for each mutation [17,28]. k-mers were then mapped to the decontaminated reads via BLASTn, setting an e-value equal 1 × 10⁻⁶, to acquire reads with variants [17]. The trapped reads were filtered in accordance with the following conditions to ensure that the resulting reads contained the desired bases:
mismatch < 1, gap opens < 1, q.startPos < m.pos < q.endPos
The filtered reads were further extracted for verification, performed by aligning extracted reads with called mutations via Clustal Omega with an .aln file. Each alignment was visualized for manual validations as demanded. Here, an automatic verification was performed if the .aln file was misaligned or not. If the .aln file was correctly aligned, the mutation was considered real.

2.6. Report

The final output summary report showed a list of the species detected, gained clean reads, VCF file with called mutations, and verified mutations. Specifically, the report contained a list of the top ten matched species and their proportions over all existing reads, contamination information, sequence information, and GATK variants calling results with verifications.

2.7. Simulated Dataset

To test the performance of CleanSeq for contamination detection and decontamination, several multi-bacteria hybrid test datasets were generated via dwgsim v0.1.11 (http://github.com/nh13/dwgsim, accessed on 30 January 2022) using the reference genomes of 10 bacterial strains, including eight species (Aeromonas hydrophila (JH815591.1), Bacteroides fragilis (CR626927.1), Citrobacter freundii (CP016762.1), Klebsiella pneumoniae (FO834906.1), Mycobacterium abscessus (CU458896.1), Salmonella enterica (CP007523.1), Staphylococcus aureus (AP017922.1), and Streptococcus pyogenes (AE014074.1)) partially mentioned in the GAGE-B project [14,29] in addition to Escherichia coli (NZ_LR881938.1) and Pseudomonas aeruginosa (CP007224.1). The following conditions were employed in dwgsim:
(i)
Coverage: 3× or 30×; mutation rate: 0.0001%; error rate: 0.01%.
(ii)
Coverage: 30×; mutation rate: 0.01% or 0.0001%; error rate: 0.01%.
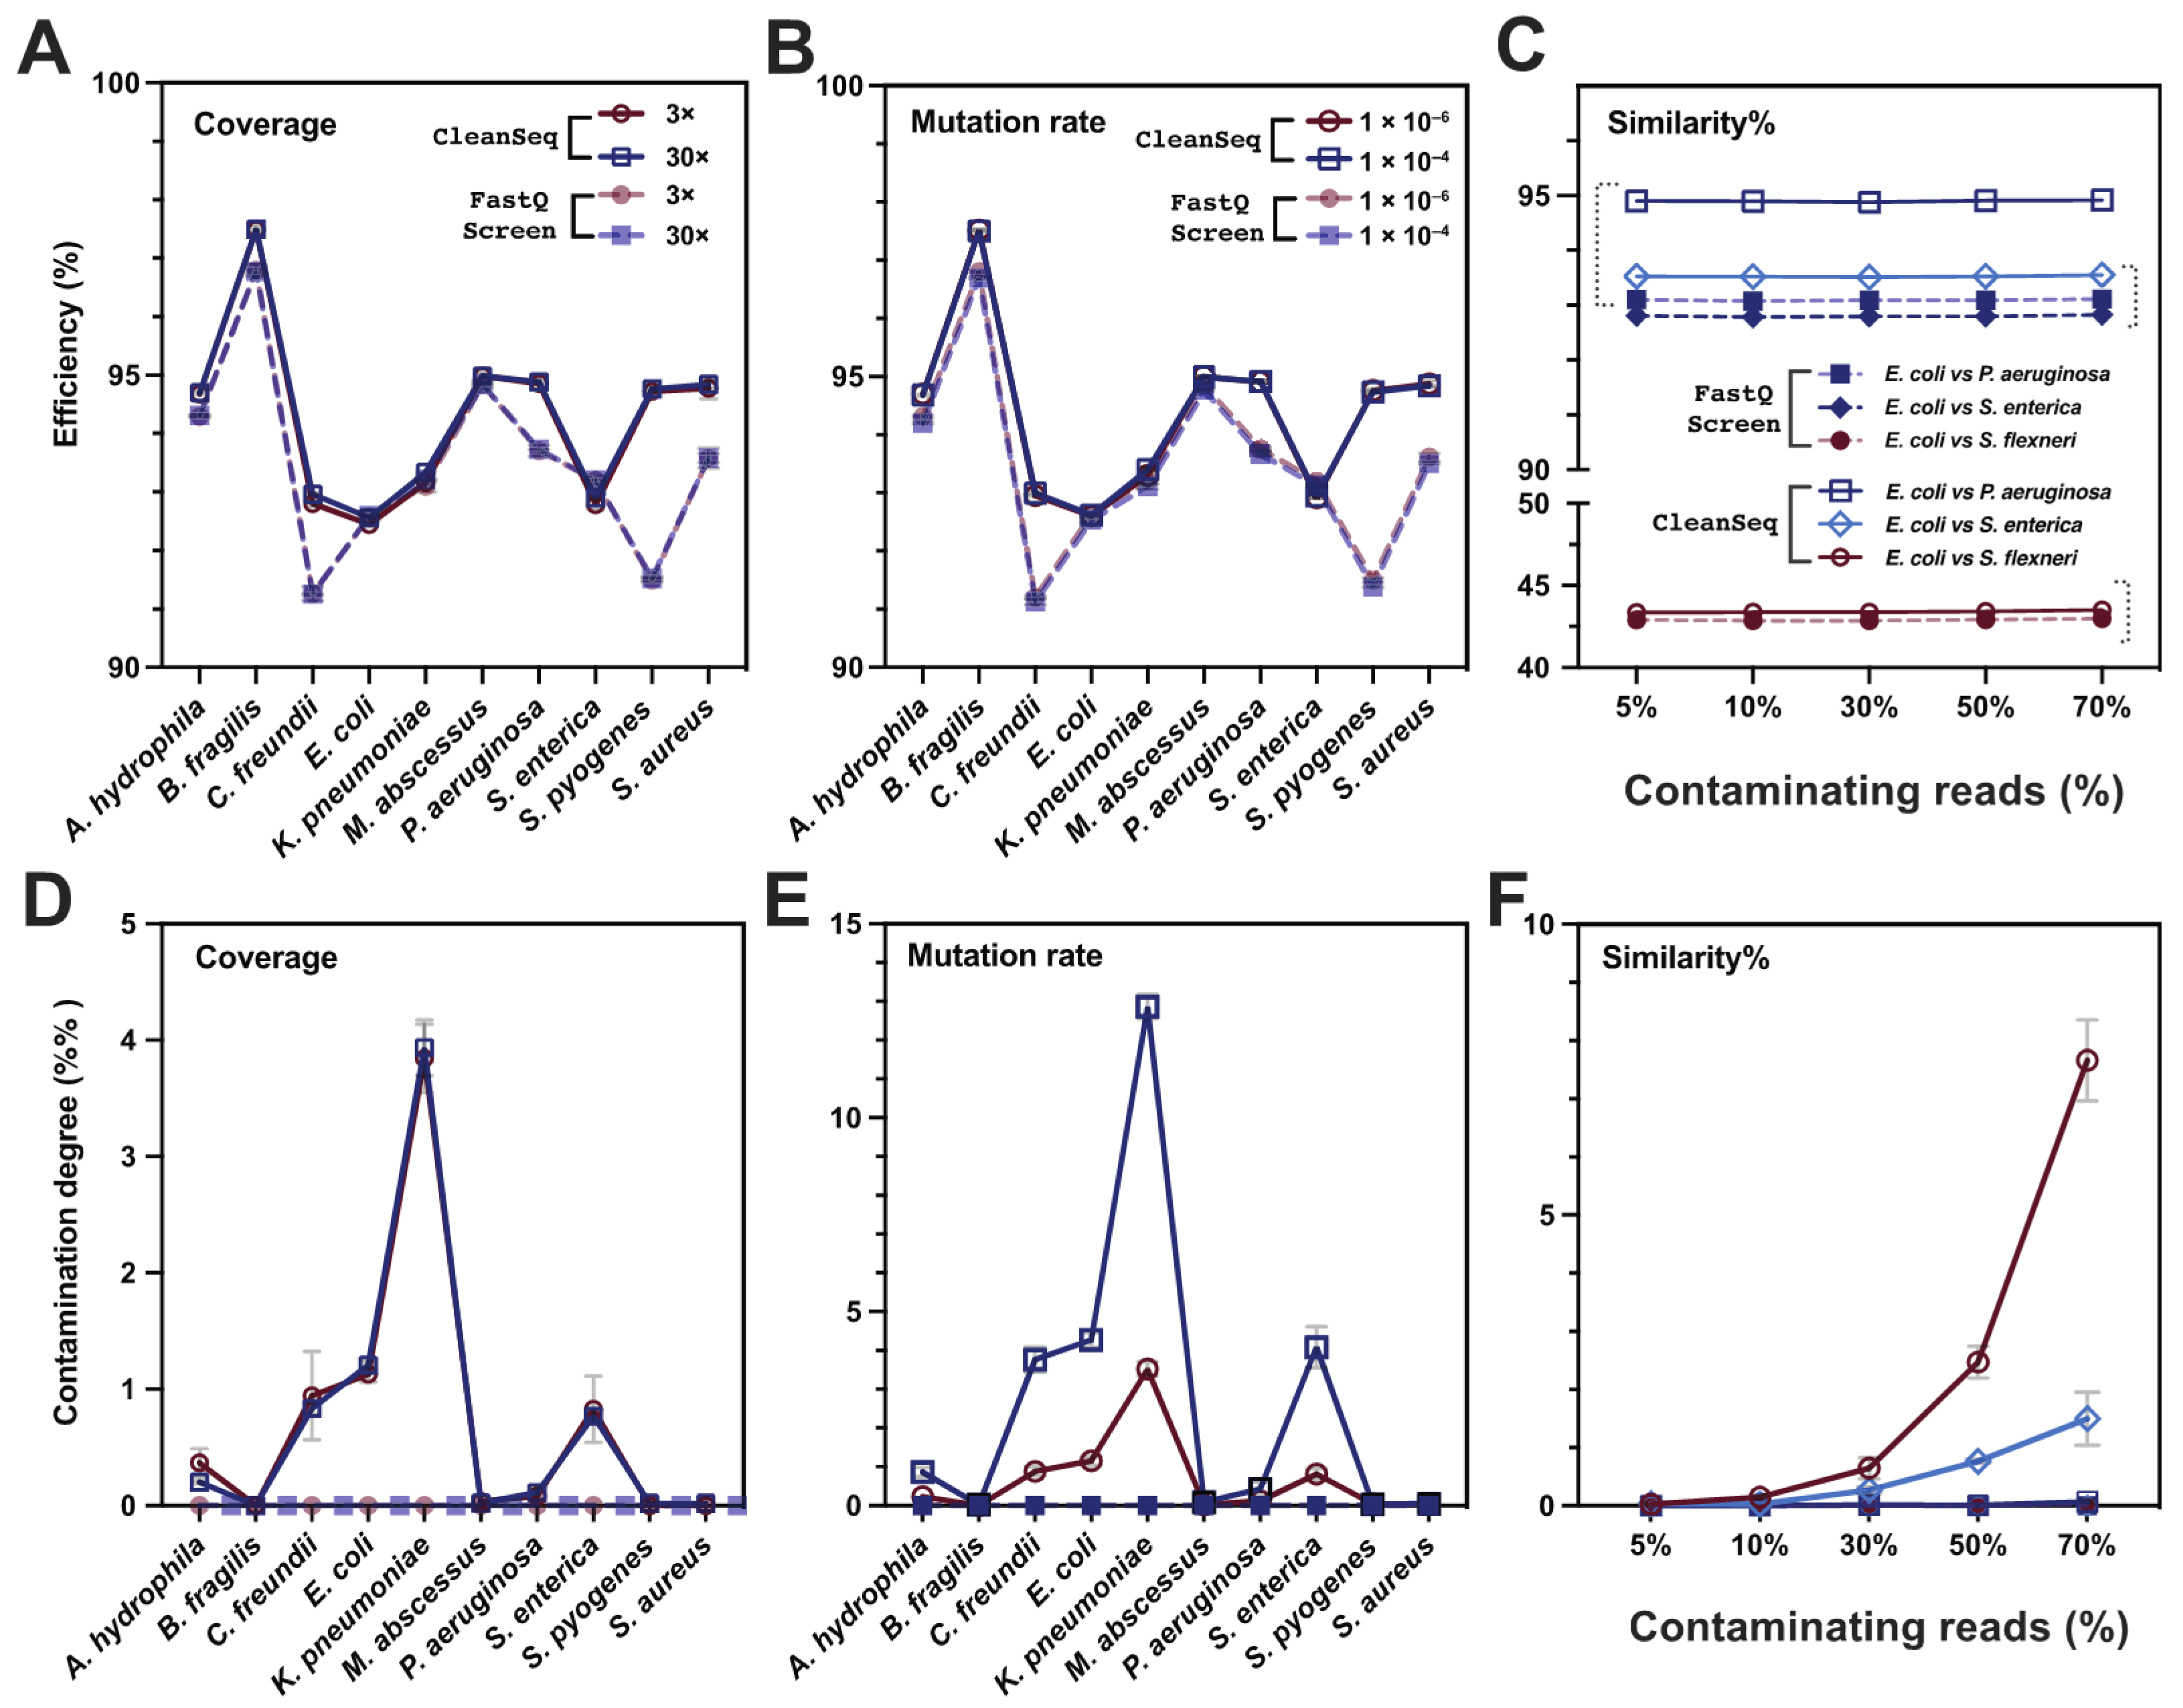
To investigate the possible effects of genome similarity on CleanSeq, four distinct strains, E. coli (NZ_LR881938.1), P. aeruginosa (CP007224.1), S. enterica (CP007523.1), and Shigella flexneri (AE014073.1), were used to build the simulated datasets. The genome similarity was approximately 0.42% for E. coli and P. aeruginosa, 7.73% for E. coli and S. enterica, and 82.99% for E. coli and S. flexneri, respectively. E. coli was designated as the target species, while the contaminating bacteria were P. aeruginosa, S. enterica, or S. flexneri for each independent dataset, respectively. The contamination degree was set differently as 5%, 10%, 30%, 50%, and 70%. Each dataset had a sample size of 1 million reads, a read length of 150 bp, and an error rate of 0.01%. All the decontaminated reads were verified again using the reference genome accession number, and the efficiency and contamination degree were calculated:
Efficiency   = num   of   target   species   clean   reads num   of   target   species   total   reads
Contamination   degree   = num   of   other   species   reads num   of   clean   reads
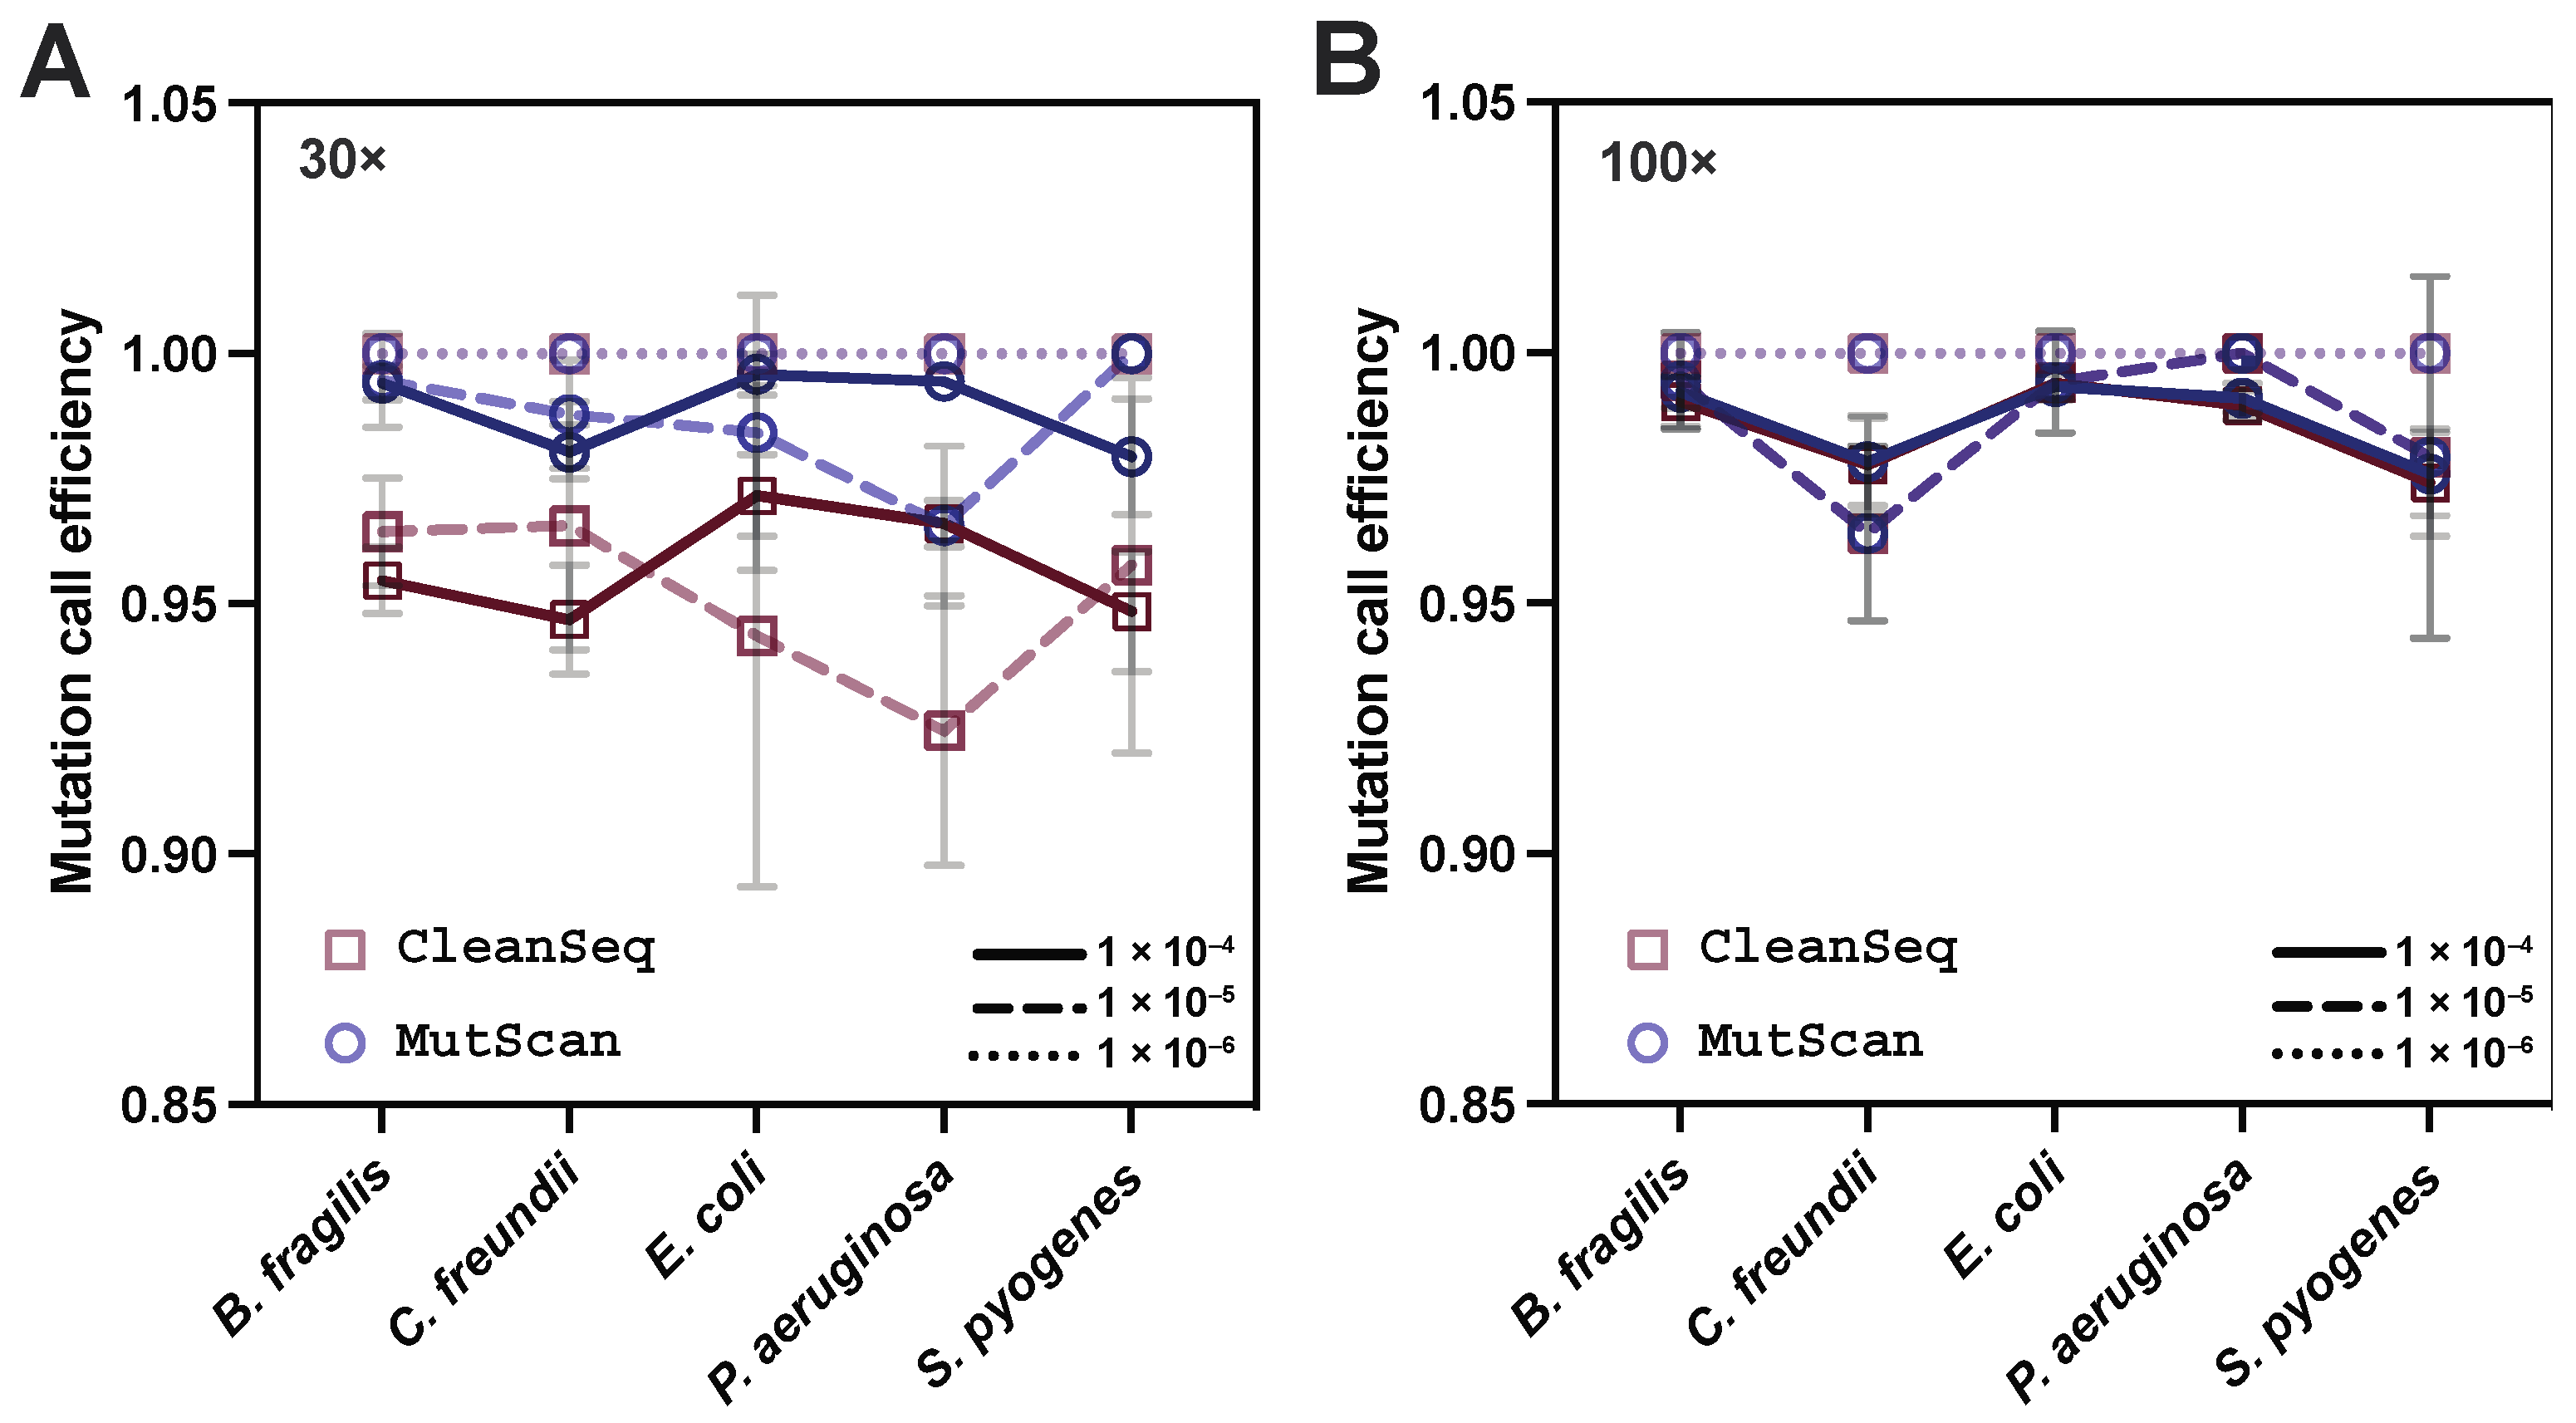
To evaluate the impact of coverage and mutation rate on the efficiency and accuracy of mutation verification in CleanSeq, we simulated a series of the dataset by dwgsim from five bacteria species, P. aeruginosa (CP007224.1), E. coli (NZ_LR881938.1), Citrobacter freundii (CP016762.1), B. fragilis (CR626927.1), and S. pyogenes (AE014074.1). The following parameters were considered in dwgsim: coverage = 30× or 100×, mutation rate = 0.01%, 0.001%, or 0.0001%, error rate = 0.01%. Additionally, one publicly available contamination dataset from bacterial WGS (https://doi.org/10.6084/m9.figshare.c.4282706.v2, accessed on 30 January 2022, [30]) was also used in this study to test CleanSeq. All the above tests were performed in triplicates (as shown in mean (SD)) and compared with the results from MutScan.
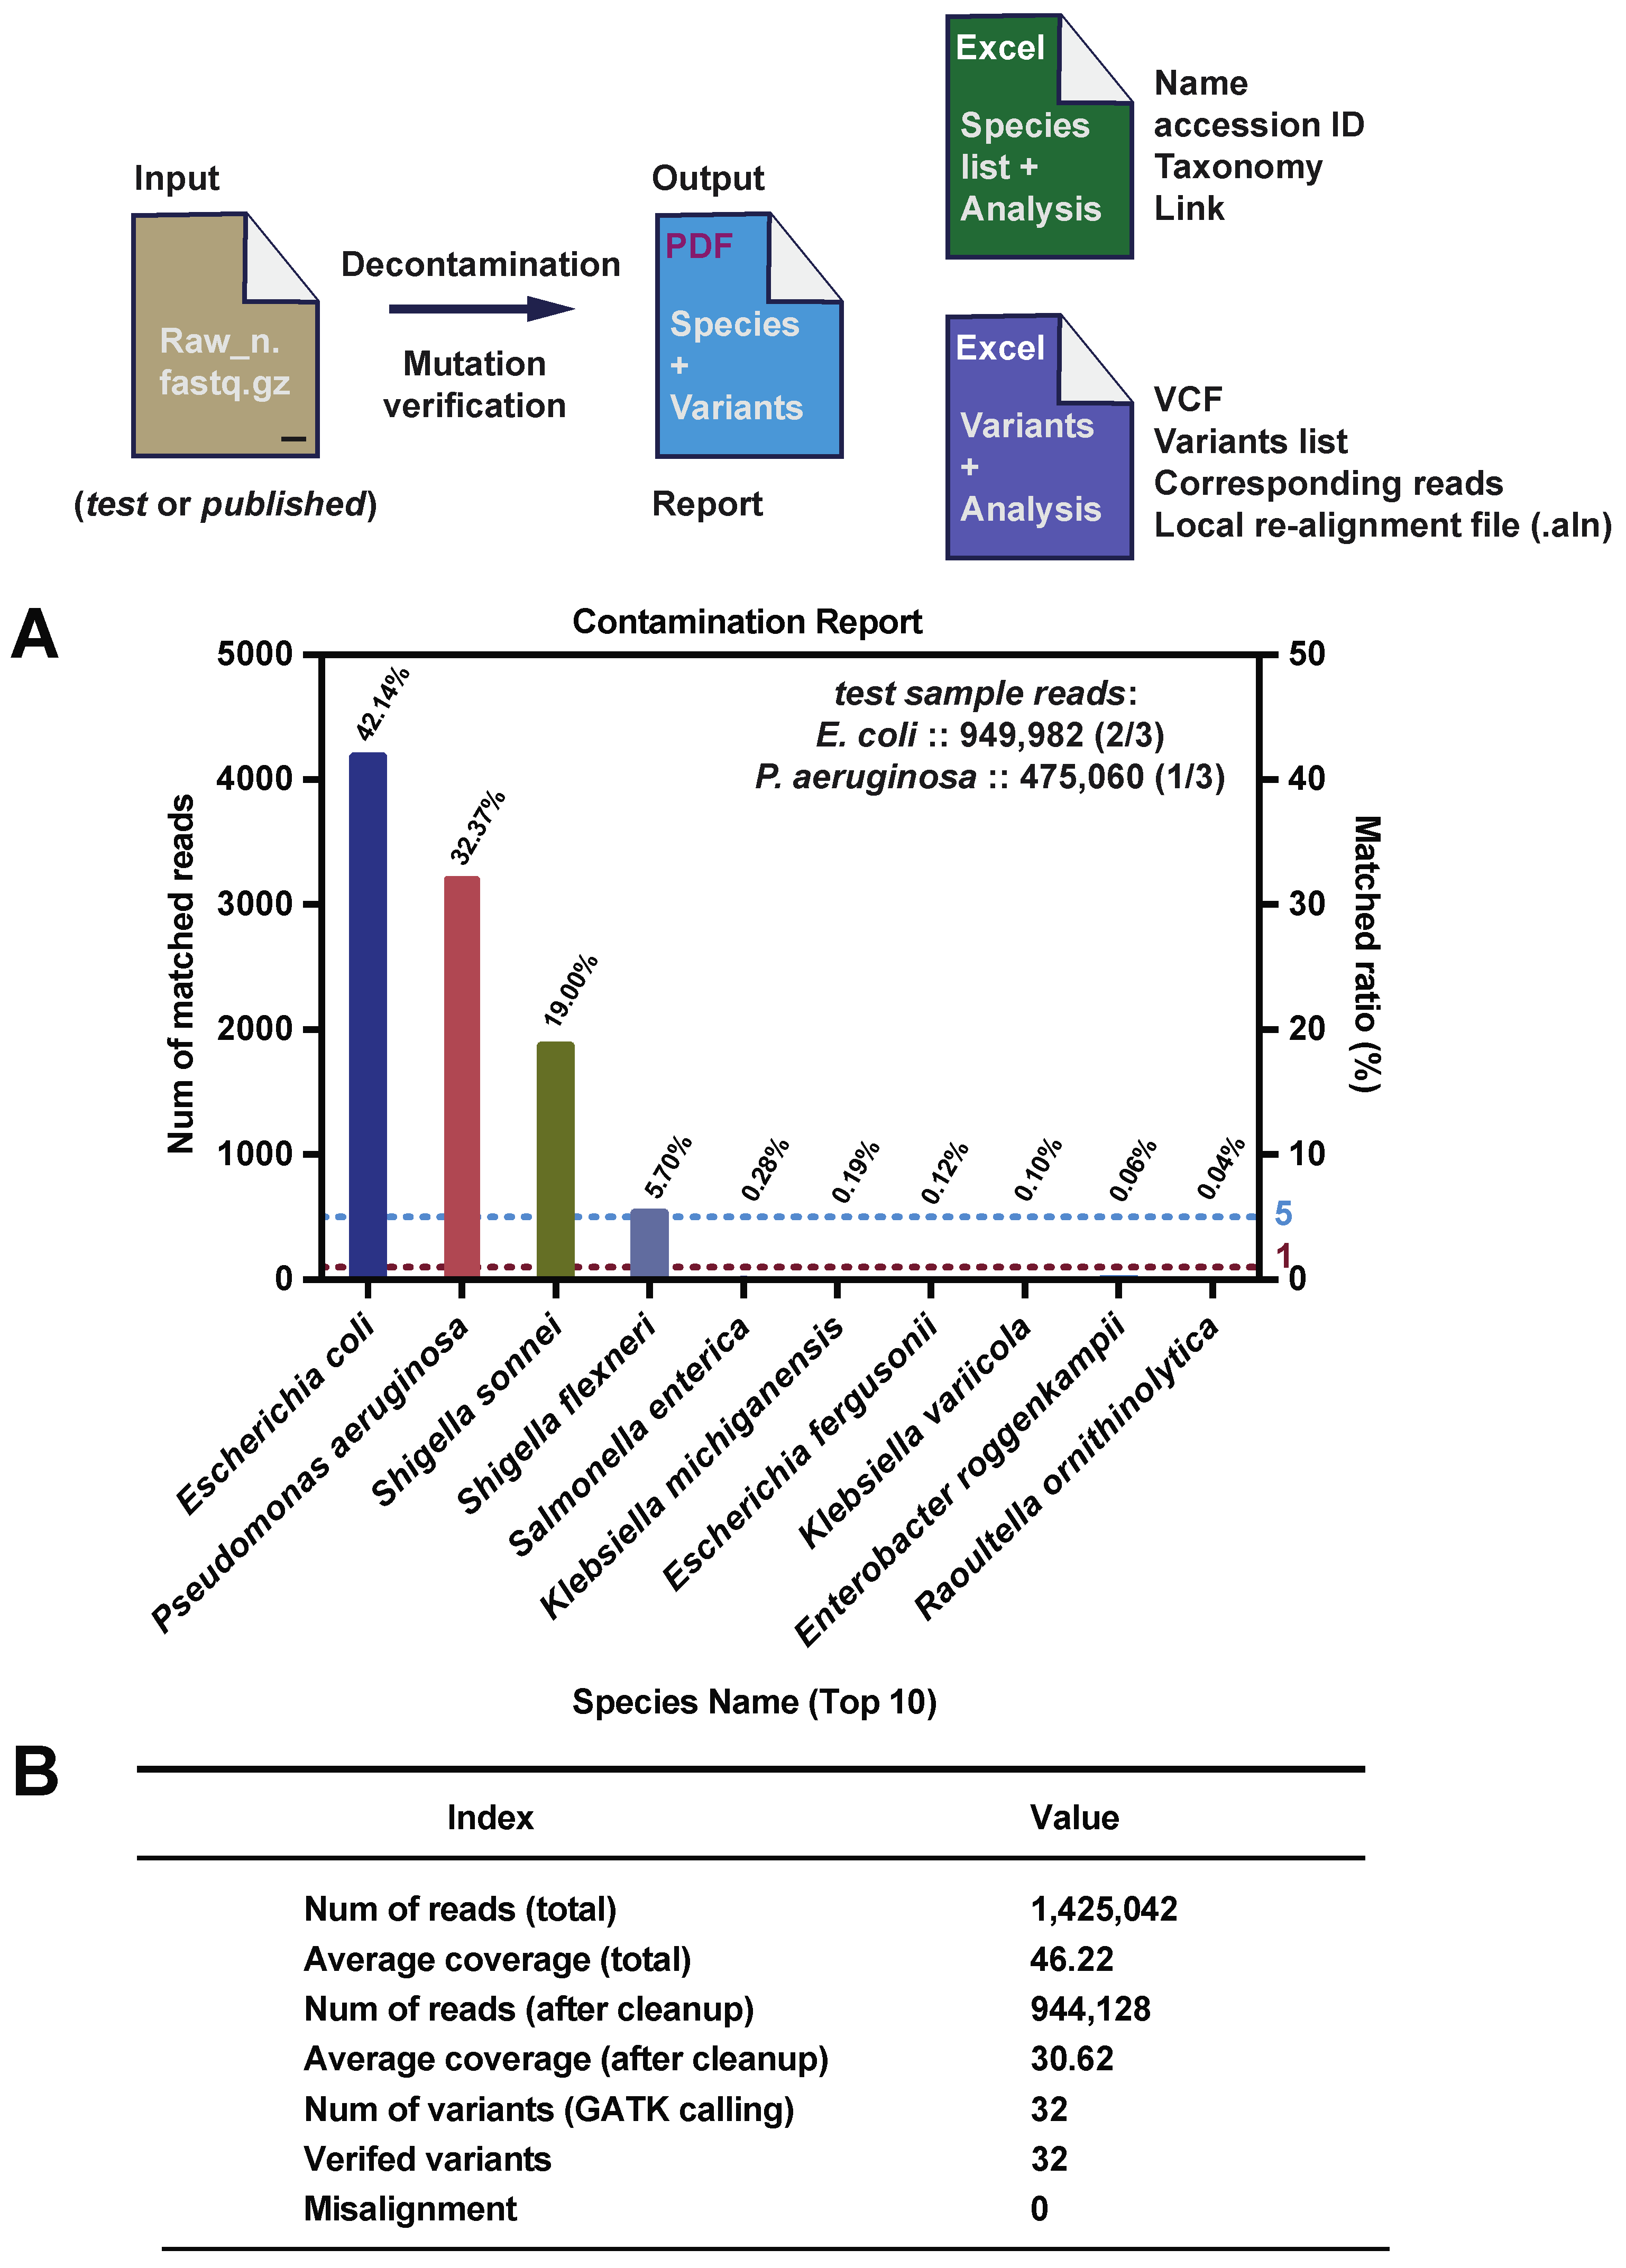
As for the final test dataset mimicking the actual experimental results, a total of 150 million (1,425,042 after cleanup of duplicates) read mixtures of E. coli (949,982, ~2/3) and P. aeruginosa (475,060, ~1/3) were generated in dwgsim.

2.8. Real Dataset from Laboratory Experimental Evolution of E. coli

We also obtained a real sequencing dataset from our bacterial experiments in this study. E. coli cells (MDS42ΔgalK::Ptet-gfp-kan, [31,32]) were experimentally evolved by adapting them in Kanamycin (50 µg/mL) and cell wall-targeting reagents-containing osmoprotective M63 media (15 mM (NH4)2SO4, 39 mM KH2PO4, 62 mM K2HPO4, 136 mM NaCl, 1.79 µM FeSO4, 14.8 µM thiamine-HCl, 1 mM MgSO4, 50 µg/mL Mecillinam, 100 µg/mL lysozyme). Briefly, the bacterial cultures (Stock-T2, P0) were gradually adapted with a series of passages in the above growth media. Bacterial cells (cell wall-less form, or L-form-like cell form) with abnormally bigger phenotypes [33,34] were sorted in fluorescence-activated cell sorting (FACS) before each cell passage (P1-P16) [35,36]. The following sorting gate and models were used: SSC-A threshold: 11, FSC-A threshold: 6000, FSC-H threshold: 900, FSC-A voltage: 35 ± 3, SSC-A voltage: 299 ± 3 (FACS, BD FACSMelody™ Cell Sorter, BD Life Sciences, San Jose, CA, USA). The sorted cells were cultured for 16–24 h to maintain them in the exponential phase (~106~8 cells/mL). After 16 rounds of the culture-sorting cycle, the resulting strains were obtained and sent for WGS. Since the contaminations in the final strains were detected, five single clones were also selected for WGS. Genome resequencing was performed by Sango (Shanghai, China). Genomic DNA was extracted by Magenta Bacterial DNA KF kit (Sango, Shanghai, China), and the gDNA library was constructed using NEBNext Ultra DNA Library Prep Kit from Illumina (NEB, Ipswich, MA, USA). WGS was performed on the NovaSeq 6000 (Illumina, San Diego, CA, USA) and MGISEQ-2000 platform (MGI, Shenzhen, China). Those genome sequencing results with or without unexpected bacterial contaminations were applied to CleanSeq for searching convincible genomic mutations.

3. Results and Discussion

3.1. CleanSeq Processes WGS Raw Data for Contamination Detection, Decontamination, and Calling Variants

As shown in Figure 1 and described in the Materials and Methods, the CleanSeq pipeline incorporated routine WGS analytical tools, such as Trimmomatic [24], BLAST [9], SAMtools [11], GATK4 [12], BWA [10], and Clustal Omega [25], to process raw reads directly. To date, some existing pipelines for microbial WGS, such as Bactopia [37], TORMES [38], ASA3P [8], and BacPipe [39], often only contain similar modules like taxonomic identification and genome assembly. To the best of our knowledge, CleanSeq is the first attempt to integrate four modules of taxonomic classification, decontamination, and variant calling and verification in one Python-based pipeline. It detects and removes contaminated reads based on BLASTn mapping and generates clean data for subsequent analysis of variant calling via GATK. All the reads containing called variants are extracted and verified by local re-alignment and visualization via Clustal Omega [25].

3.2. CleanSeq Detects and Eliminates Mutation Reads Efficiently as Compared with FastQ Screen

To test the performance of CleanSeq regarding the detection and elimination of contaminated reads, we generated a series of simulated sequence datasets via dwgsim using a mixture of ten bacterial genome DNA sequences. As demonstrated in Figure 2, coverage (3× or 30×), the genomic mutation rate in the genome (0.01% or 0.0001%), and the similarity between the target and contaminating bacteria (0.42%, 7.73% or 82.99%) were considered. Although the results seemed to be species (genome)-dependent, the efficiency of contaminating reads detection (calculated according to Materials and Methods) was generally over 91%, except for E. coli and S. flexneri, which were nearly indistinguishable at the species level, with a genome similarity of 82.99% [40,41]. The same result was also obtained for the contamination degree in reads after cleanup which was kept nicely within 0–0.15% in either high or lower coverage, a mutation rate of 1 × 10⁻⁴ or 1 × 10⁻⁶, and a lower genome similarity and contamination rate. It should be noted that the decontamination efficacy (~42%) and correctness (~0.1%) dropped significantly in the condition when the similarity and mutation rate were both very high. Compared to FastQ Screen [16], the cleanup efficiency of CleanSeq was slightly higher as judged by the detection efficiency. The increase in efficiency results was minor in the contamination degree after cleanup, but it was still acceptable. The performance between CleanSeq and FastQ Screen was comparable as expected.

3.3. CleanSeq Calls Variants with Satisfactory Correctness as Compared with MutScan

Subsequently, we investigated the performance of CleanSeq for calling possible variants from decontaminated reads. As described in the Materials and Methods, simulated datasets containing reads from five different species (P. aeruginosa, E. coli, C. freundii, B. fragilis, and S. pyogenes) were employed. The results are plotted in Figure 3, showing that the overall efficiency for variant calling is above ~90% in a lower coverage of 30× and can reach 95% when the coverage is 100×. The efficiency was also correlated with the genome mutation rate (number) in the genome, especially in the case of the combination of low coverage and high genome mutation rate (i.e., 3×, 1 × 10⁻⁴, data not shown). Since it is widely accepted that depth and coverage are the key parameters in genomic analyses [42], the quality of the original data, including the read length, depth, and coverage, should be maintained within an acceptable range for bioinformatical research so that reliable conclusions can be drawn. Compared to MutScan [17], both tools are utilizable and comparable as no significant differences were observed in provided conditions.

3.4. CleanSeq Is Practical when Applied to either Simulated or Real Experimental Datasets

Subsequently, one dataset mimicking bacterial contaminations in real experiments (E. coli contaminated with P. aeruginosa, see Materials and Methods) was employed to test CleanSeq. The results are summarized in Figure 4 and show that P. aeruginosa was successfully detected as a contaminant species at about 1/3 (32.3%) contamination rate (Figure 4A) as expected. Due to the high genome similarity of E. coli and Shigella [40,41], S. sonnei and S. flexneri were also listed as potentially contaminating species, indicating the high accuracy of CleanSeq with a low level of analytical bias. CleanSeq also called variants correctly out of a pool of 32. The called variants were further extracted and verified through local alignment and resulted in no misalignment as listed in Figure 4B. The output files with all information regarding the results related to this dataset are further provided in Supplemental Data S1. Additionally, one publicly available contamination dataset from bacterial WGS (https://doi.org/10.6084/m9.figshare.c.4282706.v2, accessed on 30 January 2022, [30]) was also used in this study to test CleanSeq, the results of which are also provided as Supplemental Data S2.
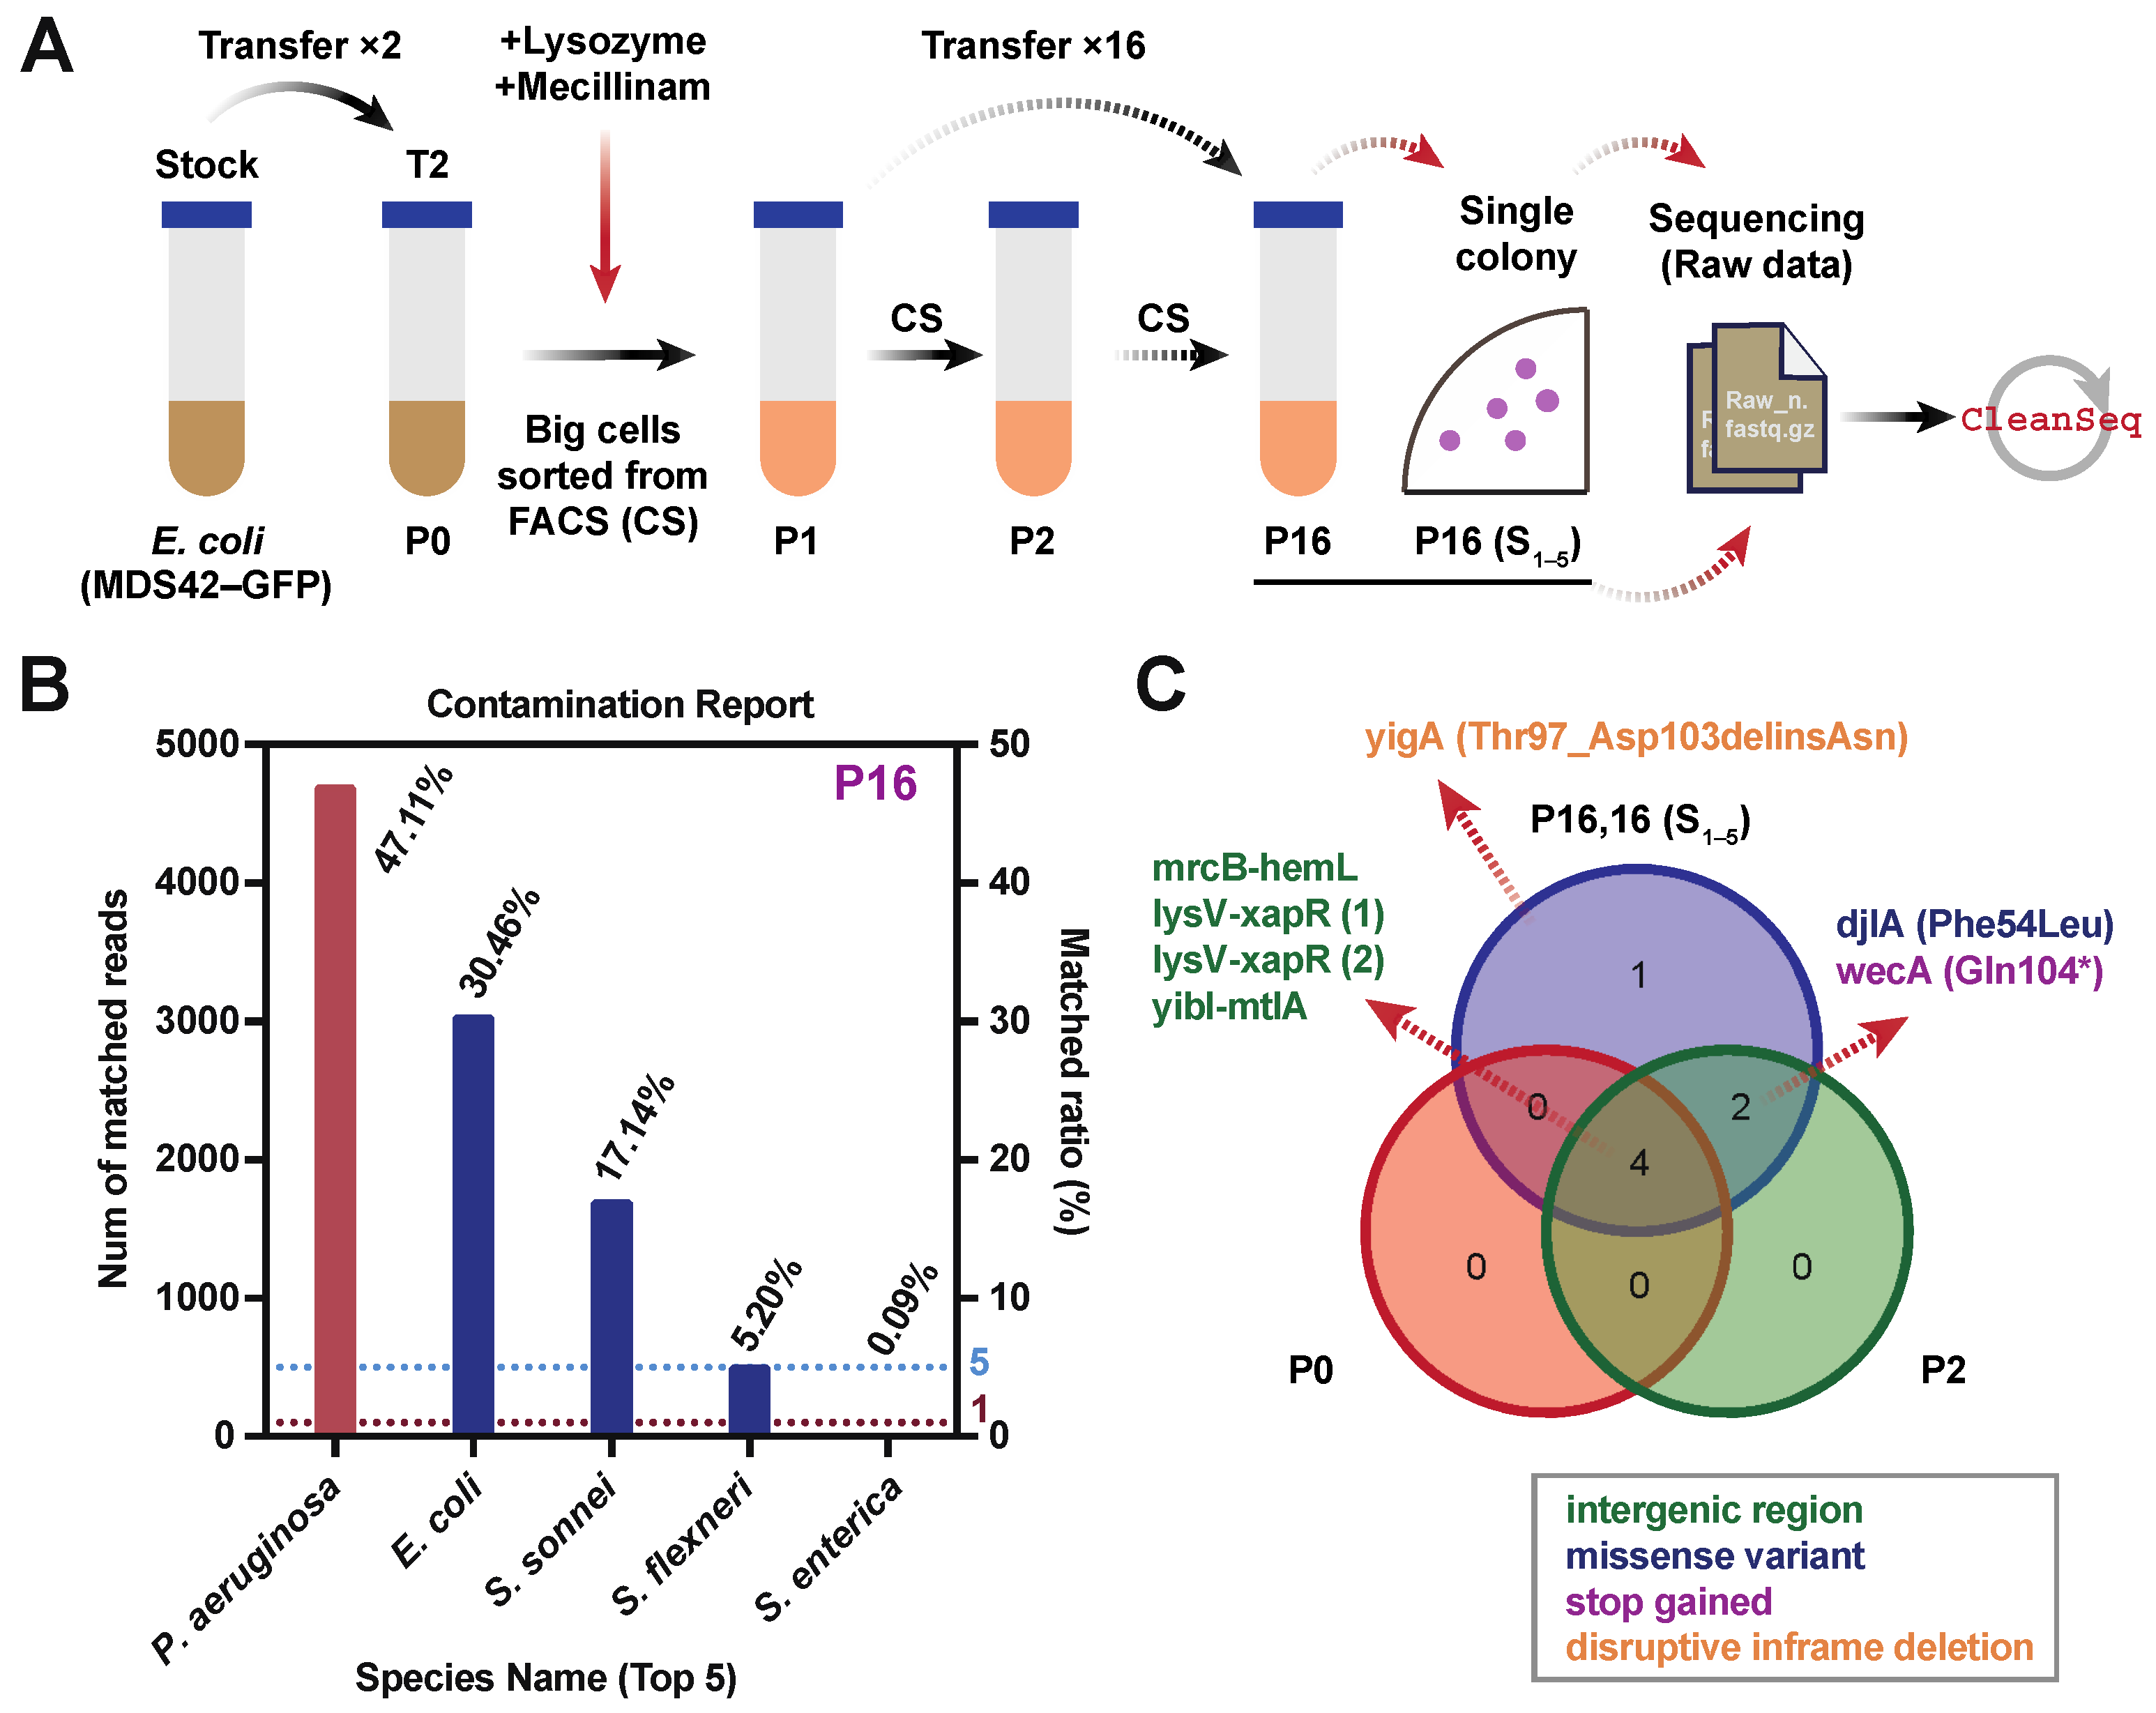
To examine the performance and correctness of CleanSeq towards real experimental datasets, we subjected and analyzed the sequencing results from laboratory experimental evolution of E. coli. As demonstrated in Figure 5A, we were interested in selecting cell wall-less (L-form) bacteria exposed to cell wall-targeting reagents (Mecillinam and Lysozyme) via FACS technology and a laboratory experimental evolution [35,36,43]. We employed part of the experimental results here because one of the passage lines was unexpectedly contaminated with other bacteria species during cell culture, which served as real practical material for CleanSeq. The WGS datasets from the final passage line P16 and five single colonies were then analyzed by CleanSeq for decontamination and genome-wide mutation analysis starting from the single command line: ./cleanSeq MDS42Ref.fasta ntPath SP5P16.raw_1.fastq.gz SP5P16.raw_2.fastq.gz. As mentioned above, we also compared the efficiency between FastQ Screen [16] and CleanSeq. The overall cleaning efficiency and the read number after cleanup (CleanSeq/FastQ Screen, 3688271/3489622) from CleanSeq were higher than that of the FastQ Screen, implying that CleanSeq could be considered alternatively as a pre-processing tool for decontamination. The contamination analysis based on 10,000 randomly selected reads showed that the final culture was mainly contaminated with P. aeruginosa with a 47.1% contamination degree (Figure 5B). After the decontamination, the overall coverage of remaining reads from E. coli still could reach ~133× (Supplemental Data S3), ensuring the correctness of the following variant analysis.
After variant calling by GATK, we obtained all mutation information from P2 (free of contamination), P16 cell passage, and its derived five E. coli single colonies (P16S1–5). As shown in Figure 5C, P16 and P16S1–5 contained the same seven mutation sites, six of which were also detected from P2 passages. It should be highlighted here that MutScan can only call out five variants, partially because MutScan has a limitation in detecting long insertions and deletions (INDELs) [17]. Another possibility is the overcleaning of the reads, which were initially from E. coil. Those variants were then further confirmed by re-alignment (Clustal Omega) of the corresponding reads extracted using the generated six k-mers (One of the generated k-mers contained two close mutation sites, Supplemental Data S4) [17,28]. No misalignment was found for all seven variants, suggesting the high correctness of the GATK-integrated CleanSeq pipeline. The consistency of called-out genome mutations among the contaminated sample and its derived single colonies indicated that the decontamination and verification processes are sufficient for real WGS analysis like this study. A rational decision could be made according to those results on whether further experiments or reruns should be performed or not.
Among the called genomic mutations, it was desirable to obtain two shared genomic mutations, djlA (Phe54Leu, missense variant) and wecA (Gln104*, stop gained) in P2 and P16 passage lines, and one specific mutation yigA (Thr94_Asp103delinsAsn, disruptive inframe deletion) in P16 passage lines. djlA is a cell inner membrane protein involved in regulating the synthesis of the colanic acid capsule, which might contribute to cell viability in harsh conditions [44,45]. wecA is also a cell inner member protein reported to initiate the biosynthesis of enterobacterial common antigen and O-antigen lipopolysaccharide (LPS) [46]. yigA is a DUF484 domain-containing protein with unknown functions. All three mutated genes found in passage lines of this study were nonessential, and both of djlA and wecA were potentially related to the cell membrane or cell wall functions and were probably targeted by cell wall-targeting reagents like Mecillinam and lysozyme used in this study [47], although no direct evidence was provided. Further study is crucial to investigate and uncover the possible involvement and mechanism of sorted cells with the above gene mutations.

4. Conclusions

This study designed a Python-pipeline CleanSeq to detect and eliminate contaminated reads from bacterial WGS datasets. After obtaining the clean reads, CleanSeq further verifies the possible variants claimed from GATK by local re-alignment of corresponding reads with generated k-mer references. The performance was confirmed using various datasets, either simulated or real experimental datasets derived from laboratory experimental evolution in E. coli. Based on the results compared to other existing pipelines, we concluded that CleanSeq has satisfactory correctness and could be employed as either a pre-processing tool for decontamination of raw reads or mutation calls and verifications of mutations of interest. The results from CleanSeq could also be utilized as a reference to evaluate the WGS data quality and make a decision for a further experimental plan.

Supplementary Materials

The following supporting information can be downloaded at: https://www.mdpi.com/article/10.3390/app12126209/s1, Supplemental Data S1: Output report on the simulated contamination test dataset (The output reports contain the information for the input file, a detailed list for contamination detection, and a list of the top ten contaminated species. All the statistical results for reads and mutations are also provided.); Supplemental Data S2: CleanSeq output report on the public contamination test dataset (https://doi.org/10.6084/m9.figshare.c.4282706.v2, accessed on 30 January 2022) used in this study; Supplemental Data S3: CleanSeq output report on the P16 experiment data; Supplemental Data S4: Extracted reads containing variants based on seven generated k-mers.

Author Contributions

Conceptualization: J.X. and T.Y.; Data curation: C.W. and J.X.; Formal analysis: C.W. and J.X.; Funding acquisition: T.Y.; Investigation: C.W., Y.X., J.X. and T.Y.; Methodology: Y.L., C.K., D.T., H.L. and F.H.; Project administration: J.X. and T.Y.; Resources: Y.L., N.L., D.T. and H.L.; Software: C.W.; Supervision: J.X. and T.Y.; Writing—review & editing: J.X., C.W., Y.X. and T.Y. All authors have read and agreed to the published version of the manuscript.

Funding

The research was partially funded by the MOE International Joint Laboratory of Trustworthy Software at East China Normal University (to T.Y.).

Institutional Review Board Statement

Not applicable.

Informed Consent Statement

Not applicable.

Data Availability Statement

All relevant data are within the paper and its Supporting information files. The pipeline created in this study is publicly available at https://github.com/bingxiao-wcy/cleanSeq (accessed on 30 January 2022).

Acknowledgments

We appreciated all the technical support and helpful discussion from Bo-ying Xu (Shanghai Tenth People’s Hospital, School of Medicine, Tongji University) and all members of Yomo’s group at East China Normal University. We also thank Adriano Caliaria for proofreading and language editing this manuscript.

Conflicts of Interest

The authors declare no conflict of interest. The funders had no role in the design of the study; in the collection, analyses, or interpretation of data; in the writing of the manuscript, or in the decision to publish the results.

References

  1. Hardwick, S.A.; Deveson, I.W.; Mercer, T.R. Reference standards for next-generation sequencing. Nat. Rev. Genet. 2017, 18, 473–484. [Google Scholar] [CrossRef]
  2. Strong, M.J.; Xu, G.; Morici, L.; Splinter Bon-Durant, S.; Baddoo, M.; Lin, Z.; Fewell, C.; Taylor, C.M.; Flemington, E.K. Microbial contamination in next generation sequencing: Implications for sequence-based analysis of clinical samples. PLoS Pathog. 2014, 10, e1004437. [Google Scholar] [CrossRef] [Green Version]
  3. Glassing, A.; Dowd, S.E.; Galandiuk, S.; Davis, B.; Chiodini, R.J. Inherent bacterial DNA contamination of extraction and sequencing reagents may affect interpretation of microbiota in low bacterial biomass samples. Gut Pathog. 2016, 8, 24. [Google Scholar] [CrossRef] [Green Version]
  4. Flickinger, M.; Jun, G.; Abecasis, G.R.; Boehnke, M.; Kang, H.M. Correcting for Sample Contamination in Genotype Calling of DNA Sequence Data. Am. J. Hum. Genet. 2015, 97, 284–290. [Google Scholar] [CrossRef] [Green Version]
  5. Goig, G.A.; Blanco, S.; Garcia-Basteiro, A.L.; Comas, I. Contaminant DNA in bacterial sequencing experiments is a major source of false genetic variability. BMC Biol. 2020, 18, 24. [Google Scholar] [CrossRef]
  6. Muir, P.; Li, S.; Lou, S.; Wang, D.; Spakowicz, D.J.; Salichos, L.; Zhang, J.; Weinstock, G.M.; Isaacs, F.; Rozowsky, J.; et al. The real cost of sequencing: Scaling computation to keep pace with data generation. Genome Biol. 2016, 17, 53. [Google Scholar] [CrossRef] [Green Version]
  7. Gallegos, J.E.; Hayrynen, S.; Adames, N.R.; Peccoud, J. Challenges and opportunities for strain verification by whole-genome sequencing. Sci. Rep. 2020, 10, 5873. [Google Scholar] [CrossRef] [Green Version]
  8. Schwengers, O.; Hoek, A.; Fritzenwanker, M.; Falgenhauer, L.; Hain, T.; Chakraborty, T.; Goesmann, A. ASA3P: An automatic and scalable pipeline for the assembly, annotation and higher-level analysis of closely related bacterial isolates. PLoS Comput. Biol. 2020, 16, e1007134. [Google Scholar] [CrossRef]
  9. Altschul, S.F.; Gish, W.; Miller, W.; Myers, E.W.; Lipman, D.J. Basic local alignment search tool. J. Mol. Biol. 1990, 215, 403–410. [Google Scholar] [CrossRef]
  10. Li, H.; Durbin, R. Fast and accurate short read alignment with Burrows-Wheeler transform. Bioinformatics 2009, 25, 1754–1760. [Google Scholar] [CrossRef] [Green Version]
  11. Li, H.; Handsaker, B.; Wysoker, A.; Fennell, T.; Ruan, J.; Homer, N.; Marth, G.; Abecasis, G.; Durbin, R.; Genome Project Data Processing, S. The Sequence Alignment/Map format and SAMtools. Bioinformatics 2009, 25, 2078–2079. [Google Scholar] [CrossRef] [PubMed] [Green Version]
  12. Van der Auwera, G.A.; Carneiro, M.O.; Hartl, C.; Poplin, R.; Del Angel, G.; Levy-Moonshine, A.; Jordan, T.; Shakir, K.; Roazen, D.; Thibault, J.J.C.p.i.b. From FastQ data to high-confidence variant calls: The genome analysis toolkit best practices pipeline. Curr. Protoc. Bioinform. 2013, 43, 11.10.1–11.10.33. [Google Scholar] [CrossRef]
  13. Parks, D.H.; Imelfort, M.; Skennerton, C.T.; Hugenholtz, P.; Tyson, G.W. CheckM: Assessing the quality of microbial genomes recovered from isolates, single cells, and metagenomes. Genome Res. 2015, 25, 1043–1055. [Google Scholar] [CrossRef] [PubMed] [Green Version]
  14. Wood, D.E.; Salzberg, S.L. Kraken: Ultrafast metagenomic sequence classification using exact alignments. Genome Biol. 2014, 15, R46. [Google Scholar] [CrossRef] [Green Version]
  15. Low, A.J.; Koziol, A.G.; Manninger, P.A.; Blais, B.; Carrillo, C.D. ConFindr: Rapid detection of intraspecies and cross-species contamination in bacterial whole-genome sequence data. PeerJ 2019, 7, e6995. [Google Scholar] [CrossRef]
  16. Wingett, S.W.; Andrews, S.J.F. FastQ Screen: A tool for multi-genome mapping and quality control. F1000Research 2018, 7, 1338. [Google Scholar] [CrossRef]
  17. Chen, S.; Huang, T.; Wen, T.; Li, H.; Xu, M.; Gu, J.J.B.b. MutScan: Fast detection and visualization of target mutations by scanning FASTQ data. BMC Bioinform. 2018, 19, 16. [Google Scholar] [CrossRef] [Green Version]
  18. Sangiovanni, M.; Granata, I.; Thind, A.S.; Guarracino, M.R. From trash to treasure: Detecting unexpected contamination in unmapped NGS data. BMC Bioinform. 2019, 20, 168. [Google Scholar] [CrossRef]
  19. McKnight, D.T.; Huerlimann, R.; Bower, D.S.; Schwarzkopf, L.; Alford, R.A.; Zenger, K.R. microDecon: A highly accurate read-subtraction tool for the post-sequencing removal of contamination in metabarcoding studies. Environ. DNA 2019, 1, 14–25. [Google Scholar] [CrossRef]
  20. Schmieder, R.; Edwards, R. Fast identification and removal of sequence contamination from genomic and metagenomic datasets. PLoS ONE 2011, 6, e17288. [Google Scholar] [CrossRef] [Green Version]
  21. Caboche, S.; Even, G.; Loywick, A.; Audebert, C.; Hot, D. MICRA: An automatic pipeline for fast characterization of microbial genomes from high-throughput sequencing data. Genome Biol. 2017, 18, 233. [Google Scholar] [CrossRef] [PubMed] [Green Version]
  22. Park, S.J.; Onizuka, S.; Seki, M.; Suzuki, Y.; Iwata, T.; Nakai, K. A systematic sequencing-based approach for microbial contaminant detection and functional inference. BMC Biol. 2019, 17, 72. [Google Scholar] [CrossRef] [PubMed] [Green Version]
  23. Qi, M.; Nayar, U.; Ludwig, L.S.; Wagle, N.; Rheinbay, E. cDNA-detector: Detection and removal of cDNA contamination in DNA sequencing libraries. BMC Bioinform. 2021, 22, 611. [Google Scholar] [CrossRef] [PubMed]
  24. Bolger, A.M.; Lohse, M.; Usadel, B.J.B. Trimmomatic: A flexible trimmer for Illumina sequence data. Bioinformatics 2014, 30, 2114–2120. [Google Scholar] [CrossRef] [Green Version]
  25. Sievers, F.; Wilm, A.; Dineen, D.; Gibson, T.J.; Karplus, K.; Li, W.; Lopez, R.; McWilliam, H.; Remmert, M.; Soding, J.; et al. Fast, scalable generation of high-quality protein multiple sequence alignments using Clustal Omega. Mol. Syst. Biol. 2011, 7, 539. [Google Scholar] [CrossRef]
  26. Goris, J.; Konstantinidis, K.T.; Klappenbach, J.A.; Coenye, T.; Vandamme, P.; Tiedje, J.M. DNA-DNA hybridization values and their relationship to whole-genome sequence similarities. Int. J. Syst. Evol. Microbiol. 2007, 57, 81–91. [Google Scholar] [CrossRef] [Green Version]
  27. Chen, Y.-A.; Lin, C.-C.; Wang, C.-D.; Wu, H.-B.; Hwang, P.-I.J.B.G. An optimized procedure greatly improves EST vector contamination removal. BMC Genom. 2007, 8, 416. [Google Scholar] [CrossRef] [Green Version]
  28. Lee, H.; Shuaibi, A.; Bell, J.M.; Pavlichin, D.S.; Ji, H.P. Unique k-mer sequences for validating cancer-related substitution, insertion and deletion mutations. NAR Cancer 2020, 2, zcaa034. [Google Scholar] [CrossRef]
  29. Magoc, T.; Pabinger, S.; Canzar, S.; Liu, X.; Su, Q.; Puiu, D.; Tallon, L.J.; Salzberg, S.L.J.B. GAGE-B: An evaluation of genome assemblers for bacterial organisms. Bioinformatics 2013, 29, 1718–1725. [Google Scholar] [CrossRef]
  30. Pightling, A.W.; Pettengill, J.B.; Wang, Y.; Rand, H.; Strain, E. Within-species contamination of bacterial whole-genome sequence data has a greater influence on clustering analyses than between-species contamination. Genome Biol. 2019, 20, 286. [Google Scholar] [CrossRef]
  31. Ying, B.W.; Tsuru, S.; Seno, S.; Matsuda, H.; Yomo, T. Gene expression scaled by distance to the genome replication site. Mol. Biosyst. 2014, 10, 375–379. [Google Scholar] [CrossRef] [PubMed]
  32. Lu, H.; Aida, H.; Kurokawa, M.; Chen, F.; Xia, Y.; Xu, J.; Li, K.; Ying, B.W.; Yomo, T. Primordial mimicry induces morphological change in Escherichia coli. Commun. Biol. 2022, 5, 24. [Google Scholar] [CrossRef] [PubMed]
  33. Kawai, Y.; Mickiewicz, K.; Errington, J. Lysozyme counteracts β-Lactam antibiotics by promoting the emergence of L-Form bacteria. Cell 2018, 172, 1038–1049.e1010. [Google Scholar] [CrossRef] [PubMed] [Green Version]
  34. Osawa, M.; Erickson, H.P. L form bacteria growth in low-osmolality medium. Microbiology 2019, 165, 842–851. [Google Scholar] [CrossRef]
  35. Sycuro, L.K.; Rule, C.S.; Petersen, T.W.; Wyckoff, T.J.; Sessler, T.; Nagarkar, D.B.; Khalid, F.; Pincus, Z.; Biboy, J.; Vollmer, W.; et al. Flow cytometry-based enrichment for cell shape mutants identifies multiple genes that influence Helicobacter pylori morphology. Mol. Microbiol. 2013, 90, 869–883. [Google Scholar] [CrossRef] [Green Version]
  36. Yoshida, M.; Tsuru, S.; Hirata, N.; Seno, S.; Matsuda, H.; Ying, B.W.; Yomo, T. Directed evolution of cell size in Escherichia coli. BMC Evol. Biol. 2014, 14, 257. [Google Scholar] [CrossRef] [Green Version]
  37. Petit, R.A., 3rd; Read, T.D. Bactopia: A flexible pipeline for complete analysis of bacterial genomes. mSystems 2020, 5, e00190-20. [Google Scholar] [CrossRef]
  38. Quijada, N.M.; Rodriguez-Lazaro, D.; Eiros, J.M.; Hernandez, M. TORMES: An automated pipeline for whole bacterial genome analysis. Bioinformatics 2019, 35, 4207–4212. [Google Scholar] [CrossRef]
  39. Xavier, B.B.; Mysara, M.; Bolzan, M.; Ribeiro-Goncalves, B.; Alako, B.T.F.; Harrison, P.; Lammens, C.; Kumar-Singh, S.; Goossens, H.; Carrico, J.A.; et al. BacPipe: A rapid, user-friendly whole-genome sequencing pipeline for clinical diagnostic bacteriology. iScience 2020, 23, 100769. [Google Scholar] [CrossRef]
  40. Devanga Ragupathi, N.K.; Muthuirulandi Sethuvel, D.P.; Inbanathan, F.Y.; Veeraraghavan, B. Accurate differentiation of Escherichia coli and Shigella serogroups: Challenges and strategies. New Microbes New Infect. 2018, 21, 58–62. [Google Scholar] [CrossRef]
  41. Brenner, D.J.; Fanning, G.R.; Steigerwalt, A.G.; Orskov, I.; Orskov, F. Polynucleotide sequence relatedness among three groups of pathogenic Escherichia coli strains. Infect. Immun. 1972, 6, 308–315. [Google Scholar] [CrossRef] [PubMed] [Green Version]
  42. Sims, D.; Sudbery, I.; Ilott, N.E.; Heger, A.; Ponting, C.P. Sequencing depth and coverage: Key considerations in genomic analyses. Nat. Rev. Genet. 2014, 15, 121–132. [Google Scholar] [CrossRef] [PubMed]
  43. Razin, S.; Oliver, O. Morphogenesis of Mycoplasma and bacterial L-form colonies. J. Gen. Microbiol. 1961, 24, 225–237. [Google Scholar] [CrossRef] [PubMed] [Green Version]
  44. Genevaux, P.; Schwager, F.; Georgopoulos, C.; Kelley, W.L. The djlA gene acts synergistically with dnaJ in promoting Escherichia coli growth. J. Bacteriol. 2001, 183, 5747–5750. [Google Scholar] [CrossRef] [PubMed] [Green Version]
  45. Genevaux, P.; Wawrzynow, A.; Zylicz, M.; Georgopoulos, C.; Kelley, W.L. DjlA is a third DnaK co-chaperone of Escherichia coli, and DjlA-mediated induction of colanic acid capsule requires DjlA-DnaK interaction. J. Biol. Chem. 2001, 276, 7906–7912. [Google Scholar] [CrossRef] [PubMed] [Green Version]
  46. Lehrer, J.; Vigeant, K.A.; Tatar, L.D.; Valvano, M.A. Functional characterization and membrane topology of Escherichia coli WecA, a sugar-phosphate transferase initiating the biosynthesis of enterobacterial common antigen and O-antigen lipopolysaccharide. J. Bacteriol. 2007, 189, 2618–2628. [Google Scholar] [CrossRef] [PubMed] [Green Version]
  47. Senges, C.H.R.; Stepanek, J.J.; Wenzel, M.; Raatschen, N.; Ay, U.; Martens, Y.; Prochnow, P.; Vazquez Hernandez, M.; Yayci, A.; Schubert, B.; et al. Comparison of proteomic responses as global approach to antibiotic mechanism of action elucidation. Antimicrob. Agents Chemother. 2020, 65, e01373-20. [Google Scholar] [CrossRef]
Figure 1. Schematic design and data processing flow of CleanSeq pipeline. Raw data from genome DNA sequencing are directly introduced, verified by quality check (QC), and trimmed accordingly. The trimmed reads are then analyzed in a local bacterial nucleotide (NT) database. The species and contamination information are determined based on the percentage of the reads of each species out of all reads. The reads are then cleaned up and proceeded as a cleanup file, further subjected to mutation calling. The called mutations are further verified via re-alignment, visualization, and manual comparisons. The finalized report file containing species contamination and confirmed mutations is generated.
Applsci 12 06209 g001
Figure 2. Comparison of the cleanup performance between CleanSeq and FastQ Screen. Employing a series of simulated datasets with various coverages ((A,D), 3× and 30×), mutation rates ((B,E), 1 × 10⁻⁴, 1 × 10⁻⁶), and genome similarities ((C,F), 0.42% for E. coli and P. aeruginosa, 7.73% for E. coli and S. enterica, and 82.99% for E. coli and S. flexneri, with 30%~70% contamination rates). Two outcome values, efficiency and contamination degree after cleanup were calculated and compared to evaluate the overall performance. Efficiency refers to the ratio of clean reads in total reads. Contamination degree refers to the percentage of mutated reads in clean reads. The higher the cleaning efficiency and the lower the contamination degree, the better performance is indicated. The genome similarity between E. coli and P. aeruginosa, E. coli and S. enterica, and E. coli and S. flexner is low (0.42%), medium (7.73%), and high (82.99%), respectively.
Applsci 12 06209 g002
Figure 3. Comparison of the mutation calling performance between CleanSeq and MutScan. The simulated datasets of five kinds of bacterial species (P. aeruginosa (CP007224.1), E. coli (NZ_LR881938.1), Citrobacter freundii (CP016762.1), B. fragilis (CR626927.1) and Streptococcus pyogenes (AE014074.1)) with different sequencing coverage ((A), 30×; (B), 100×) and mutation rates (1 × 10⁻⁴, 1 × 10⁻⁵, and 1 × 10⁻⁶) were used to test the efficiency of mutation calling and verification.
Applsci 12 06209 g003
Figure 4. Performance of CleanSeq on the simulated dataset mimicking bacterial contamination. The contamination test set was a reads mixture of E. coli and P. aeruginosa in a ratio of 2:1, with E. coli as the target bacteria and P. aeruginosa as the contaminating bacteria. The analytical flow and species reports were shown in (A). Detailed statistical results of the cleanup and mutation calling were listed in (B).
Applsci 12 06209 g004
Figure 5. Performance of CleanSeq on a real experimental dataset. (A) The schematic representation of a laboratory experimental evolution in E. coli. Following the addition of cell wall-targeting reagents in culture media, Mecillinam, and lysozyme, bigger cells sorted from FACS (CS) were used for subsequential passages. The strategy of the CS-passage cycle was repeated 16 rounds for laboratory experimental evolution. The indicated strains and single colonies (P16 and P16S1–5) were subjected to WGS. The results from CleanSeq were plotted, showing the taxonomic classification of all reads in (B) and seven genome variants in both P16 and P16S1–5 were found and verified, as summarized in a Venn diagram (C).
Applsci 12 06209 g005
Publisher’s Note: MDPI stays neutral with regard to jurisdictional claims in published maps and institutional affiliations.