Abstract
Velocity analysis using the semblance spectrum can provide an effective velocity model for advanced seismic imaging technology, in which the picking accuracy of velocity analysis is significantly affected by the resolution of the semblance spectrum. However, the peak broadening of the conventional semblance spectrum leads to picking uncertainty, and it cannot deal with the amplitude-variation-with-offset (AVO) phenomenon. The well-known AB semblance can process the AVO anomalies, but it has a lower resolution compared with conventional semblance. To improve the resolution of the AB semblance spectrum, we propose a new weighted AB semblance based on principal component analysis (PCA). The principal components or eigenvalues of seismic events are highly sensitive to the components with spatial coherence. Thus, we utilized the principal components of the normal moveout (NMO)-corrected seismic events with different scanning velocities to construct a weighting function. The new function not only has a high resolution for velocity scanning, but it is also a friendly method for the AVO phenomenon. Numerical experiments with the synthetic and field seismic data sets proved that the new method significantly improves resolution and can provide more accurate picked velocities compared with conventional methods.
1. Introduction
Velocity analysis is an essential step in seismic exploration, which can estimate an appropriate velocity model for subsequent seismic signal processing and imaging. The normal-moveout (NMO)-based velocity analysis with the semblance spectrum [,] is widely applied in industry due to its straightforward implementation and relatively minor computational cost. The semblance spectrum uses a series of scanning velocities to apply NMO corrections with hyperbolic trajectories [,] and then measures the spatial coherence of the corrected seismic events to obtain the corresponding semblances. When an accurate velocity is used, the corrected seismic events have a strong spatial coherence [], and the peak value will appear in the semblance spectrum. The velocity values corresponding to the peaks in the semblance spectrum are then picked for velocity modeling [,]. The resolution of the semblance spectrum determines its ability to distinguish and pick individual peaks, and the high-resolution semblance can significantly improve the accuracy of the velocity modeling [,,].
Advanced velocity modelling methods [,,,], such as full waveform inversion [], usually require the NMO-based semblance spectrum to provide an effective initial model. However, due to insufficient resolution, the peak broadening of the conventional semblance spectrum leads to picking uncertainty, which makes it difficult to provide an effective initial model. To improve the resolution of the semblance spectrum, many scholars have improved the coherence measurement in the semblance spectrum [] and proposed a new semblance based on the coherence measurement of the covariance matrix. The covariance matrix of the NMO-corrected seismic events is sensitive to far-offset traces, which improves the ability to distinguish individual peaks [,,] and to develop a new coherence measurement based on the bootstrapped differential semblance. The bootstrapping approach estimates statistical properties of the NMO-corrected seismic events with a coherency estimator, which can significantly improve the resolution of the semblance spectrum. In addition, many scholars have developed the semblance spectra through the singular value decomposition (SVD) of the data matrix [,,,]. The SVD-based semblance is sensitive to the spatial coherency of the NMO-corrected seismic events, thus improving the ability to distinguish individual peaks. On the other hand, many scholars have constructed the weighting functions to improve the resolution. The weighting functions are usually sensitive to the coherency of the NMO-corrected seismic events. [] constructed a weighting function by measuring the local similarity between the reference data and each trace. This similarity-weighted function can significantly improve the resolution of semblance. Then, [] applied the similarity-weighted function to the simultaneous-source data, and achieved better results than the traditional methods.The similarity-weighted function requires an appropriate reference trace as a judging criterion. However, how to select a reliable reference trace needs further study [].
Coherence measurement in the semblance spectrum assumes that there is no variation of amplitudes or phases along with seismic events. However, the amplitudes of seismic events that exhibit the amplitude-variation-with-offset phenomenon are usually variable []. The conventional semblance spectrum based on this assumption cannot deal with the amplitude variation, and the energy clusters in the conventional semblance spectrum will be lost, making it impossible to pick up the effective velocity value. To overcome the problem that the conventional spectrum cannot deal with AVO anomalies, [] introduced a trend-based semblance operator to account for the effect of AVO anomalies on the semblance spectrum. This semblance operator, referred to as the AB semblance. Ref. [] provided an explicit form of AB semblance through the minimization of the trend-fitting parameters, and demonstrated a significant improvement in dealing with the AVO phenomenon. However, the resolution of standard AB semblance is lower than classical methods, and its large peak-broadening leads to inaccurate picking. Then, the bootstrapping-weighted operator and AB semblance were combined to construct an AVO-friendly bootstrapped differential semblance []. This method has a high resolution and can handle the AVO regions. Besides, the AVO-friendly weighting term can also improve the resolution of AB semblance []. This method measures local similarity between the reference trace and other traces in a time window. The local-similarity method is sensitive to the seismic curvature of the far-offset data, thus significantly improving the resolution of AB semblance.
In this paper, we propose a new weighting operator based on the principal components analysis to improve the resolution of the AB semblance. Due to the NMO-corrected seismic gather having strong spatial coherence or low-rank attributes, the first principal component is much larger than other principal components, and it has an overwhelming advantage in the composition of the NMO-corrected seismic gather. The first principal component represents the components with strong coherence in the data set, and these components come from the NMO-corrected seismic events with an accurate velocity. In comparison, the other principal components represent the non-coherence data sets and they come from the seismic events that have not been completely corrected. Thus, we used the distribution characteristics of the principal components to construct the new weighting function. The new function is sensitive to the curvature of seismic events at far-offset traces. When the seismic events are not fully corrected, the weighting function will not enhance the intensity of the semblance spectrum. By combining the new weighting function related to the principal components and trend-based AB coefficients, the new method has a higher resolution than that of the conventional methods, and it can handle the AVO phenomenon. Numerical experiments with the synthetic and field data examples proved that the new method has a better performance in velocity analysis than conventional semblances.
2. Method
2.1. Review of Conventional AB Semblance
The NMO-corrected seismic event can be denoted as a vector . Assuming that there is no variation of amplitudes along with seismic events, the reference can be regarded as a constant vector whose elements are all equal to 1. Then the coherence coefficient of vectors and can be defined as
where is the amplitude of the NMO-corrected seismic event. Considering that a series of scanning velocities is used for NMO correction, the semblance spectrum can be expressed as:
where is the amplitude of NMO-corrected CMP gather at the time index and trace numbers and are the number of traces. represents the coherence coefficient at the time index with a scanning velocity and is the length of the window along with the time axis.
The reference vector is not a constant sequence when the AVO anomalies exist. It was supposed that the reference vector has a trend [], where and represent the AVO intercept and gradient, respectively. is a known function can be replaced by the offset and is the seismic amplitude of the Shuey approximation at offset . The coefficients and can be estimated from the least-squares fitting:
Here Appendix A gives the exact expressions for solving and . Then, substituting Equation (3) into Equation (2), we obtain the well-known AB semblance with an analytic form.
The AB semblance uses a trend-based reference to replace the constant reference . This trend function represents the fully corrected seismic events with the classic AVO anomalies. Compared with the conventional semblance, the AB-semblance can recover the energy clusters in the AVO region. However, the trend function significantly reduces the resolution of the AB semblance spectrum, and even the resolution of the AB semblance spectrum is lower than that of the conventional spectrum.
2.2. High-Resolution AB Semblance with a PCA-Based Weighting Function
Principal component analysis is a common multivariate analysis method, and it has been widely used in data mining, pattern recognition, machine learning, and image compression [,,]. Principal component analysis regroups the original relevant indicators into a new set of unrelated comprehensive indicators. For the NMO-corrected seismic event, if the true scanning velocity is adopted, the NMO-corrected seismic event will be completely flattened, and the data matrix will have a strong spatial coherence. Thus, the first principal component has the absolute advantage compared with other components. If the wrong scanning velocity is adopted, the NMO-corrected seismic event is not flattened, then the first principal component of the data matrix is not overwhelming.
We denote the amplitude of NMO-corrected gather as a matrix , then the covariance matrix of is
where is the mean value of matrix and represents the eigenvalue of the (i)-th principal component and . represents the corresponding eigenvectors of the covariance matrix. If the matrix is a low-rank matrix or its column vectors have a strong linear coherence with each other, then the first principal component is much larger than the others, and the remains quickly decrease to zero. For example, Figure 1a shows a seismic event at time 0.24 s with the velocity . We used a series of scanning velocities to perform NMO corrections, then analyzed the corresponding eigenvalues of the principal components. As shown in Figure 1b, the eigenvalue of the first principal component had the absolute advantage when the true velocity was used, and the remaining eigenvalues decreased rapidly. If we used the velocity with a slight deviation to perform NMO correction, the corresponding first principal component no longer has the absolute advantage compared with others, indicating that the first principal component is highly sensitive to the variation of scanning velocity. Thus, we define two weighting factors
and
to improve the resolution of the semblance spectrum. We demonstrated two weighting factors and with different scanning velocities in the above case (Figure 1b). As shown in Figure 2, the weighting factors and both had a narrow pulse at true velocity . As long as the scanning velocity deviated slightly from the true value, the two weighting factors and decreased rapidly, indicating that the weighting factors were very sensitive to changes in velocity.
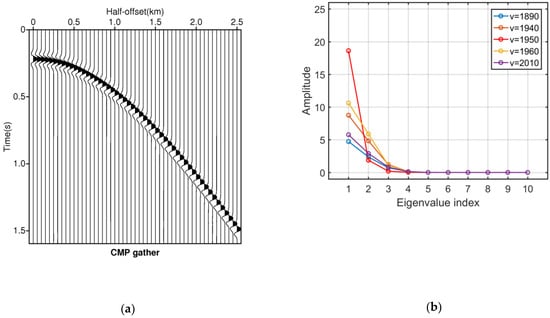
Figure 1.
A seismic event at time 0.24 s with a velocity . (a) CMP gather and (b) The corresponding principal components (eigenvalues) of the NMO-corrected CMP gathers with different scanning velocities.
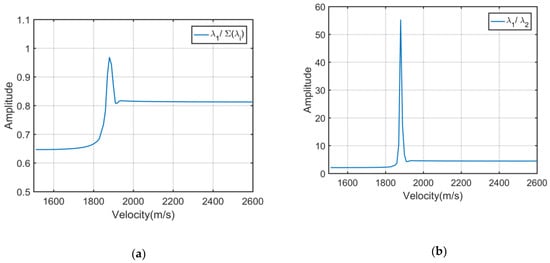
Figure 2.
The weighting factors and varying with the scanning velocity. (a) Represents the weighting factor varying with the scanning velocity and (b) represents the weighting factor .
Then, we combined factors and to construct a new weighting function . The new weighting function is defined as
where is a stability factor for avoiding division by zero. Since is the product of the two weighting factors and , its sensitivity to velocity is double compared to the single weighting factor. Then, for different scanning velocities , the weighting functions become a vector.
where the vector represents the weights at time with a series of scanning velocities. We denote the maximum weight as . Then, the new semblance can be defined as
Here, we divide weights by their maximum value to normalize the new semblance from 0 to 1, which is convenient for the automatic velocity picking algorithm. The new semblance is a combination of the standard AB semblance and the weighting function. The AB semblance can handle with AVO anomalies, and the weighting function improves the resolution of AB semblance spectrum significantly. For example, Figure 3 shows the semblances of different methods at time 0.24 s in the above case. It can be seen that the proposed PCA-weighted semblance had a narrow pulse at scanning velocity , indicating that it had the highest resolution compared with other methods.
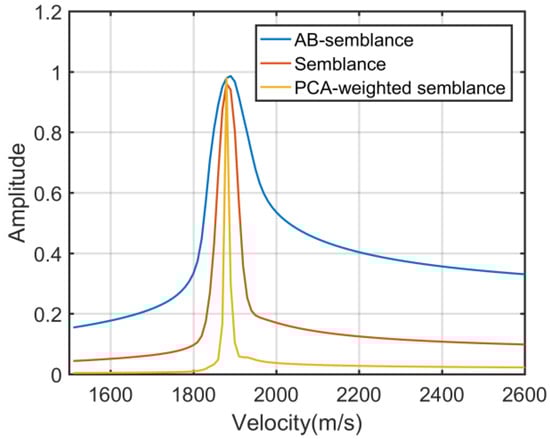
Figure 3.
Comparison of the semblances of different methods at time 0.24 s. Where the blue curve represents the AB-semblance, the red curve represents the conventional semblance, and the yellow curve represents the proposed PCA-weighted semblance.
3. Experiments
3.1. Synthetic Data
To analyze the performance of the new method in velocity analysis, we compared and analyzed the resolution of proposed semblance, conventional semblance, and AB semblance with a synthetic CMP gather. As shown in Figure 4a, we generated a CMP gather with the class-II AVO anomalies [] by the inverse normal moveout, where the AVO anomalies have the polarity reversal seismic amplitudes. We performed NMO corrections with a series of scanning velocities, and calculated the different semblance spectra on the NMO-corrected data. Then, we picked the velocity values corresponding to the peaks in semblance spectra. Figure 4b shows the conventional semblance of the synthetic CMP gather, in which the solid line represents the picked velocities. It can be seen that the energy clusters of conventional semblance were lost in the AVO regions (time 1.5 s to 3.0 s), resulting in inaccurate velocity picking. Figure 4c shows that the energy clusters of the AB semblance were restored in the AVO regions. However, the size of the energy cluster became larger, indicating a drop in resolution. Figure 4d shows that the resolution of our new method is significantly improved, which is of great benefit to avoiding the multiplicity of the auto-picking algorithm, and the energy clusters of new method are also strong in the AVO region.
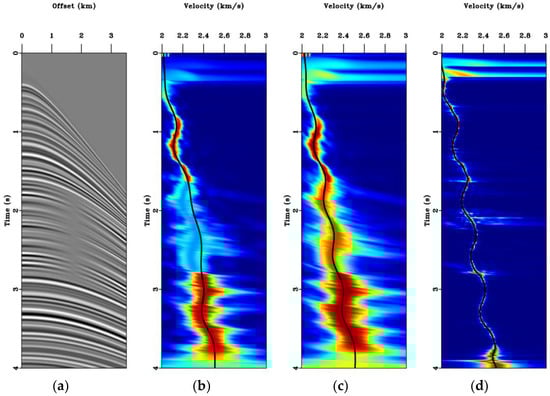
Figure 4.
Semblance spectra of the synthetic CMP gather with the class-II AVO anomalies. From left to right: (a) uncorrected CMP gather on which all methods of semblances were applied, (b) conventional semblance, (c) AB semblance, and (d) PCA-weighted semblance.
We applied each set of picked velocities to correct the movement of the synthetic CMP gather as a form of quality control. Figure 5 shows the velocity values picked up from different semblances, where the black curve represents the true values of velocities, the green curve represents the picked velocities from conventional semblance, the cyan curve represents the AB semblance, and the red curve represents our new method. It is clear that the picked velocities of conventional semblance had obvious errors in the AVO region. Conventional semblance is an incompetent method for the AVO phenomenon. The results of AB semblance show a significant improvement in dealing with the AVO phenomenon. However, the accuracy of AB semblance is inferior to the conventional method because the trend function of AB semblance is insensitive to the velocity. The red curve reveals that the proposed method has the highest accuracy compared with other methods, and its accuracy in the AVO region is still good. Figure 6 shows the NMO-corrected gathers by the picked velocities from different semblances. It can be seen that the NMO-corrected gather of the conventional method (Figure 6b) suffered from both over-correction and under-correction problems in the far-offset traces, especially for the AVO area. Clearly, the seismic events with the AVO anomalies were better flattened in the AB semblance (Figure 6c) compared with the conventional semblance. In the shallow region of NMO-corrected gather, Figure 6d shows that the seismic events were flattened completely, indicating that the new method can provide more accurate picked velocities to perform NMO correction.
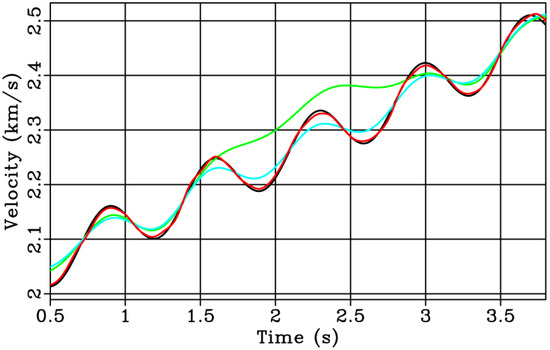
Figure 5.
Picked velocity values from different semblances, where the black curve represents the true values of velocities, the green curve represents the picked velocities from the conventional semblance, the cyan curve represents the AB semblance, and the red curve represents our new method.
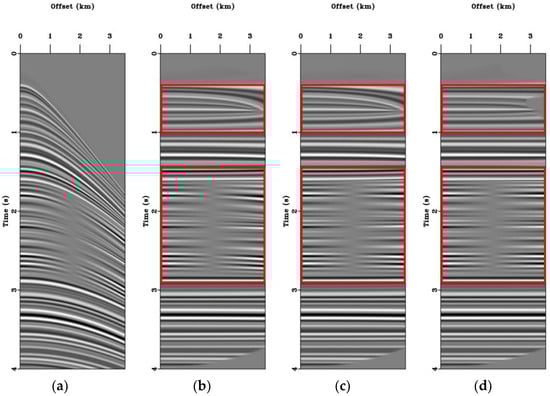
Figure 6.
NMO-corrected gathers using different picked velocities from the above semblances. From left to right: (a) uncorrected CMP gather, (b) NMO-corrected CMP using the picked velocities from the conventional semblance spectrum, (c) NMO-corrected CMP gather from the AB semblance spectrum, and (d) NMO-corrected CMP gather from the PCA-weighted semblance spectrum.
3.2. Field Data
We used a field seismic data set to verify the effectiveness of the proposed method. Firstly, we used a 2-D real-world seismic gather (Figure 7a) to apply the velocity analysis, and the corresponding semblance spectra are shown in Figure 7b–d. It can be seen that the proposed method has a high sensitivity in velocity scanning (Figure 7d) and the energy clusters in our new semblance were easy to be picked out, thus reducing the uncertainty of velocity analysis. The experiment with the 2-D real-world seismic gather proved that the proposed method is effective in the field data processing.
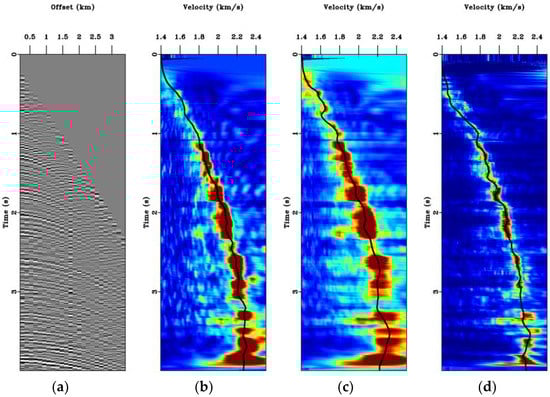
Figure 7.
2-D field data and the corresponding semblance spectra, where the solid curves in the semblance represent the picked velocities. From left to right: (a) uncorrected CMP gather on which all methods of semblance were applied, (b) conventional semblance, (c) AB semblance, and (d) PCA-weighted semblance.
To further verify the performance of the new method, we use a historic 2D line from the Gulf of Mexico [] to analyze the resolution of different semblances. As shown in Figure 8, the real-world data had 250 CMP points. We obtained different semblances under the same scanning parameters. Figure 9. shows the obtained semblances displayed with a 3-D form, it can be seen that the conventional semblance lost some energies in the shallow layer (Figure 9a), but the corresponding energies were recovered in the AB semblance (Figure 9b). Unfortunately, the peak broadening of the AB semblance spectrum led to picking uncertainty. Figure 9c shows the result of our new method, it can be seen that the resolution of the new method was significantly improved, and the intensity of energy cluster was stronger than that of the conventional method.
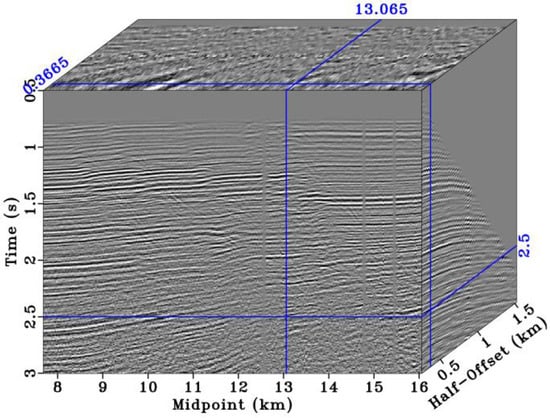
Figure 8.
A field data with 250 CMP gathers from the Gulf of Mexico.
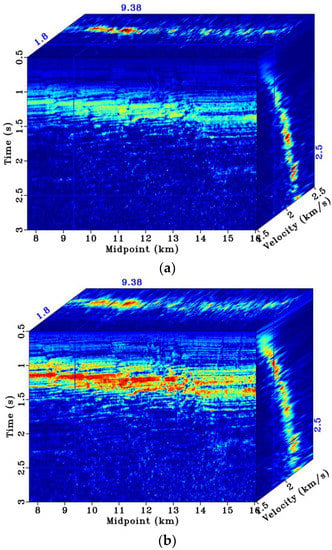
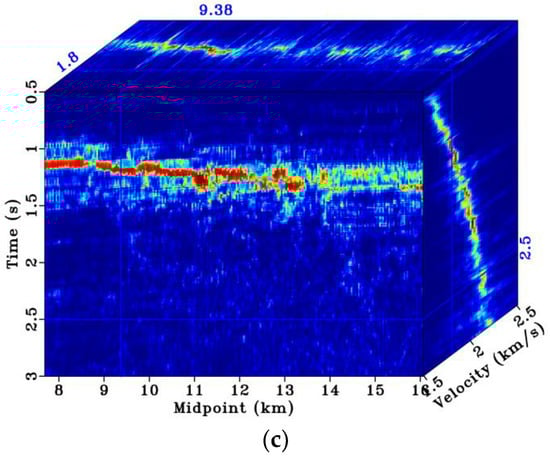
Figure 9.
Semblances of the field date from the Gulf of Mexico: (a) conventional semblance, (b) AB semblance, and (c) PCA-weighted semblance.
4. Conclusions
In this study, we present a new weighted semblance spectrum to improve the resolution of the NMO-based velocity analysis. The proposed method utilizes principal component analysis to measure the spatial coherence or low-rank property of the NMO-corrected data, and construct a new weighting function through the ratio between principal components (eigenvalues). The new weighting function was highly sensitive to slight changes of seismic events when we used different scanning velocities to apply NMO correction, so our method has higher resolution than the conventional method. In addition, the proposed method still performed well for the AVO anomalies, and the energy clusters of new semblance spectrum were also strong in the AVO region, which is of great benefit in avoiding the multiplicity of the auto-picking algorithm. Numerical experiments on the synthetic and field data sets also proved that the new method has a better performance in velocity analysis and provides more accurate picked velocities than those of conventional methods.
Author Contributions
Conceptualization, C.Z. and G.C.; methodology, C.Z. and G.C.; software, G.C.; validation, L.F.; investigation, L.F. and J.L.; writing—original draft preparation, C.Z. and G.C.; writing—review and editing, J.L.; project administration, C.Z.; funding acquisition, C.Z. All authors have read and agreed to the published version of the manuscript.
Funding
This research was funded by the Prospective and Basic Research Project of CNPC (2021DJ0503), the Strategic Priority Research Program of the Chinese Academy of Sciences (XDA14010403), the National Natural Science Foundation of China (No. 42172145), and the China National Science and Technology Major Project (2016ZX05007-002).
Institutional Review Board Statement
Not applicable.
Informed Consent Statement
Not applicable.
Data Availability Statement
The data presented in this study are available on request from the corresponding author.
Conflicts of Interest
The authors declare no conflict of interest.
Appendix A
The well-known Shuey approximation linearly approximates the offset dependence of seismic reflectivity. The Shuey approximation is expressed as
The residuals squared between corrected amplitudes and Shuey approximation model is
To find optimal approximation and , the derivatives of with respect to and are equal to zero:
Expanding and rearranging Equations (A3) and (A4), we get a system of two equations
If we express Equation (A5) in matrix form and rearrange it, we obtain
Solving for and , we get
and
Substituting Equations (A7) and (A8) into Equation (3) provides an explicit measure of the Shuey approximation. Then the AB semblance can be expressed as:
References
- Taner, M.T.; Koehler, F. Velocity spectra-digital computer derivation and applications of velocity functions. Geophysics 1969, 34, 859–881. [Google Scholar] [CrossRef]
- Neidell, N.S.; Taner, M.T. Semblance and other coherency measures for multichannel data. Geophysics 1971, 36, 482–497. [Google Scholar] [CrossRef]
- Mulder, W.A.; Kroode, A.P.E.T. Automatic velocity analysis by differential semblance optimization. Geophysics 2002, 67, 1184–1191. [Google Scholar] [CrossRef]
- Abbad, B.; Ursin, B.; Rappin, D. Automatic nonhyperbolic velocity analysis. Geophysics 2010, 75, u1–u12. [Google Scholar] [CrossRef]
- Fomel, S.; Landa, E. Structural uncertainty of time-migrated seismic images. J. Appl. Geophys. 2014, 101, 27–30. [Google Scholar] [CrossRef]
- Yilmaz, Ö.; Doherty, S.M. Seismic Data Analysis: Processing, Inversion, and Interpretation of Seismic Data; Society of Exploration Geophysicists: Oklahoma City, OK, USA, 2001. [Google Scholar]
- Luo, S.; Hale, D. Velocity analysis using weighted semblance. Geophysics 2010, 77, U15–U22. [Google Scholar] [CrossRef]
- Larner, K.; Celis, V. Selective-coherence velocity analysis. Geophysics 2007, 21, U11. [Google Scholar] [CrossRef]
- Chen, Y.; Liu, T.; Chen, X. Velocity analysis using similarity-weighted semblance. Geophysics 2015, 80, A75–A82. [Google Scholar] [CrossRef]
- Khoshnavaz, M.J. High-resolution seismic velocity analysis by sign-based weighted semblance. Geophysics 2021, 86, U135–U143. [Google Scholar] [CrossRef]
- Tang, Y.; Biondi, B. Subsalt velocity estimation by target-oriented wave-equation migration velocity analysis: A 3D field-data example. Geophysics 2013, 78, U19–U29. [Google Scholar] [CrossRef]
- Li, W.; Shingyu, L.; Qian, J. A level-set adjoint-state method for crosswell transmission-reflection traveltime tomography. Geophys. J. Int. 2014, 199, 348–367. [Google Scholar] [CrossRef]
- Chen, G.; Peng, Z.; Li, Y. A framework for automatically choosing the optimal parameters of finite-difference scheme in the acoustic wave modeling. Comput. Geosci. 2022, 159, 104948. [Google Scholar] [CrossRef]
- Virieux, J.; Operto, S. An overview of full-waveform inversion in exploration geophysics. Geophysics 2009, 74, WCC1–WCC26. [Google Scholar] [CrossRef]
- Chen, G.; Wang, Z. Robust full-waveform inversion based on particle swarm optimization. In SEG Technical Program Expanded Abstracts 2017; Society of Exploration Geophysicists: Oklahoma City, OK, USA, 2017; pp. 1302–1306. [Google Scholar]
- Biondi, B.L.; Kostov, C. High-resolution velocity spectra using eigenstructure methods. Geophysics 1989, 54, 832–842. [Google Scholar] [CrossRef][Green Version]
- Abbad, B.; Ursin, B. High-resolution bootstrapped differential semblance. Geophysics 2012, 77, U39–U47. [Google Scholar] [CrossRef]
- Liu, G. High-resolution velocity analysis based on normalized bootstrapped differential semblance. Geophys. Prospect. Pet. 2014, 53, 530–536. [Google Scholar]
- Wilson, H.; Gross, L. Amplitude variation with offset-friendly bootstrapped differential semblance. Geophysics 2017, 82, V297–V309. [Google Scholar] [CrossRef]
- Key, S.C.; Smithson, S.B. New approach to seismic-reflection event detection and velocity determination. Geophysics 1990, 55, 1057–1069. [Google Scholar] [CrossRef]
- Ebrahimi, S.; Kahoo, A.R.; Chen, Y.; Porsani, M. A high-resolution weighted AB semblance for dealing with amplitude-variation-with-offset phenomenon. Geophysics 2017, 82, V85–V93. [Google Scholar] [CrossRef]
- Ebrahimi, S.; Kahoo, A.R.; Porsani, M.J.; Kalateh, A.N. Obtaining high-resolution velocity spectra using weighted semblance. Exploration. Geophysics 2017, 48, 210–218. [Google Scholar]
- Chen, G.; Yan, Z.; Wang, Z. High-resolution PCA-weighted semblance with friendly AVO phenomenon. SEG Technical Program Expanded Abstracts. In Proceedings of the 2018 SEG International Exposition and Annual Meeting, Anaheim, CA, USA, 14–19 October 2018. [Google Scholar]
- Gan, S.; Wang, S.; Chen, Y. Velocity analysis of simultaneous-source data using high-resolution semblance—Coping with the strong noise. Geophys. J. Int. 2016, 204, 768–779. [Google Scholar] [CrossRef]
- Deng, P.; Chen, Y.; Zhang, Y. Weighted stacking of seismic AVO data using hybrid AB semblance and local similarity. J. Geophys. Eng. 2016, 13, 152–163. [Google Scholar] [CrossRef]
- Rutherford, S.R.; Williams, R.H. Amplitude-versus-offset variations in gas sands. Geophysics 1989, 54, 680–688. [Google Scholar] [CrossRef]
- Sarkar, D.; Baumel, R.T.; Larner, K.L. Velocity analysis in the presence of amplitude variation. Geophysics 2002, 67, 1664–1672. [Google Scholar] [CrossRef]
- Fomel, S. Velocity analysis using AB semblance. Geophys. Prospect. 2009, 57, 311–321. [Google Scholar] [CrossRef]
- Bro, R.; Smilde, A.K. Principal component analysis. Anal. Methods 2014, 6, 2812–2831. [Google Scholar] [CrossRef]
- Shlens, J. A tutorial on principal component analysis. arXiv 2014, arXiv:1404.1100. [Google Scholar]
- Jolliffe, I.T.; Cadima, J. Principal component analysis: A review and recent developments. Philos. Trans. R. Soc. A Math. Phys. Eng. Sci. 2016, 374, 20150202. [Google Scholar] [CrossRef]
Publisher’s Note: MDPI stays neutral with regard to jurisdictional claims in published maps and institutional affiliations. |
© 2022 by the authors. Licensee MDPI, Basel, Switzerland. This article is an open access article distributed under the terms and conditions of the Creative Commons Attribution (CC BY) license (https://creativecommons.org/licenses/by/4.0/).