Article

Drift Potential Characteristics of a Flat Fan Nozzle: A Numerical and Experimental Study

1
Mechanical and Electrical Engineering College, Hainan University, Haikou 570228, China
2
School of Information and Communication Engineering, Hainan University, Haikou 570228, China
3
College of Electronic Engineering, South China Agricultural University, Guangzhou 510642, China
4
Department of Biological and Agricultural Engineering, Texas A&M University, College Station, TX 77845, USA
*
Authors to whom correspondence should be addressed.
Appl. Sci. 2022, 12(12), 6092; https://doi.org/10.3390/app12126092
Submission received: 11 May 2022 / Revised: 10 June 2022 / Accepted: 13 June 2022 / Published: 15 June 2022

Abstract

:
This study explores the drift potential characteristics of a flat fan nozzle. The atomization and drift characteristics of fan-shaped pressure nozzles were studied at a spraying height of 0.6 m and a lateral wind speed of 0–6 m/s through a combination of computational fluid dynamics (CFD) analyses and wind tunnel experiments. The nozzle Lu 120-03 had a spraying pressure of 0.3 MPa. The results show that as the wind speed varies from 0 m/s to 6 m/s, the spray droplet spectrum also changes, and the droplet volume medium diameter increases. The cumulative droplet ratio and droplet spectral width of M oscillate within certain ranges. The amount of spray drift increases at higher wind speeds. The concentration of droplet deposition on the bottom of the wind tunnel gradually spreads downward in the wind direction. The determination coefficient R2 of the straight-line fitting of the drift characteristics is 0.982, which is highly consistent with the CFD simulation results. A CFD simulation-assisted wind tunnel test method, which is more convenient and repeatable than traditional field tests, is proposed to analyze the droplet spectrum and drift of Lechler series nozzles. The program can accurately simulate the actual drift and provide theoretical and data support for the optimization of atomization and drift characteristics of several types of flat fan nozzles under different spraying pressures and crosswinds in practical applications.

1. Introduction

Spraying pesticides in agricultural fields can prevent diseases and infestation as well as improve crop yield [1]. The effectiveness of pesticide spraying is influenced by various factors, including the spraying environment, spraying method, liquid properties, and the operator’s sense of responsibility [2,3]. Different operational methods and environments have different effects on spraying. In fact, spraying pesticides under inappropriate conditions can cause the floating loss of the therapeutic liquid to exceed the reasonable range and damage the drug (pesticide). In China, fast-paced technological developments have been made related to the aerial application of pesticides in the agriculture sector. This technology has been adopted as a way to improve pesticide utilization efficiency and reduce the concentration of residues and pollutants, which has garnered considerable research interest [4,5]. In this study, we mainly focus on the influence of wind speed on spraying.
Field tests [6,7,8,9,10,11,12,13,14], laboratory tests, bench tests [15,16,17,18,19], wind tunnel tests [20,21,22,23], and computational fluid dynamics (CFD) analyses [24] are common methods for measuring the drift potential characteristics of nozzles. Field tests are the most widely used methods, although their environmental impact and repeatability are poor. Wind tunnel tests and CFD modeling offer higher repeatability and minor environmental impact. Hence, they are being increasingly used to detect droplet drift characteristics. Teske et al. [25] studied the effects of a rotary atomizer in an open wind tunnel at the University of Queensland, Australia. Kirk [26] fitted the droplet size of CP-series nozzles by varying the pipe pressure, wind speed, and nozzle installation angle. Fritz et al. [27,28] studied droplet-size distribution under high- and low-speed conditions based on the aviation application wind tunnel at the Agricultural Aviation Research Center of the U.S. Department of Agriculture. Martin et al. [29] also used a wind tunnel to study the droplet-distribution law of electrostatic spray under different wind speeds. Fujie et al. [30] studied the droplet spectrum, relative distribution span, drift amount, and drift potential index of four nozzles by employing a polyethylene collection line and a Spraytec droplet-size meter (Malvern Panalytical Ltd., Malvern, UK). Using a wind tunnel test at the University of Queensland (Brisbane, QLD, Australia), Huichun et al. [31] studied the effects of wind speed, nozzle structure and model, reagent, and sampling distance on the droplet drift. These researchers established a multivariate nonlinear droplet-drift-characteristic model including the above four factors and provided a quantitative standard for judging the level of the nozzle’s droplet spectrum. Qing et al. [32] studied the atomization characteristics of standard fan-shaped and air-induced nozzles with high-speed airflow via experiments at the Xiaotangshan precision agriculture demonstration base of the Beijing Academy of Agricultural and Forestry Sciences. They studied the spraying characteristics of the nozzles through experiments and obtained test results under certain conditions. However, their study did not include any theoretical research on the fluids coupled with the spraying liquid and air during spraying.
Dekeyser et al. [2] studied the plume distribution and incidental airflow of several common nozzles by combining laboratory tests and CFD simulations. They proved that the liquid distribution was directly related to the generated airflow. By considering the tree structure, canopy airflow, and sprayer movement, Duga [33] established a three-dimensional (3D) CFD model to evaluate the spray deposition and drift of orchard sprayers and validated the drift measurement of apple orchards with different nozzle configurations. Hong et al. [34] developed an integrated CFD model to predict the velocity distribution inside and around the canopy of an air-assisted pesticide sprayer and compared it with the actual test results. It was found that the simulation reasonably predicted the air distribution of the air-assisted sprayer. Jie et al. [35] established the droplet trajectory and deposition model of a self-made wind sprayer. They explored the droplet deposition characteristics and the influence of the air supply direction on droplet deposition. According to the size parameters of the sprayer, a two-dimensional model of the spray flow field was established. Additionally, the parameters of a discrete-phase model (DPM) were determined, and the droplet deposition on a vertical section at different distances from the nozzle was simulated. Finally, Xuemei et al. [36] studied the interaction between the continuous and discrete-phases of a droplet particle swarm under the influence of natural wind, auxiliary air curtain stress, and self-gravity. However, the authors did not combine spray tests with fluid mechanics to study the connection between numerical simulation and specific tests.
While some researchers conducted experiments with wind tunnel tests to demonstrate the atomization and drift characteristics of different nozzles, others codified the spray effect with CFD. However, few have combined wind tunnels and CFD analysis to verify the accuracy of the results, explore the intrinsic mechanism of deposition drift, or visualize the results of the drift. This study analyzes the droplet spectrum and drift potential characteristics in the spraying process through combined CFD simulations and wind tunnel tests, using Lechler series Lu 120-015 and Lu 120-03 sector pressure nozzles. The simulation was executed by inputting the appropriate model physics and condition parameters in a CFD program. Subsequently, the obtained results were verified and compared through a wind tunnel test, and the findings were interpreted to provide guidance for practical operation.

2. Model Construction and Numerical Simulation

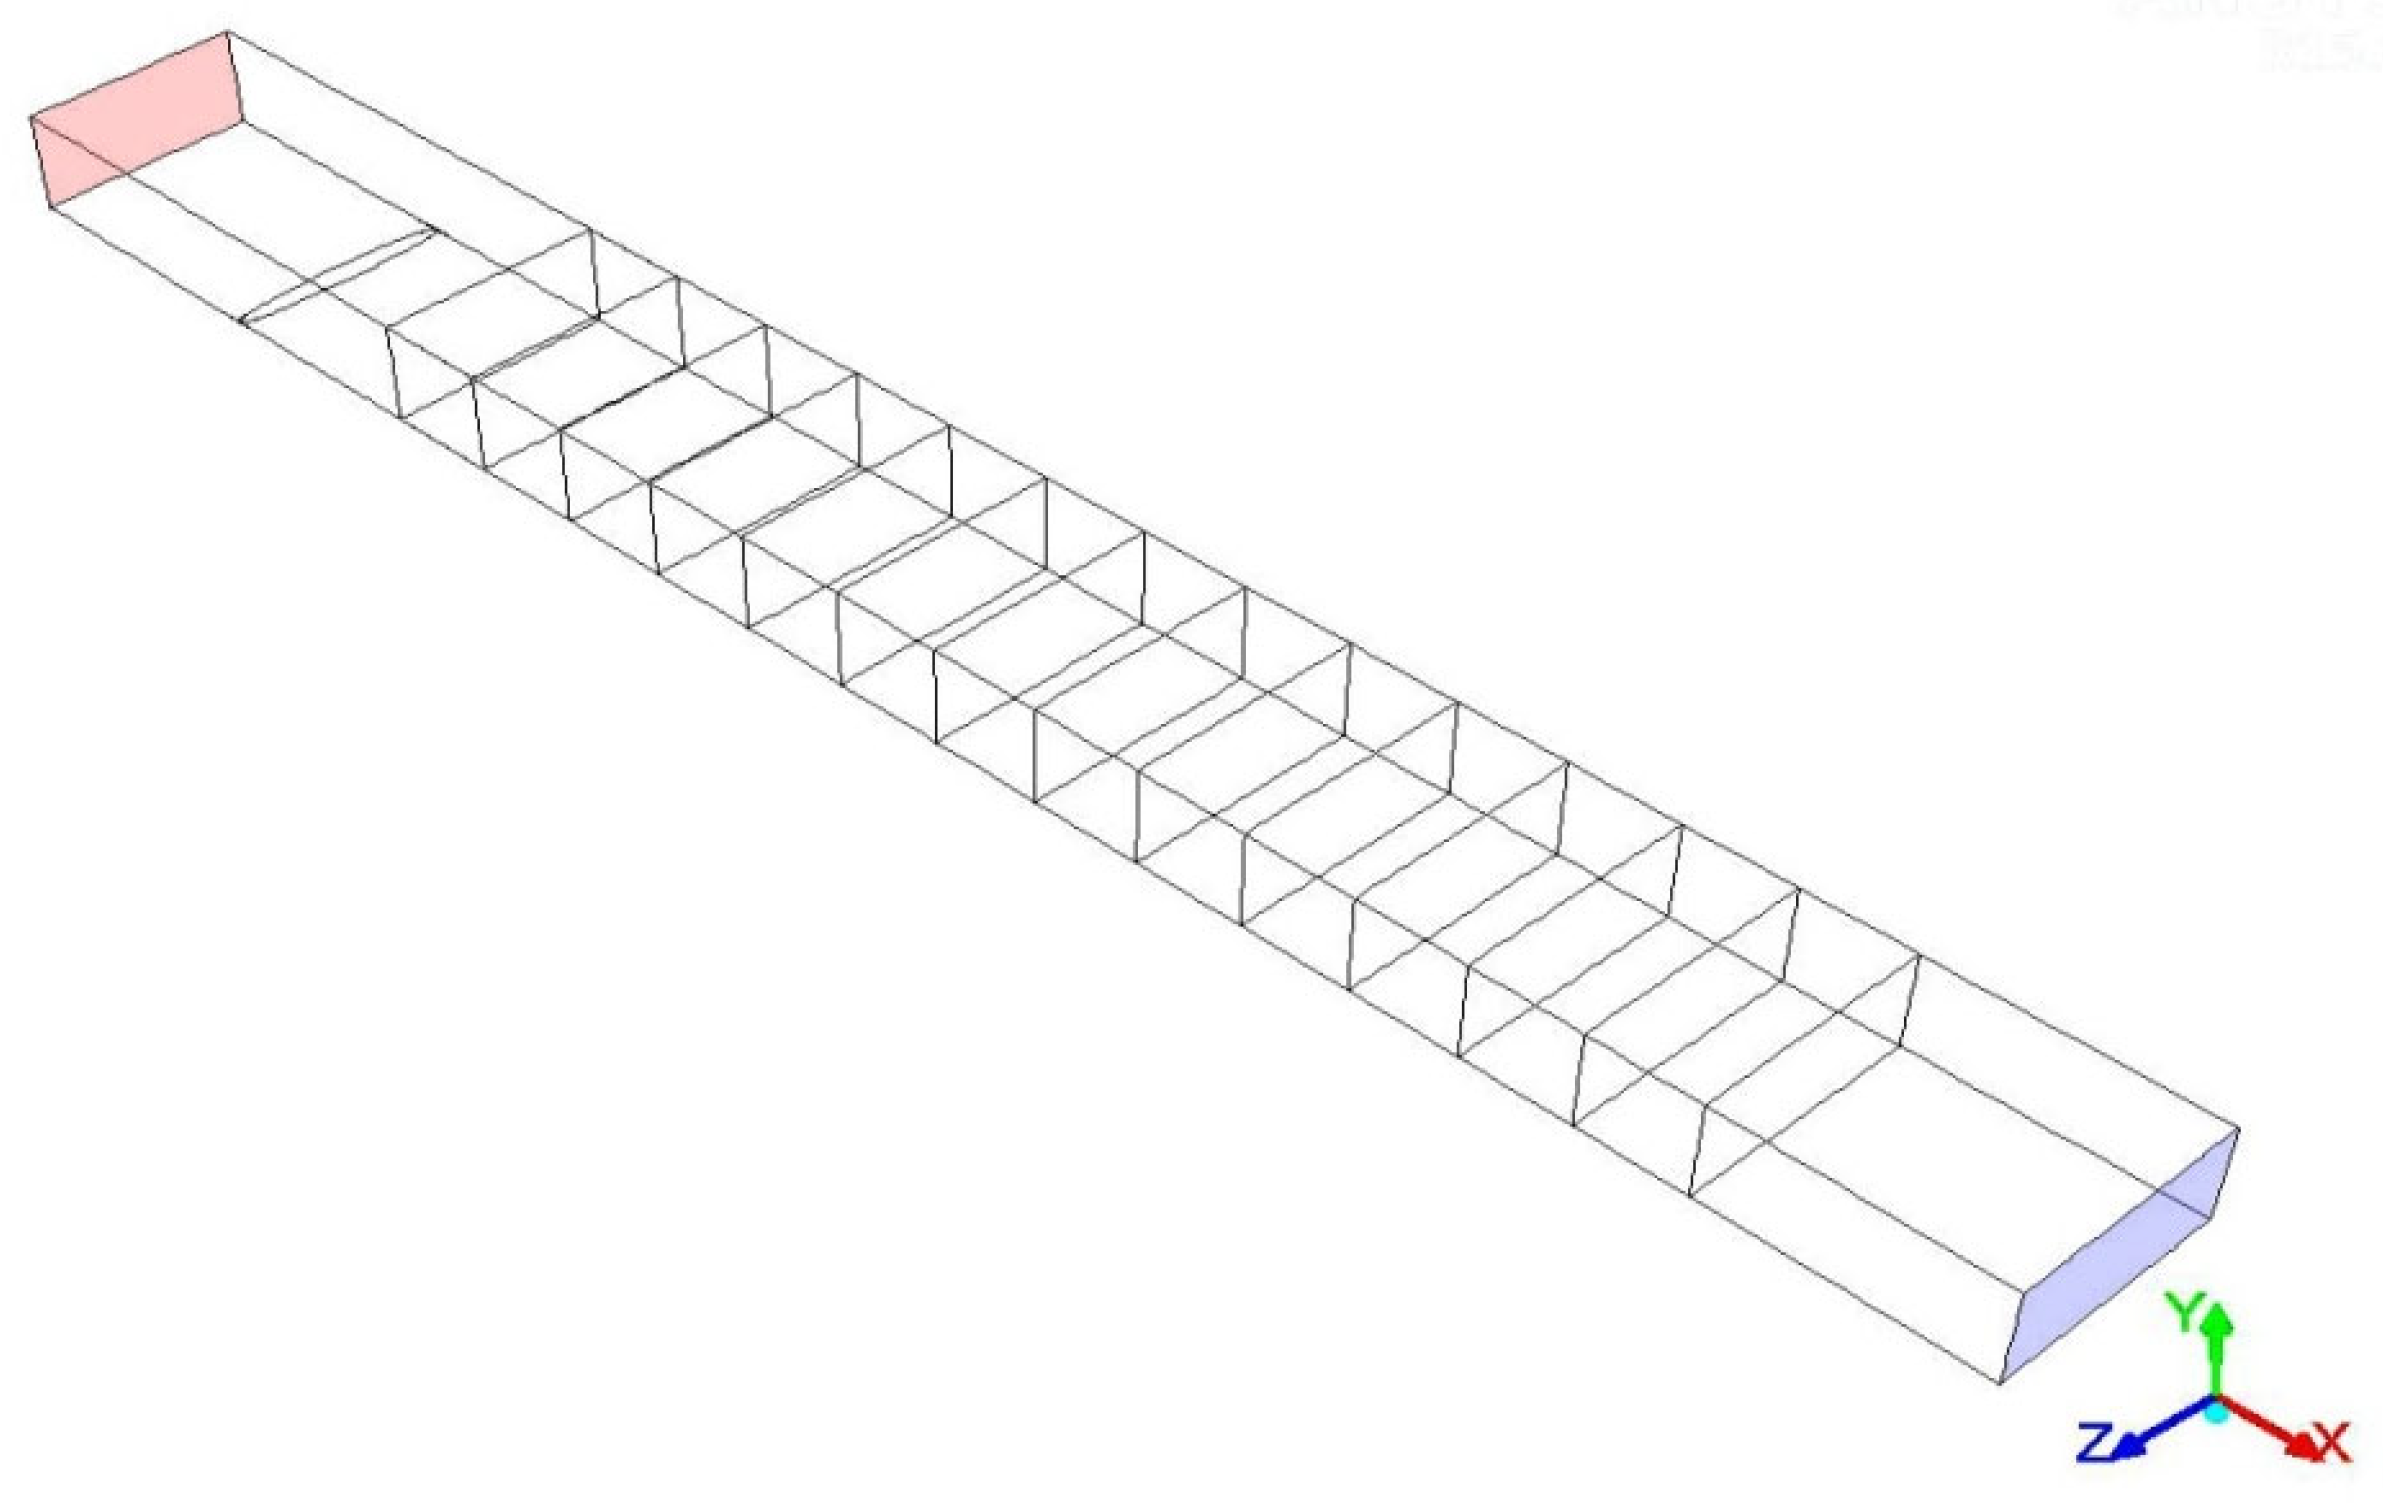
2.1. Geometric Model Establishment and Mesh Generation

Figure 1 illustrates the computational domain, which is a box with a length, width, and height of 20 m (X: −2.5: +17.5 m), 2 m (Z: −1: +1 m), and 1.1 m (Y: 0: 1.1 m), respectively. A thin and long elliptical surface Aface was constructed at the bottom of the computational domain, with the origin (0, 0, 0) as the center, for the accurate deposition of statistical droplets. The surface Aface is an ellipse with the center of the nozzle axis as its center. The Equations (1)–(3) correspond to a, b, and Aface, respectively. The deposition surface is parallel to the height of the spray port from L.
a = L × tan ( θ 1 + θ 2 )
b = L × tan ( arctan l a l b + θ 2 )
A face = π a b
where a is the semi-major axis of the accurate deposition area, b is the semi-minor axis of the accurate deposition area (m), Aface is the accurate deposition area of droplets (m2), θ1 is the spray half-angle (°), θ2 is the spray diffusion angle (°), L is the height of the sedimentary surface (m; here, L = 0.6 m), la is the semi-minor axis of the nozzle (mm; here, la = 0.095 mm), and lb is the distance from the virtual origin to the nozzle (mm; here, lb = 1.2 mm).
Meanwhile, multiple surfaces were established with an equal spacing of 1 m, for X between 2 m and 15 m in the computational domain, to divide the droplet deposition surface. The grid was divided into tetrahedrals for the computational domain, and the total number of network division units was 300,000.

2.2. Numerical Calculation Model

2.2.1. Continuous Phase-Model Selection

We adopted a transient simulation based on pressure for the numerical simulation model and the standard k–ε model proposed by Launder and Spalding [37] for the continuous phase turbulence model. The k–ε model is the most widely used two-equation turbulence model and can be used to calculate complex turbulent flows. For example, it can better predict flat wall boundary layer flow, channel flow, flow in nozzle, two-dimensional and three-stage non-rotating and weakly rotating added flow, etc. The near-wall treatment method is the standard wall function.

2.2.2. Discrete-Phase Model Selection

The discrete-phase-droplet transport equation is solved using the Euler–Lagrange method proposed by Crowe and Smoot [38]. Equation (4) is the discrete-phase particle motion equation, expressed as:
d u p d t = 18 μ ρ p d p 2 C D R e 24 ( u u p ) + g x ( ρ p ρ ) ρ p + 1 ρ d 2 ρ p d t ( u u p )
where u is the continuous phase velocity (m/s) ,   u p is the particle velocity (m/s), ρp is the particle density (kg/m3), dp is the particle diameter (m), gx is the acceleration due to gravity (m/s2), and CD is the coefficient of drag. Re is the relative Reynolds number calculated as follows:
R e = ρ v d / µ
where v is the velocity (m/s), ρ is the density (kg/m3), μ is the viscosity coefficient of the fluid (Pa·s), and d is a characteristic length.
The flat fan atomizer model was adopted for the nozzle model, and the linearized unstable liquid film atomization model proposed by Schmidt et al., was adopted for the atomization fragmentation model. The spray simulation considers droplet collision and aggregation in the discrete-phase to determine droplet merging and rebound, mainly based on the critical value obtained by Rourke [39]. The critical value is a function of the collision Weber number, radii of the droplets, and the collection droplets:
b c r i t = ( r 1 + r 2 ) m i n ( 1.0 ,   2.4 f W e ) ,
where bcrit is the critical value for judging droplet collision, merging, or rebound (m). r1 and r2 are the small droplet radii (m), and f is a function of r1/r2. We is the collision Weber number:
W e = ρ v 2 l / σ
where ρ is the fluid density (kg/m3), v is the characteristic flow rate, l is the characteristic length, and σ is the surface tension coefficient of the fluid.
The Taylor Analogy Breakup (TAB) model was selected as the droplet collision secondary fragmentation model. ANSYS Fluent offers four droplet breakup models: the TAB, Wave, KHRT, and Stochastic Secondary Droplet (SSD) models. The TAB model is recommended for low-Weber-number injections and is well suited for low-speed sprays into a standard atmosphere. For Weber numbers greater than 100, the Wave model is more applicable. The KHRT offers a transition between both application areas because it considers the competing effects of aerodynamic breakup and instabilities due to droplet acceleration. It is combined with the Levich model for the liquid core length. The Wave and KHRT models are popular for use in high-speed fuel-injection applications. The SSD model treats breakup at high Weber numbers as a discrete random event resulting in a distribution of diameter scales over a range. The choice of model depends on the relative importance of momentum and surface tension in the droplet breakup.

2.2.3. Test Parameter Setting

(1)
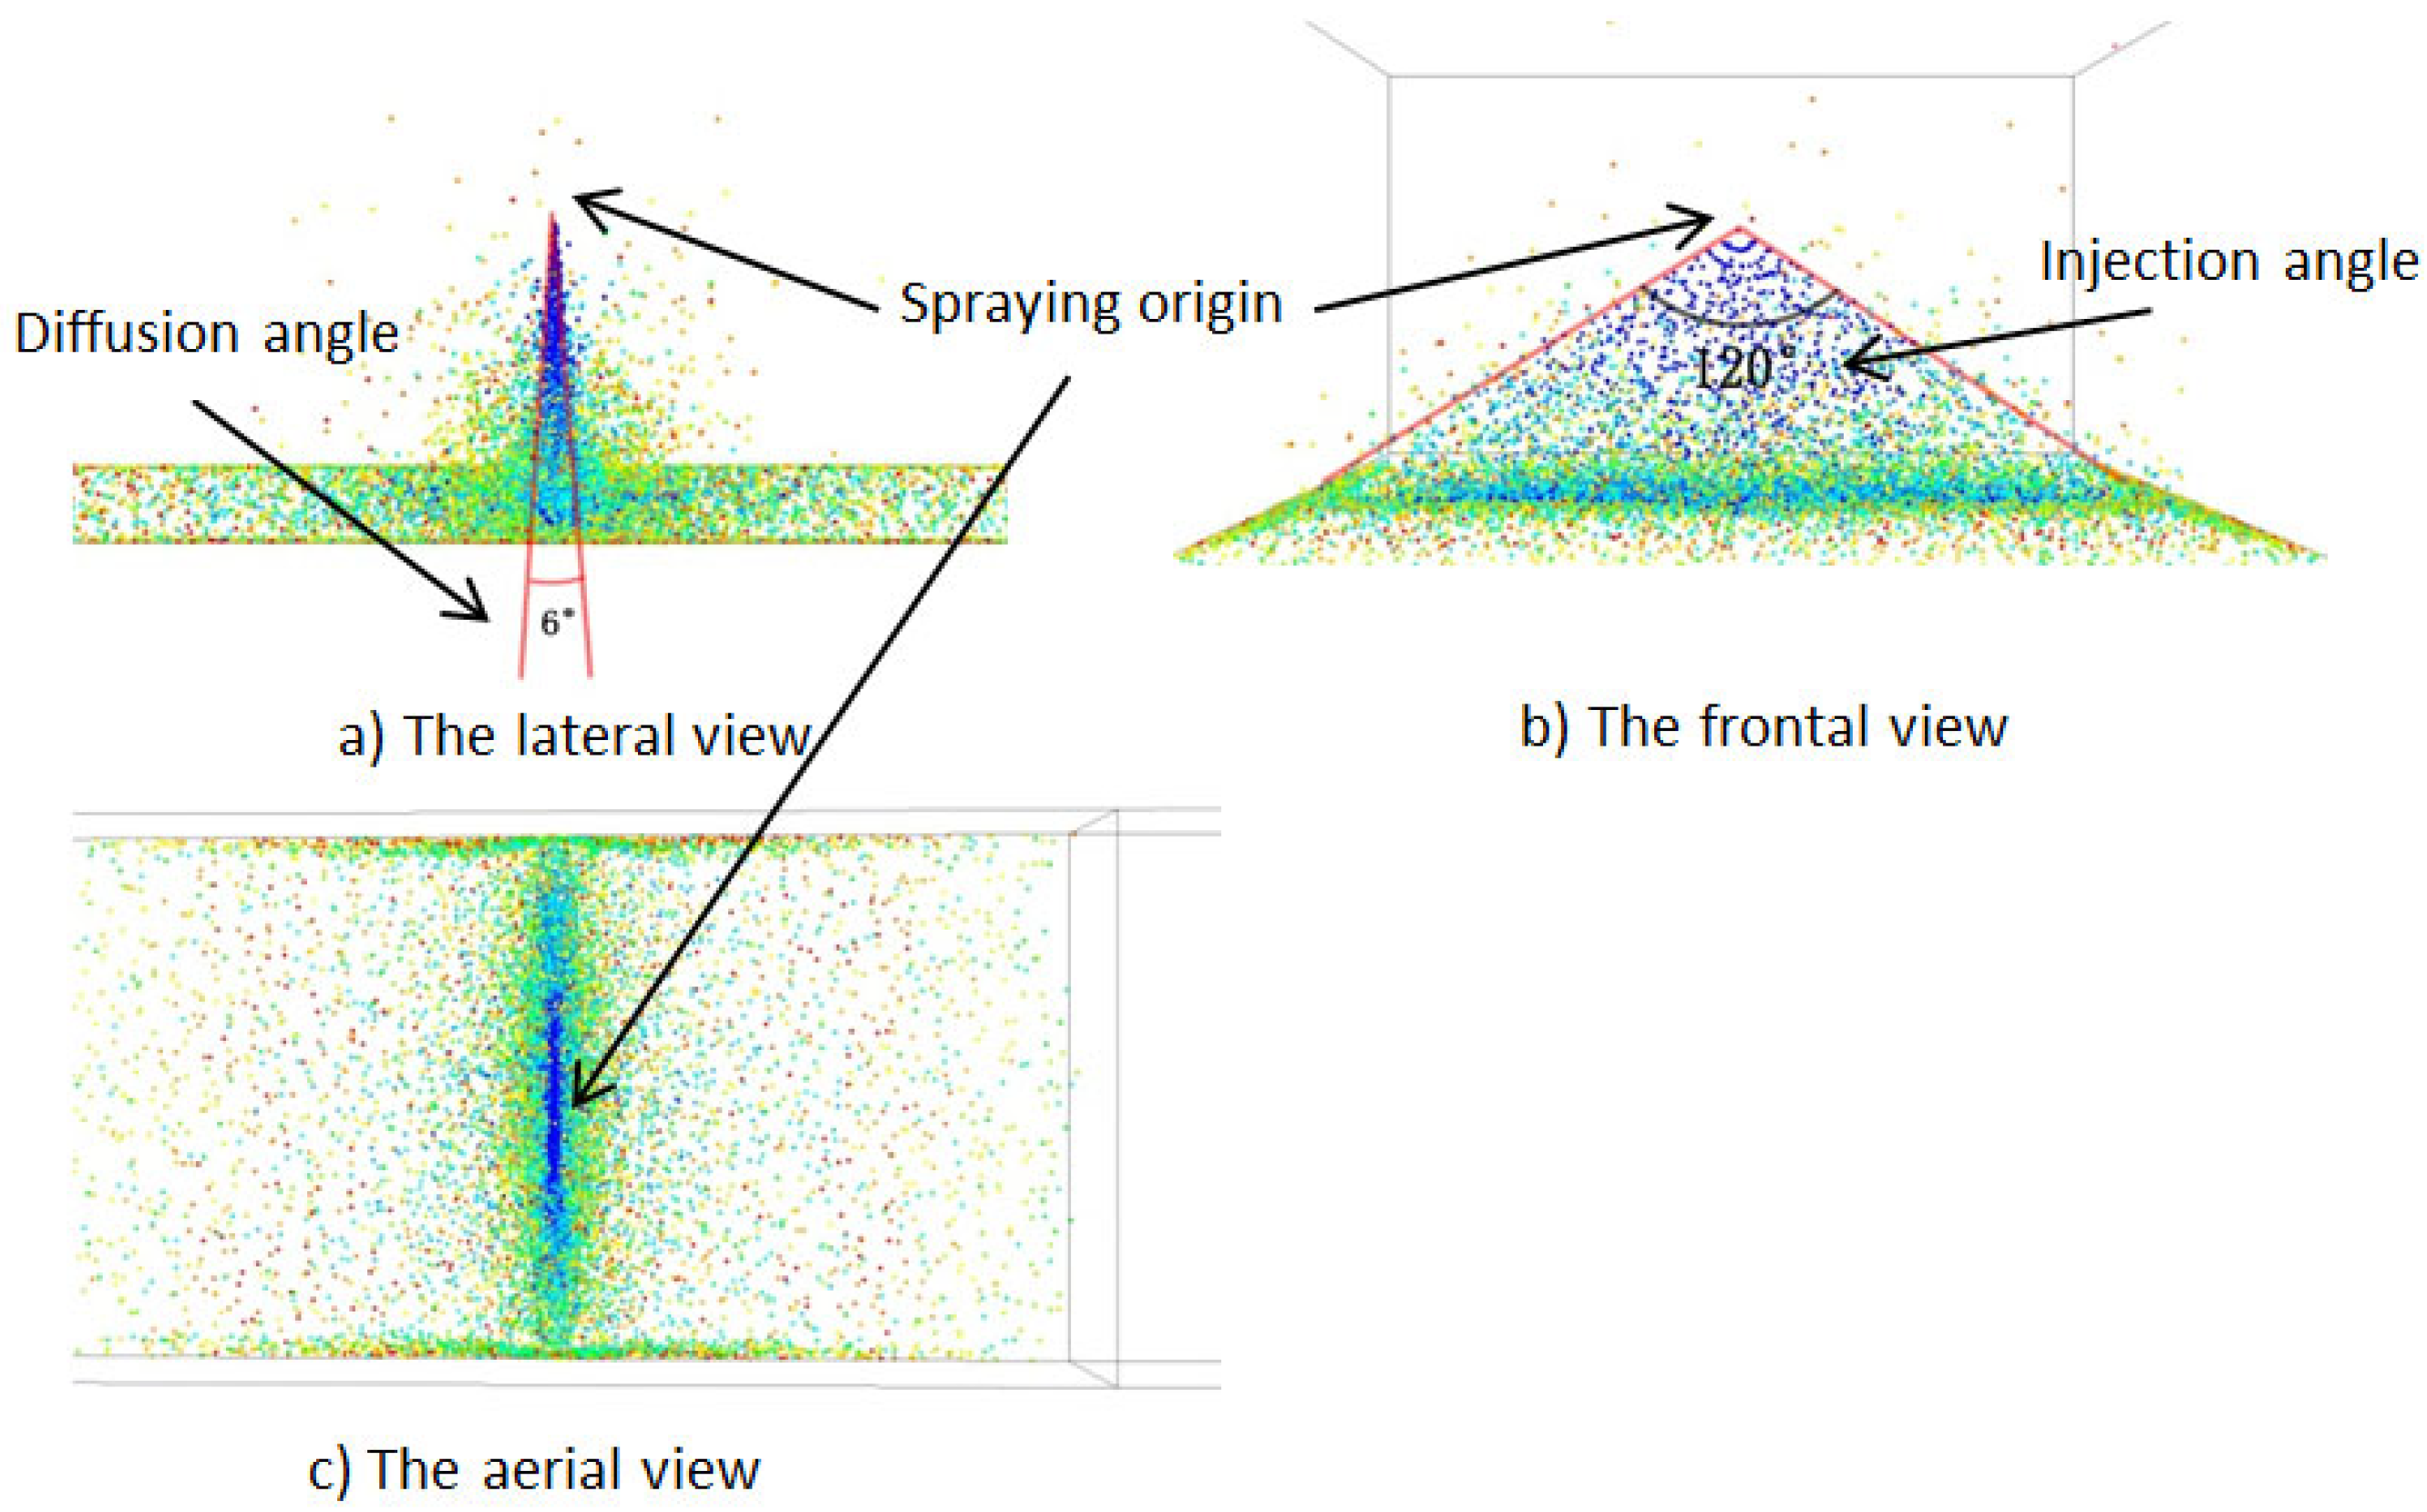
Discrete-phase-injection source parameters: The discrete-phase material was water, and the discrete-phase-release position coordinates were (x, y, z) = (0, 0.6, 0). The axial vector component of the nozzle was (x, y, z) = (0, −1, 0). The droplet mass flow rate was 0.02 kg/s, the half angle of spraying was 60°, and the spray diffusion angle was 6°. Unsteady particle tracking was enabled, the discrete random walk model was adopted, and the particle release time scale constant was 0.01 s.
(2)
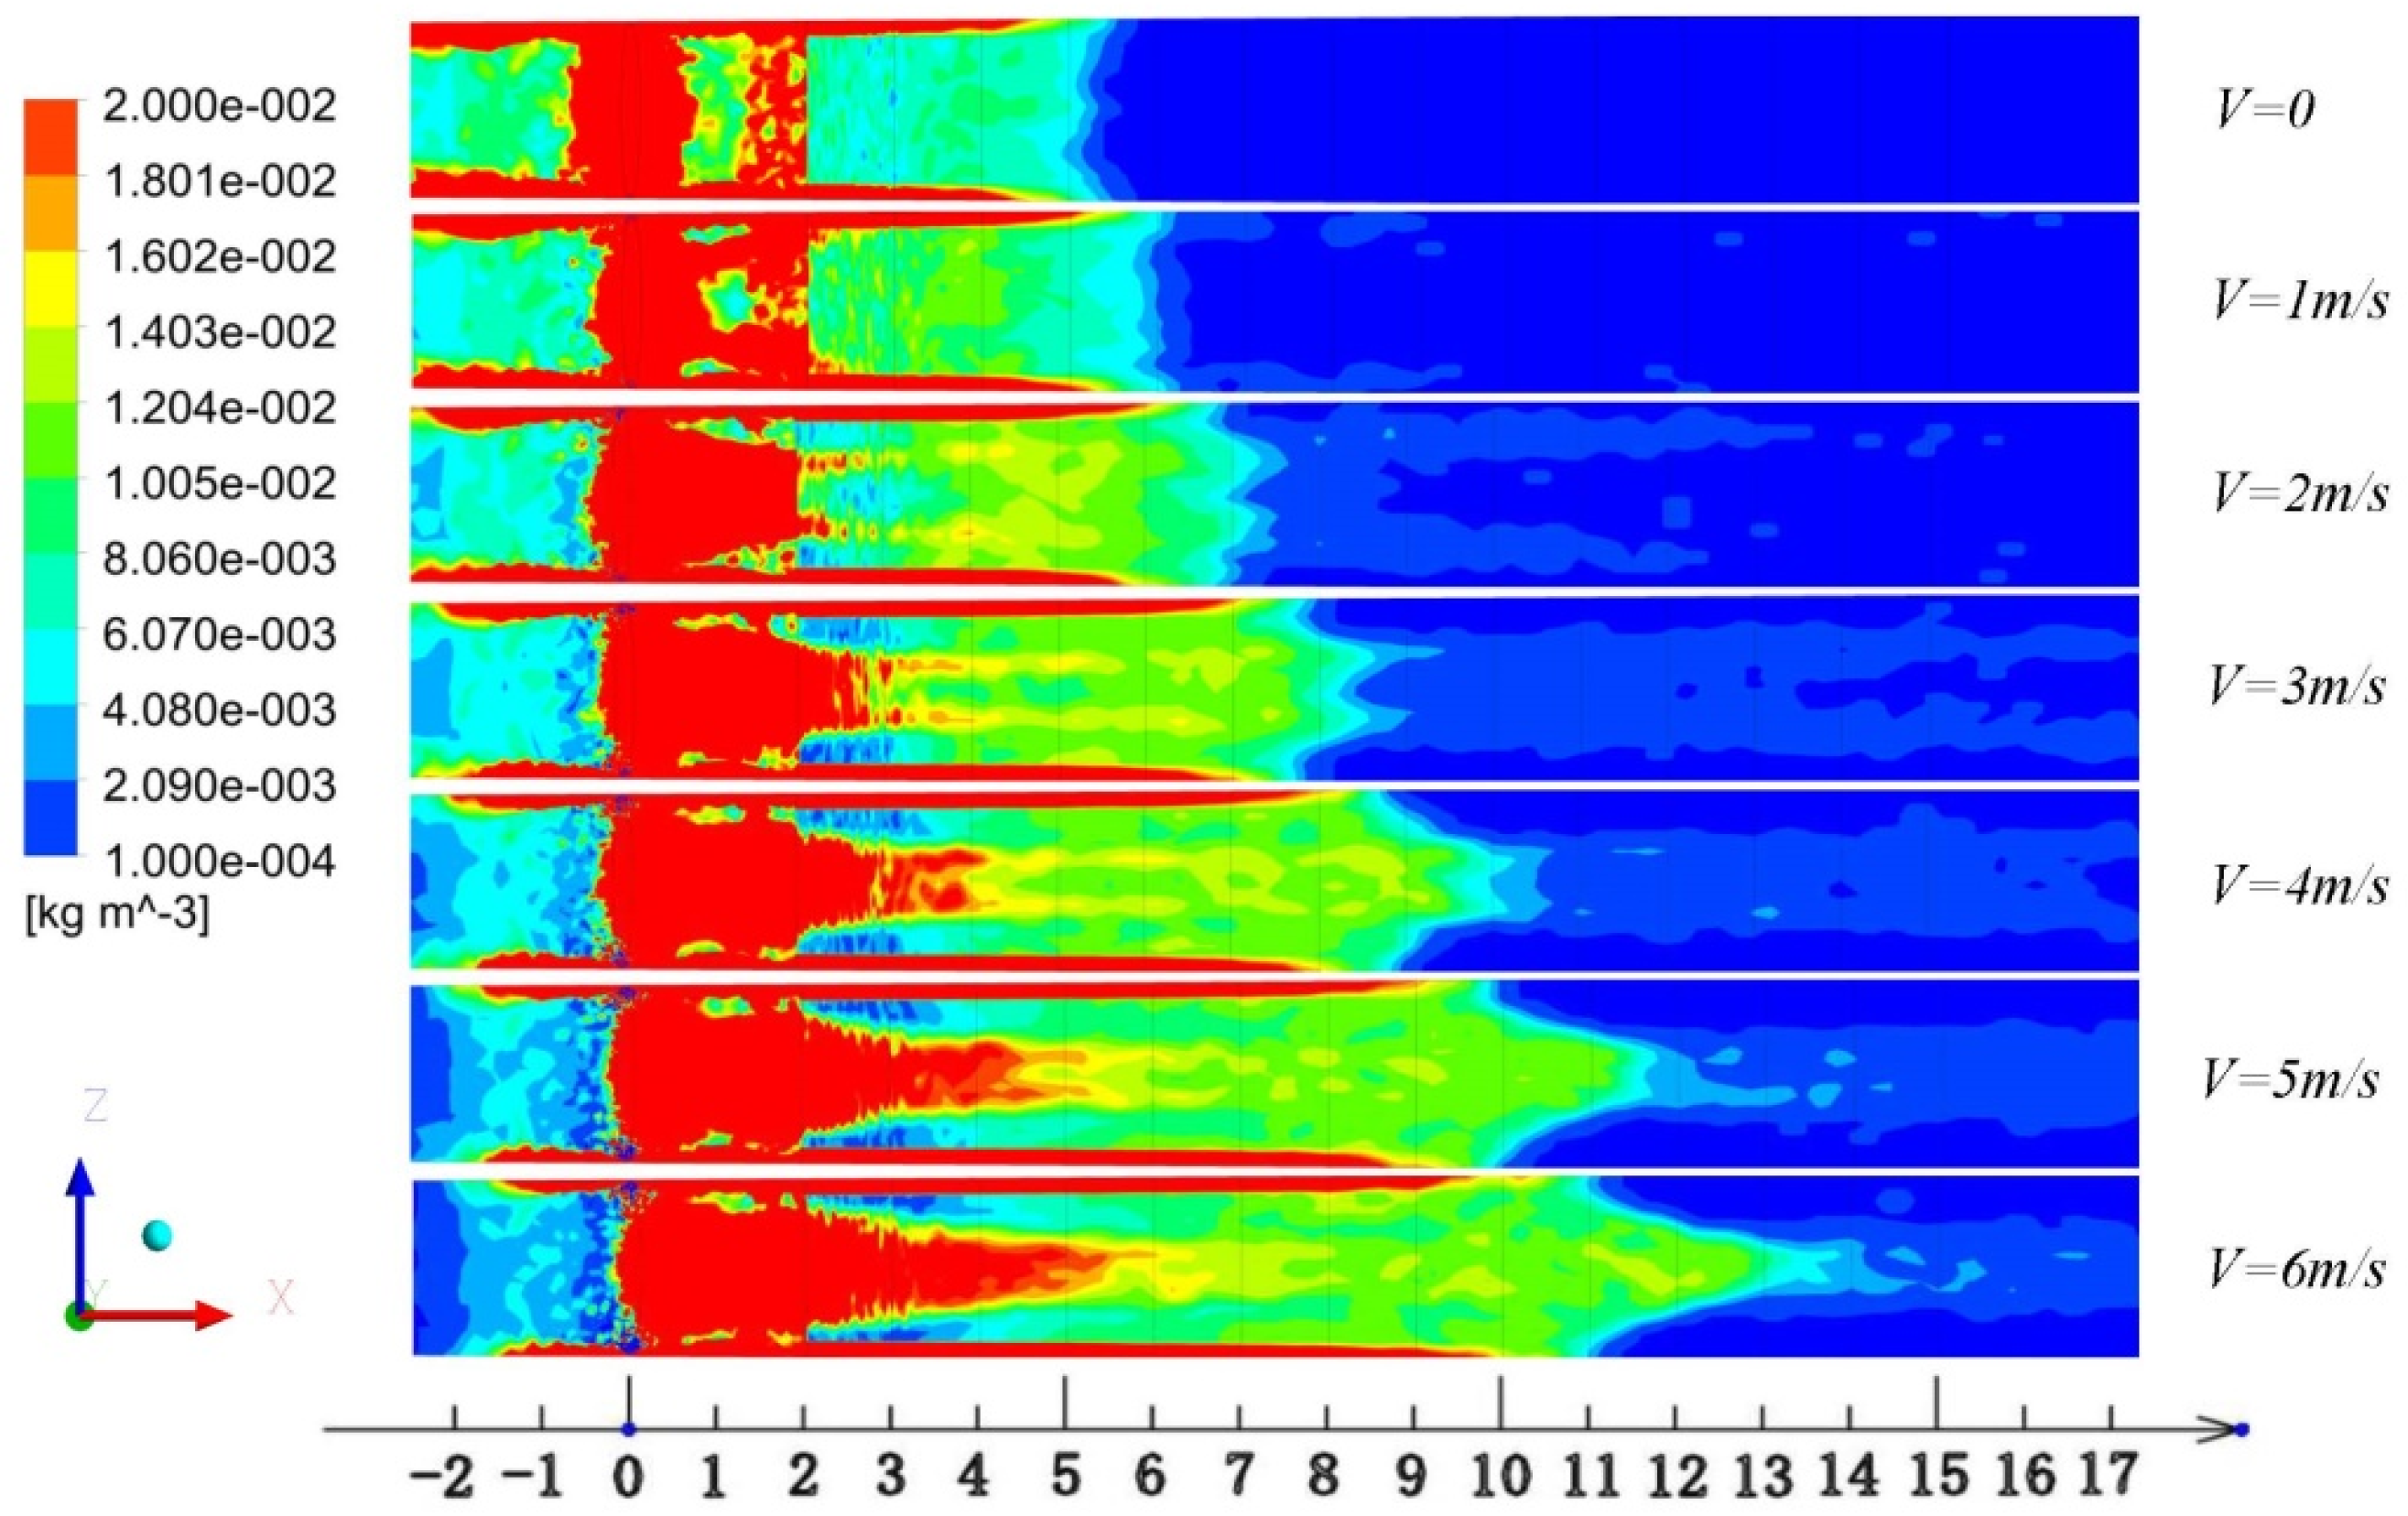
Boundary conditions: For the fluid boundary condition, x = −2.5, the plane of the box body area was the velocity inlet boundary, the velocities were 0 m/s, 1 m/s, 2 m/s, 3 m/s, 4 m/s, 5 m/s, and 6 m/s, respectively. The free outflow boundary plane corresponded to x = 17.5, and the other surfaces were the wall boundaries. For the DPM boundary condition type of discrete-phase, the fluid entered from the inlet and escaped from the outlet, the wall film was formed on the ground, and the rest of the boundary fluid mass was rebound. The material in the computational domain was set to ideal air.
(3)
Solution method and simulation parameters: The pressure velocity coupling mode was simple, the transient formula was second-order implicit, and the iterative time step was 0.01 s. When studying the influence of wind speed on droplet size, the simulated spraying time was 0.005 s. After spraying, the total particle-size distribution in the statistical flow field was delayed by 0.01 s, allowing for the full collision or polymerization of discrete particles in the air to occur. Simultaneously, the average flight length of discrete particles from the nozzle to the conventional droplet statistical position was 0.35 m. When studying the drift characteristics of droplet deposition, the simulated spray duration was 5 s.

2.3. Numerical Results

2.3.1. Computational Method

This study investigated the drift potential characteristics of a flat fan nozzle, including the influence of horizontal wind on droplet size and deposition drift characteristics, which are interrelated and inseparable, i.e., droplet size is an important factor affecting droplet deposition and drift. For the same volume of drug (pesticide), the number of droplets exponentially increases as the droplet size decreases, resulting in a significant increase in the deposition uniformity and penetration into the target plant. However, if the droplet is too small, it will be seriously affected by the environmental wind field. The evaporation and drift loss will increase during the deposition process on the target plant [40,41].
Commonly used droplet size indicators include droplet diameter Dv0.1 (μm) (with a cumulative droplet distribution of 10%), Dv0.5 (μm) (with a cumulative droplet distribution of 50%), and Dv0.9 (μm) (with a cumulative droplet distribution of 90%), also known as droplet volume median diameter. Additional indicators include a diameter of less than 100 μm, cumulative proportion of droplets V100 (%), and the index of droplet size distribution width or droplet spectrum width S calculated as:
S = ( D v 0.9 D v 0.1 ) / D V 0.5
The evaluation indices of droplet drift characteristics mainly included the characteristic height, h, of the drift distribution, droplet accurate-deposition rate, Ra, and droplet horizontal drift rate, Rh.

2.3.2. Simulated Droplet Parameters

To study the particle size characteristics of the discrete-phase, several discrete-phase particles were ejected from the nozzle for 0.005 s when ejecting 0.01 s. In the simulations, the actual droplet size distribution of particles (those passing through a particle sizer laser beam during the actual test) was approximated by the statistical size distribution of the beam particles released for a very short duration. The ground, with a deposition height of 0.6 m, was computed by a Fluent discrete-phase particle-statistics function, and then the droplet drift characteristics were calculated. The drift of the discrete-phase under different crosswind conditions was obtained through mass statistics of the discrete-phase deposited in rectangular blocks at different unit distances on the bottom.
The particle size results obtained by the numerical simulation of the discrete-phase under the influence of different lateral wind speeds are listed in Table 1.
Table 1 summarizes the particle parameters of the discrete-phases under seven equally spaced lateral wind speeds. Dv0.5 gradually increases with the increase in lateral wind speed. Dv0.1, Dv0.9, V100, and the droplet spectrum width oscillate within certain ranges.
As illustrated in Figure 2, when the wind speed at the air inlet is 0, the discrete-phase droplets of the nozzle are distributed on a fan-shaped surface with an injection angle of 120° and diffuse outward at a diffusion angle of 6°. Most discrete-phase particles were within the ellipse obtained by Equations (1)–(3), with the exception of a few disordered particles. The accurate deposition ratio Ra and horizontal drift rate Rh in the elliptical plane are depicted in Figure 3.
In Figure 3, the color scale represents the discrete-phase deposition mass concentration at different positions on the bottom of the wind tunnel. The color gradient from blue to red represents the increase in the mass concentration of discrete-phase deposition from 0 kg/m3 to 2 kg/m3. As indicated in Figure 3, in the absence of lateral wind, the simulated cloud map of the deposition mass concentration for the discrete-phase on the bottom surface is highly consistent with the area calculated by Equations (1)–(3). Because the intermediate region below the nozzle is directly sprayed and the middle of the nozzle is wide, a large amount of discrete-phase can be deposited. The deposition amount on the bottom gradually decreases from the center to both sides due to their narrow dimensions. In addition, the movement speed of spray droplets in the z-direction decreased as the spraying time increased. Overall, within the spraying range, the spray amount first increased and then decreased along the z-direction. Because the spray amplitude of the nozzle was greater than 2 m, the spray droplets on both sides collided with the sidewall and rebounded to the bottom, resulting in a high amount of droplet deposition.
Adjustment and selection exhibited an appropriate discrete-phase-deposition mass-concentration range. As depicted in Figure 4, the droplet horizontal drift increases with an increase in wind speed. As the inlet air velocity increases from 0 m/s to 6 m/s, the droplet horizontal drift becomes more obvious. The high-concentration deposition area gradually deviates from the spray axis (x = 0 m) and shifts downward in the wind direction. The boundary of the x-axis area, where the sediment mass concentration is greater than 0.008 kg/m3, ranges between 5 m and 13 m. Meanwhile, as illustrated in Figure 5, two narrow strips with high sediment concentrations at the junction of the bottom and two walls are observed for the sediment mass concentration of the discrete-phase in the downwind direction. A region of low sediment mass concentration appears at a distance of 0.1 m from the walls on both sides, which gradually elongates along the x-direction.
The airflow streamline graph reveals two parallel X.Y. flows passing through the fan spray surface from the entrance, with a vortex taller than the nozzle. The droplets rise and become smaller on both sides as they move closer to the central plane of the wind tunnel. Meanwhile, the discrete-phase droplet beam has a significant impact on the horizontal airflow, indicating coupling between the droplet and the continuous-phase air and their mutual influence. For the droplets deposited on the bottom, the distribution of deposited mass along the x-axis changes significantly. However, that of the droplets in the z-axis is nearly symmetrical, forming an M-shape from low to high and then from the central axis down on the z-axis on both sides.
Furthermore, the droplet deposition mass in different regions on the inner bottom surface of the wind tunnel was calculated from the result file. The mass in the narrow ellipse was divided by the total discrete-phase deposition mass to obtain an accurate deposition rate at different wind speeds. Meanwhile, the total deposition mass was divided by the droplet deposition mass captured on the ground and air outlet, 2 m behind the downwind direction, to obtain the horizontal drift rate at different wind speeds. The accurate deposition and horizontal drift rates of the discrete-phase under the influence of different lateral wind speeds were obtained (Figure 6).
As illustrated in Figure 6, the accurate deposition rate Ra of the simulated discrete-phase decreases exponentially from 14.11% to 0.66% as the lateral wind speed increases from 0 m/s to 6 m/s, and the horizontal drift rate Rh increases linearly from 14.25% to 60.58%. The correlation between these parameters and lateral wind speed was further explored. A regression analysis of the accurate deposition rate, horizontal drift rate, and wind speed was conducted. The correlation equations were Ra = 0.1476 × 100.529 v (with R2 = 0.995) and Rh = 0.0796 v + 0.1456 (with R2 = 0.995).

3. Wind Tunnel Test

3.1. Test Materials and Equipment

The test was conducted with the Lu 120-015 and Lu 120-03 flat fan nozzles (Lechler, Metzingen, Germany). The reagents used included the rhodamine-B reagent and purified water. The wind tunnel is located at the wind tunnel laboratory at the National Precision Agriculture Aviation Center of the South China Agricultural University in Guangzhou. It is a high- and low-speed composite wind tunnel conforming to the ISO International Standard (ISO 22856). During the test, a splash-proof artificial turf was paved on the bottom of the wind tunnel to simulate the ground. During the test, the temperature and relative humidity of the air in the wind tunnel remained constant at 25 °C and 65%, respectively. A Kanomax 6036-bg anemomaster digital anemometer with a pressure sensor (Kanomax, Andover, NJ, USA), with a measurement accuracy of ±3% of the reading value, was used to measure the wind speed. The spray system could accurately control the spray pressure and achieve regular spraying by varying the outlet pressure and relay mode of the pressure-reducing valve. The droplet-size-distribution measuring device was equipped with a DP-02 laser particle sizer (OMEC, Shanghai, China) and supporting software produced by Zhuhai OMAX Instrument Co., Ltd. (Zhuhai, China), with a test range of 0.5–1500 μm. An F-380 fluorescence spectrophotometer and its supporting software produced by Tianjin Gangdong Technology Development Co., Ltd. (Tianjin, China) was used in the test.

3.2. Wind Tunnel Test Design

First, an impact test of the influence of wind speed on the droplet particle size was performed. The nozzle was installed on a support 0.6 m from the bottom of the wind tunnel. The nozzle’s direction was adjusted such that it was facing the ground, and the spraying fan was roughly parallel to the wind direction. The lenses of the laser particle sizer were 1.5 m apart and symmetrically placed on the horizontal supports on both sides of the nozzle. The spraying fan was perpendicular to the beam of the sizer. The fan frequency of the wind tunnel was adjusted to obtain the wind speeds of 1 m/s, 2 m/s, 3 m/s, 4 m/s, 5 m/s, and 6 m/s in the wind tunnel. The test was performed twice under the same conditions, and the results were averaged. Consequently, the spraying scenario at seven effective wind speeds between 0 m/s and 6 m/s was obtained and recorded.
Second, an impact test of wind speed on droplet drift was performed. The nozzle was installed on the support 0.6 m from the bottom of the wind tunnel. The nozzle direction was adjusted such that the nozzle faced downward, and the long-axis direction of the spraying sector ellipse was perpendicular to the direction of incoming wind. The test medium was an aqueous solution of a soluble fluorescent tracer (rhodamine-B with a mass fraction of 5%), and the droplet deposition was collected using a 1 mm diameter polyethylene wire. At a position of 2 m from the nozzle in the downwind direction, eight collection lines, spaced 0.1 m apart, were placed from 0.1 m to 0.8 m upward from the ground of the wind tunnel to detect the droplet flux of the air passing through the vertical plane, named V1–V8, respectively. In addition, 13 horizontal collection lines were placed 1 m from the horizontal direction to detect the horizontal drift loss from 2 m to 15 m, named H3–H15, respectively. The working principle of the test device is illustrated in Figure 7, where each spraying activity lasted 5 s. The droplets on the line attached to the 15 m were fully dried and collected manually with disposable rubber gloves. The collected polyethylene wires were placed separately in numbered self-sealing bags and stored away from light at a low temperature, and the amount of droplets collected on the polyethylene wires was measured and calculated over time. The wind tunnel test arrangement is depicted in Figure 8.

4. Results and Discussion

4.1. Droplet Parameters of Wind Tunnel Test

The droplet size parameters were obtained from the supported software of the laser particle sizer, as mentioned above. For the droplet migration characteristics, the polyethylene wire was shaken and washed with deionized water, and the concentration of the tracer deposited on it was measured by a fluorescence spectrophotometer (μG/L). The concentration value was multiplied by the eluent’s volume (L), and the tracer dose was obtained (μg). The nth polynomial curve of the droplet drift volume flux v ˙ ( y ) , with height distribution in the vertical test plane was fitted through data obtained from the eight vertically arranged horizontal collection wires. Meanwhile, the characteristic height h of the drift distribution was obtained by the following equation:
h = 0 h N v ˙ ( y ) y d y 0 h N v ˙ ( y ) d y
To test the volumetric flux of droplets at any height in the cross-section, the fitting accuracy must be more than 97%. For the calculation of the droplet drift, the total amount of droplets on the collection line was expressed by Ad during the spray process as:
A d = i = 1 n d i ( s w )
where n is the number of collection lines, and 13 polyethylene lines in the horizontal direction were summed. Di is the deposition of the tracer on the ith collection line, S is the distance between collection lines, and W is the diameter of the collection line (i.e., 1 mm). Ta (μg), the total amount of tracer sprayed, was calculated as follows:
T a = V × C
where V is the spray volume (L), and C is the tracer concentration (μg/L). Rh is the horizontal drift rate of droplets, indicating the percentage of droplet deposition collected by the 13 polyethylene wires arranged 0.1 m from the ground in the spray droplets sprayed by the nozzle expressed as:
R h = A d T a × 100 %

4.2. Comparison and Analysis of Data and Results

The results of the measurement of droplet size under seven different wind speeds and three spraying conditions are summarized in Table 2.
The analysis of the test data revealed that as the wind speed increased, Dv0.1 gradually decreased, and Dv0.5 and Dv0.9 gradually increased. Dv0.9 exhibited a significantly steeper increment compared to Dv0.5. Moreover, V100 and the droplet spectrum width gradually increased. For the practical scenario, the spatial particle statistics method of the laser particle sizer was used to calculate the number of particles per unit area of space. When the statistical rate per unit time remained unchanged, as wind speed increased, small particle-size droplets were carried by the airflow and moved at great speeds and therefore were counted fewer times. In contrast, large particles moved slower and therefore were counted several times. Consequently, the overall measured particle size was too large [42,43]. A comparison of the simulation and test data showed differences in other particle size parameters, except for the Dv0.5 value and change trend, which remained identical. The error in the simulation results occurred due to the error of the statistical method of discrete-phase particles. It approximately replaces the nozzle spraying particles at 0.35 m in the laser particle sizer through statistics of a series of sprayed particles for a short duration. The statistical methods were different, and thus the results were also quite different.
Figure 9 presents the results of the measurement and calculation of droplet drift under three wind speeds and three spraying conditions.
Figure 9a–c presents the mass of rhodamine-B on the polyethylene line under lateral wind speeds of 1 m/s, 3 m/s, and 6 m/s and three spraying pressures, i.e., Lu 120-015 (0.3 MPa), Lu 120-015 (0.4 MPa), and Lu 120-03 (0.3 MPa), respectively. The three-bar charts show that, for the same spraying conditions, the droplet flux value of the nozzle on the 2 m plane in the downwind direction gradually decreases from bottom to top at a wind speed of 1 m/s. At wind speeds of 3 m/s and 6 m/s, the flux increases first and then decreases. For the droplet deposition amount, 2 m downward in the wind direction and beyond, it gradually decreases from front to back under all conditions, whereas the 3 m/s lateral wind speed decreases and changes faster than the drift rate of 6 m/s. According to the linear fitting of the deposition quality of V1 (H2) and H3–H15 polyethylene lines and straight-line fitting of the deposition quality, the droplet deposition quality was 0.04 mL/(min·cm2). The distance is the drift distance, and its statistics are summarized in Table 3.
A comparison of the drifts under the three different spraying conditions showed that, at a spraying pressure of 0.3 MPa, and when the horizontal wind speed increased from 1 m/s to 3 m/s, the drift distance increased rapidly from less than 4 m to more than 15 m. However, it increased marginally with the increase in wind speed from 3 m/s to 6 m/s. For the same nozzle (Lu 120-015), the droplet size subtly decreased as the spraying pressure increased, and the drift distance increased simultaneously under the same wind speed. According to the analysis, the drift distance is related to the coupling between droplet size and number. Without considering polymerization and evaporation, the settling time for droplets with the same particle size in the air was fixed, which is affected by air resistance. The deposition time of large droplets was shorter than that of small ones. The droplets evaporated while drifting downwind under the influence of horizontal wind. Large droplets more easily settled on the ground and had a stronger anti-evaporation ability that helped them avoid precipitation of the effective components within them. Tiny droplets completely evaporated before settling on the ground. Therefore, when the influences of evaporation and polymerization are considered, the number of droplets and the distance between them will affect their evaporation and aggregation, affecting the drift distance.
The wind speed of 1 m/s had a clear effect on the drift of small droplets. Consequently, the drift amount and distance were limited. As the wind speed increased to 3 m/s and 6 m/s, the drift amount and distance increased rapidly. For the spray pressure of 0.3 MPa, the characteristic height h of the droplet drift distribution under three lateral wind speeds were calculated as H1 = 0.175 m, H3 = 0.2 m, and H6 = 0.245 m, and the horizontal drift rates were Rh1 = 0.4%, Rh3 = 48.1%, and Rh6 = 75.1%. Furthermore, the simulated drift data were obtained by estimating the discrete-phase deposition quality per unit distance on the bottom surface in the simulation result file. Within this distance, the drift data were deduced from the quality of rhodamine-B deposited on the polyethylene line arranged horizontally in the wind tunnel. The drift data at different distances under the same lateral wind speed between the simulation and the test are compared in Table 4. The analysis reveals that the data correlations of the drift amount and distance at 1 m/s, 3 m/s, and 6 m/s between the simulation and experiment were 0.905, 0.995, and 0.978, respectively. Furthermore, data of the horizontal drift rate from simulation (Rhs) and wind tunnel test (Rht) at different lateral wind speeds were compared using the formula Rht = 1.888 Rhs − 0.3533. The determination coefficient R2 = 0.963 was used to verify the simulation accuracy.

5. Conclusions

In this study, the drift potential characteristics of planar fan head nozzles were studied using CFD and wind tunnel tests. The results show that:
(1)
The droplet spectrum parameters and droplet drift results correlated with the test and can be obtained through measurement and analysis of the actual spraying process and the establishment of an appropriate spraying model. The statistical results of the data from the simulation of all droplet particle sizes for a short duration compared to the droplet particle sizes on a line tested by a particle-sizer laser beam were poor. However, the numerical simulation accurately predicted droplet drift.
(2)
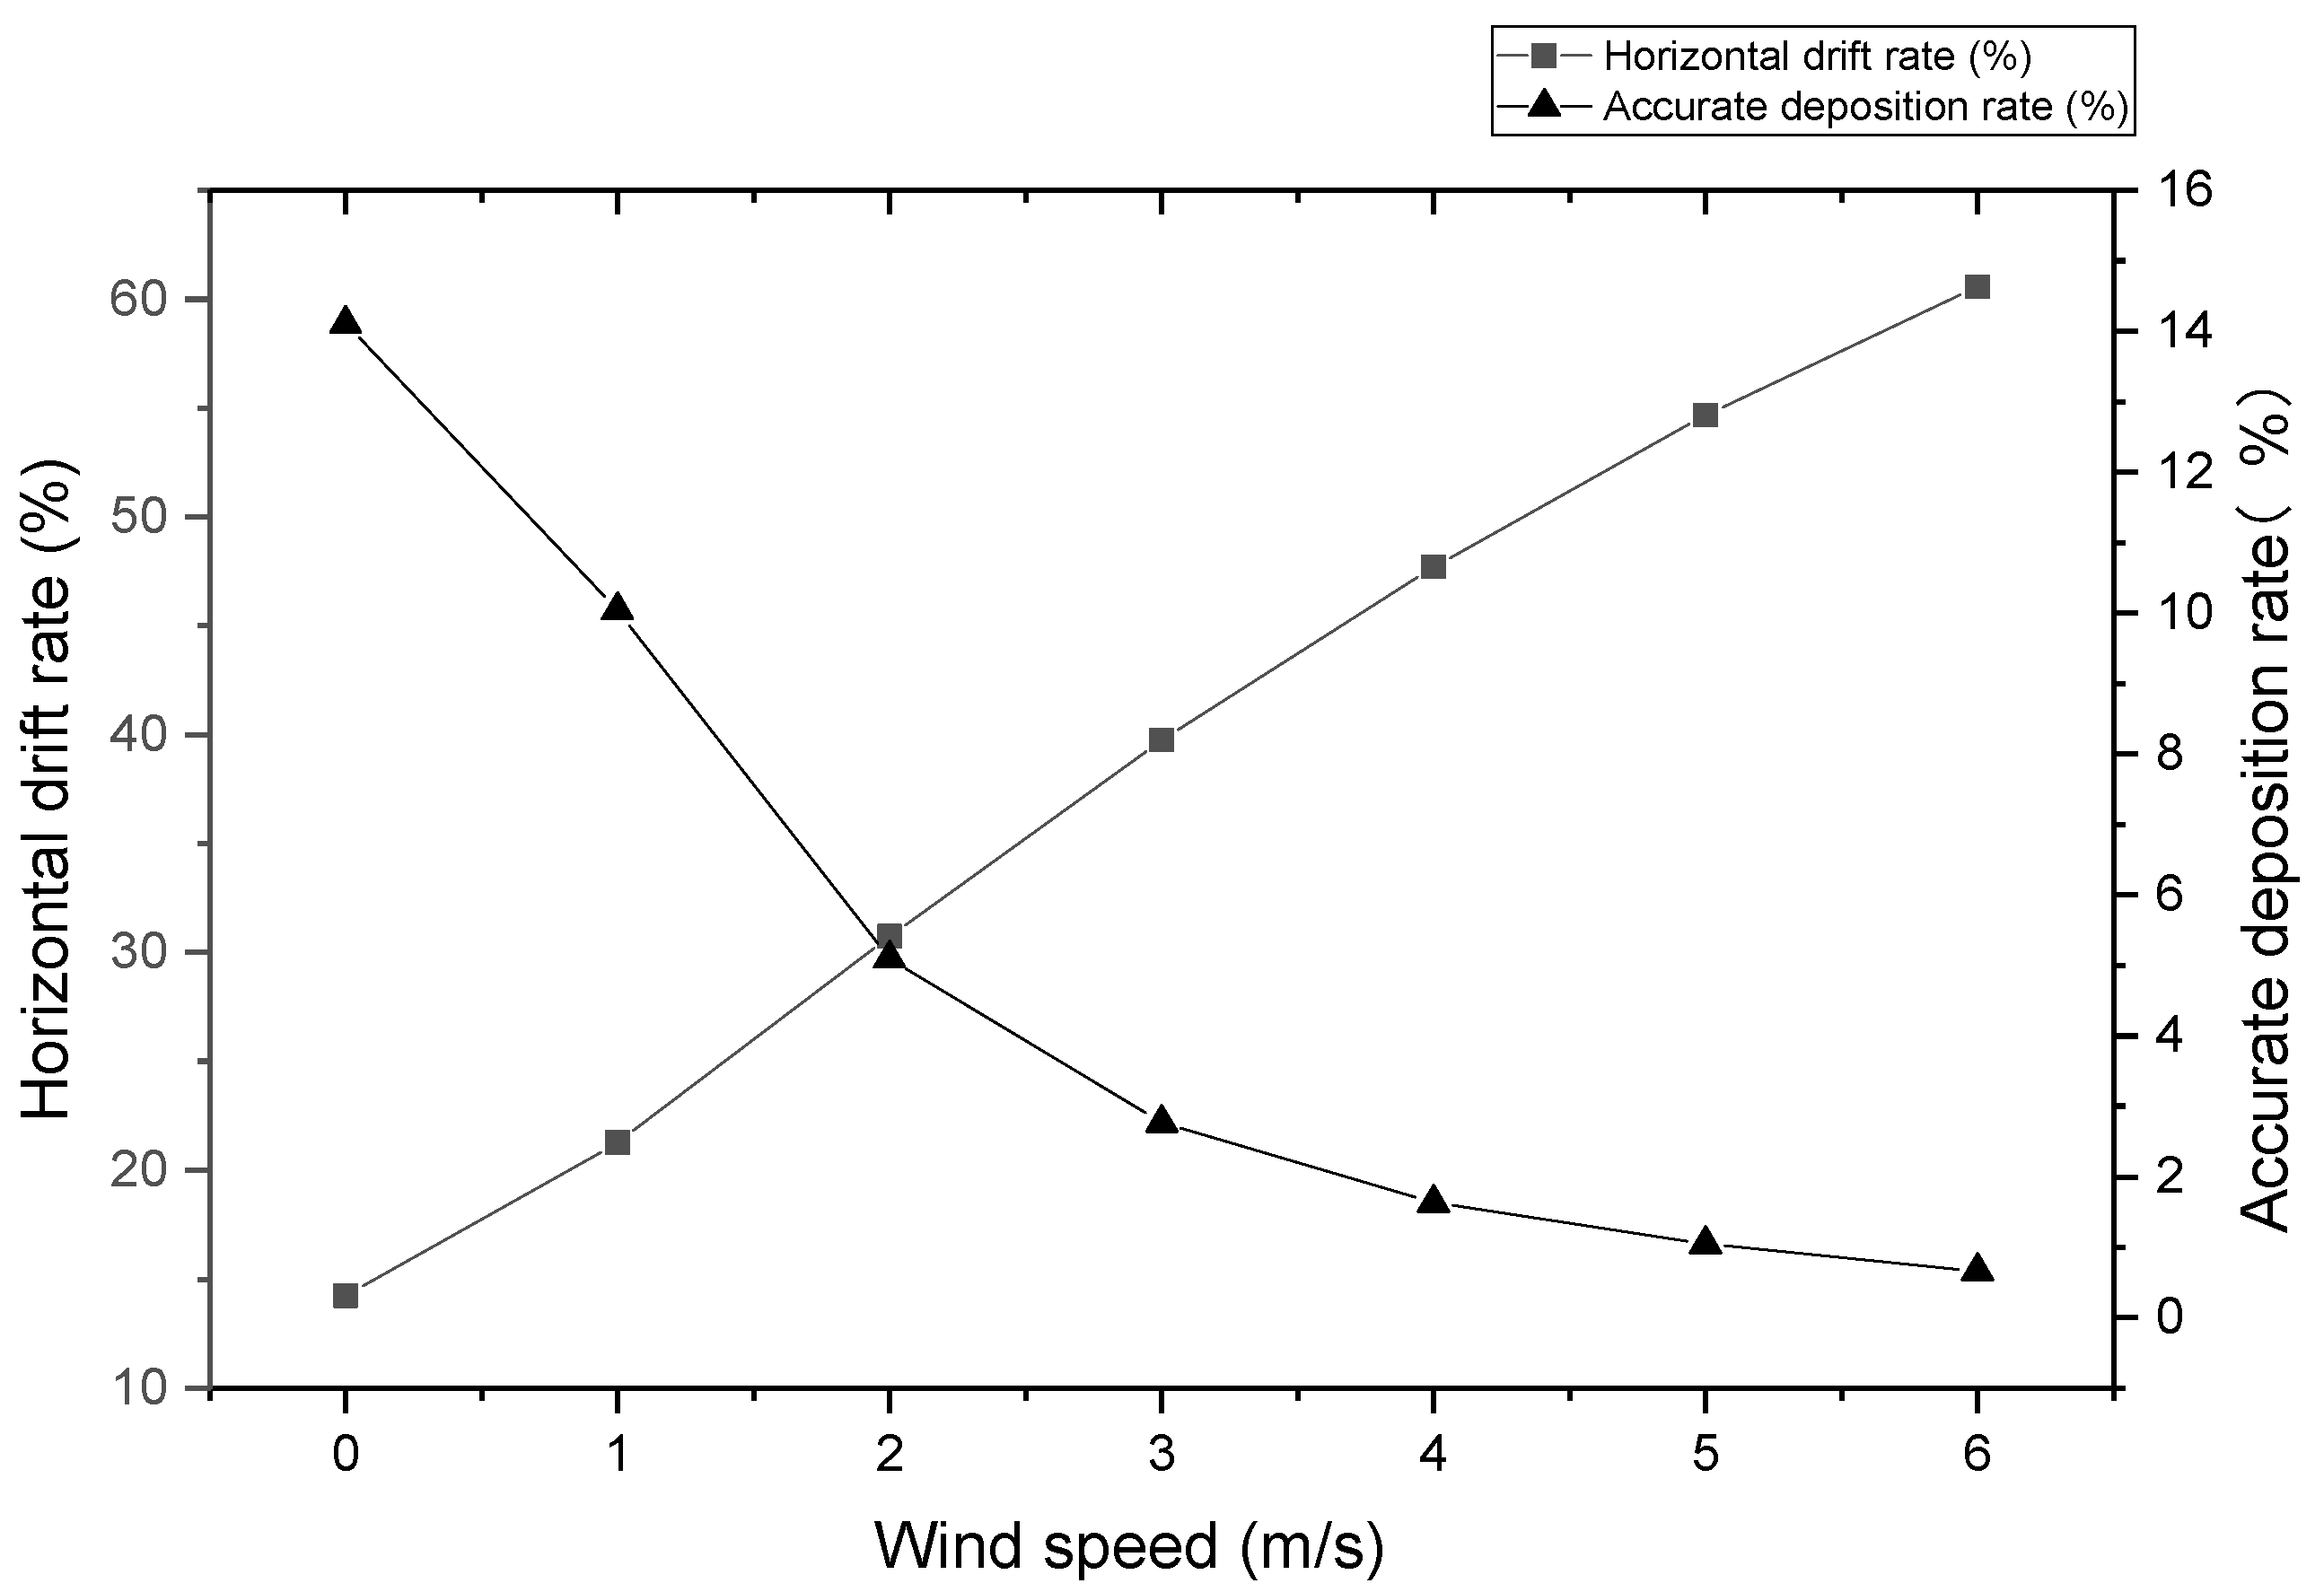
Under different spray conditions, the characteristic height of the droplet drift h, the drift distance, the accurate deposition rate Ra, and the horizontal drift rate Rh were directly affected by the lateral wind speed. For the simulation results, the accurate deposition rate of Ra at wind speeds of 1 m/s and 6 m/s were 10.04% and 0.66%, respectively. The horizontal drift rate Rh at wind speeds of 1 m/s and 6 m/s were 21.28% and 60.58%, respectively. According to the test results, the characteristic height h at wind speeds of 1 m/s and 6 m/s were 0.175 m and 0.245 m, respectively. The horizontal drift rate at wind speeds of 1 and 6 m/s was 0.4% and 75.1%, respectively. For different wind speeds, the correlation between the results of the numerical simulation and wind tunnel test for drift and drift data was more than 0.9.
(3)
Compared with wind tunnel tests, hydrodynamic modeling and analysis can greatly save computation and experimentation resources by ensuring the correlation of results. Meanwhile, its results can be accurately visualized, and the test result data can be easily analyzed through statistics, reducing post-processing time.
A 3D virtual spray environment was established using the CFD method to analyze droplet size and deposition drift characteristics and to overcome the uncontrollable factors of an actual spraying environment. The effects of nozzle type, spray pressure, and lateral wind speed on the droplet size and deposition-drift characteristics were preliminarily studied and verified by wind tunnel tests under similar conditions, and it was found that the method was able to predict the droplet drift characteristics according to the nozzle type, spraying pressure, and lateral wind speed. Meanwhile, factors such as spray angle were not considered in the study. The environmental factors of droplet deposition will be introduced in a follow-up study. A comprehensive prediction model of droplet deposition characteristics was established, and its accuracy was improved.

Author Contributions

Investigation, X.Z.; resources, T.Z.; data curation, Q.L.; writing—original draft preparation, J.W.; writing—review and editing, Y.L.; visualization, W.F. All authors have read and agreed to the published version of the manuscript.

Funding

This research was supported by Key Research and Development Projects in Hainan Province (Grant No. ZDYF2020195) and the Academician Lan Yubin innovation platform of Hainan Province, Key Research and Development projects in Hainan Province (Grant No. ZDYF2020042), National Natural Science Foundation of China (Grant No. 32160424), Hainan Province Academician Innovation Platform (Grant No. YSPTZX202008), and the Basic and Applied Research Foundation of Guangdong Province (2020A1515110214).

Institutional Review Board Statement

Not applicable.

Informed Consent Statement

Not applicable.

Data Availability Statement

Not applicable.

Acknowledgments

The authors are very grateful to Yingbin Yan and Yu Zang for their contributions.

Conflicts of Interest

The authors declare no conflict of interest.

References

  1. Liu, X.; Liu, X.; Cui, H.; Yuan, J. Research progress and prospect of crop canopy droplet deposition. J. Agric. Mach. 2021, 1–20. Available online: http://kns.cnki.net/kcms/detail/11.1964.S.20210917.1110.006.html (accessed on 2 March 2022).
  2. Dekeyser, D.; Duga, A.T.; Verboven, P.; Endalew, A.M.; Hendrickx, N.; Nuyttens, D. Assessment of orchard sprayers using laboratory experiments and computational fluid dynamics modelling. Biosyst. Eng. 2013, 114, 157–169. [Google Scholar] [CrossRef]
  3. Liu, X.; Yuan, L.; Shi, X.; Du, Y.; Yang, F.; Yuan, H.; Min, X. Research progress of droplet drift in spray for plant protection spraying. J. Pes. Sci. 2021, 1–21. [Google Scholar] [CrossRef]
  4. Zhou, Z.; Ming, R.; Zang, Y.; He, X.; Luo, X.; Lan, Y. Development status and countermeasures of agricultural aviation in China. Trans. Chin. Soc. Agric. Mach. 2017, 33, 1–13, (In Chinese, with Abstract in English). [Google Scholar]
  5. Zhang, J.; He, X.; Song, J.; Zeng, A.; Liu, Y.; Li, X. Influence of spraying parameters of unmanned aircraft on droplets deposition. Trans. Chin. Soc. Agric. Mach. 2012, 43, 94–96, (In Chinese, with Abstract in English). [Google Scholar]
  6. Chen, S.; Lan, Y.; Li, J.; Zhou, Z.; Liu, A.; Xu, X. Comparison of the pesticide effects of aerial and artificial spray applications for rice. J. South China Agric. Univ. 2017, 38, 103–109, (In Chinese, with Abstract in English). [Google Scholar]
  7. Wang, C.; Song, J.; He, X.; Wang, Z.; Wang, S.; Meng, Y. Effect of flight parameters on distribution characteristics of pesticide spraying droplets deposition of plant-protection unmanned aerial vehicle. Trans. Chin. Soc. Agric. Eng. 2017, 33, 109–116, (In Chinese, with Abstract in English). [Google Scholar]
  8. van de Zande, J.C.; Huijsmans, J.F.; Porskamp, H.A.; Michielsen, J.M.; Stallinga, H.; Holterman, H.J.; de Jong, A.J. Spray techniques: How to optimise spray deposition and minimise spray drift. Environmentalist 2008, 28, 9–17. [Google Scholar] [CrossRef] [Green Version]
  9. Van de Zande, J.C.; Stallinga, H.; Michielsen, J.M.; Van Velde, P. Effect of sprayer speed on spray drift. Annu. Rev. Agric. Eng. 2005, 4, 129–142. [Google Scholar]
  10. Derksen, R.C.; Zhu, H.; Ozkan, H.E.; Hammond, R.B.; Dorrance, A.E.; Spongberg, A.L. Determining the influence of spray quality, nozzle type, spray volume, and air-assisted application strategies on deposition of pesticides in soybean canopy. Trans. ASABE 2008, 51, 1529–1537. [Google Scholar] [CrossRef] [Green Version]
  11. Salcedo, R.; Zhu, H.; Zhang, Z.; Wei, Z.; Chen, L.; Ozkan, E.; Falchieri, D. Foliar deposition and coverage on young apple trees with PWM-controlled spray systems. Comput. Electron. Agric. 2020, 178, 105794. [Google Scholar] [CrossRef]
  12. Salcedo, R.; Zhu, H.; Ozkan, E.; Falchieri, D.; Zhang, Z.; Wei, Z. Reducing ground and airborne drift losses in young apple orchards with PWM-controlled spray systems. Comput. Electron. Agric. 2021, 189, 106389. [Google Scholar] [CrossRef]
  13. Salyani, M.; Farooq, M.; Sweeb, R.D. Spray deposition and mass balance in citrus orchard applications. Trans. ASABE 2007, 50, 1963–1969. [Google Scholar] [CrossRef]
  14. Nuyttens, D.; De Schampheleire, M.; Baetens, K.; Sonck, B. The influence of operator-controlled variables on spray drift from field crop sprayers. Trans. ASABE 2007, 50, 1129–1140. [Google Scholar] [CrossRef]
  15. Nuyttens, D.; Zwertvaegher, I.K.; Dekeyser, D. Spray drift assessment of different application techniques using a drift test bench and comparison with other assessment methods. Biosyst. Eng. 2017, 154, 14–24. [Google Scholar] [CrossRef]
  16. Balsari, P.; Gil, E.; Marucco, P.; Van De Zande, J.C.; Nuyttens, D.; Herbst, A.; Gallart, M. Field-crop-sprayer potential drift measured using test bench: Effects of boom height and nozzle type. Biosyst. Eng. 2017, 154, 3–13. [Google Scholar] [CrossRef] [Green Version]
  17. Balsari, P.; Grella, M.; Marucco, P.; Matta, F.; Miranda-Fuentes, A. Assessing the influence of air speed and liquid flow rate on the droplet size and homogeneity in pneumatic spraying. Pest Manag. Sci. 2019, 75, 366–379. [Google Scholar] [CrossRef]
  18. Miranda-Fuentes, A.; Marucco, P.; Sánchez, E.J.G.; Gil, E.; Grella, M.; Balsari, P. Developing strategies to reduce spray drift in pneumatic spraying in vineyards: Assessment of the parameters affecting droplet size in pneumatic spraying. Sci. Total Environ. 2018, 616, 805–815. [Google Scholar] [CrossRef] [Green Version]
  19. Butts, T.R.; Luck, J.D.; Fritz, B.K.; Hoffmann, W.C.; Kruger, G.R. Evaluation of spray pattern uniformity using three unique analyses as impacted by nozzle, pressure, and pulse-width modulation duty cycle. Pest Manag. Sci. 2019, 75, 1875–1886. [Google Scholar] [CrossRef] [Green Version]
  20. Guler, H.; Zhu, H.; Ozkan, H.E.; Derksen, R.C.; Yu, Y.; Krause, C.R. Spray characteristics and drift reduction potential with air induction and conventional flat-fan nozzles. Trans. ASABE 2007, 50, 745–754. [Google Scholar] [CrossRef]
  21. Guler, H.; Zhu, H.; Ozkan, E.; Derksen, R.; Krause, C. Wind tunnel evaluation of drift reduction potential and spray characteristics with drift retardants at high operating pressure. J. ASTM Int. 2006, 3, 1–9. [Google Scholar] [CrossRef] [Green Version]
  22. Guler, H.; Zhu, H.; Ozkan, H.E.; Derksen, R.C.; Yu, Y.; Krause, C.R. Spray characteristics and wind tunnel evaluation of drift reduction potential with air induction and conventional flat fan nozzle. In Proceedings of the 2006 ASAE Annual Meeting. American Society of Agricultural and Biological Engineers, Boston, MA, USA, 19–22 August 2006; p. 1. [Google Scholar]
  23. Zhang, J.; Song, J.; He, X.; Zeng, A.; Liu, Y. Droplets movement characteristics in atomization process of flat nozzle. Trans. Chin. Soc. Agric. Mach. 2011, 42, 66–69+75. (In Chinese) [Google Scholar]
  24. Zhang, S.; Xue, X.; Qin, W.; Sun, Z.; Ding, S.; Zhou, L. Simulation and experimental verification of aerial spraying drift on N-3 unmanned spraying helicopter. Trans. Chin. Soc. Agric. Mach. 2015, 31, 87–93, (In Chinese, with Abstract in English). [Google Scholar]
  25. Teske, M.E.; Thistle, H.W.; Hewitt, A.J.; Kirk, I.W.; Dexter, R.W.; Ghent, J.H. Rotary atomizer drop size distribution database. Trans. ASABE 2005, 48, 917–921. [Google Scholar] [CrossRef] [Green Version]
  26. Kirk, I.W. Measurement and prediction of atomization parameters from fixed-wing aircraft spray nozzles. Trans. ASABE 2007, 50, 693–703. [Google Scholar] [CrossRef]
  27. Fritz, B.K.; Hoffmann, W.C.; Lan, Y. Evaluation of the EPA drift reduction technology (DRT) low-speed wind tunnel protocol. J. ASTM Int. 2009, 6, 183–191. [Google Scholar] [CrossRef] [Green Version]
  28. Hoffmann, W.C.; Fritz, B.K.; Lan, Y. Evaluation of a proposed drift reduction technology high-speed wind tunnel testing protocol. J. ASTM Int. 2009, 6, 212–223. [Google Scholar] [CrossRef]
  29. Martin, D.E.; Carlton, J.B. Airspeed and orifice size affect spray droplet spectrum from an aerial electrostatic nozzle for fixed-wing applications. Appl. Eng. Agric. 2013, 29, 5–10. [Google Scholar] [CrossRef]
  30. Zhang, F.; Feng, S.; Chen, L.; Zhang, R.; Li, L. Wind tunnel experimental study on drift potential characteristics of special-shaped nozzles with the same size. Res. Agric. Mech. 2021, 43, 157–164. [Google Scholar] [CrossRef]
  31. Zhang, H.; Gary, D.; Zheng, J.; Zhou, H. Wind tunnel experiment of influence on droplet size distribution of flat fan nozzles. Trans. Chin. Soc. Agric. Mach. 2012, 43, 53–57+52. [Google Scholar]
  32. Tang, Q.; Chen, L.; Zhang, R.; Zhang, B.; Yi, T.; Xu, M.; Xu, G. Atomization characteristics of normal flat fan nozzle and air induction nozzle under high-speed airflow conditions. Trans. Chin. Soc. Agric. Eng. 2016, 32, 121–128, (In Chinese, with Abstract in English). [Google Scholar]
  33. Duga, A.T.; Delele, M.A.; Ruysen, K.; Dekeyser, D.; Nuyttens, D.; Bylemans, D.; Nicolai, B.M.; Verboven, P. Development and validation of a 3D CFD model of drift and its application to air-assisted orchard sprayers. Biosyst. Eng. 2016, 154, 62–75. [Google Scholar] [CrossRef]
  34. Hong, S.W.; Zhao, L.; Zhu, H. CFD simulation of airflow inside tree canopies discharged from air-assisted sprayers. Comput. Electron. Agric. 2018, 149, 121–132. [Google Scholar] [CrossRef]
  35. Li, J.; Zhao, C.; Li, S.; Chen, H.; Ding, S. Research on droplet deposition characteristics of CFD wind driven sprayer based on CFD. J. Huazhong Agric. Univ. 2019, 38, 171–177. [Google Scholar] [CrossRef]
  36. Liu, X.; Yuan, J.; Zhang, X.; Zuo, W. Effect of air-assisted spraying condition parameters on boom spray drift characteristics. Trans. Chin. Soc. Agric. Mach. 2012, 43 (Suppl. S1), 67–72, (In Chinese, with Abstract in English). [Google Scholar]
  37. Zheng, L. ANSYS Fluent 15.0. Fluid Computing from Introduction to Mastery (m); Electronic Industry Press: Beijing, China, 2015; p. 115. [Google Scholar]
  38. ANSYS18.1—ANSYS Fluent Theory Guide Chapter 4: Turbulence p47 (Z); ANSYS, Inc.: Canonsburg, PA, USA, 2017.
  39. Wang, J.; Liu, C.; Wu, Y. Numerical simulation of spray atomization in supersonic flows. Mod. Phys. Lett. B 2010, 24, 1299–1302. [Google Scholar] [CrossRef]
  40. Zhang, H.; Gary, D.; Zheng, J.; Zhou, H.; Yu, J. Wind tunnel experiment and regression model for spray drift. Trans. Chin. Soc. Agric. Eng. 2015, 31, 94–100, (In Chinese, with Abstract in English). [Google Scholar]
  41. Fu, X.; Wu, P.; Ding, S.; Zhou, L.; Yan, H. Influence of spray operating parameters on droplet deposition. Trans. Chin. Soc. Agric. Mach. 2011, 42, 70–75, (In Chinese, with Abstract in English). [Google Scholar]
  42. Fritz, B.K.; Hoffmann, W.C.; Bagley, W.E.; Kruger, G.R.; Czaczyk, Z.; Henry, R.S. Measuring droplet size of agricultural spray nozzles-measurement distance and air speed effects. At. Sprays 2014, 24, 747–760. [Google Scholar] [CrossRef] [Green Version]
  43. Hoffmann, W.C.; Fritz, B.K.; Bagley, W.E.; Lan, Y. Effects of air speed and liquid temperature on droplet size. J. ASTM Int. 2011, 8, 1–9. [Google Scholar] [CrossRef]
Figure 1. Three-dimensional sketch of the linear simulated fluid domain.
Applsci 12 06092 g001
Figure 2. Distribution of discrete-phases in space without crosswind.
Applsci 12 06092 g002
Figure 3. Cloud map of discrete-phase deposits concentration on the bottom surface.
Applsci 12 06092 g003
Figure 4. Distribution of droplets at different wind speeds.
Applsci 12 06092 g004
Figure 5. Z-direction velocity of discrete-phase particles in the Y plane is 0.3 m.
Applsci 12 06092 g005
Figure 6. Accurate deposition and horizontal drift rates of simulated discrete-phases under the influence of different crosswinds.
Applsci 12 06092 g006
Figure 7. Schematic of the particle size analysis test.
Applsci 12 06092 g007
Figure 8. Wind tunnel test arrangement; (a) Schematic diagram of test layout; (b) Physical drawing of test layout (1); (c) Physical drawing of test layout (2).
Applsci 12 06092 g008
Figure 9. Quality of rhodamine-B on polyethylene wire under the influence of crosswinds with varying speeds. (a) Lu 120-015 with spray pressure is 0.3 MPa; (b) Lu 120-015 with spray pressure is 0.4 MPa; (c) Lu 120-03 with spray pressure is 0.3 MPa.
Applsci 12 06092 g009
Table 1. Discrete-phase particle-distribution parameters of simulated nozzles with different inlet wind speeds.
Horizontal Wind Speed/m/s0123456
Dv0.1/μm100.00105.78126.11125.97121.46127.34119.01
Dv0.5/μm218.49229.05225.51227.10235.25238.84241.78
Dv0.9/μm351.38339.51349.15333.13358.99347.56346.98
V100/%10.21%5.70%3.96%4.04%4.30%4.68%5.36%
Droplet Spectrum Width1.151.020.920.911.010.921.01
Table 2. Droplet spectrum parameters under different spraying conditions.
Nozzle Type/Spray Pressure/(No. MPa) Wind Speed (m/s)
0123456
Lu120-015, 0.3Dv0.1/μm84.2482.4779.3572.7772.7171.6969.26
Dv0.5/μm174.74176.68177.67179.31187.53191.22195.32
Dv0.9/μm264.55276.32281.54289.48298.35309.74318.81
V100/%11.8412.1713.7614.7314.6314.2714.01
Droplet spectrum width1.031.101.141.211.201.241.28
Lu120-015, 0.4Dv0.1/μm81.9876.8073.4971.9770.2569.3466.60
Dv0.5/μm171.02172.14175.64178.86182.71186.34190.52
Dv0.9/μm261.29269.51276.36279.76287.91295.78304.32
V100/%13.8614.8215.6415.9817.3218.1918.32
Droplet spectrum width1.051.121.161.161.191.221.25
Lu120-03, 0.3Dv0.1/μm96.6291.7589.3787.9185.4683.1782.78
Dv0.5/μm216.58217.82221.95225.24230.16234.31237.34
Dv0.9/μm340.53371.55386.36404.53418.26431.53440.86
V100/%11.8412.1713.7614.7315.6316.2716.01
Droplet spectrum width1.131.281.341.411.451.491.51
Table 3. Drift distance for different spraying conditions.
Wind Speed/m/sNozzle Model/Spray Pressure/(No./MPa)
Lu 120-015, 0.3Lu 120-015, 0.4Lu 120-120, 0.3
13.12113.88
315.7416.4516.24
618.6317.8720
Table 4. Simulated and experimental distance drift values at different lateral wind speeds.
Wind Speed/m/s136
Distance/mNumerical SimulationTest ValueNumerical SimulationTest ValueNumerical SimulationTest Value
30.0064030.000640.0099230.0628480.0138630.0672
40.0040320.0002930.0062280.0390510.0087770.055733
50.0026810.0002130.0048430.0328530.0068940.038293
60.0014310.000160.0039420.025280.0056240.03032
70.0001470.0002670.0031080.022240.0046110.026267
81.79 × 1050.0001070.0019810.017440.0039350.02424
91.76 × 1050.000080.0005110.0103470.0033670.024613
103.01 × 1062.67 × 1050.0001490.0088110.002820.0248
111.6 × 1080.0001070.0001240.0070610.002330.021333
121.78 × 1065.33 × 1059.97 × 1050.0045970.0014360.019733
132.54 × 1062.67 × 1056.32 × 1050.0041550.0007980.017867
143.74 × 1082.67 × 1056.34 × 1050.0032910.0003090.013867
151.03 × 10604.3 × 1050.0023470.0001610.0112
Publisher’s Note: MDPI stays neutral with regard to jurisdictional claims in published maps and institutional affiliations.

