1. Introduction
Climate change has brought various threats to humanity. Among them, global warming is arguably the most serious. According to the World Meteorological Organization, 2011–2020 was the warmest decade since the 1800s [
1]. Global warming comes from human-induced emissions, mainly from burning fossil fuels [
2]. As a significant contributor to the world economy, international tourism’s revenue was USD 1481 billion in 2019, a 4.8% year-on-year increase [
3]. However, tourism emissions increased from 3.9 to 4.5 GtCO
2e between 2009 and 2013, representing 8% of global emissions [
4]. Tourism can only be sustainable in the long term if it transforms into a climate-resilient industry [
5]. Therefore, there is an urgent need for the tourism industry to embrace a low-carbon pathway to mitigate global warming and ultimately achieve sustainable tourism. However, sustainable tourism is a continuous process that requires seamless collaboration among tourism stakeholders, including the business, local community, government, tourists, and international community [
6]. Instead of focusing on only one aspect (economic growth), sustainable tourism considers a balance between economic, environmental, and social–cultural aspects to ensure the long-term sustainability of tourism development [
7]. These considerations lead the tourism industry to achieve productivity while preserving the natural environment and maintaining the quality of life. However, under a business-as-usual scenario, tourism emissions are projected to increase by 169% between 2010 and 2050 [
8]. Since reducing emissions is a challenge for sustainable development, this finding recognizes that sustainability practices in the tourism industry are still insufficient [
5].
Sustainable tourism should optimize environmental resources, a vital element of tourism development [
9]. However, accommodation is a resource-intensive tourism subsector [
10,
11]. As more than 70% of energy demand is consumed for electricity [
10], accommodation is the second-highest emitter after transportation, accounting for 21% of tourism emissions [
12]. This study focuses on a particular type of accommodation, bed and breakfast (B&B), which has experienced rapid growth through sharing-economy platforms [
13]. As a small tourism business owned and operated by a family, a B&B is an innovative sideline business built and developed from a family’s underutilized assets [
14]. Unfortunately, many B&Bs have recently experienced a significant decline in guest numbers. For example, in Taiwan [
15] and Northern Ireland [
16], the occupancy rate was below 25% from 2013 to 2018. Oversupply and homogeneity are the reasons for this severe challenge [
17,
18]. Therefore, B&Bs need to build a competitive advantage in a saturated market by differentiating themselves from the competition with novel features. Recent literature has investigated whether environmentally friendly practices in hotels (e.g., waste management, energy efficiency) can increase customer satisfaction, a critical factor in hotel selection [
19]. In fact, the adoption of renewable energy (RE) as a primary energy source is the least adopted by accommodations [
20]. However, B&Bs can improve energy security by changing their energy sources while reducing energy costs with a short payback period, which has been implemented in real-world applications [
21]. Using low-carbon energy in tourism destinations also contributes to community economies by generating revenue, creating jobs, and diversifying income [
22]. Therefore, energy transition would not only reshape a B&B’s image as an eco-friendly accommodation business [
23] but also facilitate the sustainable development of local communities.
In addition, the shift to RE has the potential to maintain the B&B’s competitive advantage by offering new service innovations continuously. Considering that visitors are more likely to stay at B&Bs than traditional hotels due to their authenticity [
24,
25] and social interaction [
26], B&Bs can collaborate with the entire community to offer novel experiences that leverage and integrate local resources [
27]. Another interesting innovation is the increasing adoption of electric vehicles (EVs), which is expected to increase six-fold between 2019 and 2030 [
28]. As pioneered by several hotel chains [
29,
30], B&Bs can offer EV charging services at their facilities to proactively respond to market changes, generate new revenue streams, and develop more innovations. In terms of the internal conflict due to energy transition, B&Bs can take the opportunity of transgenerational ownership (succession from the old to the young generation). When the new management reevaluate their business strategy during this period [
14,
31], this would be an ideal time to conduct an energy transition. A significant reduction in RE costs, even below 3.0 US cents/kWh in some countries [
32], means it is also an ideal time for initiating the transition. Unfortunately, despite these opportunities, RE is still underutilized in the accommodation industry. For example, only 17.3% of hotels in the Asia-Pacific region have installed renewable energy generation devices (REGDs) [
33]. The most common reason for not deploying RE at the accommodations is the personal belief of (high) upfront investment [
34]. Compared to other accommodations, the lack of capital reserves [
35] and heavy dependence on the power grid in most B&Bs [
36] pose a challenge to a successful energy transition. Furthermore, there is a lack of know-how in initiating energy transition in accommodation businesses [
34], mainly due to several complexities. B&Bs have to balance fluctuations in energy production and consumption due to the intermittent nature of most RE energy sources and the occurrence of peak demand at certain times.
The hybrid RE system that combines two or more energy sources (e.g., solar and wind) can adequately manage these fluctuations [
37]. However, a hybrid RE system, often equipped with batteries, increases the complexity of the problem compared to a single-source RE system. Further complexity arises from the variety of REGDs on the market, including conventional REGDs (e.g., solar panels and wind turbines) and unconventional REGDs (e.g., the Wind Tree). Both offer different tradeoffs that B&Bs must evaluate when transitioning to RE. B&Bs also need to manage the site availability since an installed RE system requires more land than a fossil power plant [
38]. There is an urgent need for a decision-making framework to manage this complexity to ensure a resilient energy supply at an affordable cost. The decision should include the type and size of RE technologies for each suitable location on the B&B. According to the systematic review, the optimization approach provides good energy planning for ensuring sustainability [
39]. Therefore, this study proposes a practical approach to address the critical need for all B&B businesses to make optimal decisions on deploying hybrid RE technologies in their locations. This study provides a model that integrates system components, including hybrid RE systems, batteries, the power grid, different ratios of self-sufficiency, and different RE technologies, to ensure a smooth energy transition. This integration provides B&Bs the flexibility to choose their preferred self-sufficiency as a target to be achieved by allocating a specific share of the energy demand to be met by RE and the rest by the power grid. In addition to bridging the gap between the high cost of RE technologies and the affordability of B&Bs, the model can also evaluate the tradeoff between conflicting goals, costs, and emissions when designing the system. This integration also assists the B&B in evaluating the tradeoff between conventional and/or unconventional REGDs and investigating the need to determine a specific size of batteries to regulate energy flow. The mixed-integer programming (MIP) model is developed as a proposed method to solve the problem. The model then demonstrates its capabilities in a case study on a simulated B&B facility.
The rest of this paper is organized as follows.
Section 2 reviews related research.
Section 3 presents the optimization model.
Section 4 describes the methodology, followed by the results and discussion in
Section 5. Finally,
Section 6 concludes this research with suggestions for future studies.
2. Literature Review
There is limited research investigating the feasibility of using RE in accommodation businesses [
40]. Among those papers, design system optimization, that is, identifying a reliable and affordable system configuration, has been the main focus. Due to highly complicated dynamics between the major factors (costs, system performance, and energy demand/supply management), designing such an RE system is challenging. Therefore, a cost-effective energy solution requires an appropriate combination of RE systems [
41]. Generally speaking, simulation-based optimization is arguably the most popular tool for solving this kind of problem [
42]. Hybrid optimization of multiple energy resources (HOMER) [
43] is one of the most well-known software developed for such purposes, with cost minimization as the primary objective. At a high level, HOMER works by simulating various system configurations based on user inputs [
44]. Limited by its optimization technique, HOMER does not always produce an optimal solution. To be precise, when there are a large number of system configurations, HOMER often identifies only a suboptimal solution. Some researchers [
45,
46] also use mathematical optimization models, and the results are more cost-effective than HOMER.
Despite these issues, several tourism-related papers have used HOMER to evaluate the usage of RE at accommodation facilities. Dalton et al. [
47] conducted a cost study and evaluated the allocation of various configurations, including solar or wind energy (i.e., stand-alone RE), diesel-only, and diesel–RE. Using HOMER, these simulations revealed the feasibility of using renewables to meet all energy needs in an Australian resort. Another finding was that diesel–RE would cost 30% less than the other configurations. Furthermore, Dalton et al. [
48] extended the research to investigate the current and future feasibility of a stand-alone hybrid solar–wind system using three tourist hotels as case studies. Güler et al. [
49] used HOMER to determine the optimal size of RE technologies, including solar panels, wind turbines, batteries, and converters, for an uninterrupted power supply for a Turkish hotel. Since the hotel had a surplus RE (that is, RE neither consumed by the hotel nor saved in the battery) in certain time periods, it would be able to open up new revenue streams for the hotel. Fazelpour et al. [
50] investigated the environmental benefits of deploying an RE system at an Iranian hotel with HOMER. When emission costs were considered, the most effective configuration changed from a diesel-only to a diesel–wind system. Using HOMER, Shezan et al. [
51] analyzed the performance of a stand-alone diesel–wind system to power an eco-lodge in the highlands of Malaysia. In addition to the applicability of the RE system for supplying remote areas, this study also proves that the optimal allocation of renewables requires accurate weather data. Khan et al. [
52] explored the competitiveness of various hybrid systems with HOMER for supplying energy in an island resort. A diesel–solar–wind–hydro system had the highest RE penetration compared to others. However, this configuration is not feasible since only a certain amount of land is available for solar panel installation. Finally, Hossain et al. [
53] demonstrated that a hybrid energy system consisting of two or more RE sources used together (e.g., diesel–solar–wind system) is more viable than energy systems with only one type of energy source. Another finding was that energy demand may vary greatly depending on the season due to occupancy rates, which was also studied by Borowski et al. [
54].
Another simulation-based tool called transient system simulation program (TRNSYS) [
55] has also been used to study energy problems for tourism facilities. This software offers flexibility by allowing users to modify their models [
56] or adjust the component library when necessary [
57]. Buonomano et al. [
58] used TRNSYS to simulate a geothermal–solar energy system at an Italian resort. This study proves the importance of oil tanks used as energy storage to regulate the fluctuating solar energy supply. Beccali et al. [
59] confirmed the critical role of a battery in balancing the intermittency of renewables. Using TRNSYS, their results highlight that the battery can reduce the purchased electricity from the power grid by up to 61%. In addition to simulation, heuristic algorithms are also a popular tool for solving RE problems in accommodation facilities. Soheyli et al. [
60] developed a multi-objective particle swarm optimization (PSO) algorithm to minimize costs, land requirements, and CO
2 emissions for an Iranian hotel. According to their results, an integrated RE system for cooling, heating, and power generation is less costly than a separate system. Meschede et al. [
61] showed that occupancy fluctuations between weekends and weekdays can significantly affect energy demand. Therefore, generating synthetic time series data of energy demand based on simulated occupancy and weather data would be useful in providing a realistic setting. The levelized cost of electricity (LCOE) is also used to evaluate RE configurations from a financial perspective as it is able to capture long-term economic sustainability.
Table 1 presents the key features of tourism accommodation papers on the system optimization of RE systems. It also includes the cost of energy for comparing the average cost per kWh for energy generation. From this table, findings and proposed contributions can be summarized as follows.
Most prior studies do not determine the optimal location for deploying REGDs. Although Soheyli et al. [
60] investigate the total area required, they do not investigate which locations are suitable for each RE technology. This study proposes the optimal location-sizing decisions on deploying a hybrid RE system at the B&B location to fill this gap. To the author’s knowledge, this is the first study in tourism accommodations that determines the optimal size of the RE system for each suitable location.
While simulation often provides suboptimal solutions, all of the prior studies use simulation-based optimization using software [
47,
48,
49,
50,
51,
52,
53,
58,
59] and heuristic algorithms (PSO) [
60,
61]. Therefore, the MIP model is developed in this study as a proposed method to solve the problem.
Since the cost of implementing 100% RE is relatively high for some B&Bs, integrating the RE system with the power grid would be an attempt to bridge the high costs of RE and the affordability for B&Bs. Based on the literature, only the research of [
49,
61] include the power grid in the RE system. This integration also offers more flexibility in evaluating the conflicting objectives of energy planning (costs vs. emissions). Interestingly, almost half of the prior studies do not consider the volume of emissions that can be reduced in the RE system [
48,
49,
58,
59,
61]. This study attempts to fill this gap by integrating the power grid into the RE system to eventually reach 100% RE. Therefore, the model would allocate a specific portion of energy demands that RE must meet and the power grid supplies the rest (e.g., 50% RE, 60% RE, …, 100% RE).
All prior studies use a specific type of solar panel and/or wind turbine for the RE system. They neglect the existence of various REGDs on the market, especially new-generation RE technologies, which may provide higher energy generation at higher costs. This study evaluates various types of solar and wind REGDs, both conventional and unconventional, to assist B&Bs in investing in RE technologies.
With regards to energy demand, only Meschede et al. [
61] consider that higher occupancy on weekends creates a higher energy demand than on weekdays. This study uses this finding when establishing energy demand data for the B&B.
In summary, various energy components are integrated into a model to ensure smooth energy transition, including hybrid RE, batteries, the power grid, different self-sufficiency targets, and different RE technologies.
3. Optimization Model
An MIP model is presented in the following section to serve as the main decision-making tool. By considering all available locations at the B&B suitable for RE generation, the proposed model will select appropriate REGDs to operate at each location, generating sufficient RE to meet the B&B’s energy demands. If necessary, this model will also use batteries (with a suitable storage capacity) to facilitate RE usage. As most B&Bs are a small tourism business run by a single family, they certainly want to make every investment dollar count. Therefore, the model’s objective is set to identify a particular deployment of REGDs so that the required investments are as low as possible. The model’s details are as follows.
Use the rooftop as an example. Suppose a particular B&B can choose solar panels, small wind turbines, or a Tesla solar roof [
62] to generate RE from their rooftop. In this case, the rooftop is then an element of L and when
l is indicating the rooftop,
is then a set containing three elements: solar panels, small wind turbines, and a Tesla solar roof.
For example, if d represents a solar panel to be installed at the rooftop, is approximately 1.67 m2.
Continuing from the above example, if d is a solar panel and l is the rooftop, will indicate the total number of solar panels to be installed at the B&B’s rooftop.
is the total energy (kWh) generated by those REGDs deployed at location l during planning period t.
B is the required number of batteries.
is the RE that is saved in the batteries at the end of the planning period t (kWh).
is the RE that is no use to the B&B in the planning period t (kWh).
The following is the proposed MIP model
The model’s objective, Equation (1), is to minimize the total costs for the subject B&B, which includes the battery costs and REGD costs incurred over the planning horizon. The REGD costs are calculated by multiplying the RE generated by certain REGDs deployed at each available location
l (that is, those REGDs contained in
) with their corresponding energy generation costs (that is,
). Equation (2) measures the total RE generated from each location
l during each planning period
t (
).
is contributed by REGDs that the model decides to deploy at
l (that is,
). Therefore, if every
has a zero value,
will also be zero. Equations (3) and (4) calculate the energy saved in the batteries at the end of each planning period (
), equaling the previous energy savings (
) increased by the RE produced in the current planning period and then decreased by the B&B’s energy requirements in the same planning period. As there could be times when the total energy supply is more than the total energy consumption,
will capture that surplus energy when that happens. Equation (5) governs the volume of RE saved in the battery. Generally, this energy cannot exceed the battery’s charge limit, which is approximately 90% of the battery’s storage capacity [
63]. Equation (6) governs the deployment of all REGDs suitable for each location
l, ensuring that they do not overuse the available area at
l. Finally, Equation (7) specifies the allowable range for each decision variable.
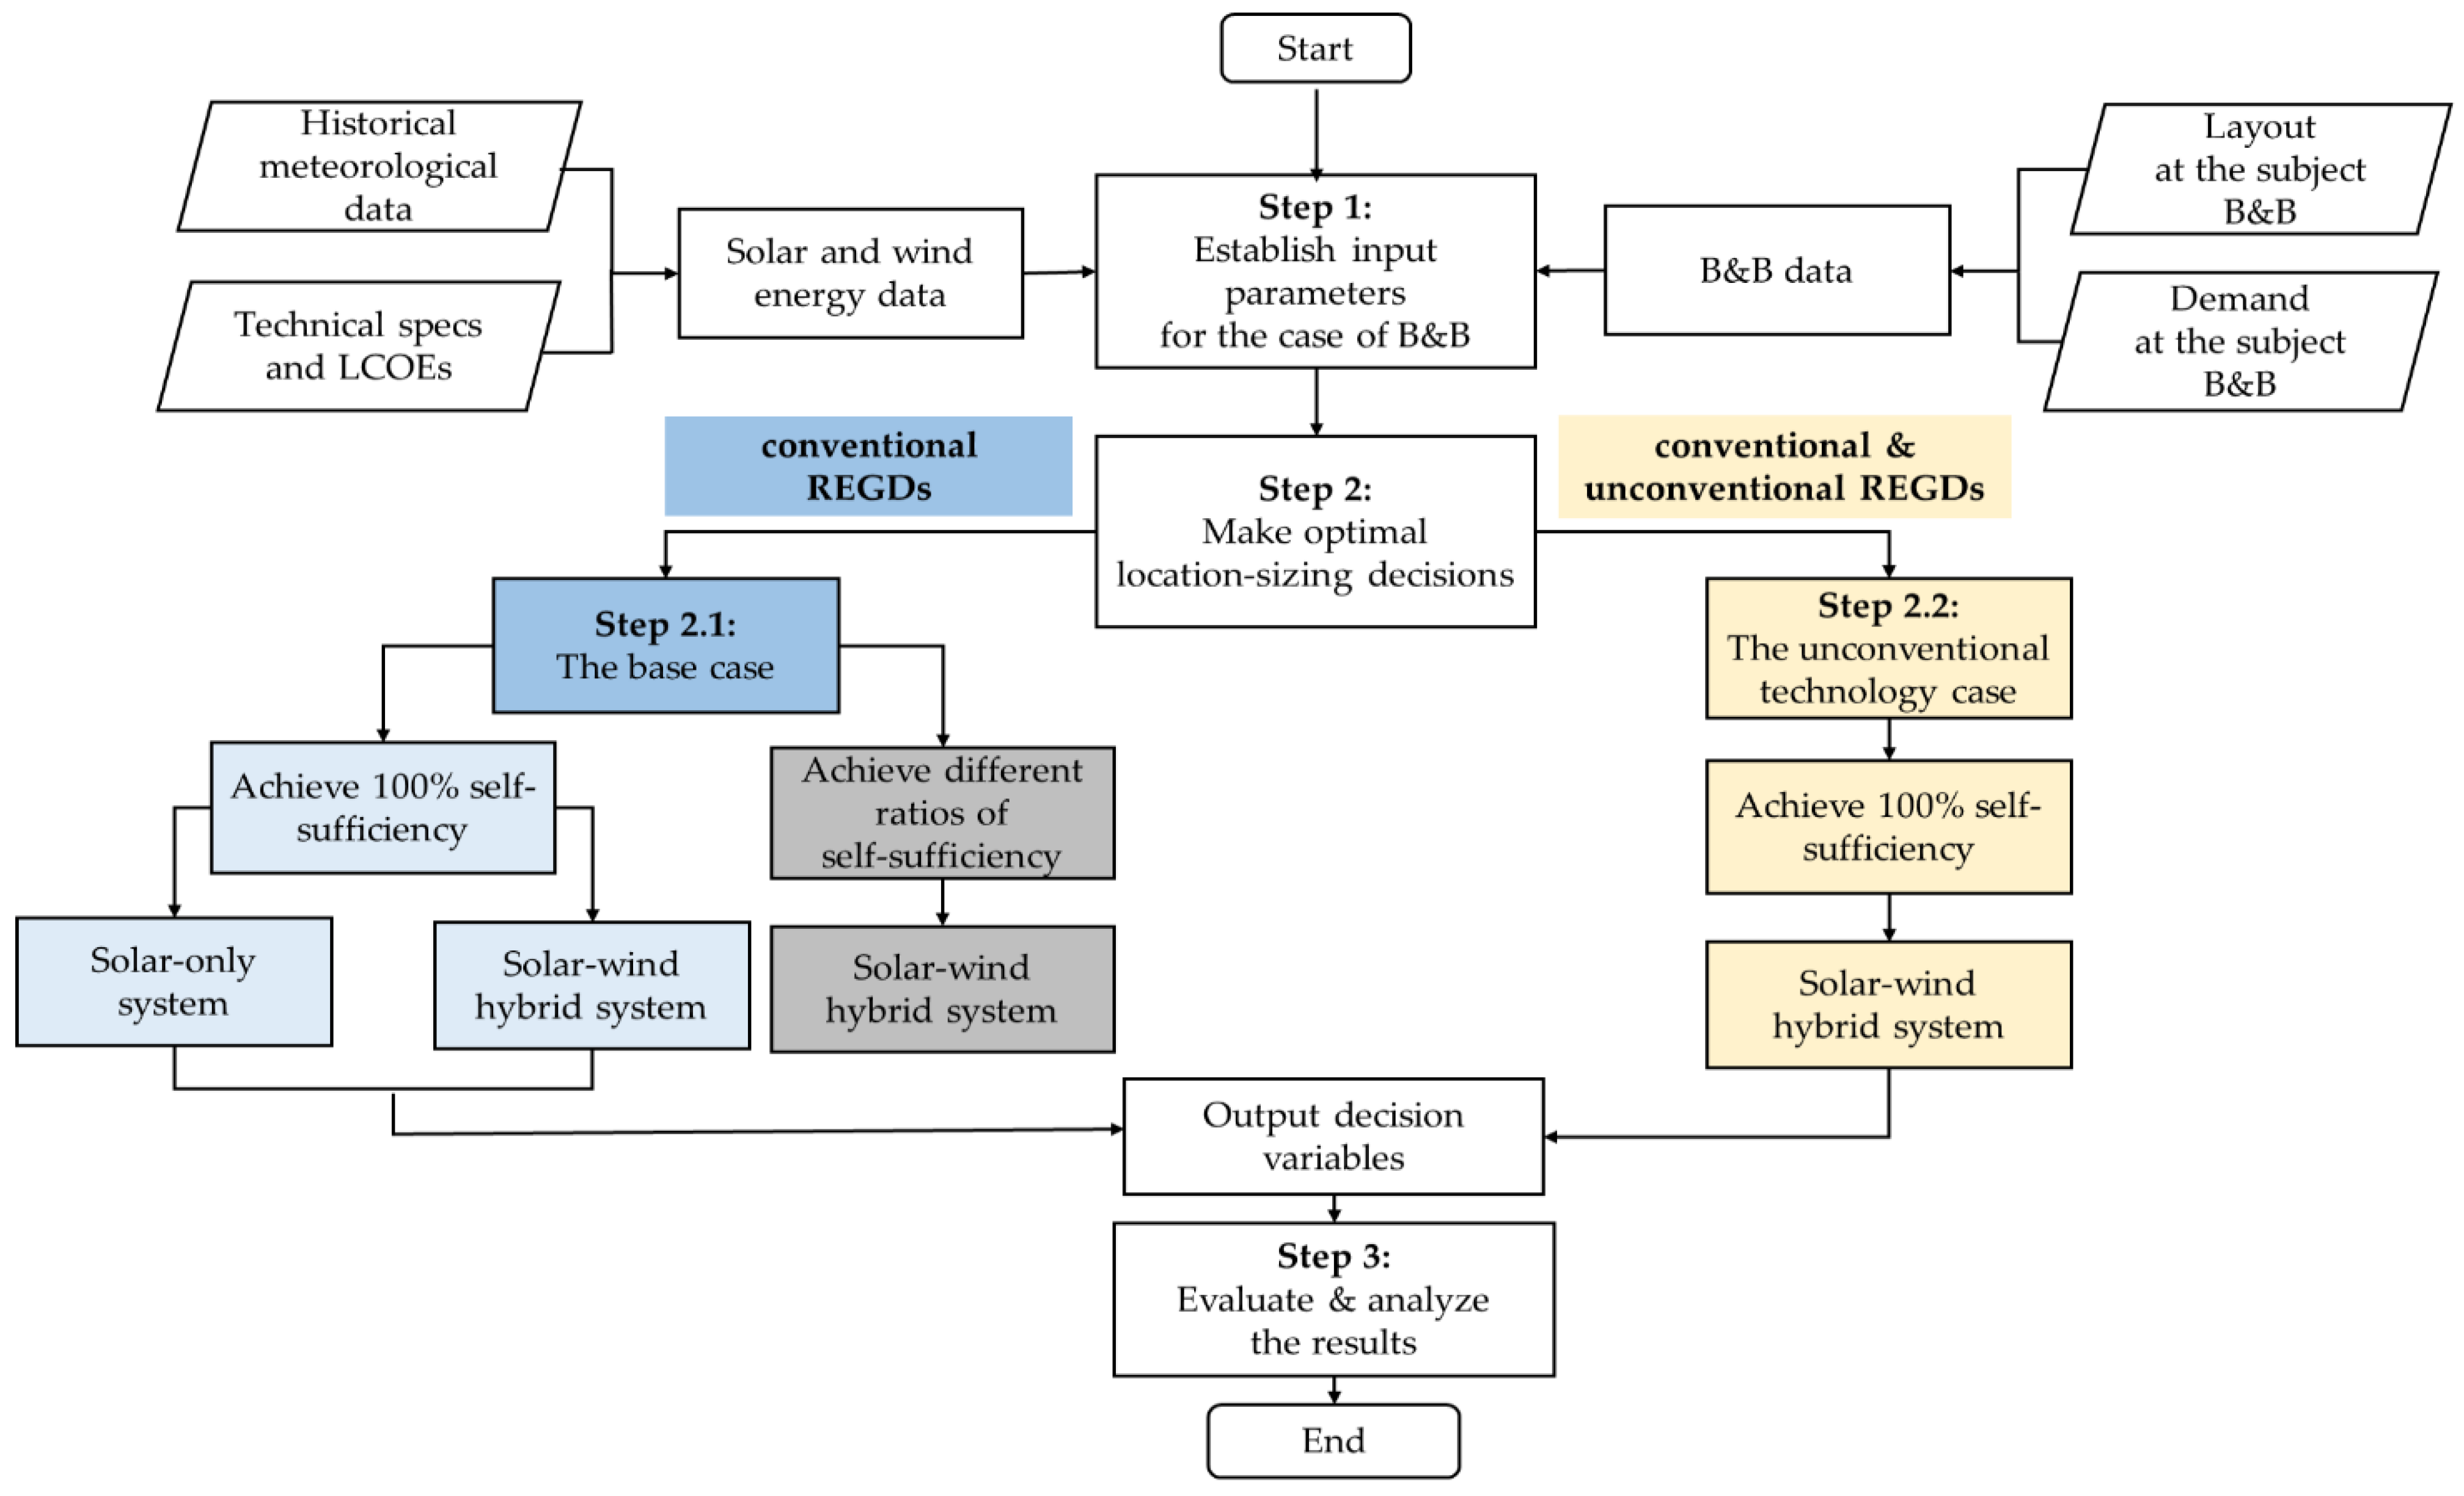
4. Methodology
The methodology includes analytical steps applied in a case study to enable B&Bs to make optimal decisions for their business facility, as presented in
Figure 1.
As shown in
Figure 1, input parameters are obtained from various sources to determine solar and wind energy data and B&B data. Then, the model is applied in two scenarios, the base case (
Section 4.1) and the unconventional technology case (
Section 4.2). For all scenarios, the optimization models are solved with IBM ILOG CPLEX Optimization Studio 20.10, using a personal computer powered by Intel Core i5-1035G1 processor (running at 2.4 GHz) and 16 GB RAM. Finally, an in-depth analysis of the required costs, energy flow, and emission savings is performed to analyze how the proposed system operates in both scenarios. Since many B&Bs still purchase electricity from the power grid to meet their energy demands, the base case analysis also calculates the required electricity costs from the power grid for comparison. On the other hand, some B&Bs need to use every possible location to generate sufficient RE due to limited available land. Therefore, land requirements are considered in the unconventional technology case analysis and compared to the base case.
4.1. The Base Case
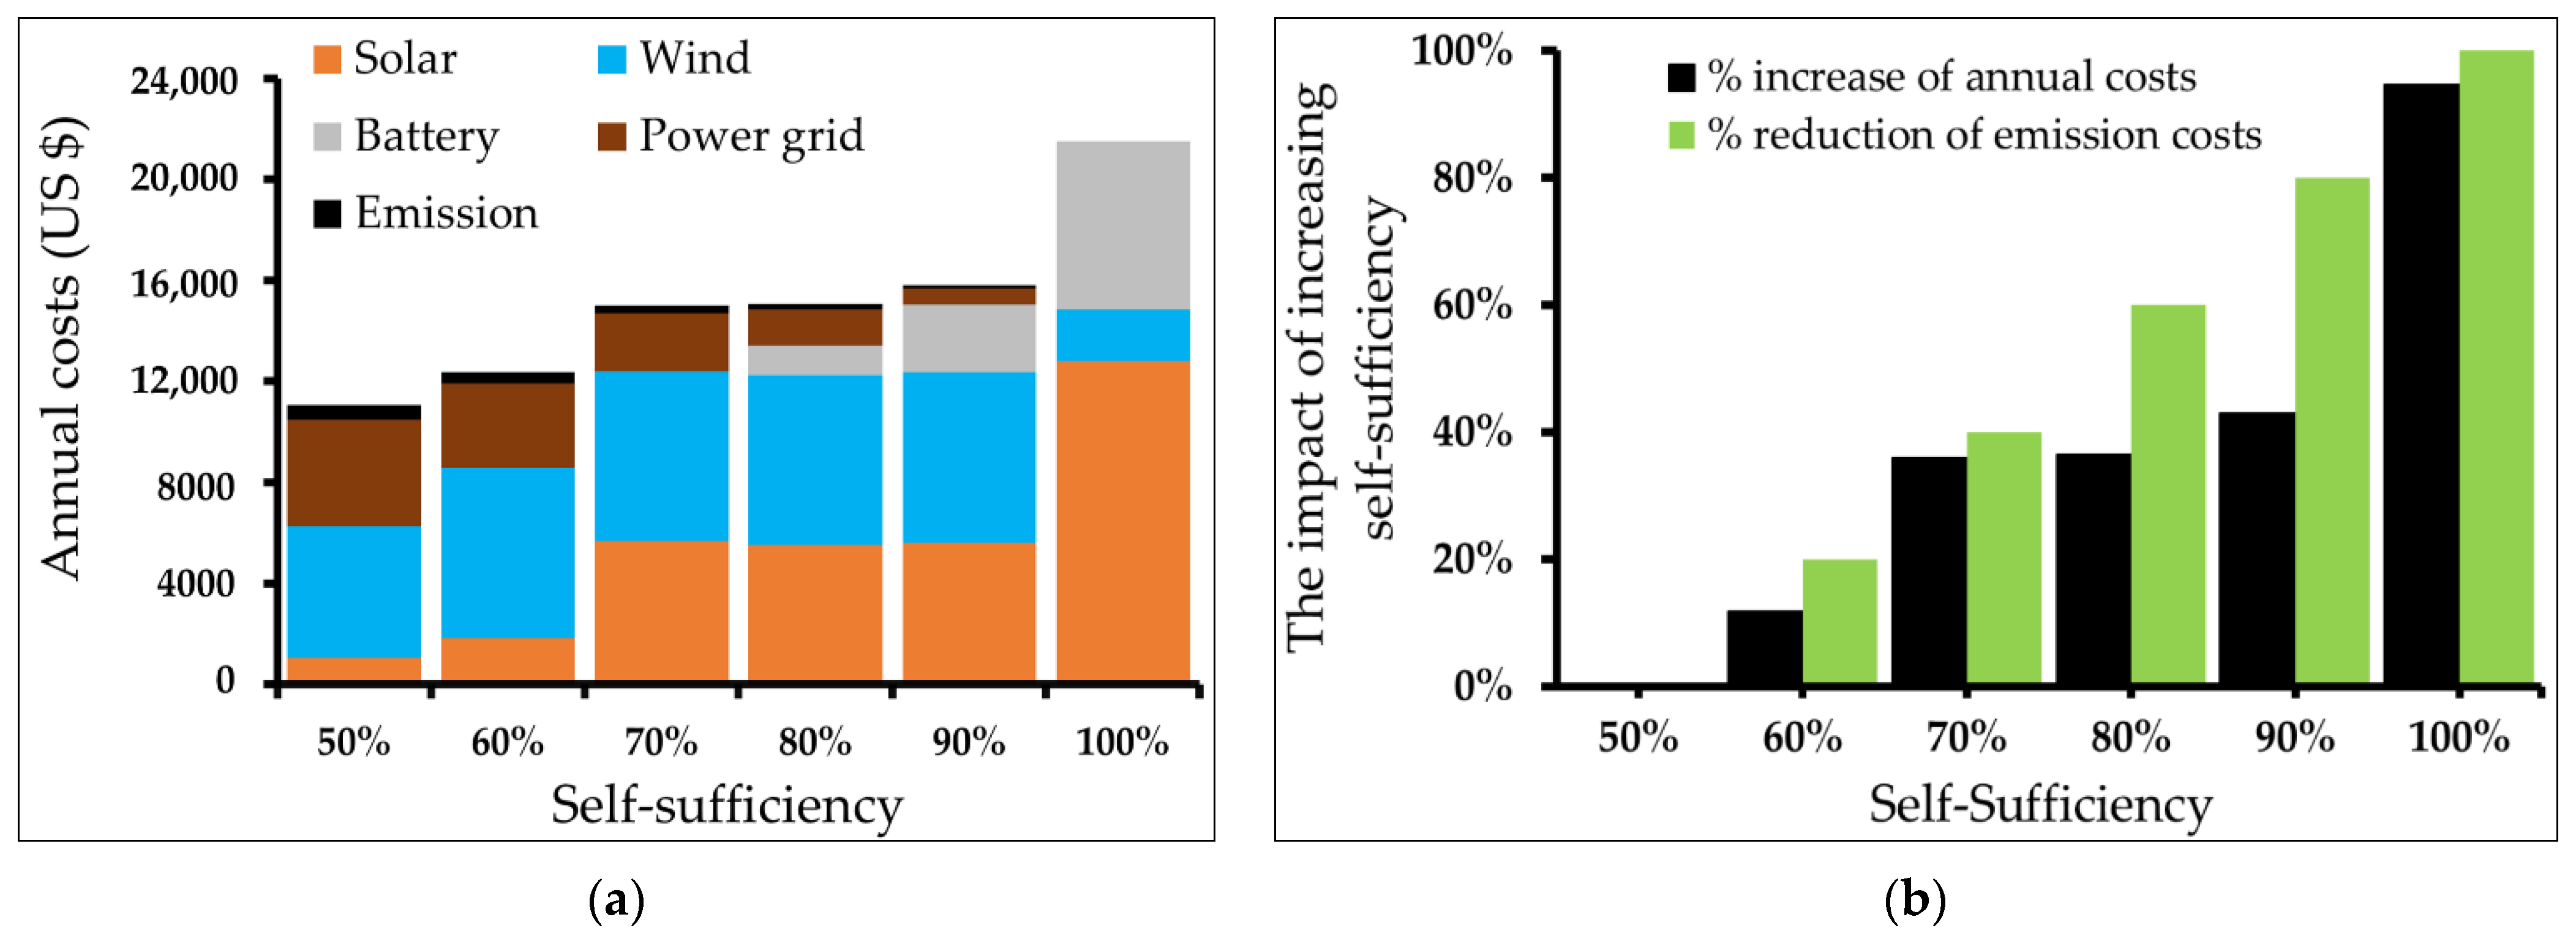
The first scenario, the base case, aims to provide B&B owners with a good understanding of how to green their business with conventional REGDs, including solar panels and small wind turbines. Two configurations are tested, a solar-only RE and a solar–wind hybrid RE system. To gain full insight into the tradeoff between the required costs and the resulting sustainability performance, the MIP model for a solar–wind hybrid RE is performed with these different ratios: 50% RE, 60% RE, …, and finally, 100% RE. For example, at 90% RE or 90% self-sufficiency, renewables supply 90% of the energy demand, while the rest comes from the power grid.
4.2. The Unconventional Technology Case
The second scenario, the unconventional technology case, aims to assess the possibility of deploying conventional REGDs and/or unconventional REGDs. The unconventional REGDs include the Tesla Solar Roof, the Ciel & Terre Floating Solar, and the Wind Tree. The description of each device used in this study is as follows.
The Tesla Solar Roof [
62] has an aesthetic design that resembles a standard roof tile for solar energy generation. Therefore, households can use this Tesla product as a regular tile on their rooftop while also receiving clean solar energy to power their house. Another example is the Ciel & Terre Floating Solar [
64], a modular floating device designed to support a single solar panel with a suitable tilted angle on the water surface. For wind energy, the Wind Tree is [
65] made of dozens of small vertical-axis wind turbines mounted on a metal frame; from a distance, it looks just like a regular tree in nature.
Table A1 and
Table A2 (in
Appendix A) present the specifications of these REGDs.
4.3. Case Study of the B&B
The case study of the B&B uses a subject B&B located in Pingtung, a southern county in Taiwan. As B&Bs are a vital business for transforming rural areas into leisure businesses in Taiwan, their number increased from 40 to 7042 between 2012 and 2016 [
66]. Solar and wind energy also will be the primary source of RE in Taiwan in the coming future [
67]. Interestingly, Pingtung is a suitable location to produce both. Since southern Taiwan has a greater potential for solar energy than the rest of the country, Pingtung can produce approximately 263 GWh of solar energy per year [
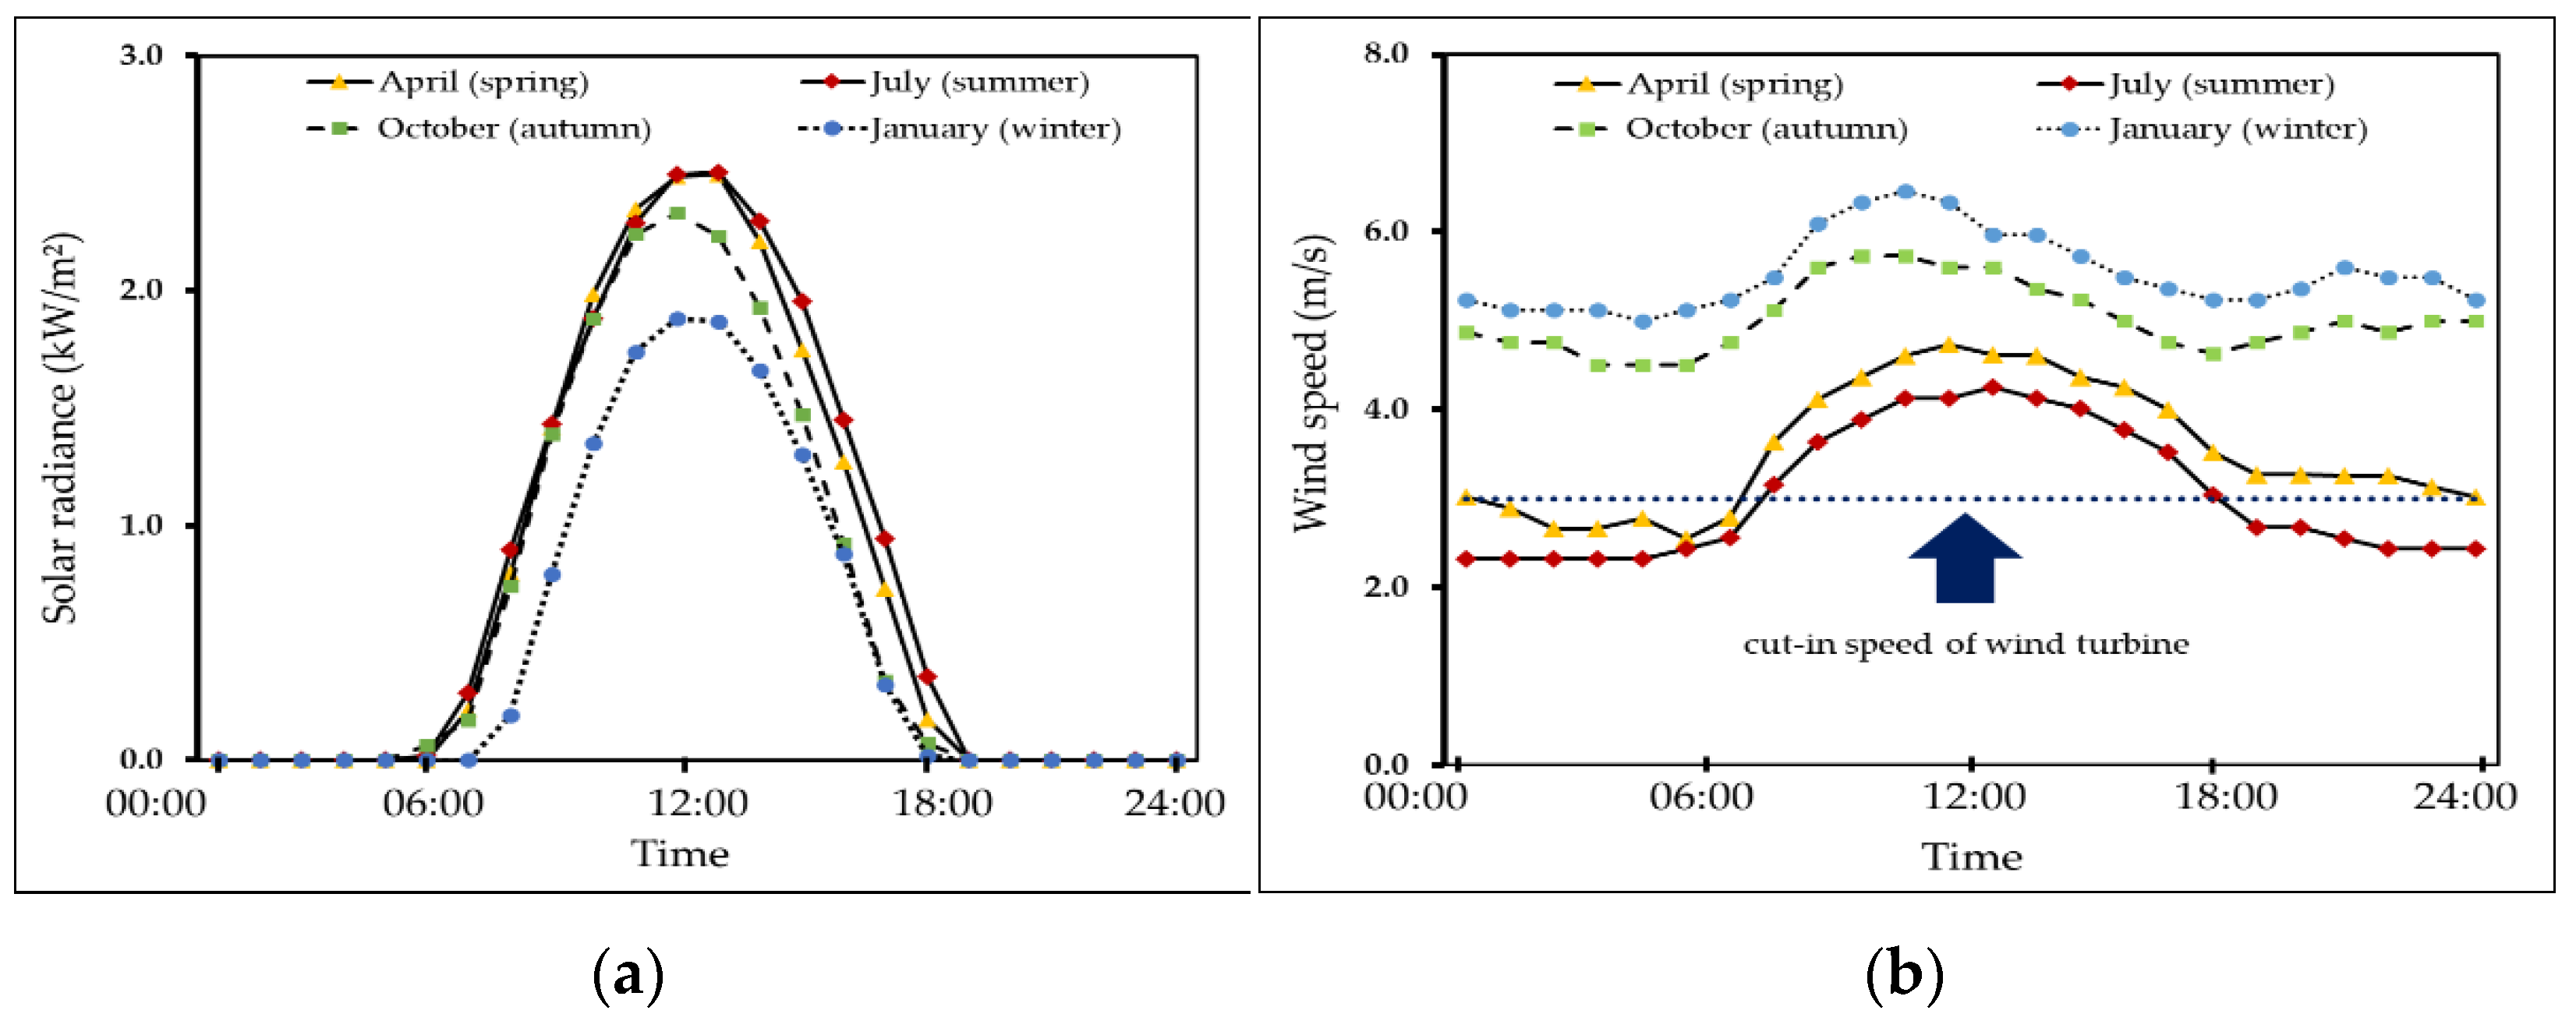
68]. Pingtung is also rich in wind energy, as 66% of the annual hourly wind speed equals and is above 3.0 m/s (the cut-in speed of a wind turbine) [
69]. Moreover, Pingtung has large areas of cropland and fallow land [
68] that would be ideal locations for solar/wind energy production.
4.3.1. Solar and Wind Energy Data
This study uses a meteorological report of Pingtung station from the Taiwan Central Weather Bureau, ranging from 2011 to 2020 [
69]. The months of April, July, October, and January are selected to cover different seasons in Taiwan, namely spring, summer, autumn, and winter.
Figure A1 (in
Appendix A) summarizes the 24-h solar radiance and wind speed data in Pingtung using 10-year average data for each season-representing month. The figures also present that these hourly data can be summarized in solar/wind supply for a 6-h time period: 00:00–06:00, 06:00–12:00, 12:00–18:00, and 18:00–24:00 for the first, second, third, and fourth time periods, respectively. In order to conduct more realistic simulations of energy supply, this study considers formulas from published research [
70,
71] and technical specs of REGDs (
Table A1 and
Table A2 in
Appendix A).
In financial terms, RE technologies available in the current market may vary in maturity. Therefore, different approaches should be considered to provide an accurate estimate of the costs of producing and saving energy. For conventional REGDs, this study adopts the work of Ouyang and Lin [
72], which calculates the LCOE based on the existing feed-in tariff. In this study, the LCOE is assumed to be 40% lower than the Taiwanese feed-in tariff [
73], that is, USD 0.120/kWh for conventional solar panels and USD 0.200/kWh for wind turbines. For unconventional REGDs, this study adopts an established formula [
74] that calculates LCOE based on costs, performance, and reliability. The capital costs are taken from [
62,
75,
76], the operation and maintenance costs are assumed to be 1.5% of the capital costs, and the project’s economic life is assumed to be 25 years. An interest rate of 7.0% is used since the interest rate of various RE projects ranges from 5% to 10% [
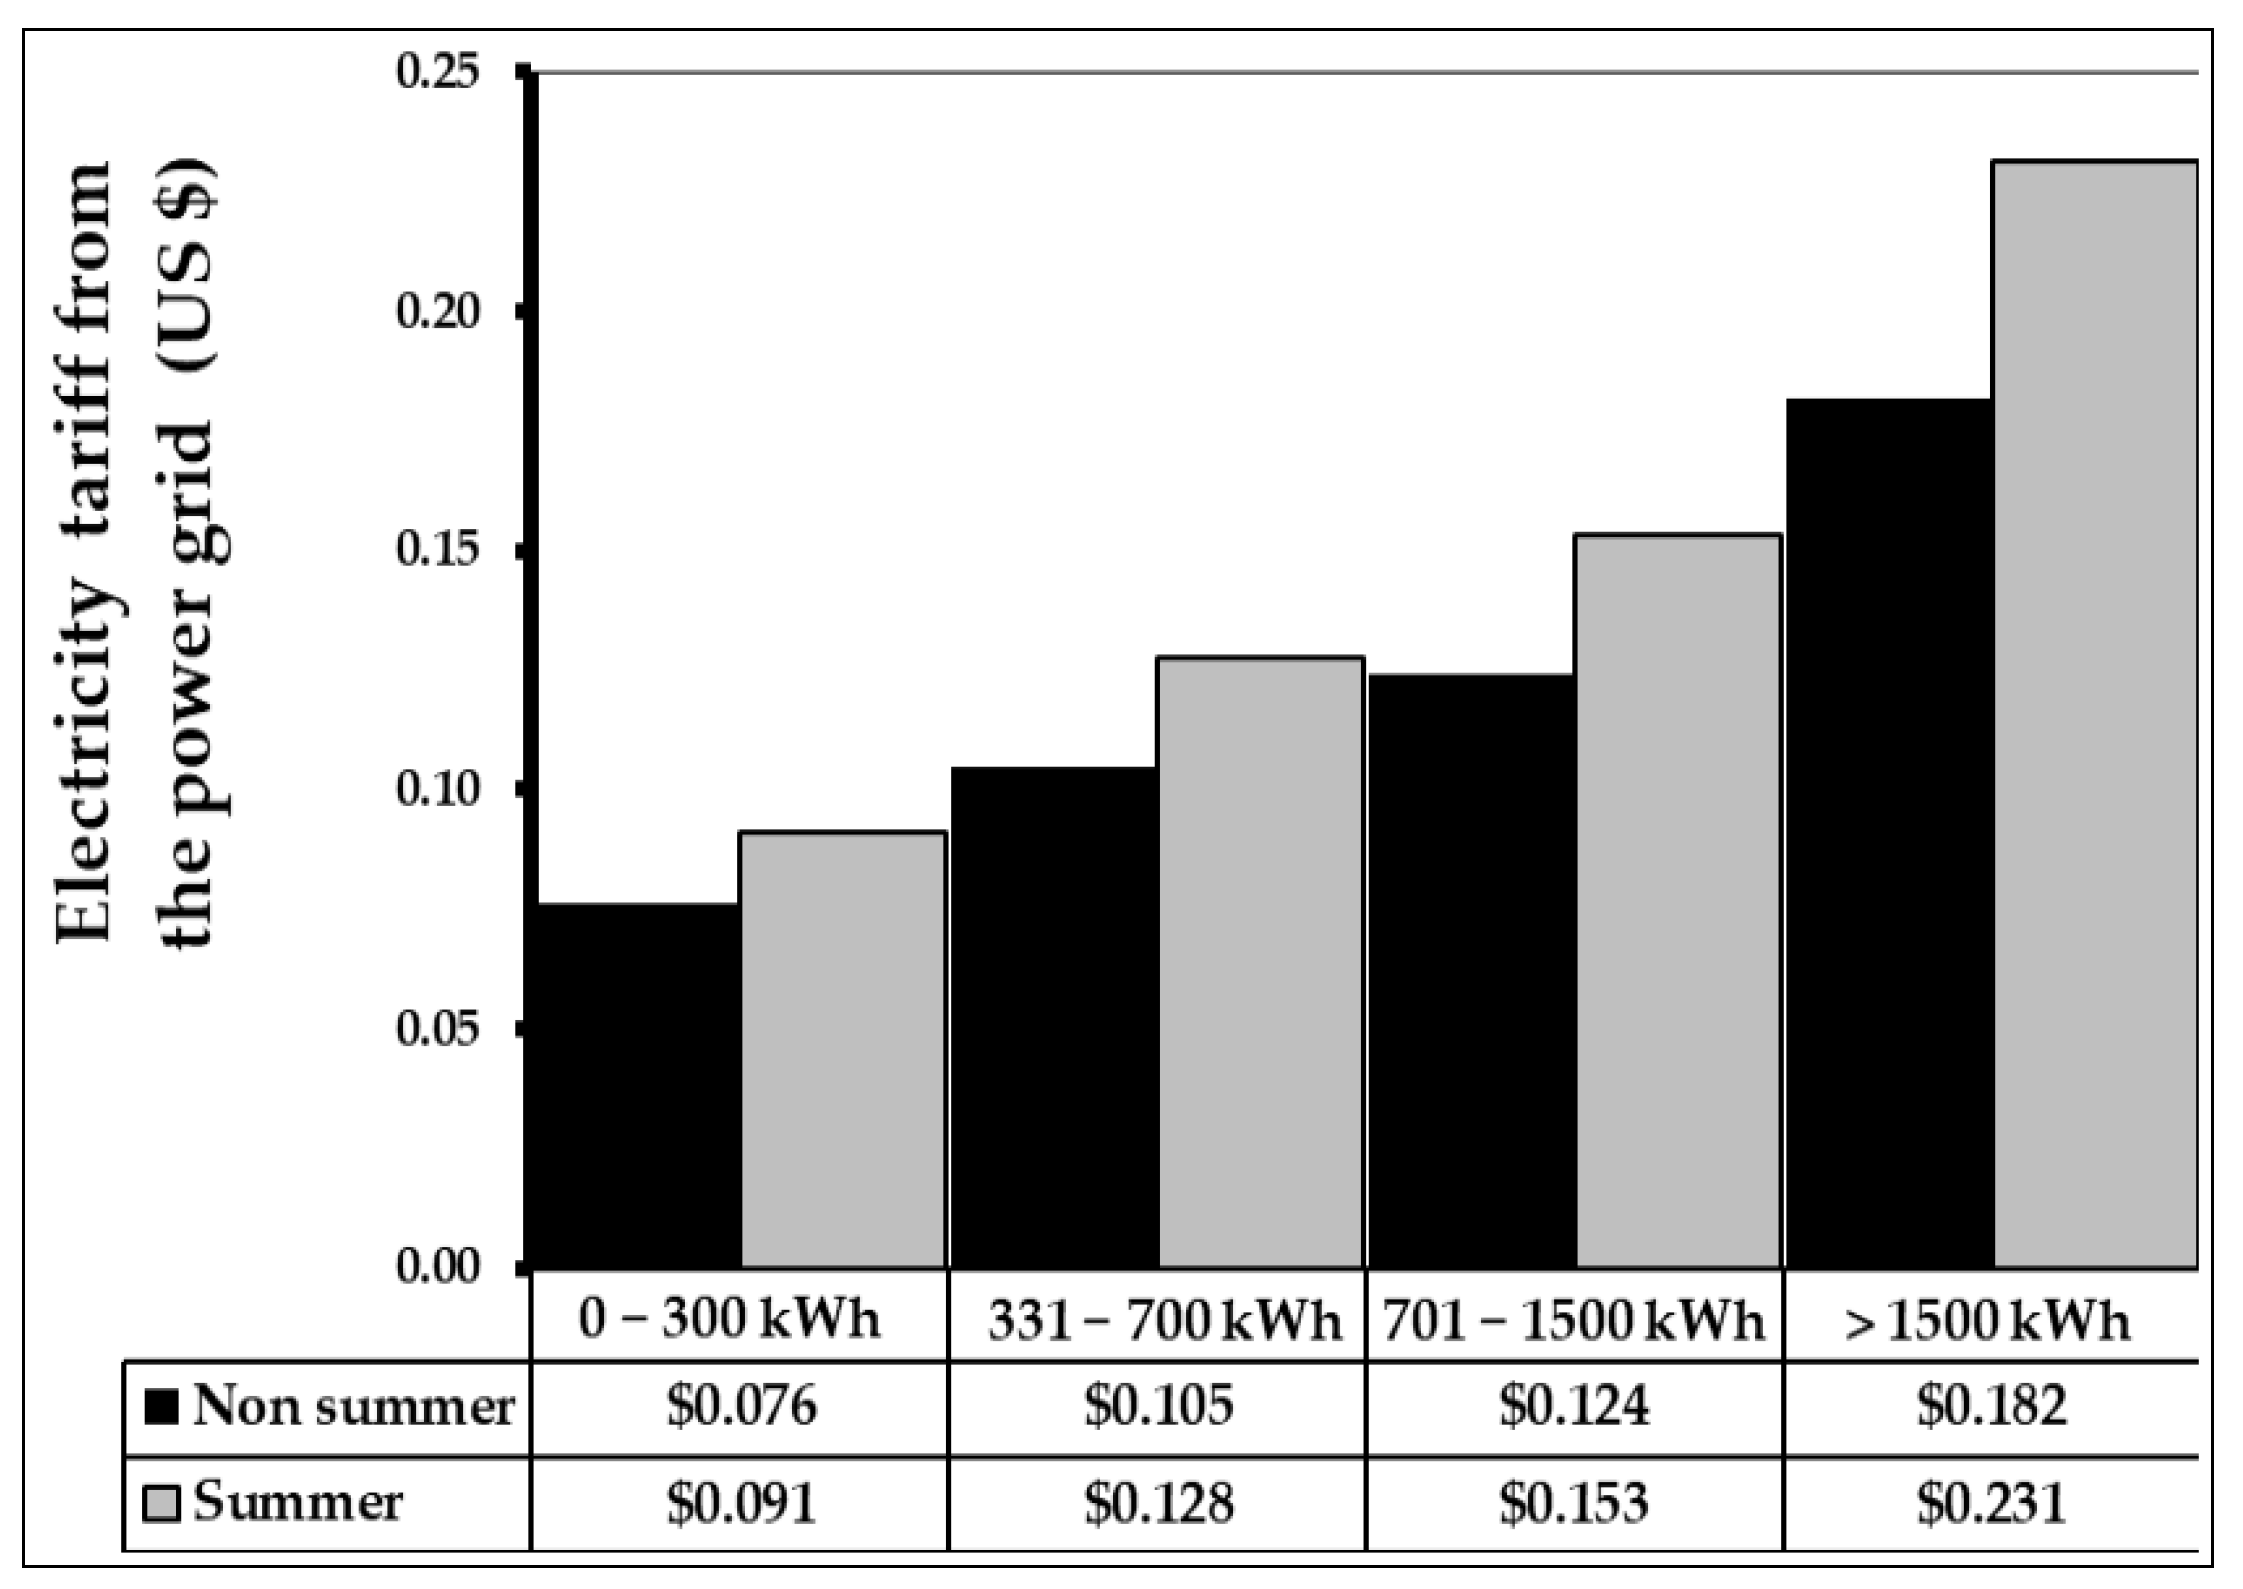
77]. Accordingly, the LCOEs for unconventional REGDs are as follows: USD 0.171/kWh, USD 0.139/kWh, and USD 0.488/kWh for the Tesla Solar Roof, the Ciel & Terre Floating Solar, and the Wind Tree, respectively. For comparison, B&Bs can pay electricity from the power grid for an average of USD 0.136/kWh, depending on the timing and amount of consumption (
Figure A2 in
Appendix D). Following a procedure similar to unconventional REGDs and the corresponding data [
63,
78], the LCOE for saving energy or unit battery cost can also be calculated, that is, USD 52.72/kWh.
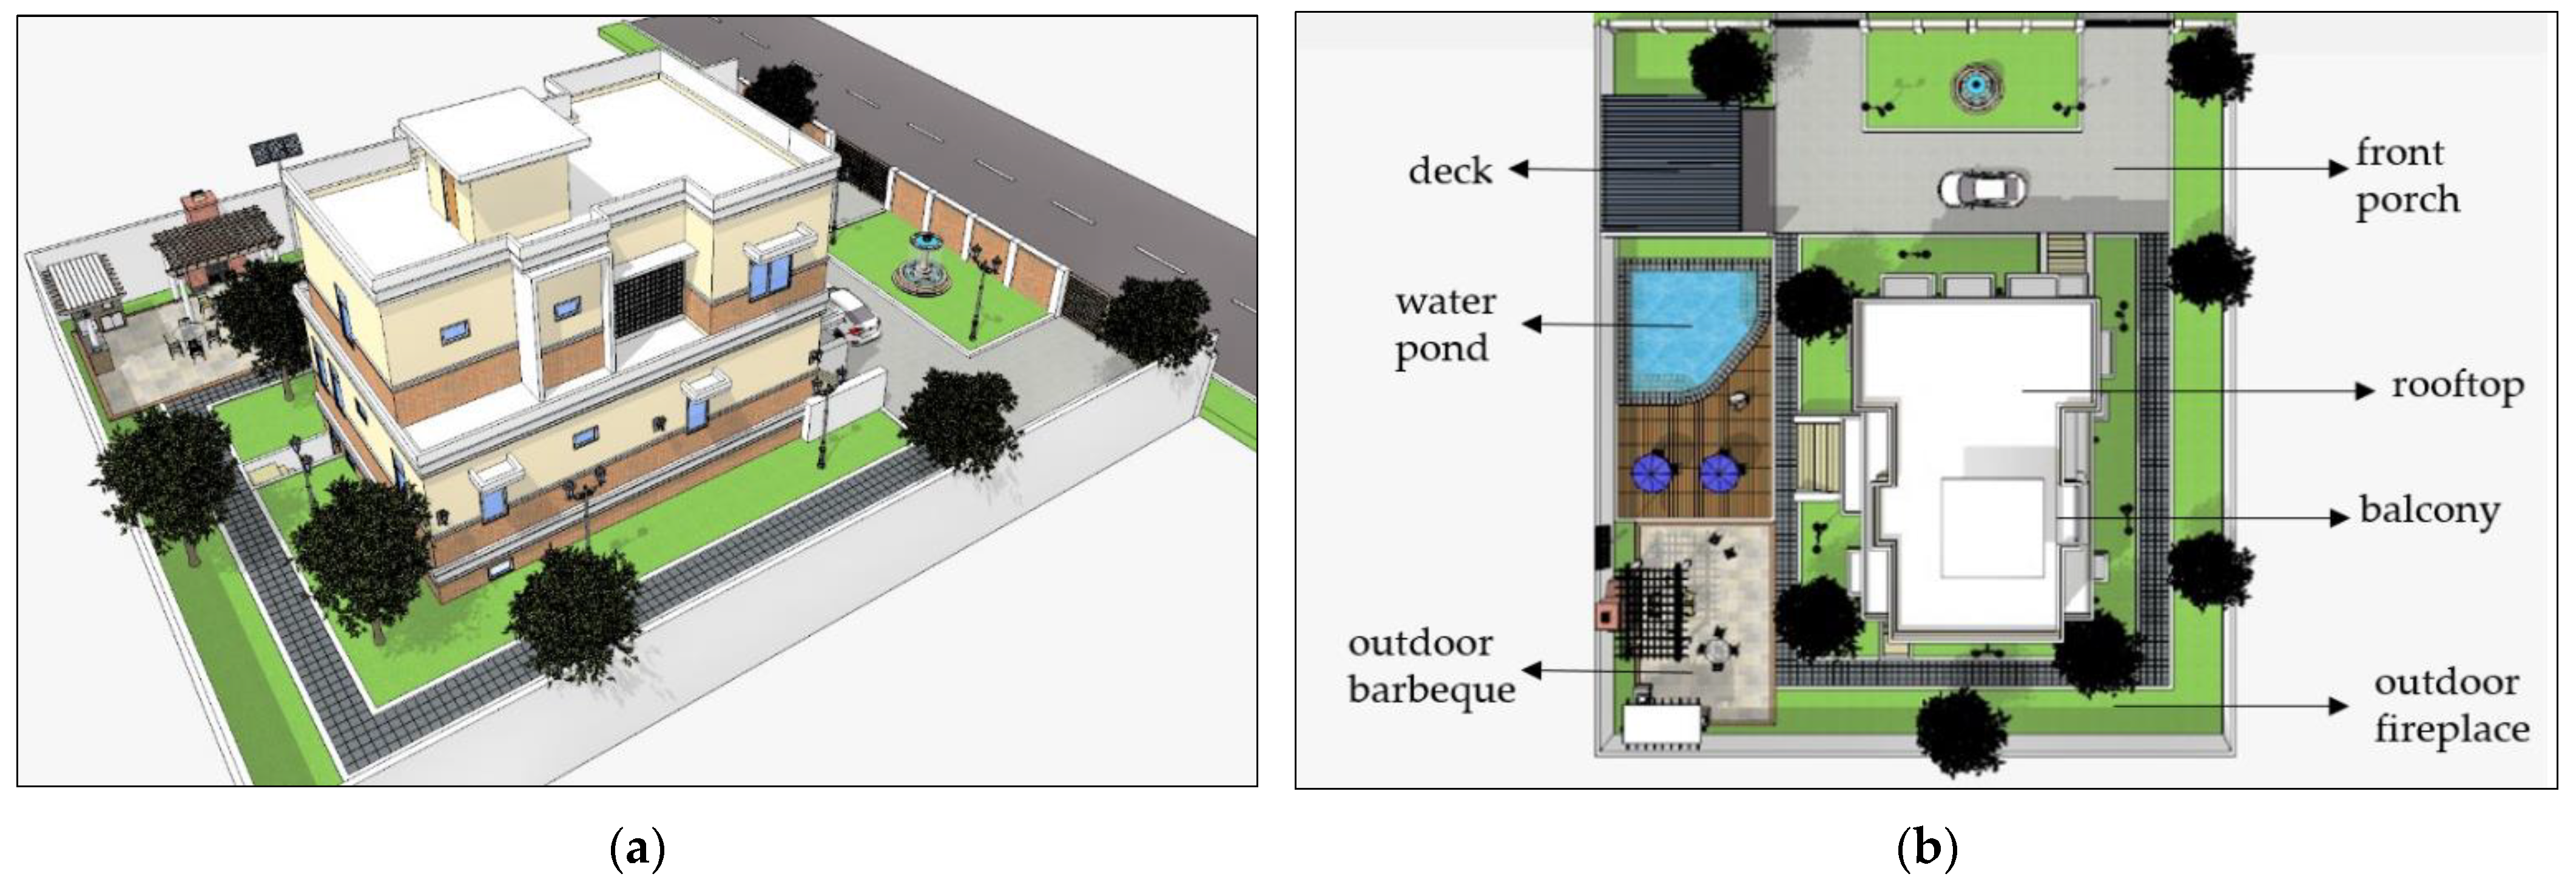
4.3.2. Layout at the Subject B&B
Due to difficulties in acquiring real data, this study adopts the layout of a two-story building [
79] for the subject B&B in Pingtung. This B&B has a ground floor area and a total floor area of 136 and 371 m
2, respectively. There are a total of six rooms on the first and the second floor; four of them are guest rooms (sizes ranging from 15 to 25 m
2). Outside of the main building, there is a deck, a water pond, an outdoor barbeque, a front porch, a rooftop, a balcony, and an outdoor fireplace. In addition to deploying solar panels at such conventional locations as the ground, other locations are also suitable for installation. For example, water ponds (e.g., quarry lakes, irrigation canals, and other wetlands) have been practically used to generate electricity due to the shortage of available land on the market.
Figure 2 presents the graphical illustration of the subject B&B from different views, with 3D and 2D top-view. According to
Figure 2b, possible locations and available areas at the subject B&B to install conventional and unconventional REGDs are listed in
Table 2.
4.3.3. Demand at the Subject B&B
Due to a lack of information on actual energy profiles of buildings, especially hourly energy profiles [
80], there are works of literature that use methods to derive approximate profiles. This study adopts the regression model presented by Wang [
81] to create a realistic energy profile for the subject B&B. According to that study, several factors such as occupancy rate, floor area, room rate, and year of construction are included in estimating annual energy demands. Using the quantitative approaches proposed by Lamagna et al. [
82] and incorporating historical monthly occupancy data from the Taiwan Tourism Bureau from 2013 to 2018 [
15], the annual demands are then disaggregated into monthly ones. The representative study of hotel energy profiles by Chung and Park [
83] is used to allocate the monthly demands into hourly energy demands. According to that literature, the hourly energy demand correlates with the hourly portion of the total monthly demand. This study also considers the literature that examines hourly guest activity in a day at B&B in Taiwan. As Chen et al. [
84] noticed, B&B guests in Taiwan prefer to conduct outdoor activities, such as enjoying scenic places nearby. Generally, they would not stay in their room after checking in (at 15:00 or after). Consequently, the daily peak electricity demand in the B&B generally occurs during nighttime hours (i.e., the fourth time period, 18:00–24:00) when guests return from their trips. The third time period (12:00–18:00) is also a high peak demand as guests begin to occupy their rooms after check-in.
The allocation process also considers not only daily/weekly demand peaks but also holidays and general travel patterns during the year. In Taiwan, the most important holiday is the lunar new year, which occurs in January or February, and the school’s winter vacation also takes place in January and February. The mid-autumn festival is another major holiday that occurs in September or October. Moreover, a spring break (four or five consecutive days) occurs at the beginning of April. Furthermore, the summer months are a prevalent time for travel. Consequently, the energy demands in June, July, and August are the highest during the year.
Table A3 (in
Appendix B) summarizes the energy demand in each time period for each season-representing month at the subject B&B.
6. Conclusions
This study aims to provide a practical approach for all B&B businesses to make optimal location-sizing decisions on deploying hybrid RE technologies. An MIP model is developed and applied in a case study with realistic B&B settings and energy data. The case study contains two scenarios, the base case and the unconventional technology case. The MIP model successfully solves both scenarios to optimality, identifying an optimal RE system that can generate an annual 116,942 kWh of RE for the base case (at the cost of USD 21,499) and an annual 114,474 kWh of RE for the unconventional technology case (at the cost of USD 24,670), respectively. This would result in an emissions saving of 26,715 kgCO2e/year (compared to purchasing the required electricity from the power grid). Although the annual cost of hybrid RE is 14.6% less than solar-only, it is still significantly higher than the annual cost of the power grid. In addition to the cost difference between RE technologies and the power grid, overproduction due to time differences in energy generation and energy consumption also contributes to the high cost of hybrid RE. Therefore, simulating the energy transition by sharing the energy demand between RE and the power grid (based on a specific share) would allow B&Bs to initiate the energy transition with affordable costs and acceptable emissions. With 50% self-sufficiency as the baseline, annual costs would increase from 11.8% to 94.0% if self-sufficiency is increased from 60% to 100%. The annual costs in the unconventional technology case are 14.7% higher than in the base case. However, the area needed to install REGDs in the unconventional technology case is 14.2% less than the base case.
As B&Bs can make smart decisions in the RE mix, the performance reliability of REGDs becomes critical as they are exposed to outdoor conditions. Therefore, considering age-related performance degradation on RE technologies would enhance the value of future research. Future studies may also investigate emission reduction targets as, in reality, the maximum emissions allowed by policymakers become a critical challenge in energy planning.


