
Study on Representative Parameters of Reverse Engineering for Maintenance of Ballasted Tracks


Abstract
:1. Introduction
2. Related Works
3. Representative Parameters for Ballasted Track
3.1. Maintenance Standards for Ballasted Track
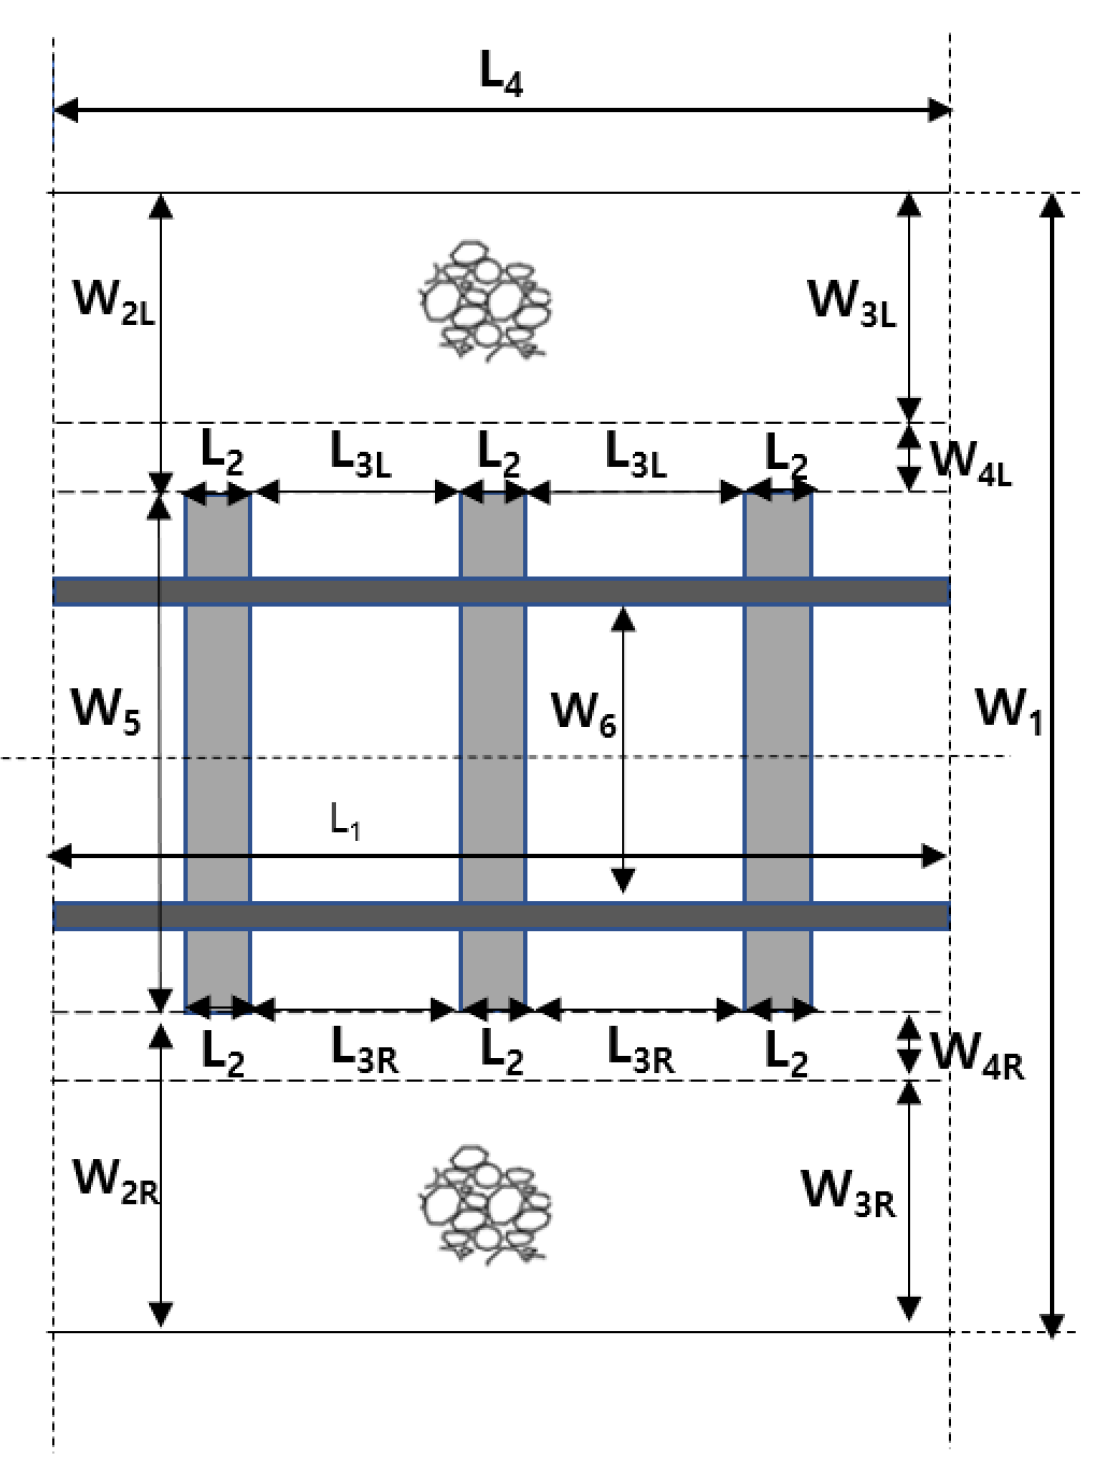
3.2. Decision of the Representative Parameter on Ballasted Track
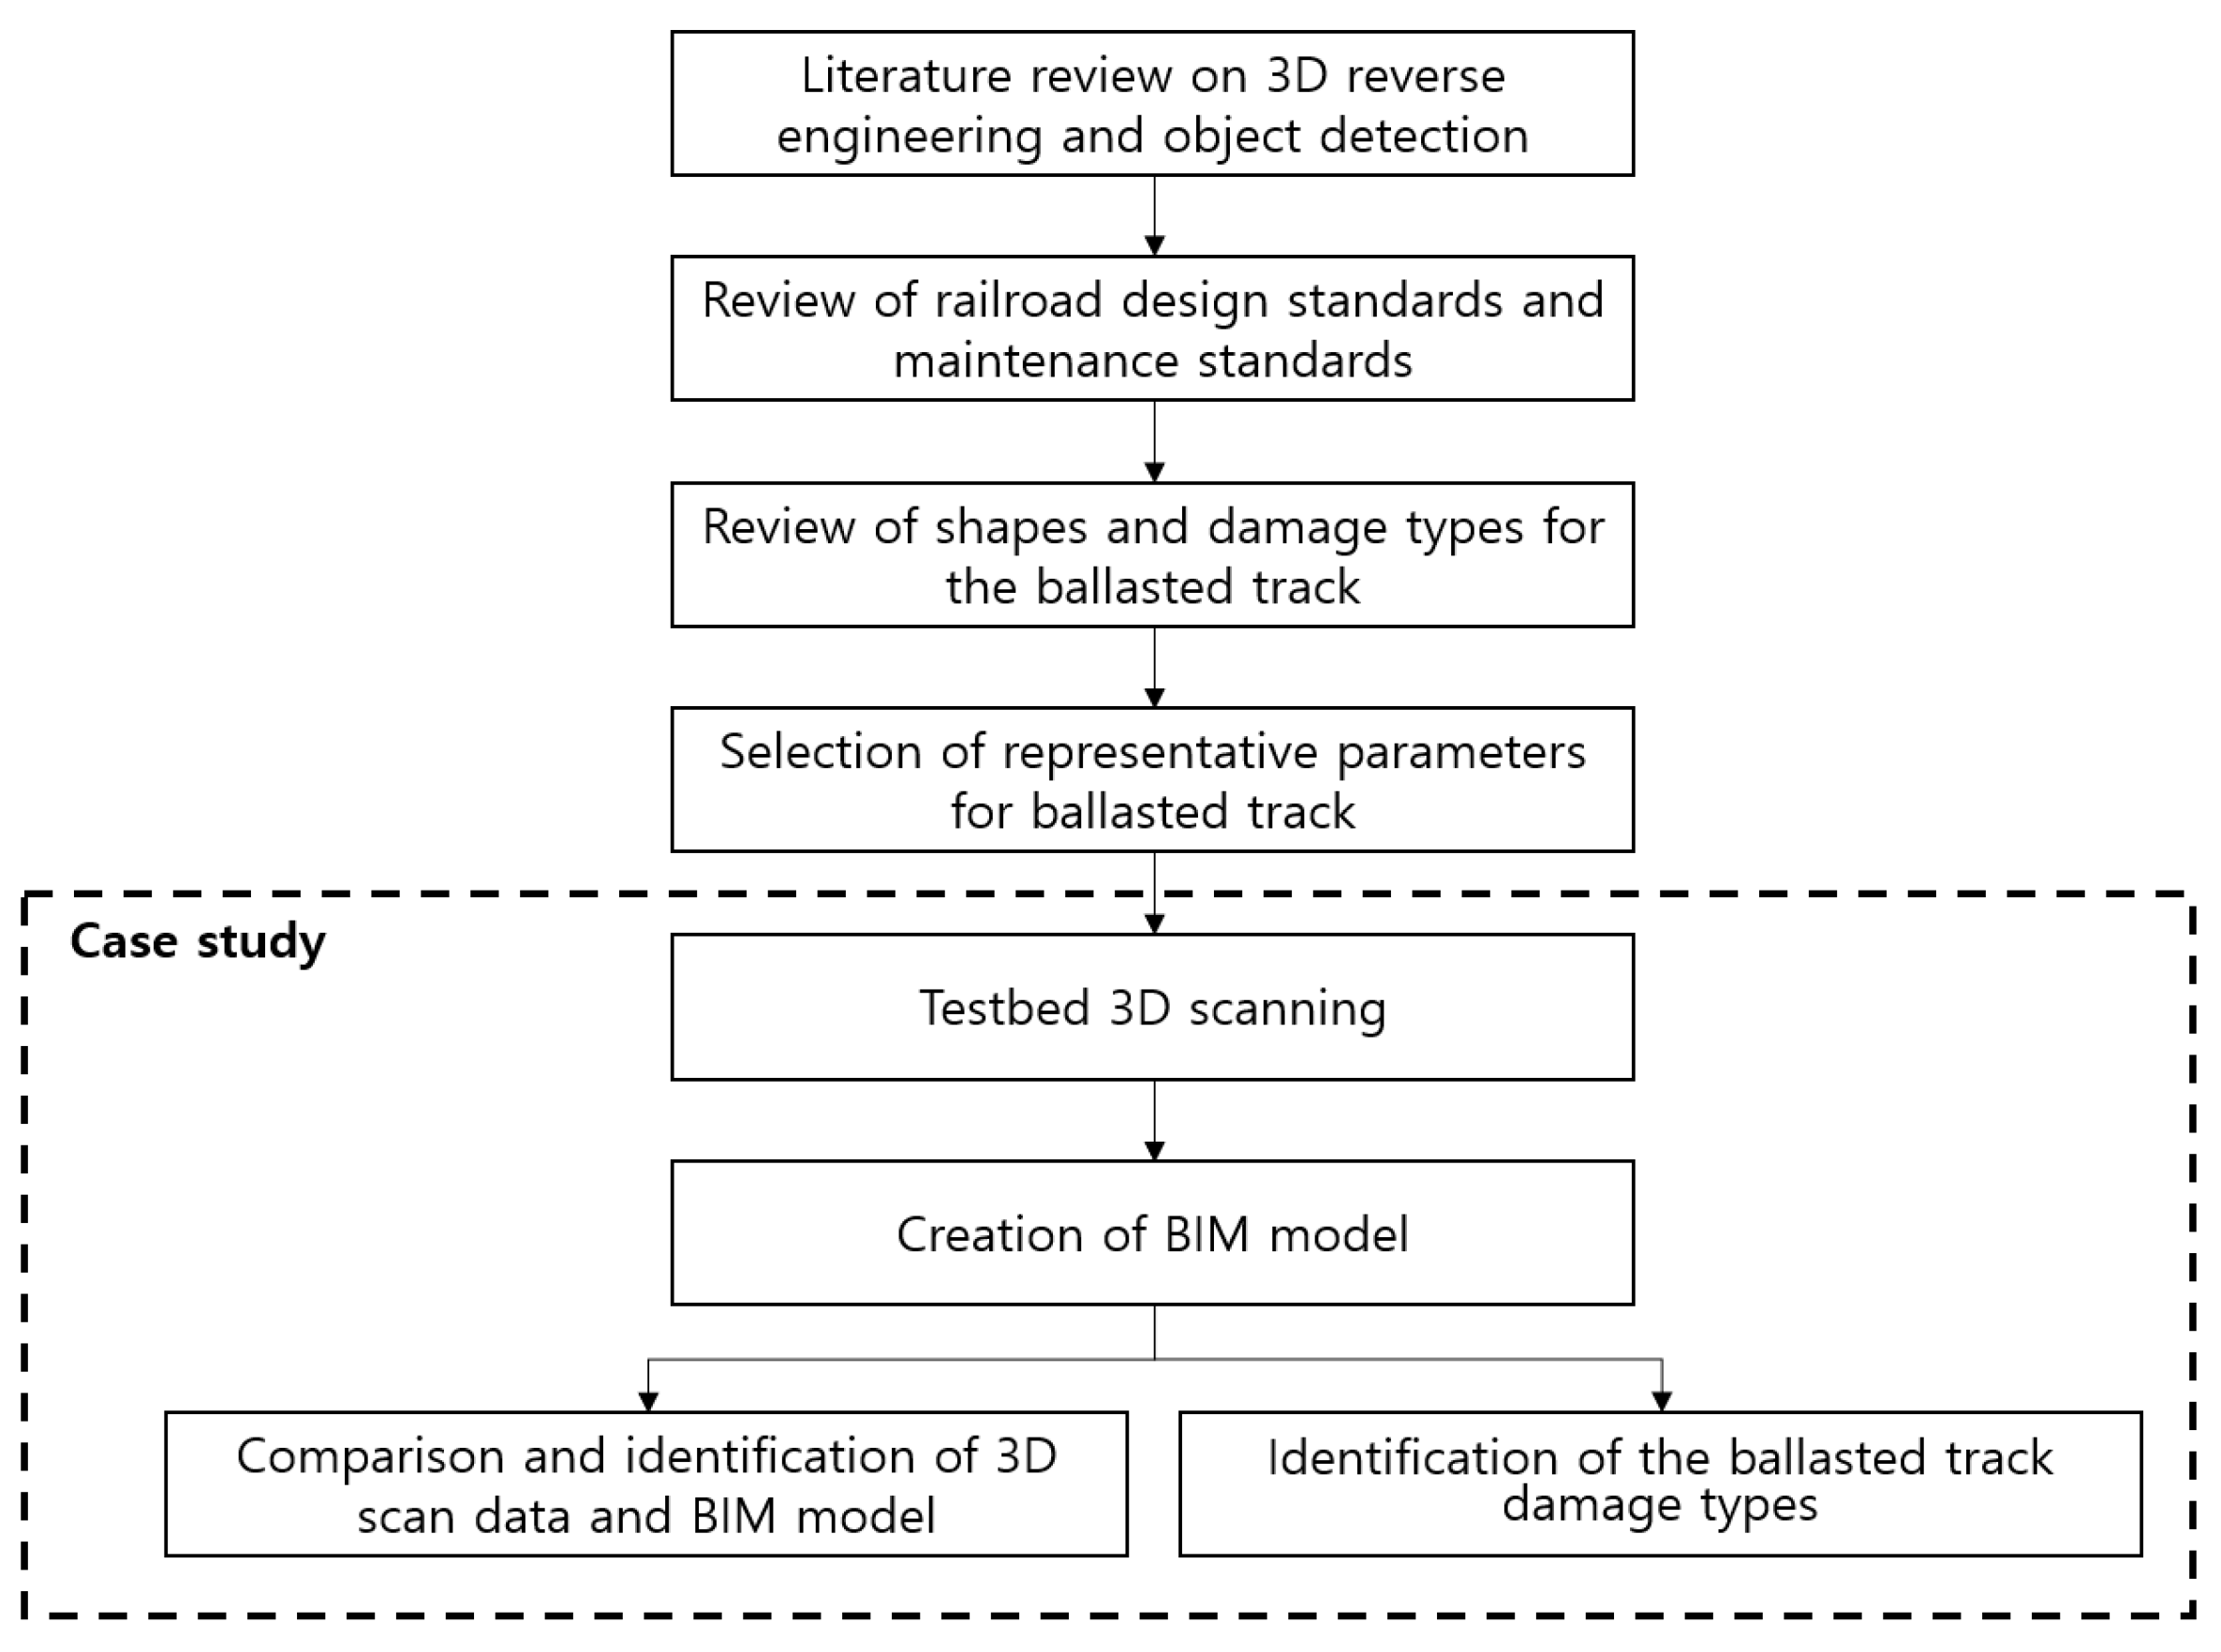
4. Case Study
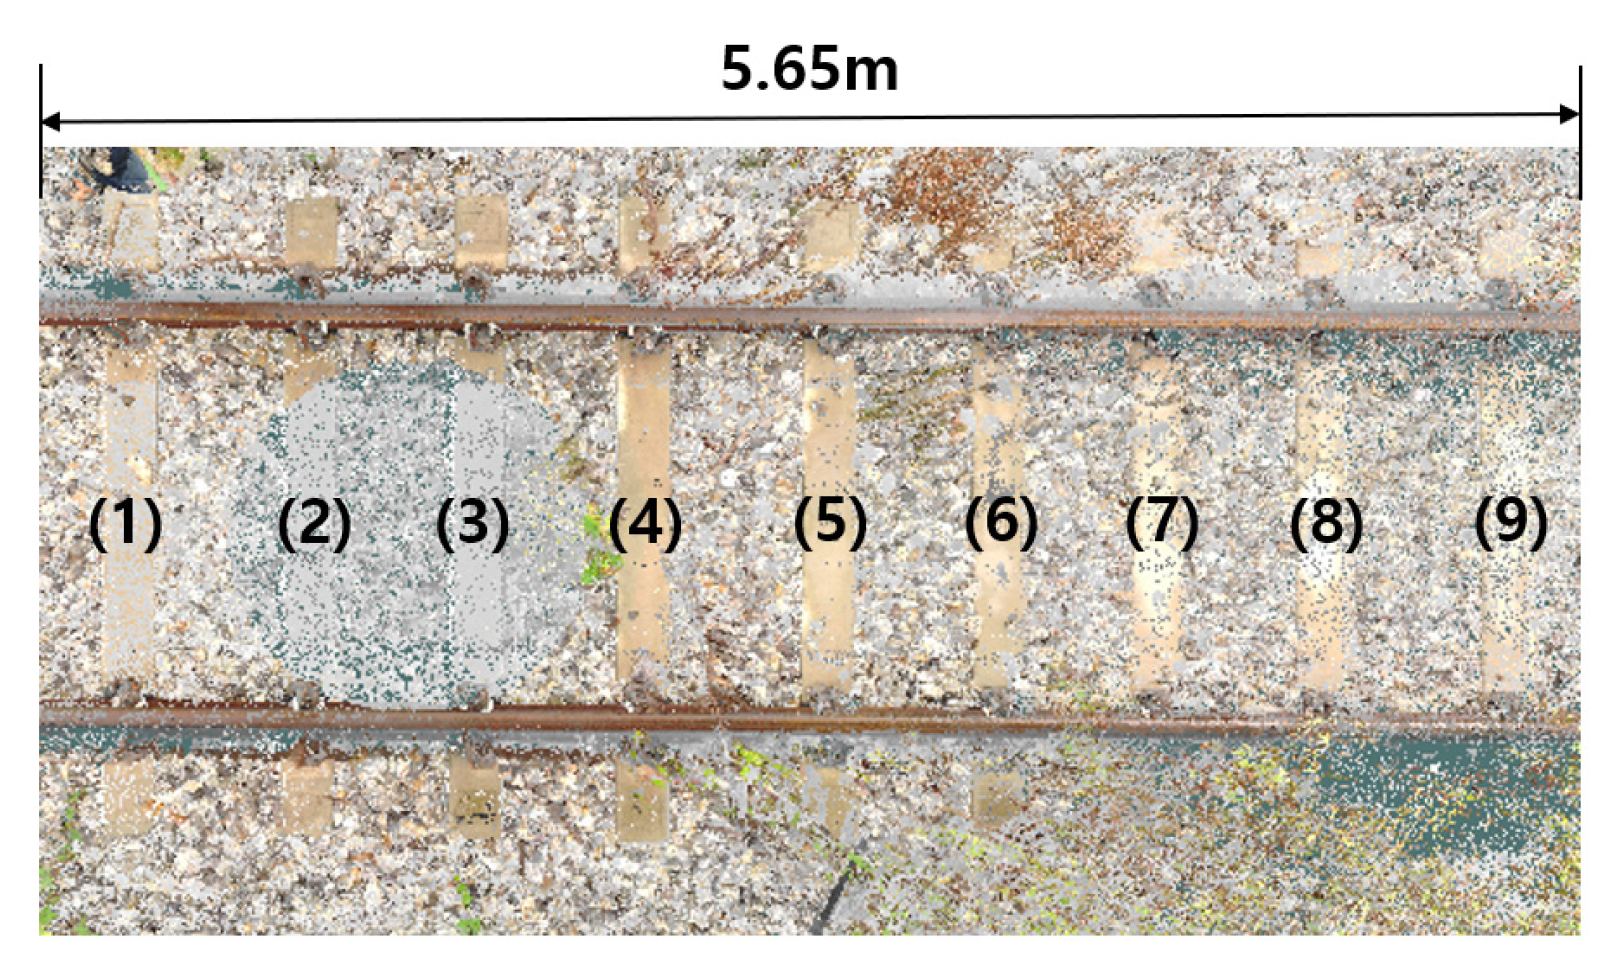
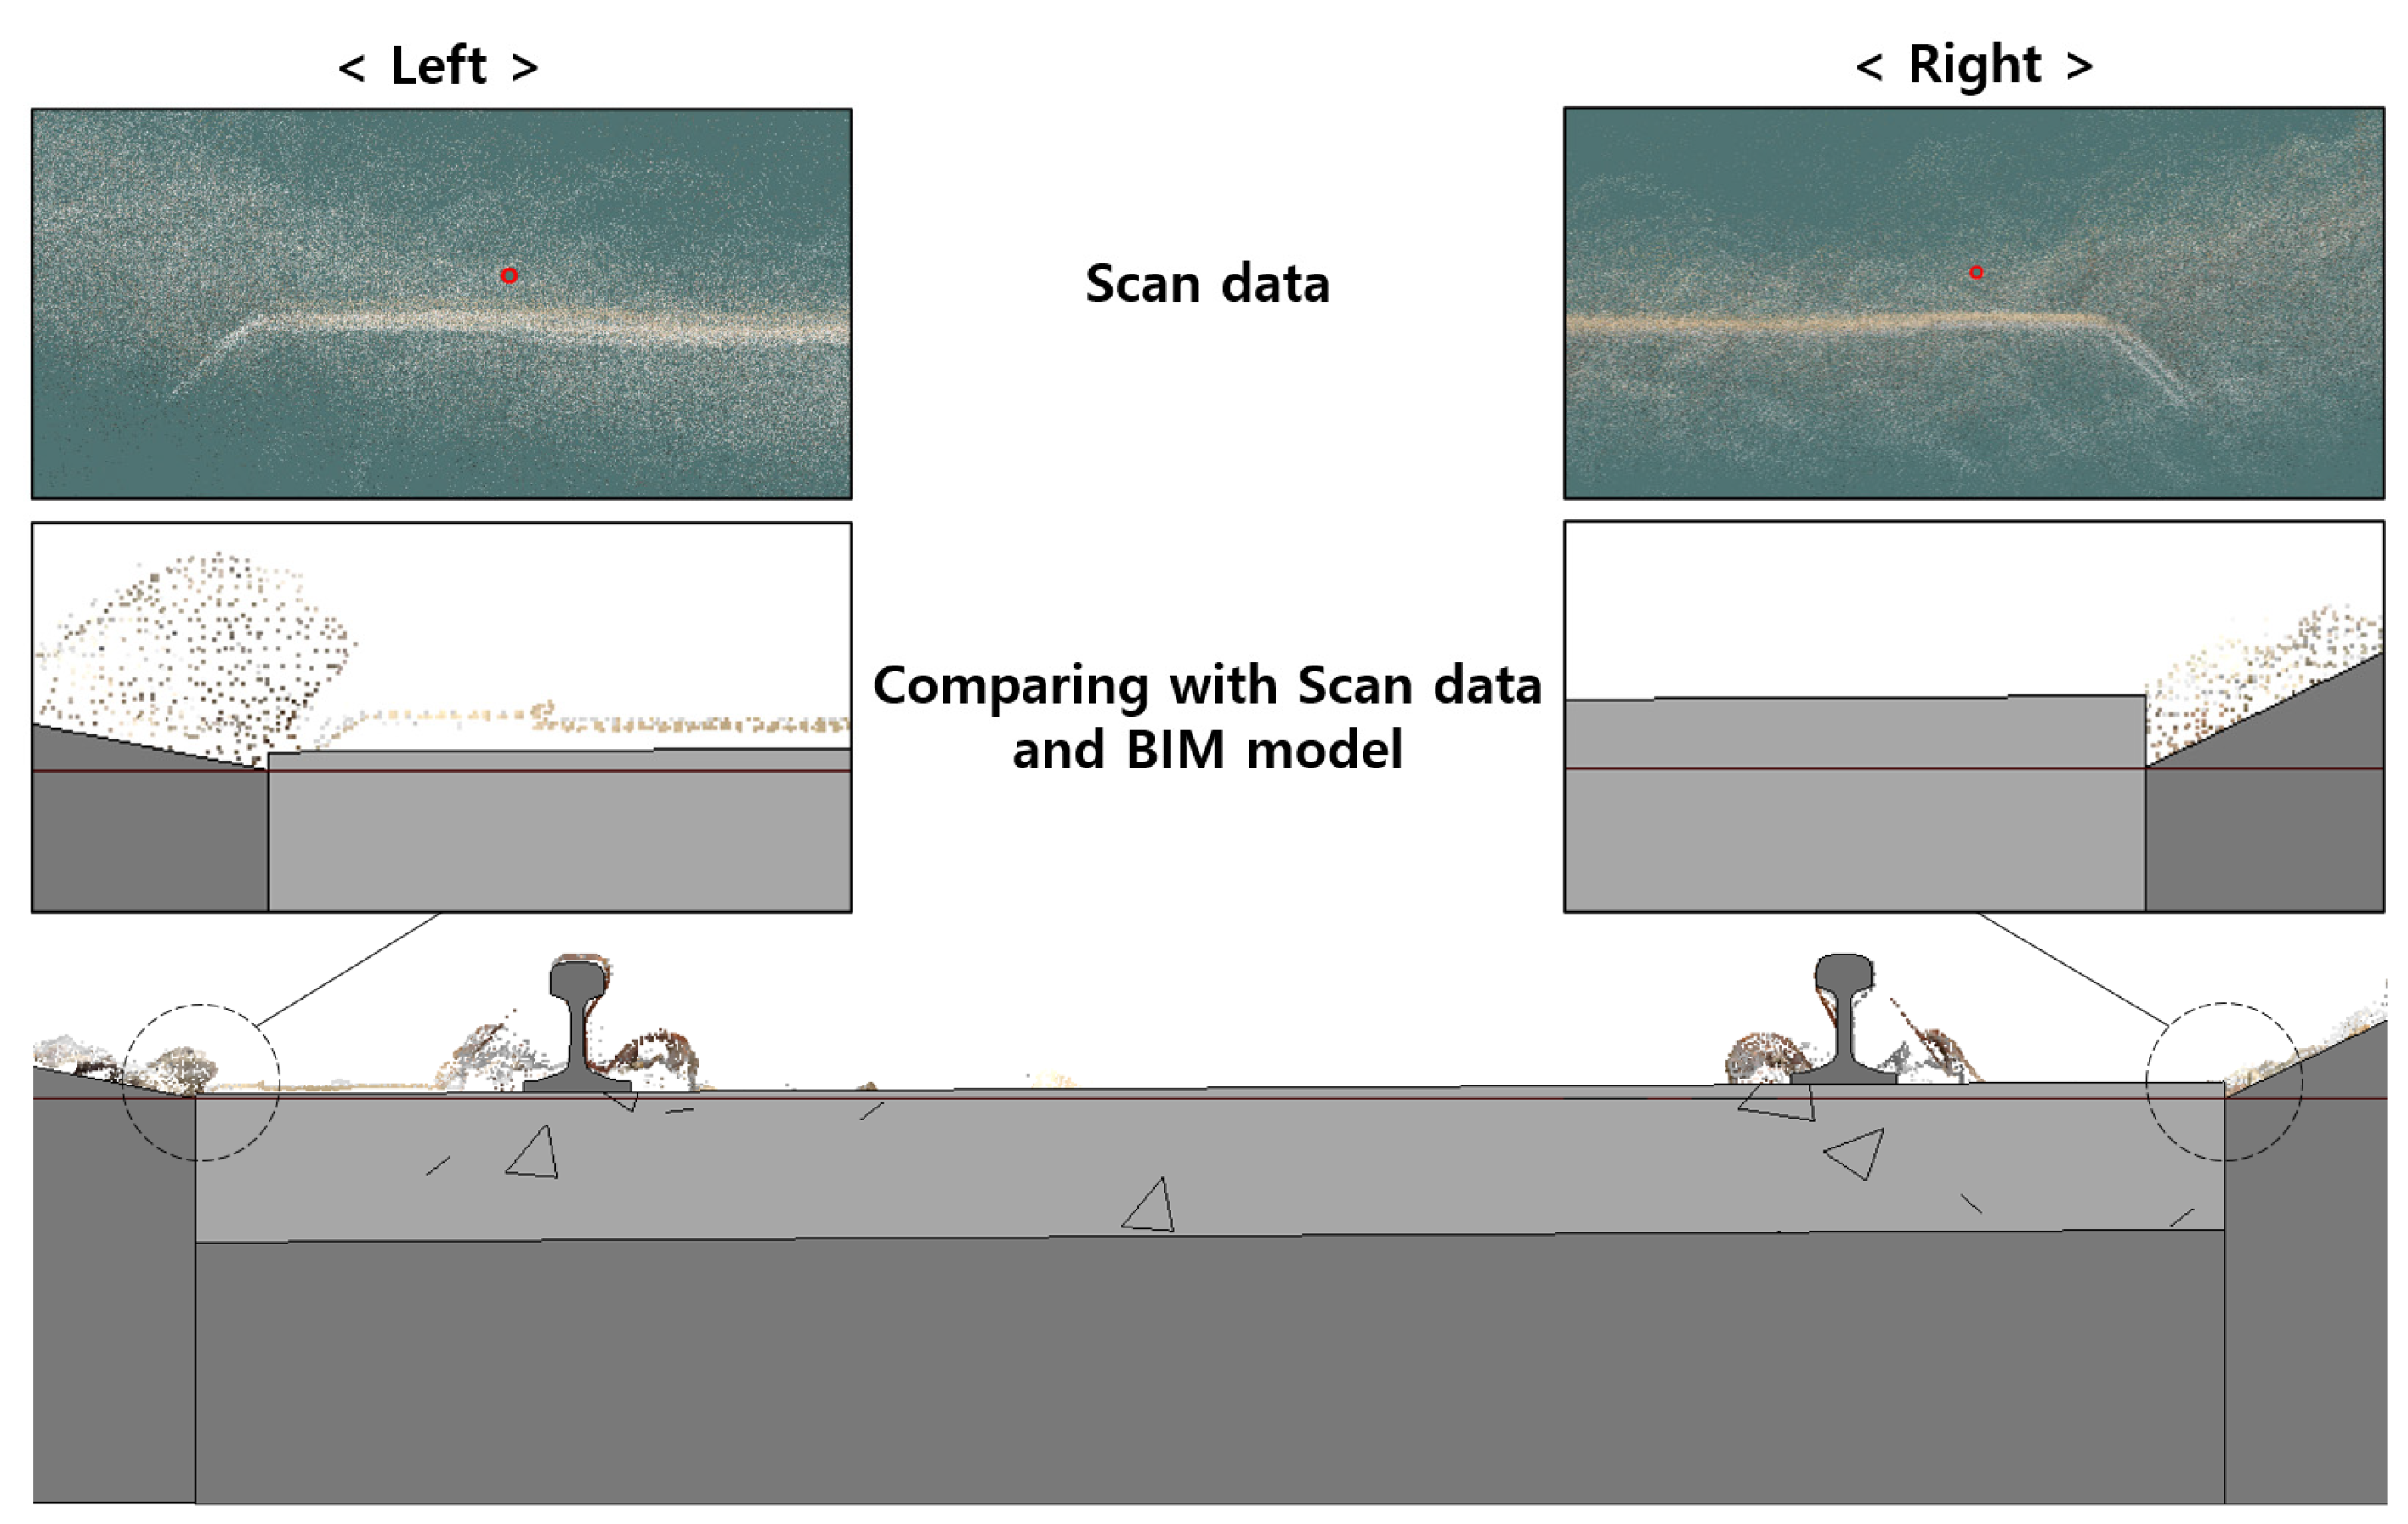
4.1. Extracting Scan Data on Ballasted Track
4.2. Generating the BIM Model
4.3. Evaluation Experiment for 3D Scan Data and BIM Model
5. Conclusions
Author Contributions
Funding
Institutional Review Board Statement
Informed Consent Statement
Data Availability Statement
Acknowledgments
Conflicts of Interest
References
- Ding, Z.; Liu, S.; Liao, L.; Zhang, L. A digital construction framework integrating building information modeling and reverse engineering technologies for renovation projects. Autom. Constr. 2019, 102, 45–58. [Google Scholar] [CrossRef]
- Ham, N.; Bae, B.I.; Yuh, O.K. Phased reverse engineering framework for sustainable cultural heritage archives using laser scanning and bim: The case of the hwanggungwoo (Seoul, Korea). Sustainability 2020, 12, 8108. [Google Scholar] [CrossRef]
- Chae, J.H.; Lee, J.Y. Definition of 3D Modeling Level of Detail in BIM Regeneration Through Reverse Engineering—Case Study on 3D Modeling Using Terrestrial LiDAR. J. KIBIM 2017, 7, 8–20. Available online: https://www.koreascience.or.kr/article/JAKO201718459283687 (accessed on 17 February 2022).
- Milroy, M.J.; Weir, D.J.; Bradley, C.; Vickers, G.W. Reverse engineering employing a 3D laser scanner: A case sltudv. Int. J. Adv. Manuf. Technol. 1996, 12, 111–121. [Google Scholar] [CrossRef]
- Sysyn, M.; Przybylowicz, M.; Nabochenko, O.; Liu, J. Mechanism of sleeper–ballast dynamic impact and residual settlements accumulation in zones with unsupported sleepers. Sustainability 2021, 13, 7740. [Google Scholar] [CrossRef]
- Sysyn, M.; Przybylowicz, M.; Nabochenko, O.; Kou, L. Identification of sleeper support conditions using mechanical model supported data-driven approach. Sensors 2021, 21, 3609. [Google Scholar] [CrossRef]
- Vithanage, R.K.W.; Harrison, C.S.; Desilva, A.K.M. Importance and applications of robotic and autonomous systems (RAS) in railway maintenance sector: A review. Computers 2019, 8, 56. [Google Scholar] [CrossRef]
- Lee, J.S.; Park, J.; Ryu, Y.M. Semantic segmentation of bridge components based on hierarchical point cloud model. Autom. Constr. 2021, 130, 103847. [Google Scholar] [CrossRef]
- Wang, C.; Cho, Y.K.; Kim, C. Automatic BIM component extraction from point clouds of existing buildings for sustainability applications. Autom. Constr. 2015, 56, 1–13. [Google Scholar] [CrossRef]
- Suyeul, P.; Seok, K. Performance Evaluation of Denoising Algorithms for the 3D Construction Digital Map. J. KIBIM 2020, 10, 32–39. [Google Scholar]
- Han, X.F.; Jin, J.S.; Wang, M.J.; Jiang, W.; Gao, L.; Xiao, L. A review of algorithms for filtering the 3D point cloud. Signal Process. Image Commun. 2017, 57, 103–112. [Google Scholar] [CrossRef]
- He, Y.; Liang, B.; Yang, J.; Li, S.; He, J. An iterative closest points algorithm for registration of 3D laser scanner point clouds with geometric features. Sensors 2017, 17, 1862. [Google Scholar] [CrossRef]
- Suyeul, P.; Seok, K. Analysis of overlap ratio for registration accuracy improvement of 3D point cloud data at construction sites. J. KIBIM 2021, 11, 1–9. [Google Scholar]
- Chen, J.; Fang, Y.; Cho, Y.K.; Kim, C. Principal Axes Descriptor for Automated Construction-Equipment Classification from Point Clouds. J. Comput. Civ. Eng. 2017, 31, 04016058. [Google Scholar] [CrossRef]
- Of, J.; Korean, T.H.E.; Society, G. Effect of Learning Data on the Semantic Segmentation of Railroad Tunnel Using Deep Learning. J. Korean Geotech. Soc. 2021, 37, 107–118. [Google Scholar]
- Várady, T.; Martin, R.R.; Cox, J. Reverse engineering of geometric models—An introduction. CAD Comput. Aided Des. 1997, 29, 255–268. [Google Scholar] [CrossRef]
- Son, S.; Park, H.; Lee, K.H. Automated laser scanning system for reverse engineering and inspection. Int. J. Mach. Tools Manuf. 2002, 42, 889–897. [Google Scholar] [CrossRef]
- Pu, S.; Vosselman, G. Knowledge based reconstruction of building models from terrestrial laser scanning data. ISPRS J. Photogramm. Remote Sens. 2009, 64, 575–584. [Google Scholar] [CrossRef]
- Guan, G.; Gu, W.W. Reconstruction of propeller and complex ship hull surface based on reverse engineering. J. Mar. Sci. Technol. 2019, 27, 498–504. [Google Scholar] [CrossRef]
- Bénière, R.; Subsol, G.; Gesquière, G.; Le Breton, F.; Puech, W. A comprehensive process of reverse engineering from 3D meshes to CAD models. CAD Comput. Aided Des. 2013, 45, 1382–1393. [Google Scholar] [CrossRef]
- Hichri, N.; Stefani, C.; De Luca, L.; Veron, P. REVIEW OF THE “AS-BUILT BIM” APPROACHES. In Proceedings of the 3D-ARCH International Conference, Trento, Italy, 25–26 February 2013; pp. 107–112. [Google Scholar]
- Xiong, X.; Adan, A.; Akinci, B.; Huber, D. Automatic creation of semantically rich 3D building models from laser scanner data. Autom. Constr. 2013, 31, 325–337. [Google Scholar] [CrossRef]
- Zeng, S.; Chen, J.; Cho, Y.K. User exemplar-based building element retrieval from raw point clouds using deep point-level features. Autom. Constr. 2020, 114, 103159. [Google Scholar] [CrossRef]
- Lund, H. Transition Zones between Ballasted and Ballastless Tracks; Lund University: Lund, Sweden, 2014. [Google Scholar]
- Union Internationale des Chemins de Fer (UIC). Earthworks and Track Bed Construction for Railway Lines, 3rd ed.; UIC: Paris, France, 2008. [Google Scholar]
- Marx, L.; Mossmann, D. Work Procedure for Maintenance of the Permanent Way, 7th ed.; Bahn DB AG Training: Berlin, Germany, 2013. [Google Scholar]
- Choi, I.Y.; Lee, D.H.; Lee, J.S.; Um, J.H. A Comparison of Track Irregularities Standards. In Proceedings of the 2013 Sping Conference of the Korean Society for Railway, Yongpyeong, Korea, 23–25 May 2013; pp. 1498–1502. [Google Scholar]
- SNCF Trains. Available online: https://www.thetrainline.com/en/train-companies/sncf?gclid=CjwKCAjw0a-SBhBkEiwApljU0iuu-zZcyAjCu6o0V6tFpDWLKgHWKYCuSn3QUVz0SRyX5niRWk3QIBoCM6QQAvD_BwE&gclsrc=aw.ds (accessed on 17 February 2022).
- American Public Transportation Association. Rail Transit Track Inspection and Maintenance; APTA: Alexandria, VA, USA, 2017. [Google Scholar]
- Korea Rail Network Authority. Track Maintenance Guide; Korea Rail Network Authority: Daedeok, Korea, 2018. [Google Scholar]


| Country | Track Gauge | Cross Level | Track Surface | Alignment | Others |
|---|---|---|---|---|---|
| EN | ● | ● | ● | ● | Twist |
| France | ● | ● | ● | ● | Flatness |
| Germany | - | - | ● | ● | Twist |
| Italy | ● | ● | ● | ● | Twist |
| Austria | ● | ● | ● | ● | Twist |
| US | ● | ● | ● | ● | Superelevation |
| Japan | ● | ● | ● | ● | Flatness |
| Republic of Korea | ● | ● | ● | ● | Ballast refill, sleeper irregularities |
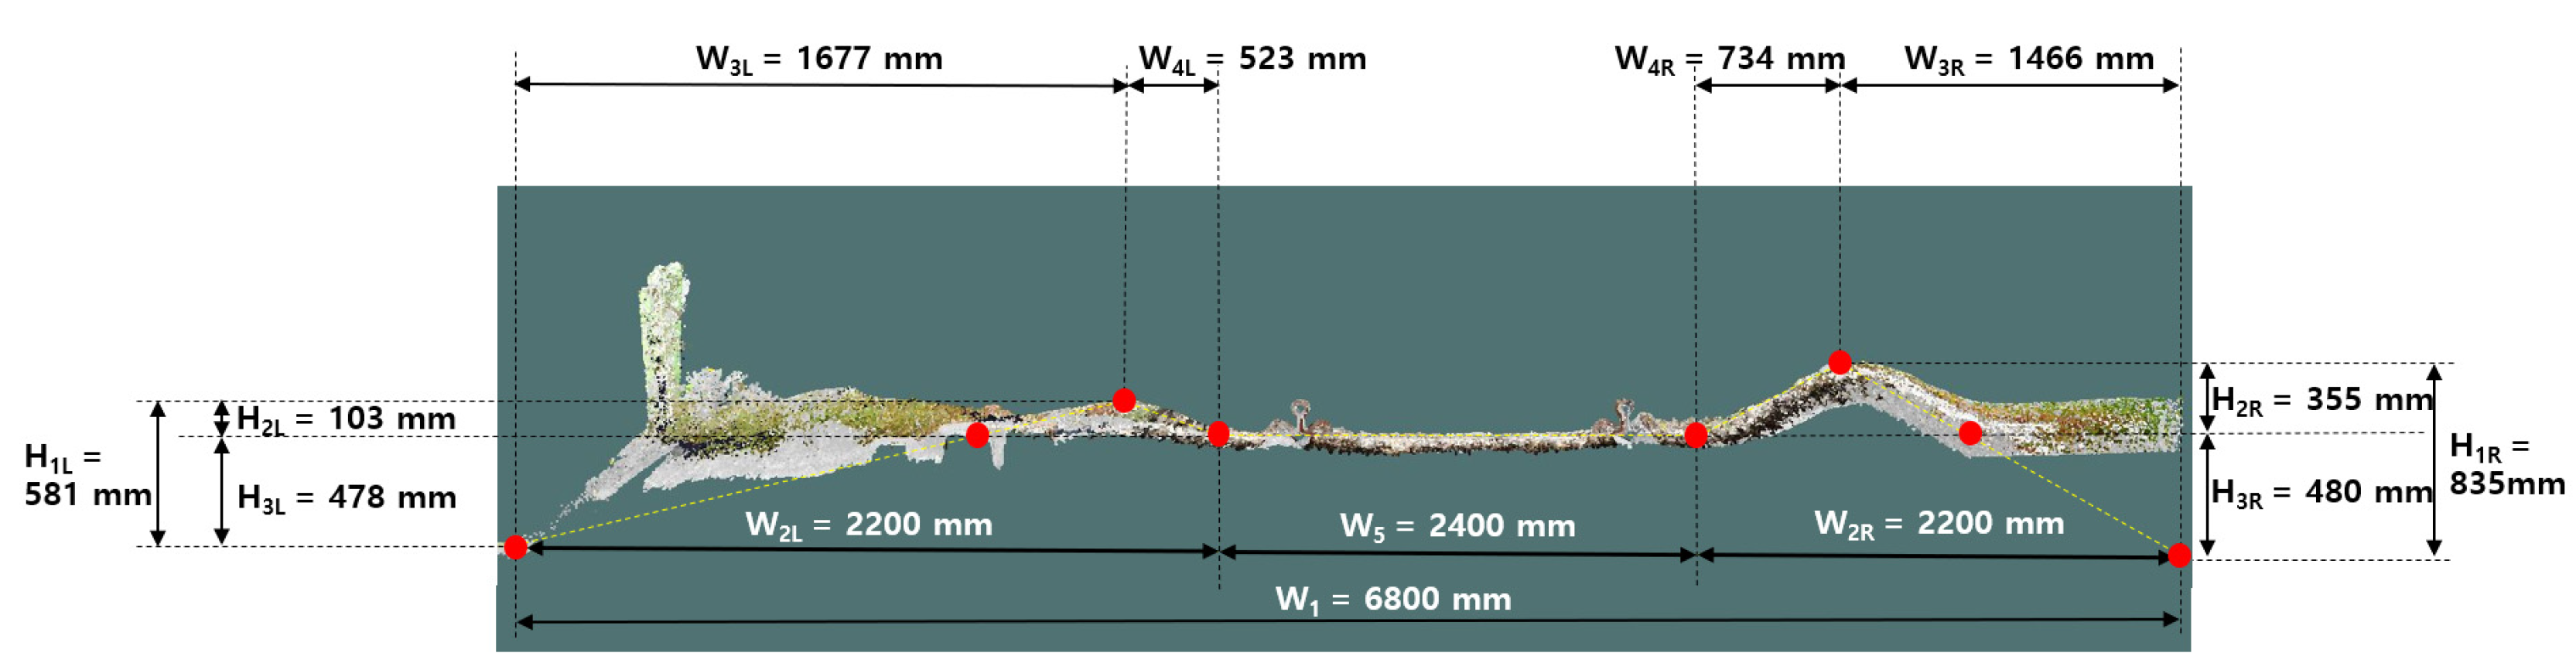
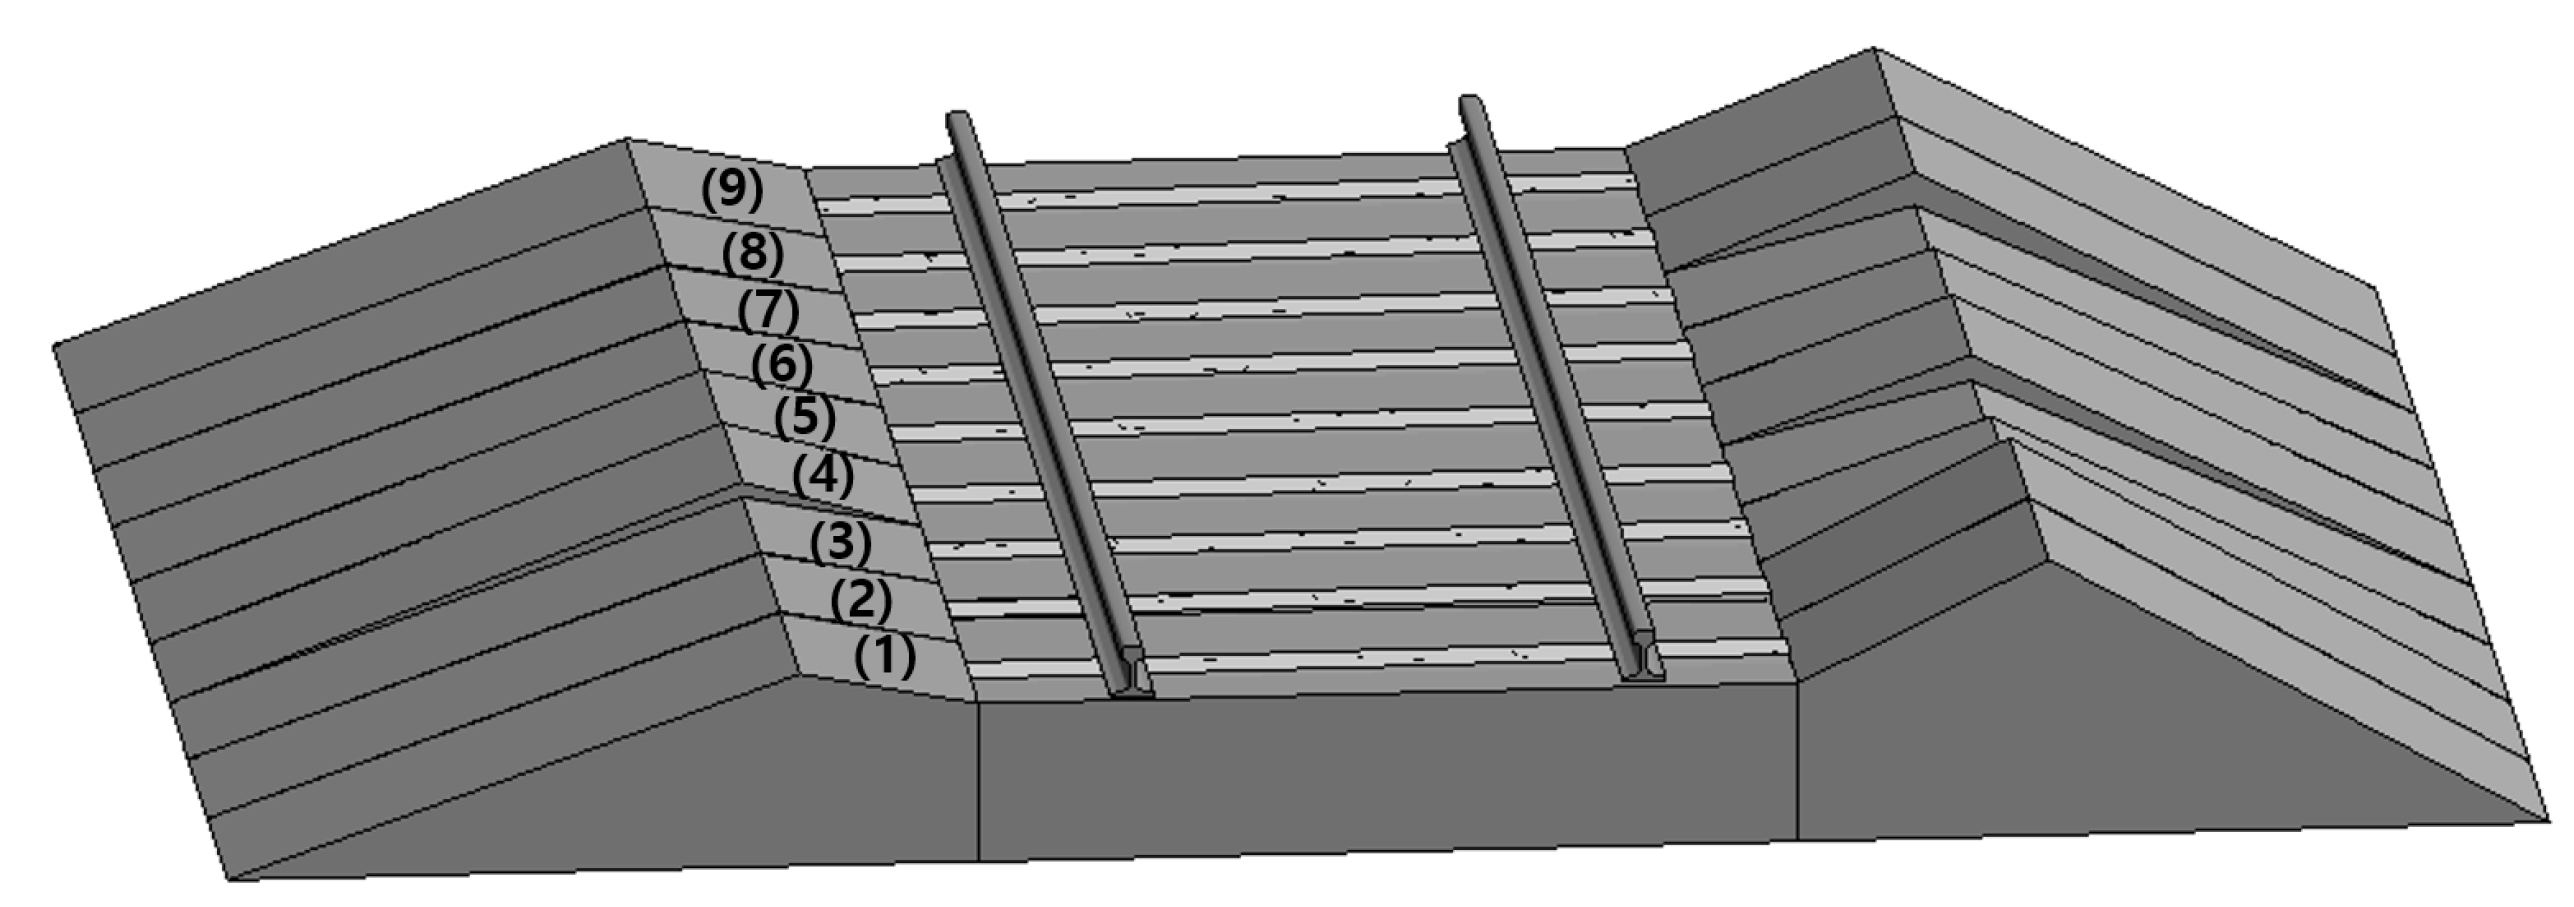
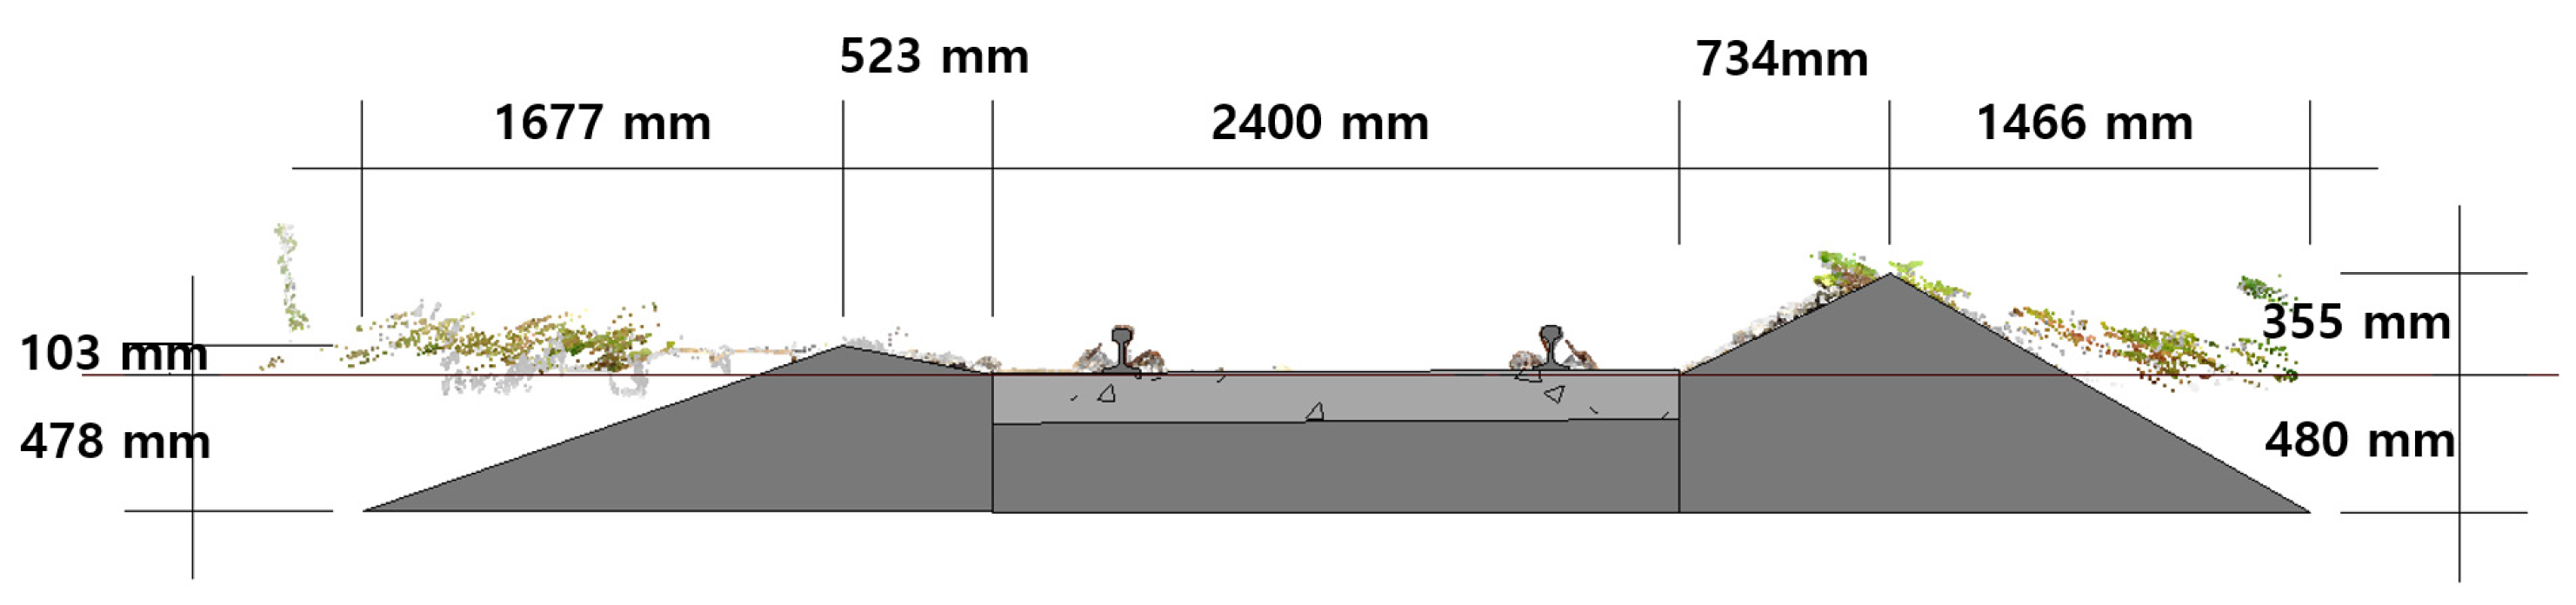
| Representative Parameters | Description | Shape Expression | Track Irregularities Management Criteria |
|---|---|---|---|
| H1R, H1L | Height from floor level (F.L) to surcharge fill (ballast shoulder peak) (R: right, L: left) | Possible | Ballast refill (reduction of ballast shoulder fill) occurs |
| H2R, H2L | Ballast shoulder height (R, L) | Possible | Ballast refill (reduction of ballast shoulder fill) occurs |
| H3R, H3L | ballast height excluding ballast shoulder (R, L) | Possible | - |
| H4R, H4L | Rail height (R, L) | Possible | - |
| H5R, H5L | Sleeper exposure (R, L) | Possible | Ballast refill (sleeper exposure) occurs |
| W1 | Total ballast width | Possible | - |
| W2R, W2L | Ballast width excluding sleeper length (R, L) | Possible | - |
| W3R, W3L | Width from surcharge fill (ballast shoulder peak) to ballast end (R, L) | Possible | Ballast refill (shoulder width reduction) occurs |
| W4R, W4L | Width from surcharge fill (ballast shoulder peak) to sleeper end (R, L) | Possible | Ballast refill (shoulder width reduction) occurs |
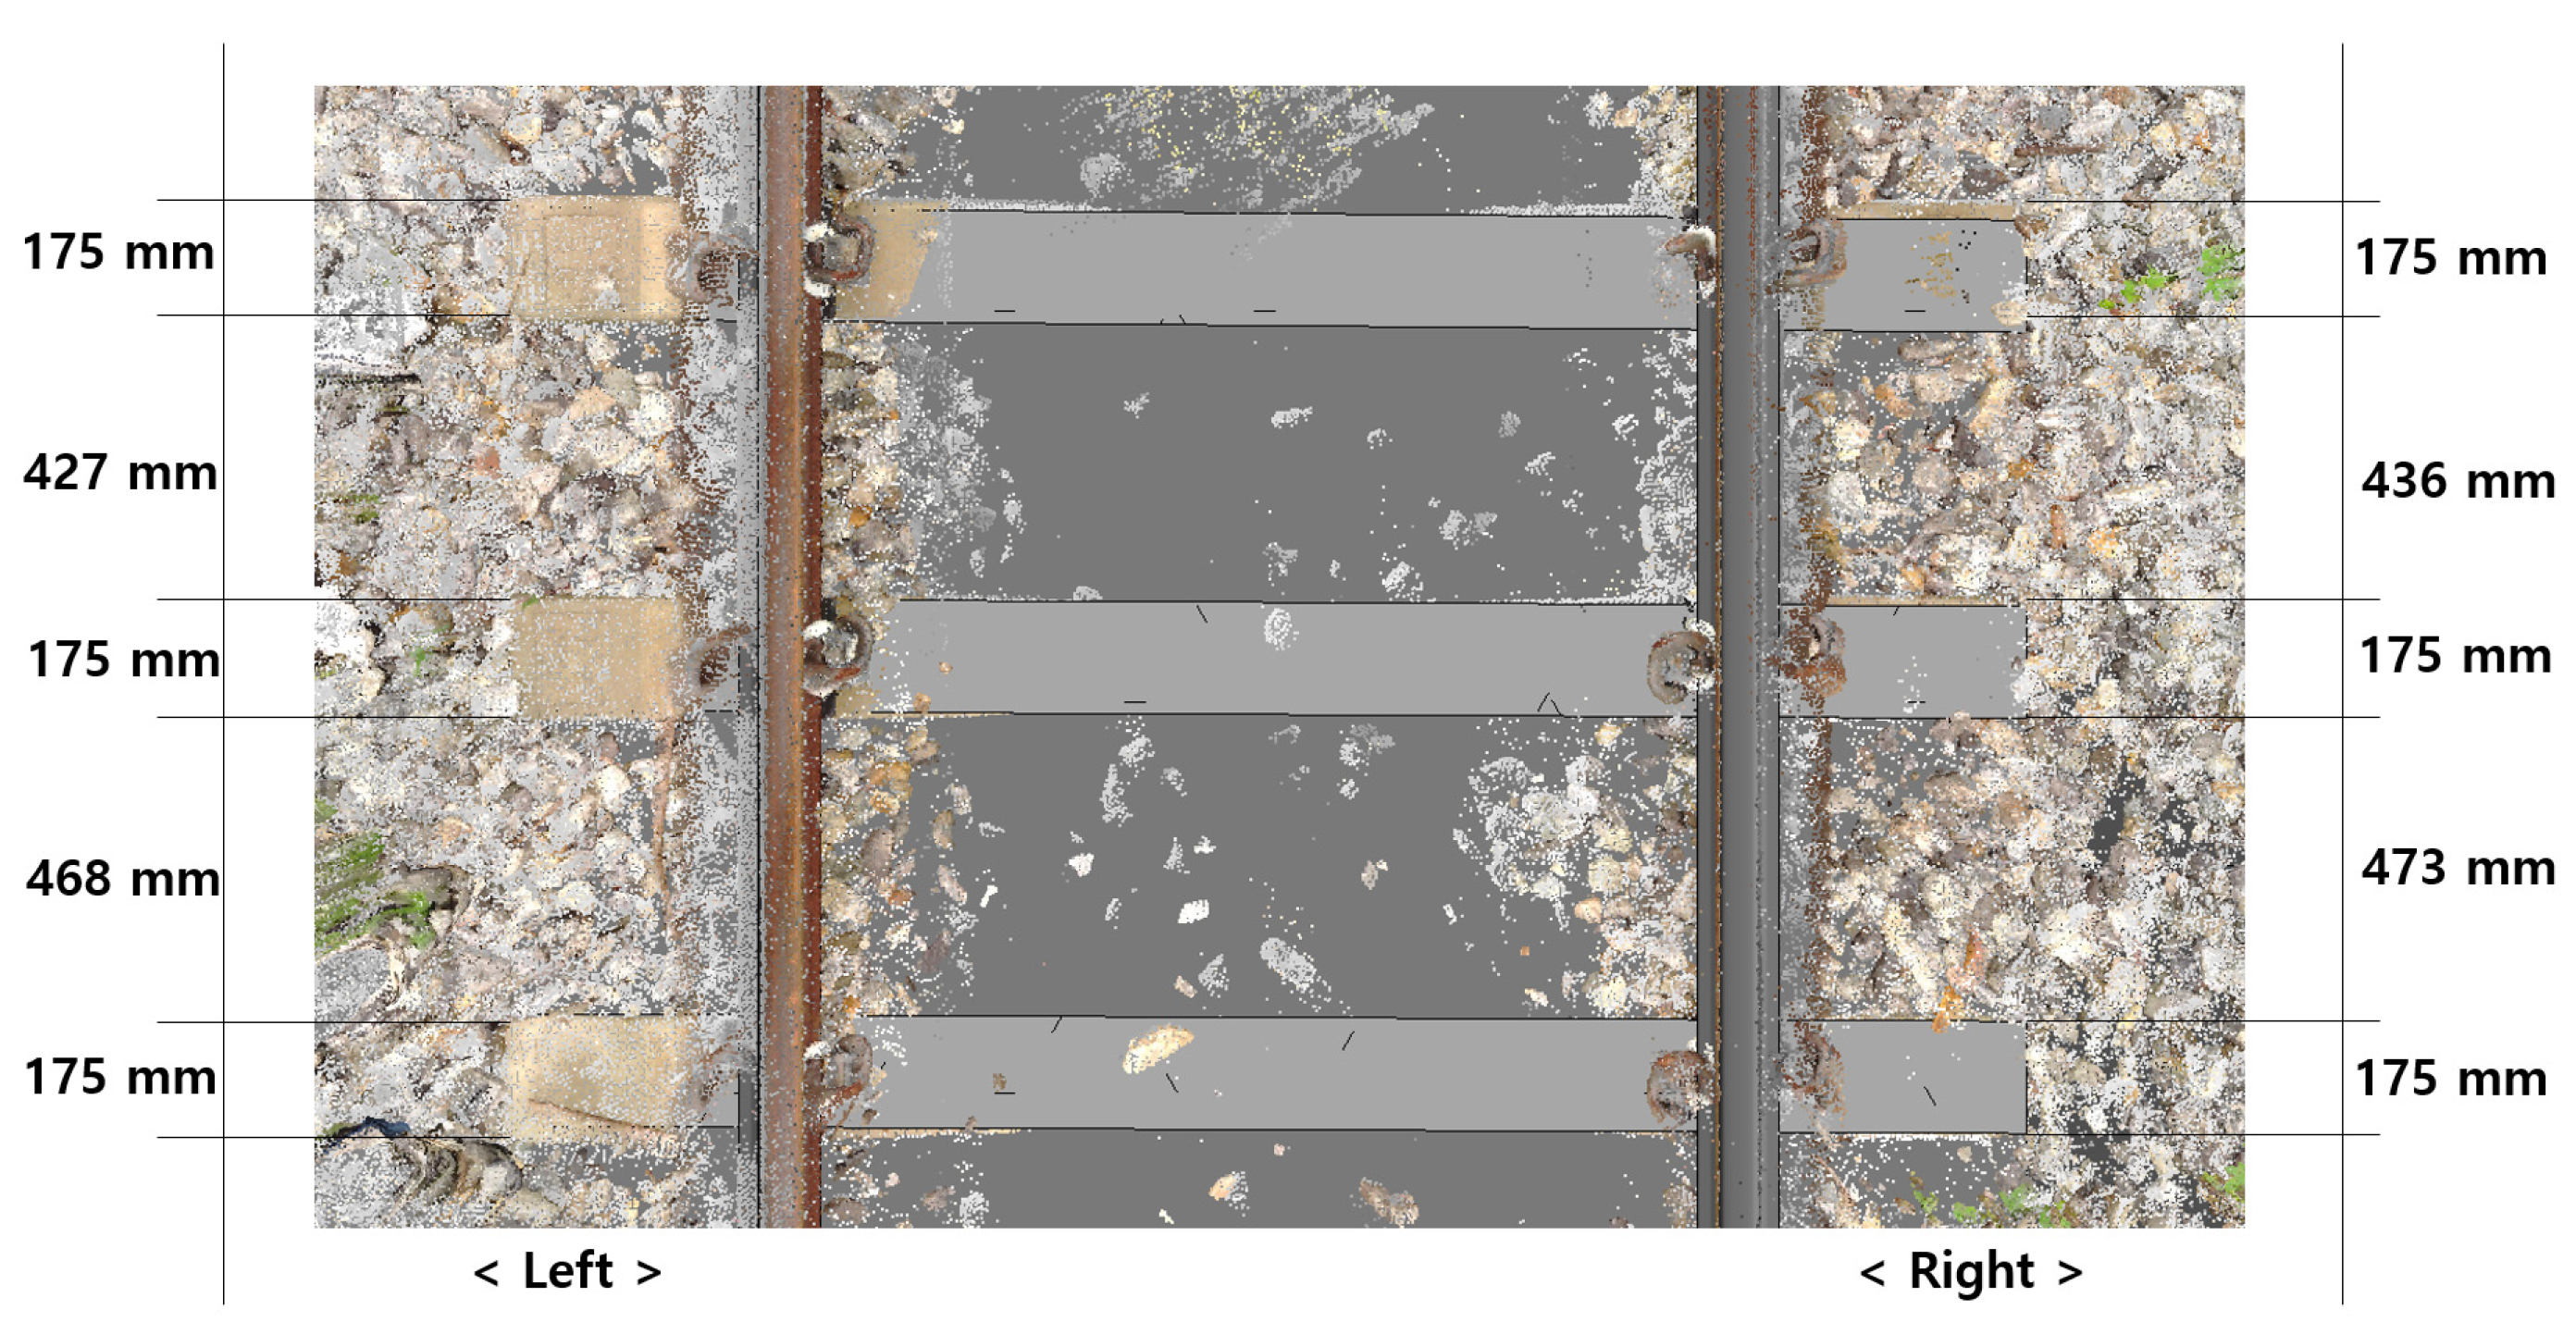
| W5 | Sleeper length | Possible | - |
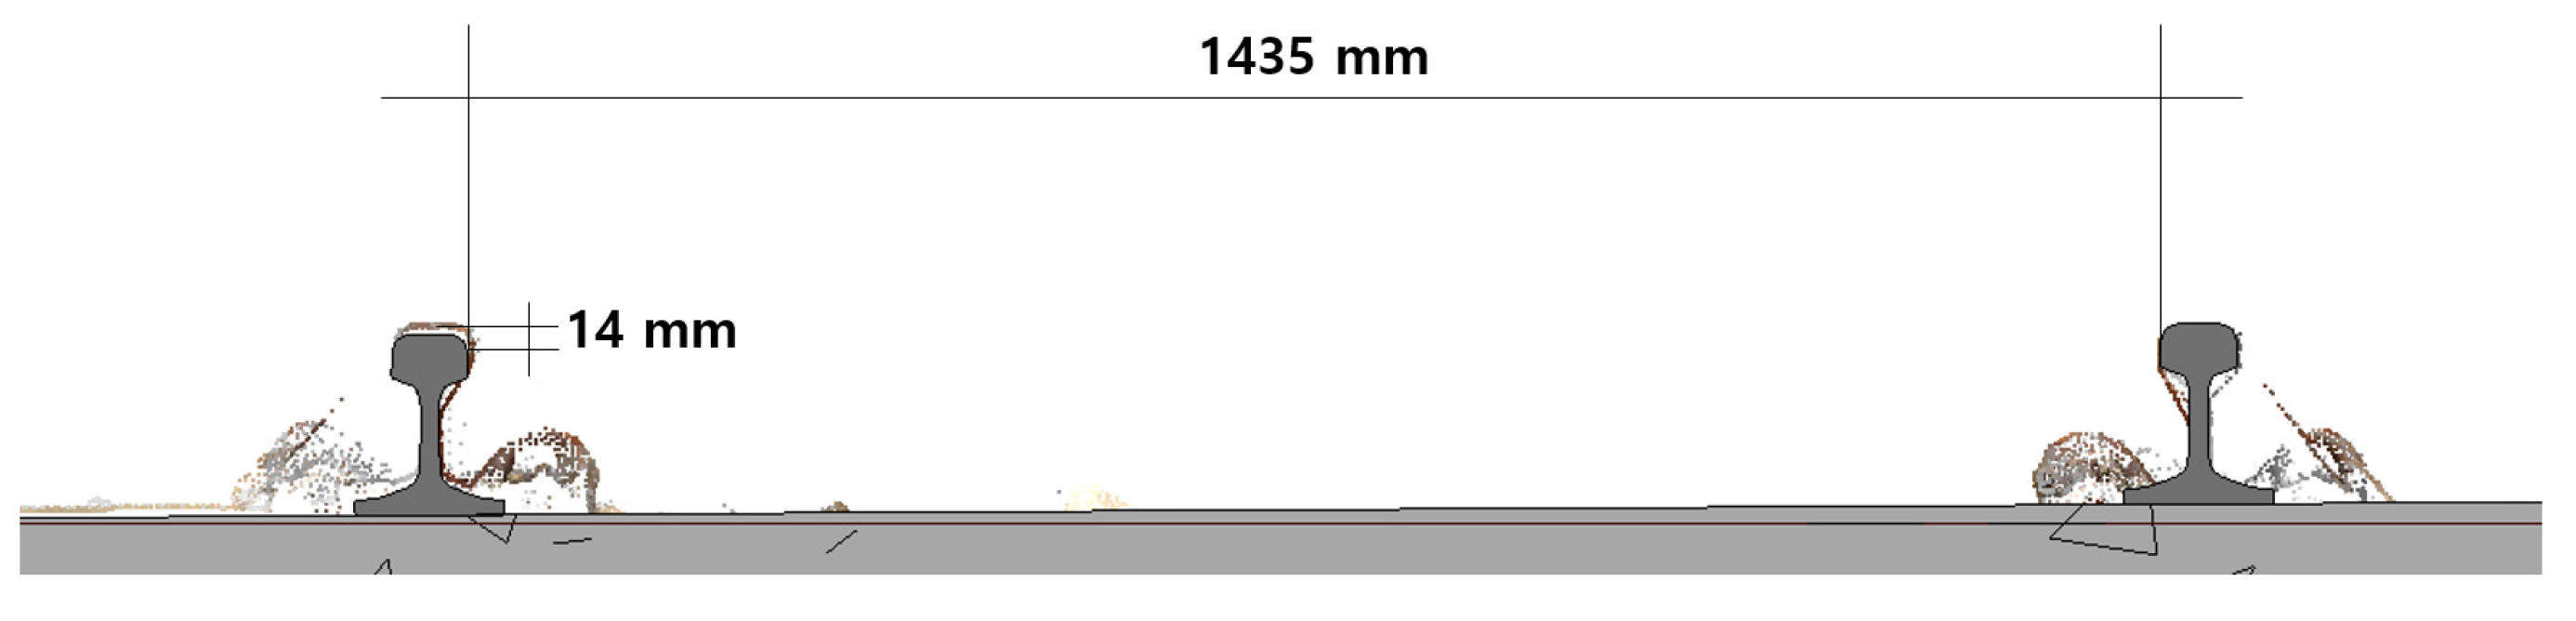
| W6 | Track gauge | Possible | Track gauge does not occur |
| W7R, W7L | Rail base width (R, L) | Possible | - |
| W8R, W8L | Rail head width (R, L) | Possible | - |
| L1 | Rail length | Possible | - |
| L2 | Sleeper thickness (width) | Possible | - |
| L3R, L3L | Interval between the sleeper edges (R, L) | Possible | Sleeper irregularities (interval irregularity and right-angle irregularity) occur |
| L4 | Ballast length | Possible | - |
Publisher’s Note: MDPI stays neutral with regard to jurisdictional claims in published maps and institutional affiliations. |
© 2022 by the authors. Licensee MDPI, Basel, Switzerland. This article is an open access article distributed under the terms and conditions of the Creative Commons Attribution (CC BY) license (https://creativecommons.org/licenses/by/4.0/).
Share and Cite
Park, S.; Kim, S.; Seo, H. Study on Representative Parameters of Reverse Engineering for Maintenance of Ballasted Tracks. Appl. Sci. 2022, 12, 5973. https://doi.org/10.3390/app12125973
Park S, Kim S, Seo H. Study on Representative Parameters of Reverse Engineering for Maintenance of Ballasted Tracks. Applied Sciences. 2022; 12(12):5973. https://doi.org/10.3390/app12125973
Chicago/Turabian StylePark, Suyeul, Seok Kim, and Heechang Seo. 2022. "Study on Representative Parameters of Reverse Engineering for Maintenance of Ballasted Tracks" Applied Sciences 12, no. 12: 5973. https://doi.org/10.3390/app12125973
APA StylePark, S., Kim, S., & Seo, H. (2022). Study on Representative Parameters of Reverse Engineering for Maintenance of Ballasted Tracks. Applied Sciences, 12(12), 5973. https://doi.org/10.3390/app12125973