Article

Prediction Method of Water Absorption of Soft Rock Considering the Influence of Composition, Porosity, and Solute Quantitatively

School of Civil Engineering, Research Center for Geotechnical Engineering and Information Technology, Sun Yat-sen University, Guangzhou 510275, China
*
Authors to whom correspondence should be addressed.
Appl. Sci. 2022, 12(12), 5938; https://doi.org/10.3390/app12125938
Submission received: 26 May 2022 / Revised: 8 June 2022 / Accepted: 9 June 2022 / Published: 10 June 2022
(This article belongs to the Special Issue Formation-Destruction Mechanism and Early-Warning Method of Soft Rock)

Abstract

:
The study of water absorption of soft rock is of great significance to the prevention engineering disasters. However, the research on the prediction method of water absorption of soft rock considering the influence of composition, porosity, and solute is insufficient. Aiming to solve the above problem, water absorption tests are carried out by synthesizing soft rocks and water solutions. Then, the prediction model of water absorption of soft rock is established through quantitative analysis of water absorption data and compared with the water absorption characteristics of natural rock to verify the reliability of the model. The results show that the changes in water content and water absorption velocity of soft rock with time obey the second-order exponential attenuation function and the linear function (double logarithmic coordinates axis), respectively. The types of cations and anions and the type and content of clay minerals have the greatest influence on the process of rock water absorption. In addition, the water absorption prediction model could better predict the water absorption process of natural rock. The research results solve the problem of insufficient research on the soft rock water absorption prediction method considering the influence of composition, porosity and solute.

1. Introduction

Water has a great impact on the safety of the rock engineering. For example, seawater intrusion will threaten the construction and operation of subsea tunnels [1], damage the structure of underground sealed oil storage or reservoir [2,3] or cause collapse due to coastline erosion [4]. Moreover, water has a significant impact on the construction and operation of urban rock tunnels [5,6]. Combined with the influence of rock weathering and tunnel construction blasting, water is easier to enter the tunnel through some channels [7,8,9,10,11,12]. Water also affects the safety of slopes and chambers. For example, water will weaken the stability of red bed soft rock bank slope [13]. Water intrusion or erosion mainly occurs in areas with poor rock mass quality, which mainly depends on the mineral composition (especially clay minerals) and porosity of rock mass, solute composition and high salinity of water solutions, and the action of external environment [14,15]. The prediction of water absorption of soft rock is very important for the failure prediction of rock engineering. If the critical time point of rock damage due to the change in water absorption cannot be judged, the prevention and control of rock engineering disasters will be too conservative or too risky [16]. However, existing research studies mainly focus on the weakening effect of water on rock physical and mechanical properties [17,18], or natural rock samples and natural water solutions are used to study the water absorption of soft rock. Under the influence of anisotropic factors, the influence of composition, porosity and solute on the water absorption of soft rock cannot be quantitatively analyzed [19]. Therefore, this paper needs to study the test method and prediction model of water absorption of soft rock considering the effects of composition, porosity and solute quantitatively.
At present, there are many studies on rock water absorption. Some scholars have studied the effect of solute composition of water on rock water absorption. For example, Tinnacher et al. studied the adsorption of rocks rich in clay minerals in water with different mineralization [20]. Manaka et al. studied the effects of solute type and solution concentration in solution on chemical permeability, diffusion and hydraulic parameters of mudstone, and found that solute type has little effect on rock water absorption, while solution concentration has a great effect on rock water absorption [21]. Chai et al. studied the water absorption characteristics of rocks in solutions with different chemical properties and obtained the effects of different chemical paths on the water absorption process of clay rocks [22]. Some scholars mainly pay attention to the influence of rock porosity on its water absorption. For example, Binal and Wang et al. studied the relationship between physical properties such as porosity and water absorption of rocks and mechanical properties, and found that the greater the porosity, the greater the water absorption of rocks [23,24]. Tertre et al. studied the water (solution) absorption characteristics of natural clay-based materials with different porosities and found that osmotic swelling and its influence on pore structure are the key influencing factors of the rock water absorption process [25]. Simonyan studied the effect of alteration on rock water absorption and found that the formation of secondary facies changed the rock pore space (effective porosity) and played a leading role in controlling rock water absorption [26]. Moreover, the rock porosity can be obtained by ultrasonic velocity, image processing technology, neural network method, fractional flow theory, etc. [27,28,29,30,31,32,33]. Some scholars also mainly study the influence of clay minerals on rock water absorption. For example, Erguler et al. studied the change of water absorption over time of rocks containing different types and contents of clay minerals (siltstone, mudstone, marl, tuff) [34]. Rahromostaqim et al. studied the hydration expansion characteristics of pure clay and mixed clay and their effects on water absorption [35,36]. However, few scholars have quantitatively studied the effects of rock composition, porosity and solute on water absorption at the same time. Feng et al. studied the water absorption of shale with different clay mineral types and pore structures in water with different salinity, but did not quantitatively build a water absorption prediction model [37].
Therefore, according to the particularity of rock engineering, this paper studies the influence of soft rock composition, porosity and solute on water absorption, and establishes a water absorption prediction model. In order to eliminate the influence of anisotropy of rock and water solutions, firstly, rock samples with different clay mineral composition and porosity are synthesized and water solutions with different salinity are configured. Then, the water absorption tests of rock samples are carried out, and the effects of different factors on water absorption are quantitatively analyzed. Finally, the prediction model of water absorption of soft rock is established and its reliability is verified.

2. Materials and Methods

2.1. Test Materials

There are many kinds of ions in water solutions. The common cations are mainly Na + , Ca 2 + and K + , and the common anions are mainly Cl , SO 4 2 and CO 3 2 [38]. The variation range of ion concentration and pH value in water solutions is large [39]. Rock engineering involves many sedimentary rocks (sandstone, mudstone and shale, etc.), which contain a large number of soft rocks. Soft rocks have special engineering properties, such as low strength, large porosity, poor cementation and high content of clay minerals (montmorillonite, illite and kaolinite, etc.), which have a great negative impact on engineering safety [40,41]. The interaction of the above conditions will have a complex impact on the water absorption of soft rock.
In order to eliminate the influence of anisotropy of soft rock and water solutions, soft rock analogues [42] and water solutions are synthesized to study. Synthetic soft rock analogues require clay minerals, quartz sand (particle size 0.075~0.1 mm) and pure water. Among them, the selected clay mineral types (CMT, as shown in Table 1) are montmorillonite (MMT), illite (ILL) and kaolinite (KAO). The X-ray diffraction topographies of the three minerals are shown in Figure 1. The selected clay mineral contents (CMC) are 30%, 50% and 70% (by weight), respectively, and the rest is the quality of quartz sand. During the test, the change in vertical stresses (VSs, 5 MPa, 10 MPa and 15 MPa) is used to simulate rocks with different porosities. In addition, the synthesis of water solutions needs to consider the effects of cation types, anion types, concentration and pH value. According to the nature of natural water solutions, the selected cation types (CTs) of water solution are Na + , Ca 2 + and K + , the selected anion types (ATs) are Cl , SO 4 2 and CO 3 2 , the concentrations (CCs) are 0.1 mol/L, 1 mol/L and saturated state (SAT) and the pH values are 4, 7 and 10, respectively. The 18 groups of tests design are in line with the design mode of 7 factors and 3 levels in the orthogonal tests [43].

2.2. Test Methods

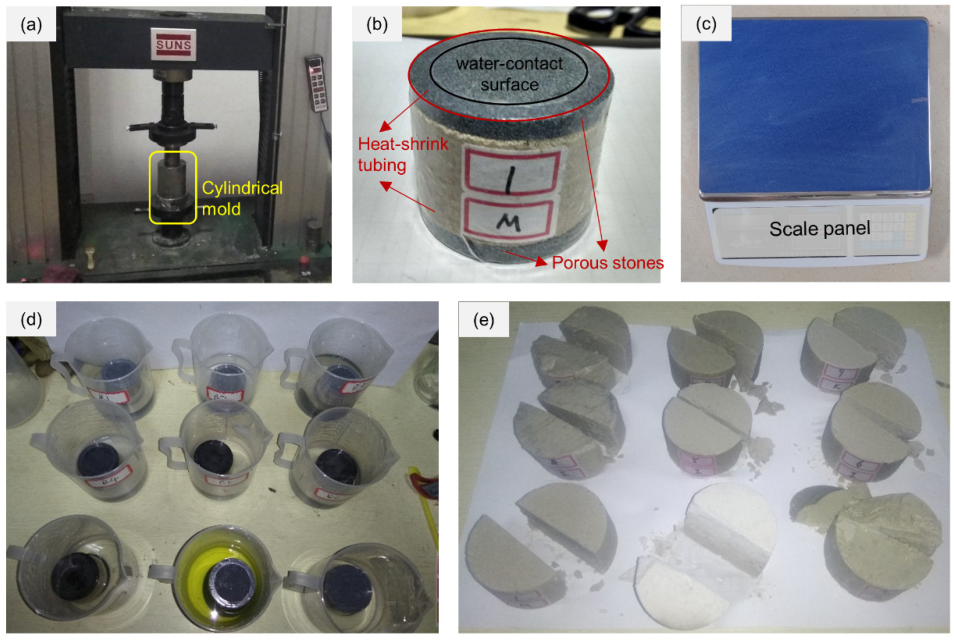
Soft rock analogues and water solutions are synthesized as shown in Table 1. When synthesizing soft rock analogues, the total mass of clay minerals and quartz is 100 g and the mass of water is 5 g. Place the mixture of the above materials evenly in a cylindrical mold (diameter 50 mm) and hold the pressure for 10 min with an uniaxial compression testing machine according to the vertical stress shown in Table 1 (Figure 2a). Take the sample out of the mold and put it into an oven heated to 105 °C until its mass reaches a constant value. The sample is then cooled to ambient temperature in a desiccator. Finally, in order to prevent the sample turning muddy during water absorption, it is sealed with porous stones (diameter 50 mm, thickness 5 mm) and heat shrinkable tubes. The middle part of the bottom surface is made into a circle (diameter 38 mm) for the water absorption tests (Figure 2b). In this study, 18 samples are synthesized for tests.
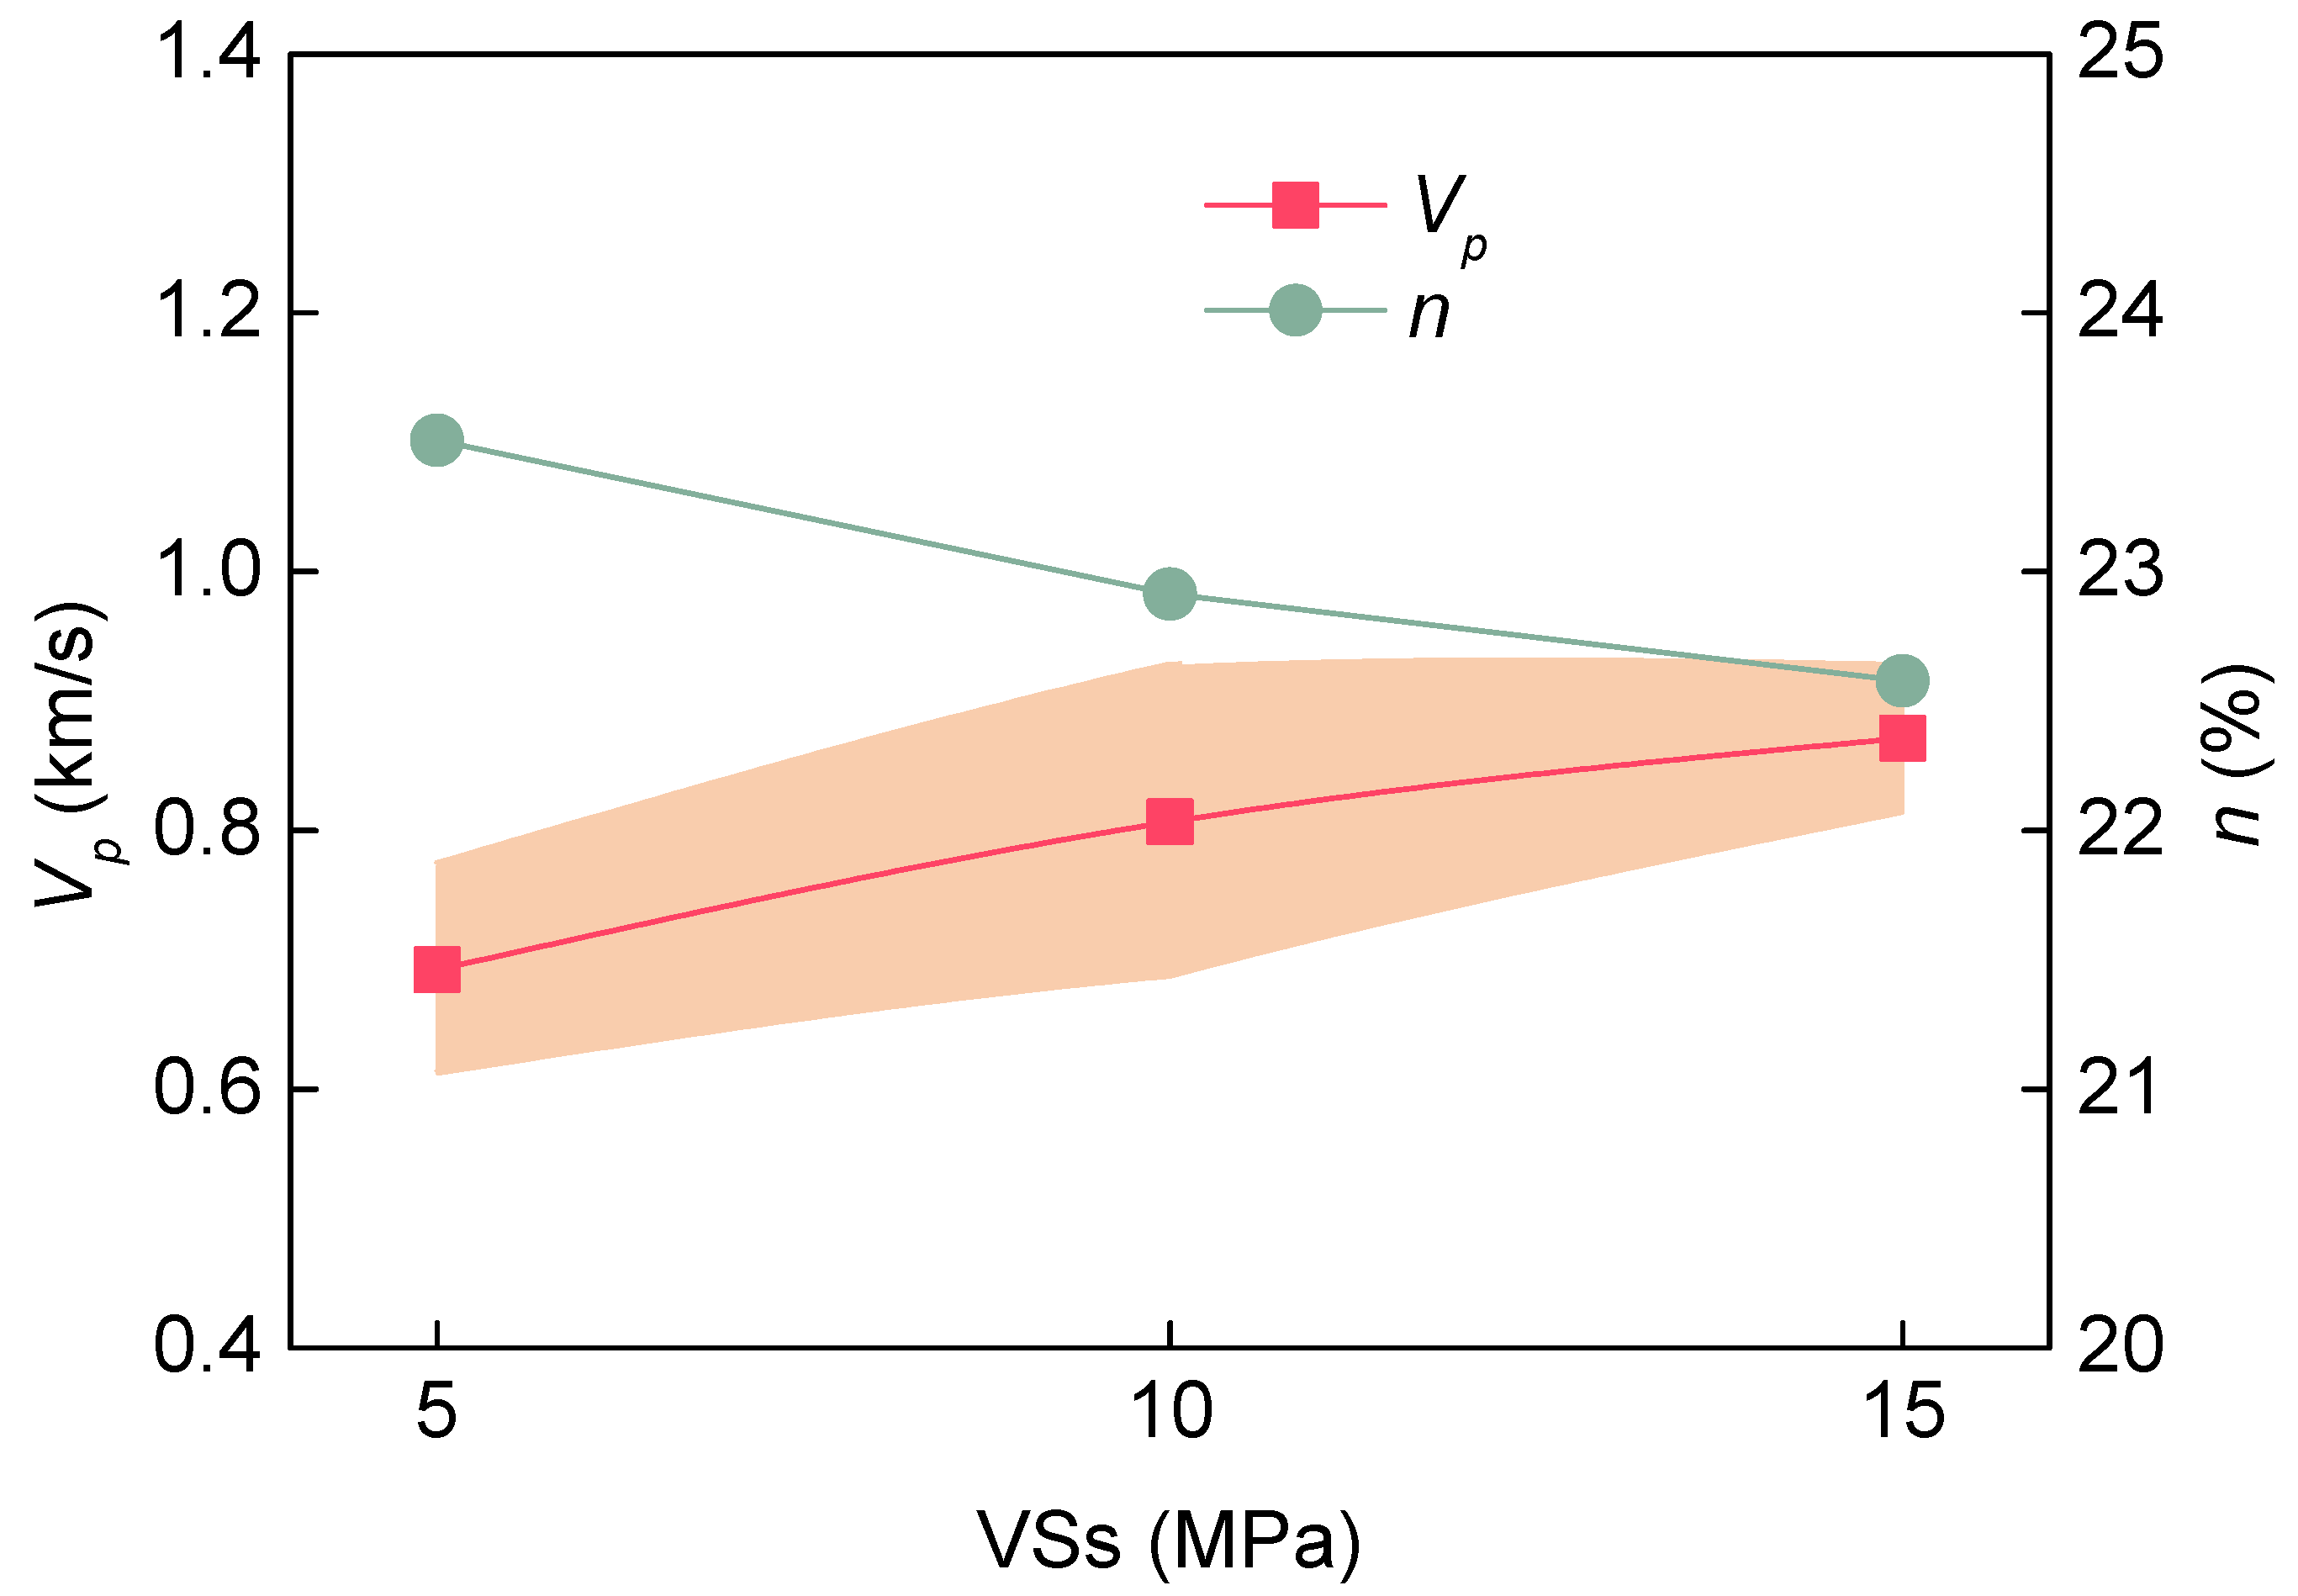
In order to determine the porosity of the samples by a nondestructive monitoring method, the P-wave velocity V p (km/s) of synthetic soft rock analogues is measured by C61 non-metallic ultrasonic detector. The porosity of the test sample could be obtained by the relationship between the P-wave velocity and the rock porosity n (%) (Equation (1), Figure 3) established by Yagiz [27].
n = 5.19 V p + 27.1 ,
Then, weigh a certain mass of salt according to the columns of CTs, ATs and CCs in Table 1. Put the salt in deionized water and add HCl and NaOH (considering the contents of Na + and Cl ) to prepare solutions with certain pH values and mix evenly. Finally, 100 mL of solution supernatant is used as the test solution. In this study, 18 water solutions are synthesized for tests.
The water absorption test system is composed of a container, sample, water solution, high-precision electronic scale (Figure 2c), porous stone, etc. The sample is not in direct contact with the solution, but through contact with porous stone to reduce the saturation velocity of the sample (Figure 2d). Each sample is tested for regular intervals. A total of 32 tests are carried out for a total time of 4980 min (The samples are saturated or nearly saturated at 4980 min, and the extension of the test time has no effect on the main conclusions of this study). In each test, the total mass of the water absorption container including the sample should be weighed first and then the remaining mass of the water absorption container without the sample should be weighed. The change in water absorption in each test is calculated according to Equation (2), so as to eliminate the experimental error caused by solution evaporation. After the test, remove the heat shrinkable tube and porous stones on the surface of the sample and cut them from the middle. It can be seen that the water absorption of the sample is very uniform (Figure 2e).
Δ w i = m i 1 m i M i 1 M i M s × 100 % ,
where, Δ w i (%) is the change in water absorption when the test is conducted to i , i and i -1 are the test numbers, M (g) is the total mass of the water absorption system including the sample, m (g) is the residual mass of the water absorption system without the sample and M s (g) is the initial mass of the sample.

3. Results and Discussion

3.1. Change in Water Absorption with Time

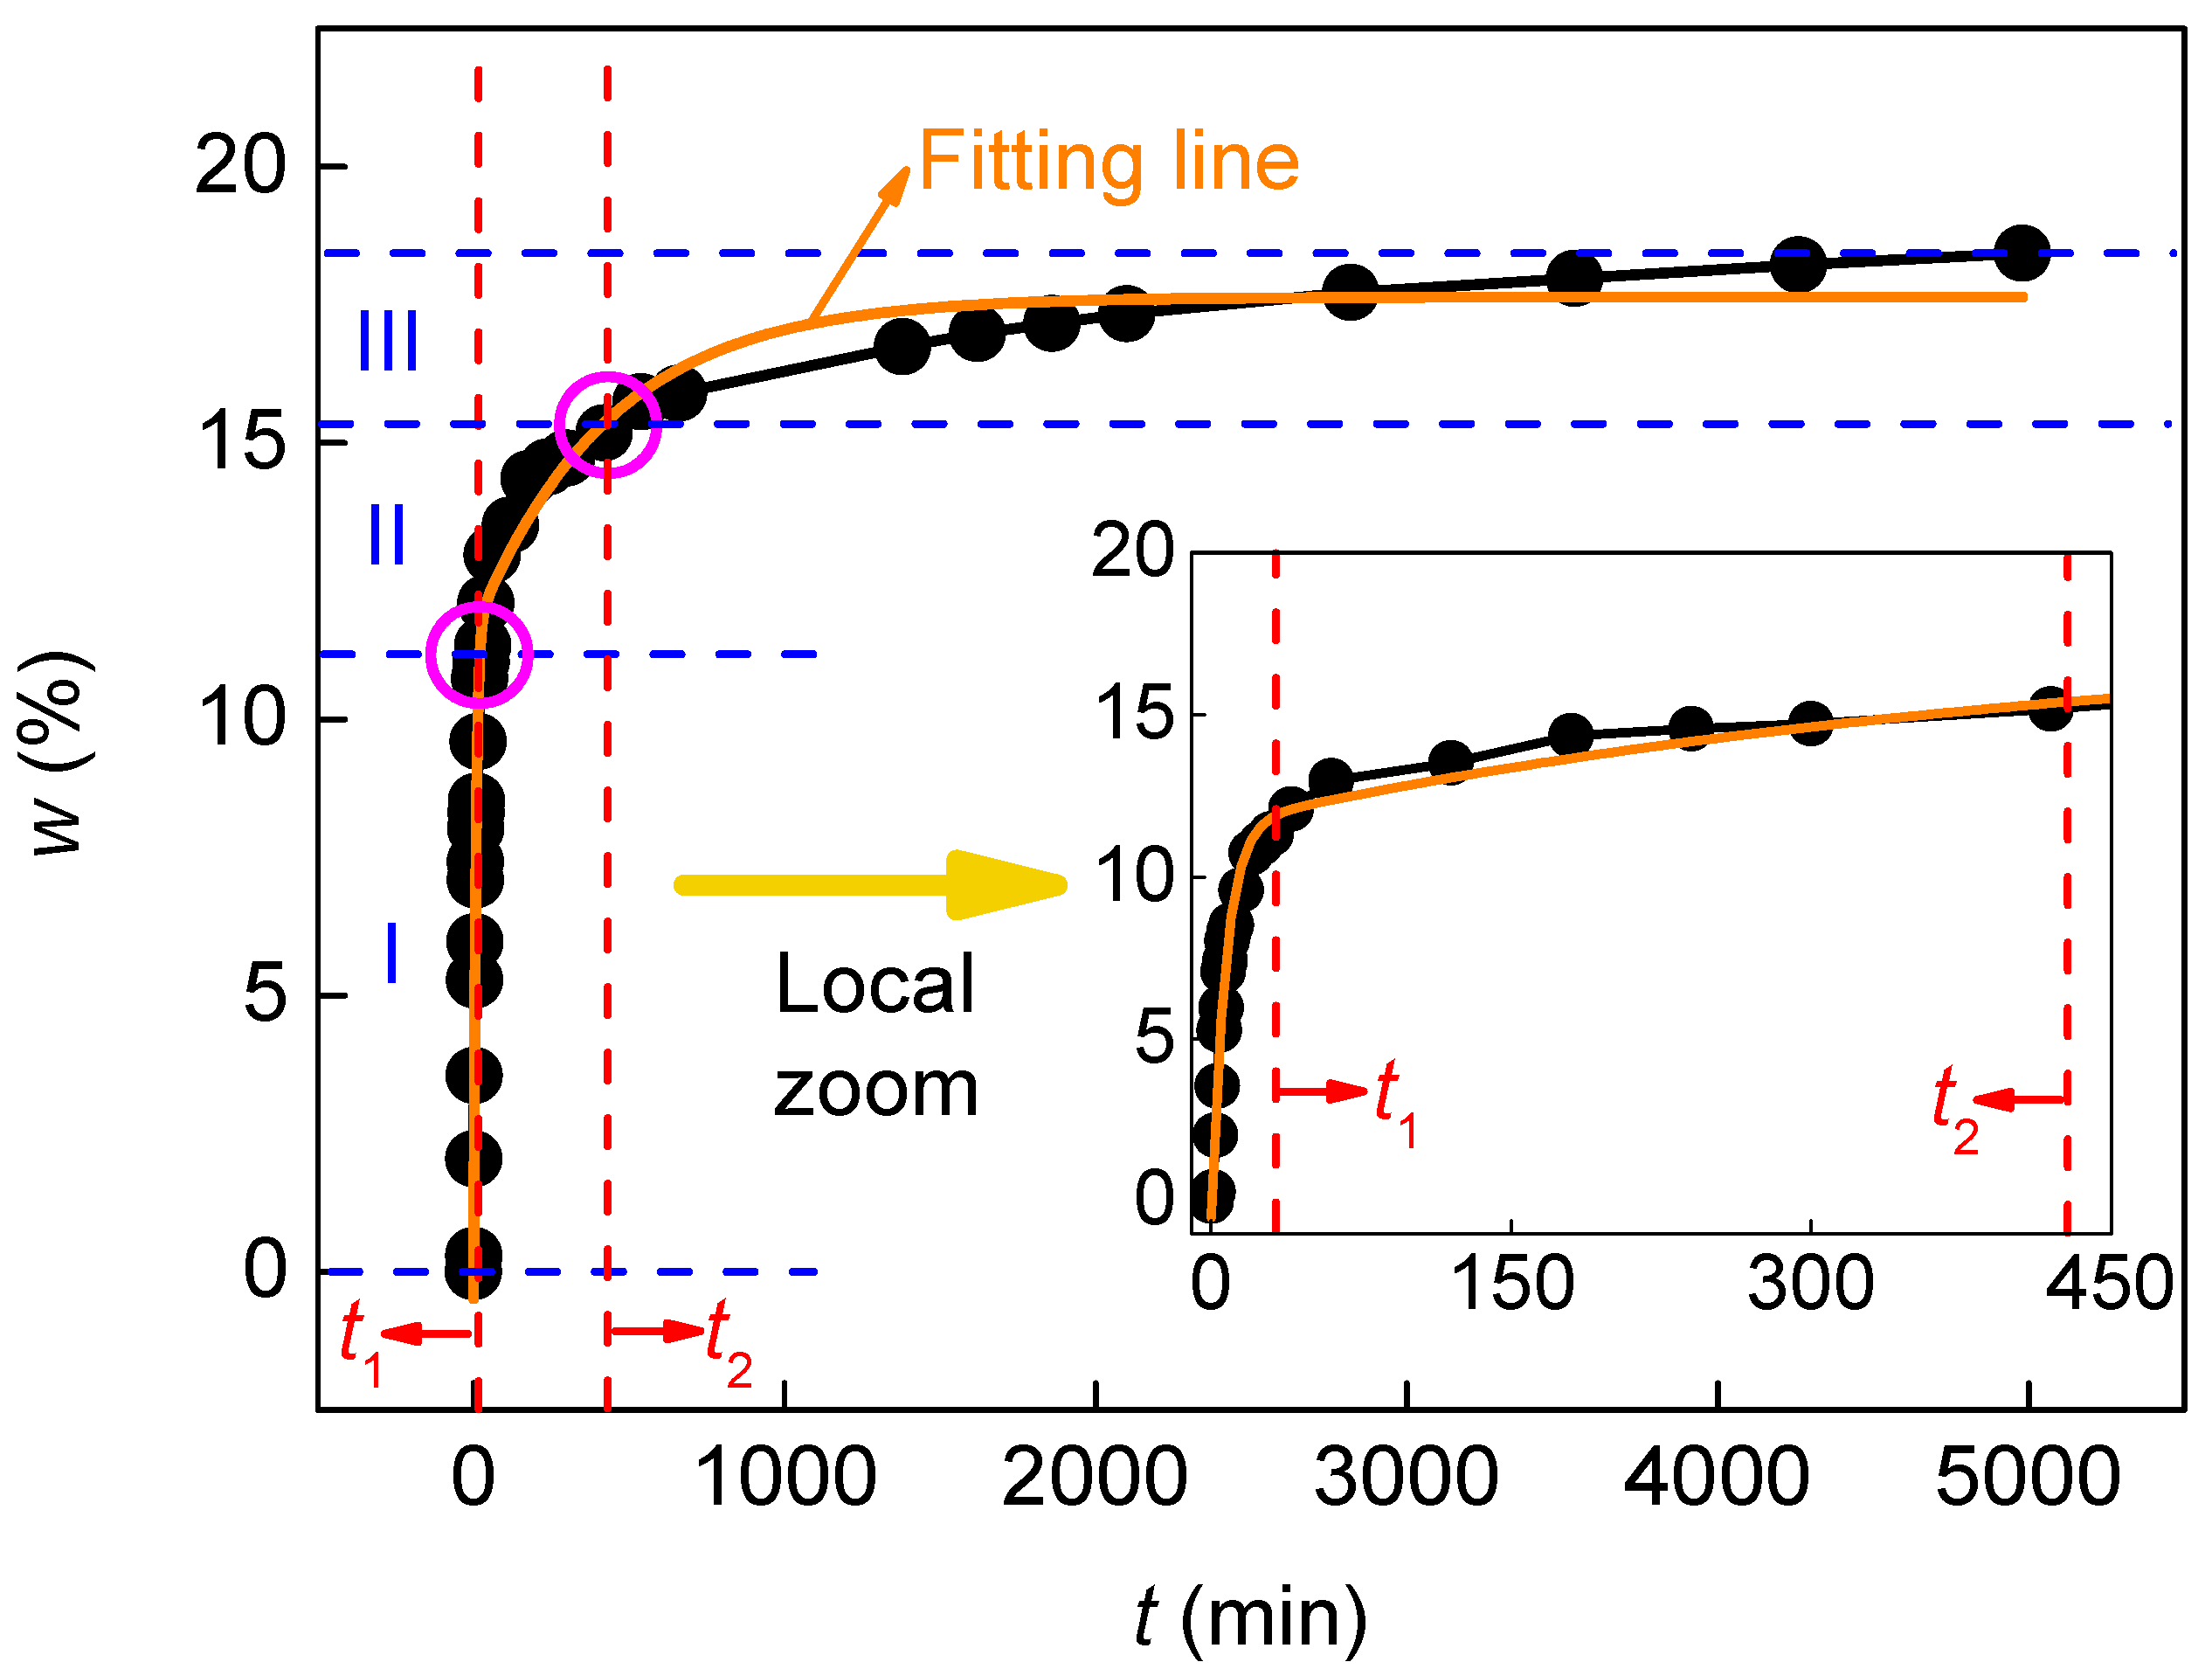
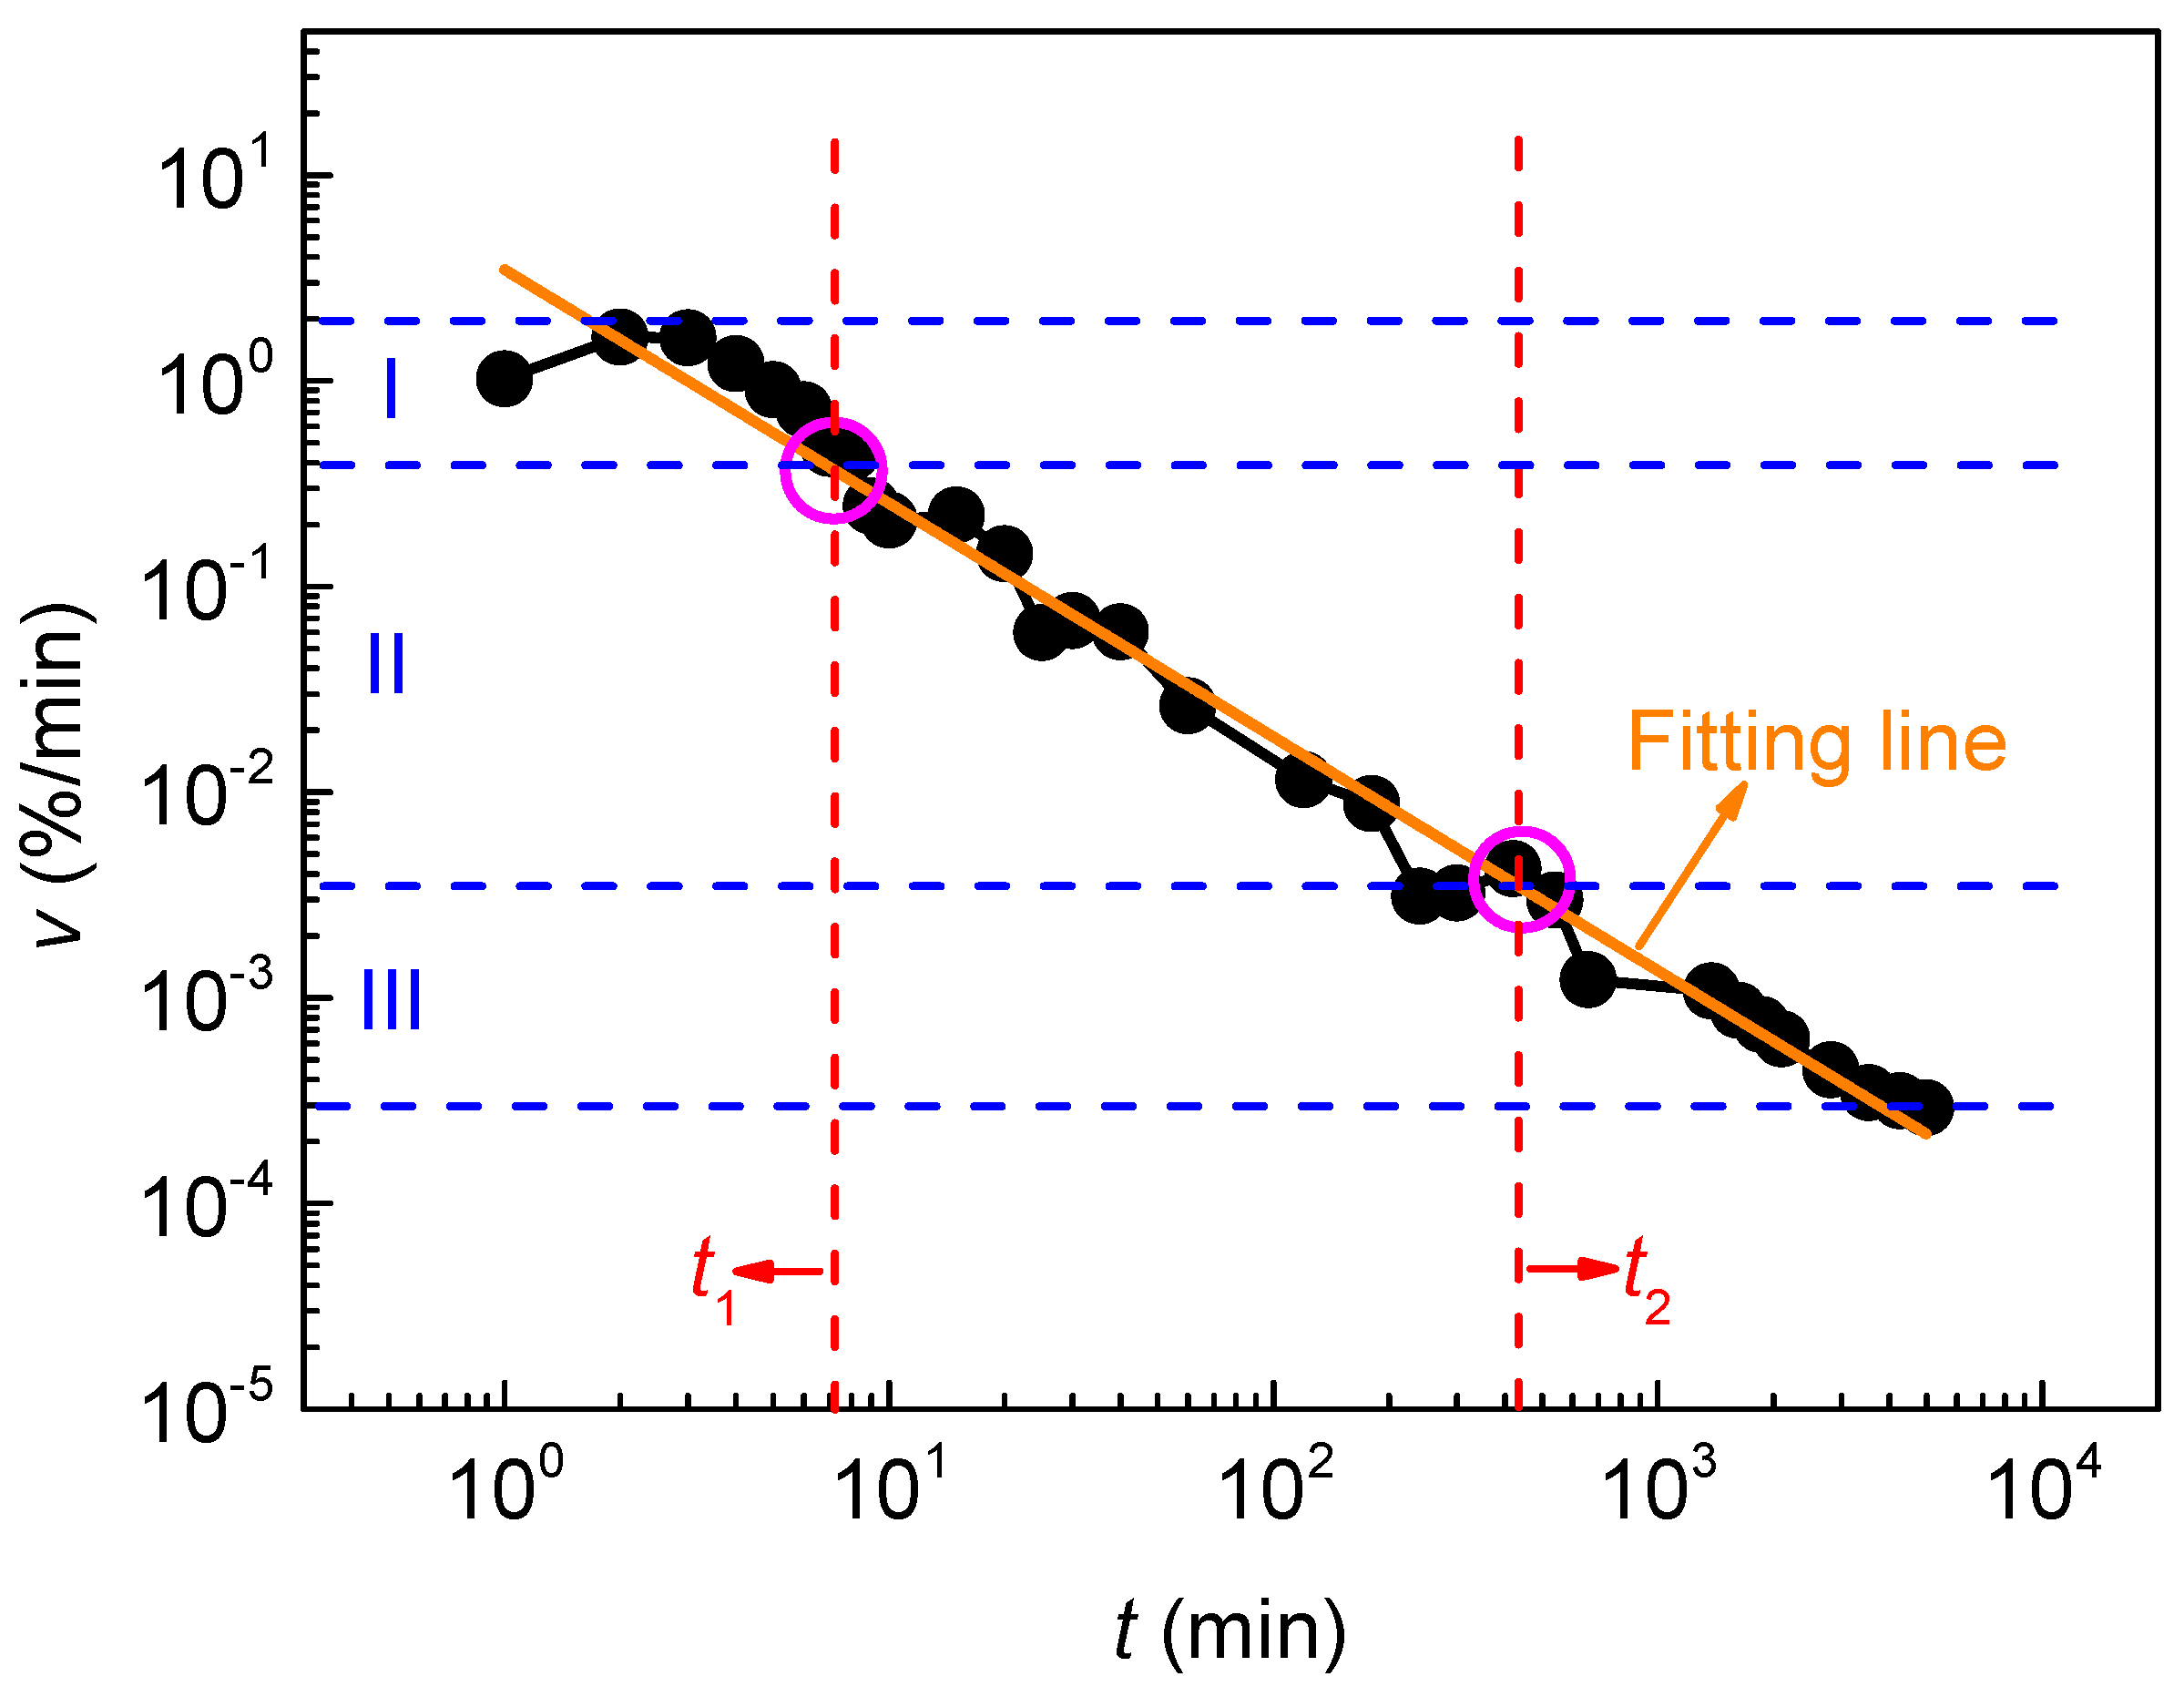
In order to analyze the water absorption process of soft rock, the results (Table S1) of 18 group tests in Table 1 are averaged to eliminate the influence of various factors. The water absorption velocity is obtained by time differentiation of the water content. Then, by fitting the values of water content and water absorption velocity, the best fitting curve is obtained and the rock water absorption process model is established (Figure 4 and Figure 5).
According to the average water content, a second-order exponential decay function is fitted (Equation (3), the corrected coefficient of determination R a d j 2 = 0.992 ), and the rock water content model is obtained. The overall trend of the curve is that it first rises rapidly, then slows down and finally stabilizes near saturation. According to the parameters t 1 and t 2 in Equation (3), the whole curve can be divided into three sections. (1) Section I: extremely fast water absorption section; the water content exceeds 50% of the saturated water content in a very short time, and the curve is linear and almost vertical. (2) Section II: deceleration water absorption section; within the time equivalent to several tens of times of Section I, the water content reaches 80% of the saturated water content and the curve is concave. (3) Section III: slow water absorption section; compared with the first two sections, the water absorption time was significantly increased and the change rate of water absorption velocity is significantly reduced.
w = A 1 × e t t 1 + A 2 × e t t 2 + w 0 ,
where, w is the water content. w 0 is the offset, which is close to the saturated water content, and the value here is 17.6. t is the water absorption time. A 1 and A 2 are the amplitudes, which are negative values of all experiments, and the values here are −12.1 and −6.1, respectively. t 1 and t 2 are water absorption time fitting parameters and the values here are 7.1 and 430.7, respectively.
According to the average water absorption velocity, a linear function is fitted (Equation (4), the corrected coefficient of determination R a d j 2 = 0.983 ) in the double logarithmic coordinate axis (base 10), and the rock water absorption velocity model is obtained. Additionally, according to the parameters t 1 and t 2 in Equation (3), the whole curve is divided into three sections. (1) Section I: the water absorption velocity is greater than 0.4%/min. (2) Section II: the water absorption velocity is between 0.004–0.4%/min. (3) Section III: the water absorption velocity is less than 0.004 %/min. Equation (4) can also be written in the form of Equation (5).
y = a + b x ,
where y represents lg v . x represents lg t . a is the intercept and is always positive, and the value here is 0.54. b is the slope and is always negative, and the value here is −1.14.
v = 10 a × 10 b × lg t ,
where v is the water absorption velocity.
Under the premise of considering the scale problem, the above laboratory test results can be applied to engineering. Reasonable measures are taken to prevent and control engineering disasters by judging the section of rock water absorption. When the water absorption of the rock is in Section I, the water content is small and the water absorption velocity is large, and the water source needs to be cut off in time to prevent the water content from increasing rapidly. When the water absorption of the rock is in Section II, the water can be cut off while absorbing water. At this time, the operability time for taking engineering measures is sufficient. When the water absorption of the rock is in Section III, the influence of water can be ignored in a short period of time because the rock is basically saturated and the project has not been damaged. This kind of situation is suitable for short-term use of rock engineering. For example, on the premise of exploring the fault and other failure surfaces of Norwegian subsea tunnel, the rock water absorption model proposed in this study can be used to judge the water absorption stage of the surrounding rock during tunnel construction and certain measures can be taken to prevent and control tunnel water inflow [16].

3.2. Influence of Various Factors on the Water Absorption Process of Soft Rock

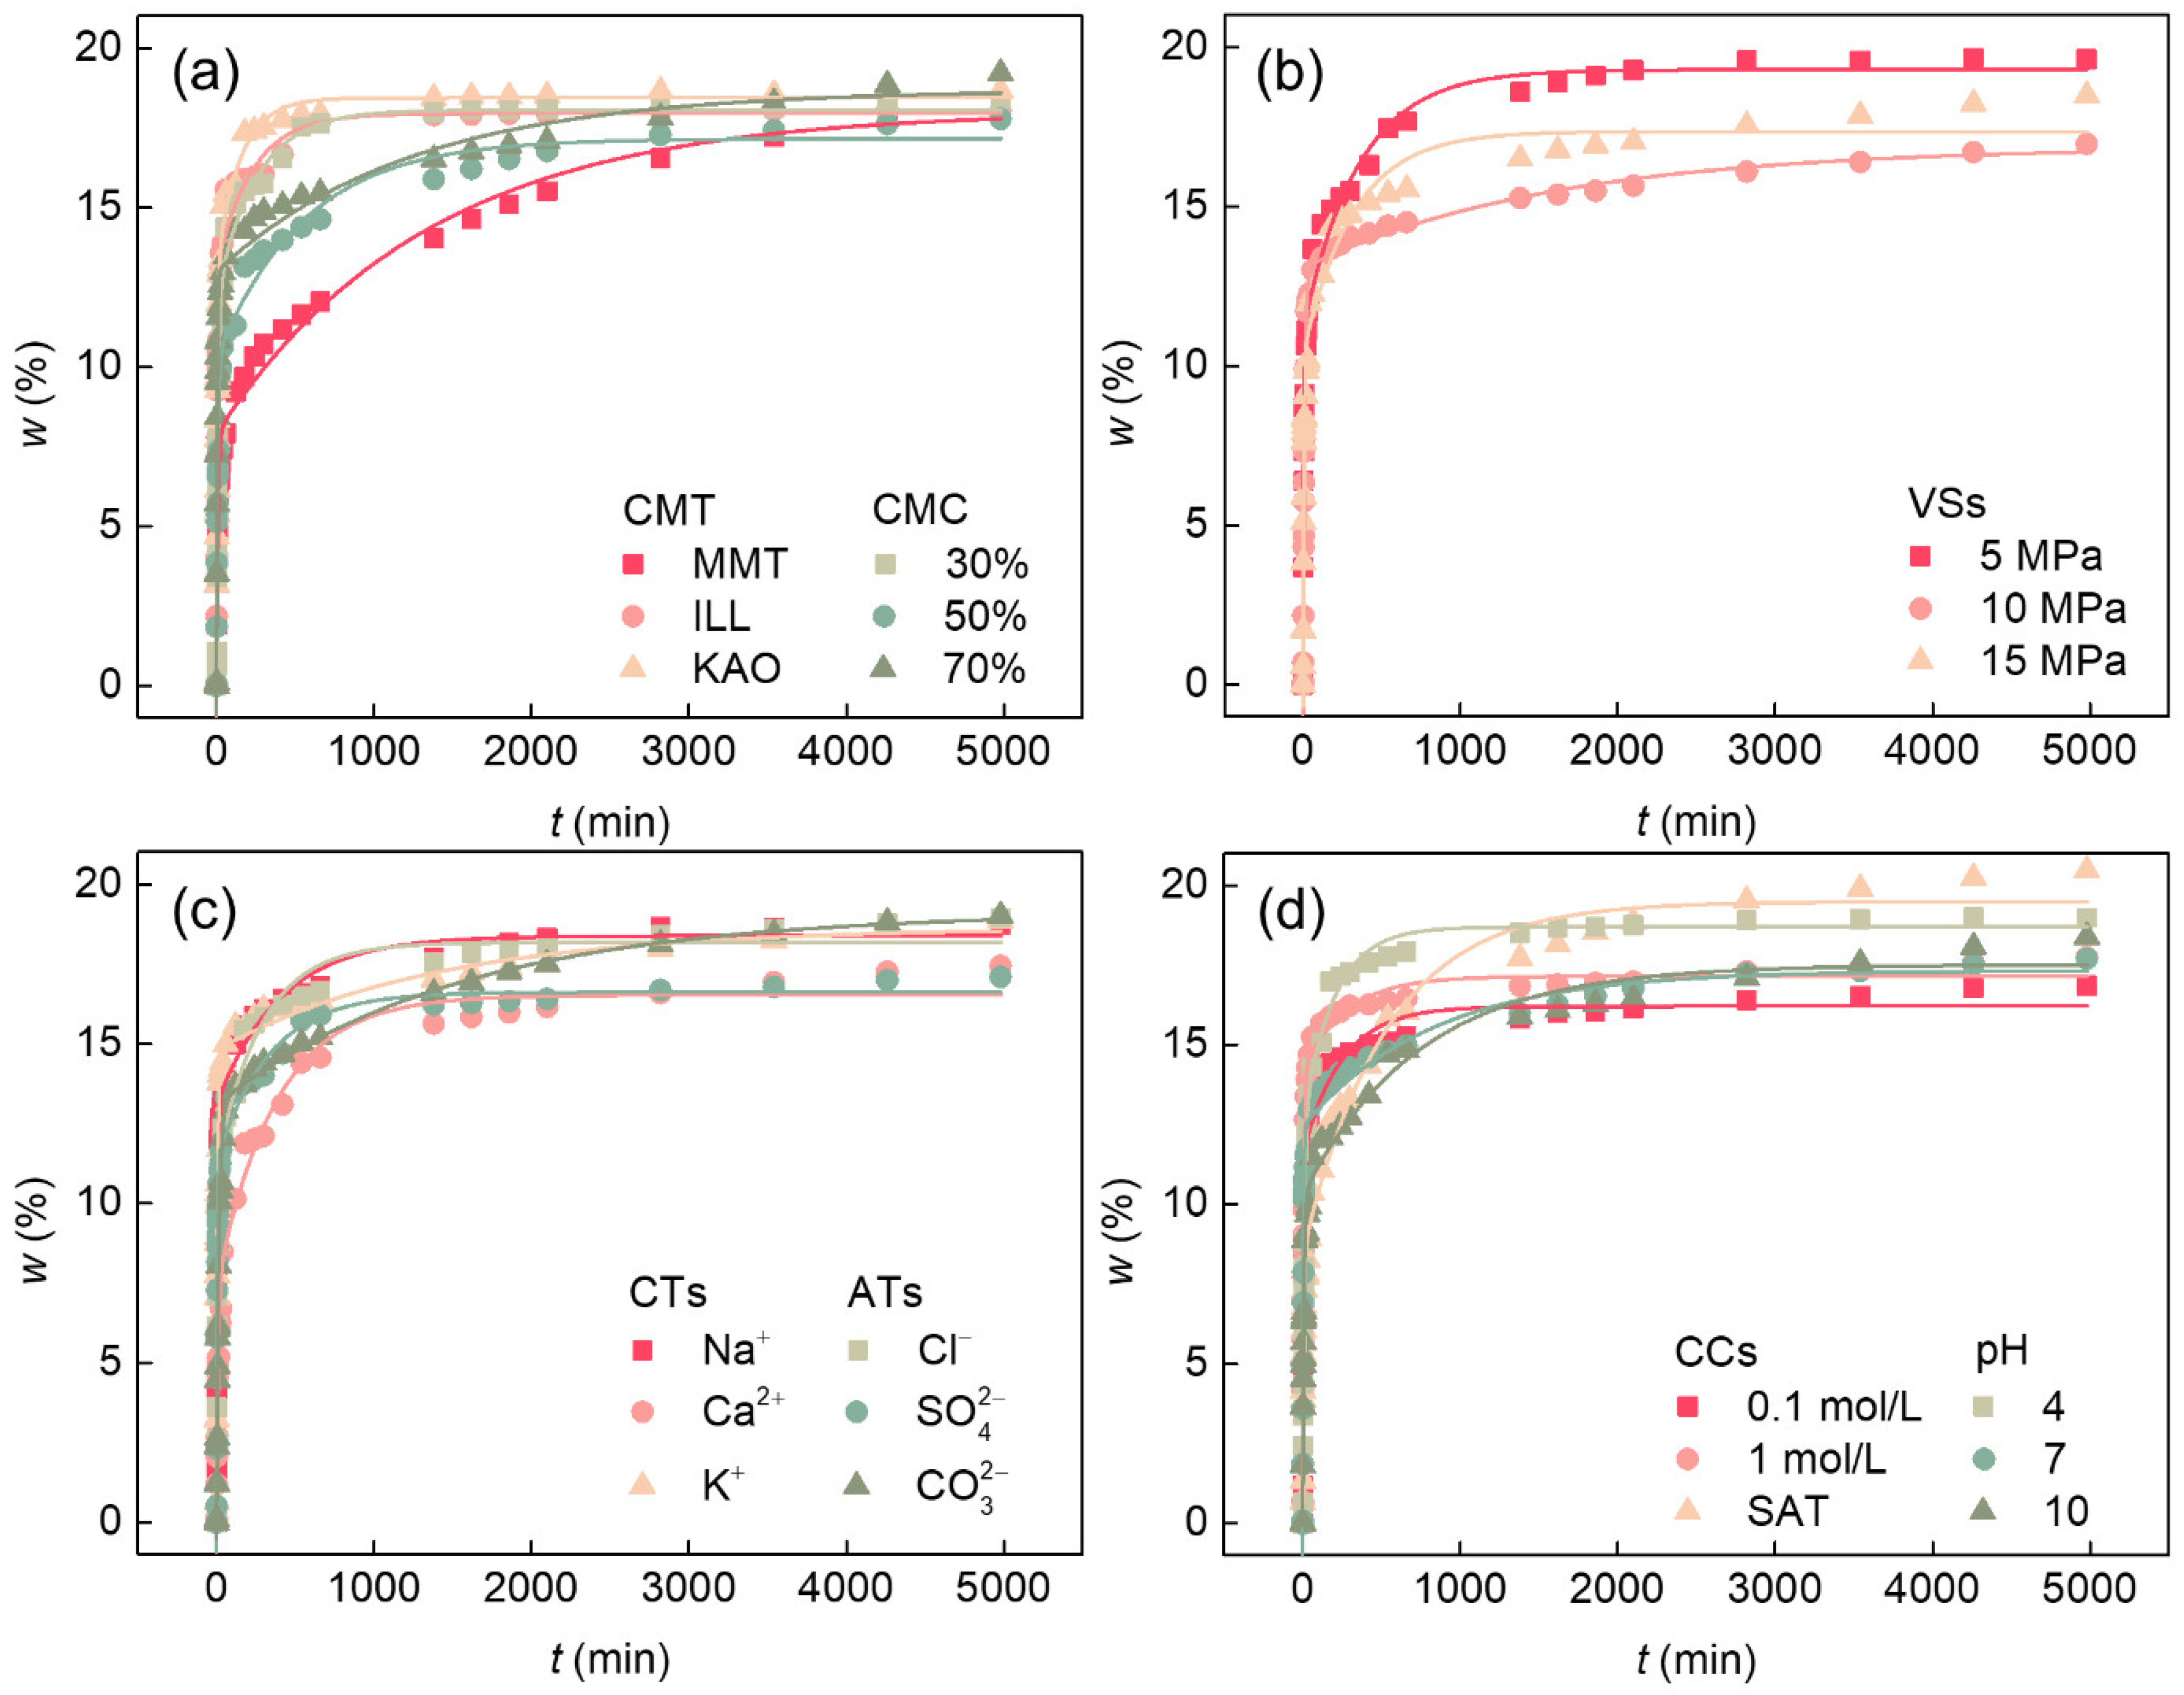
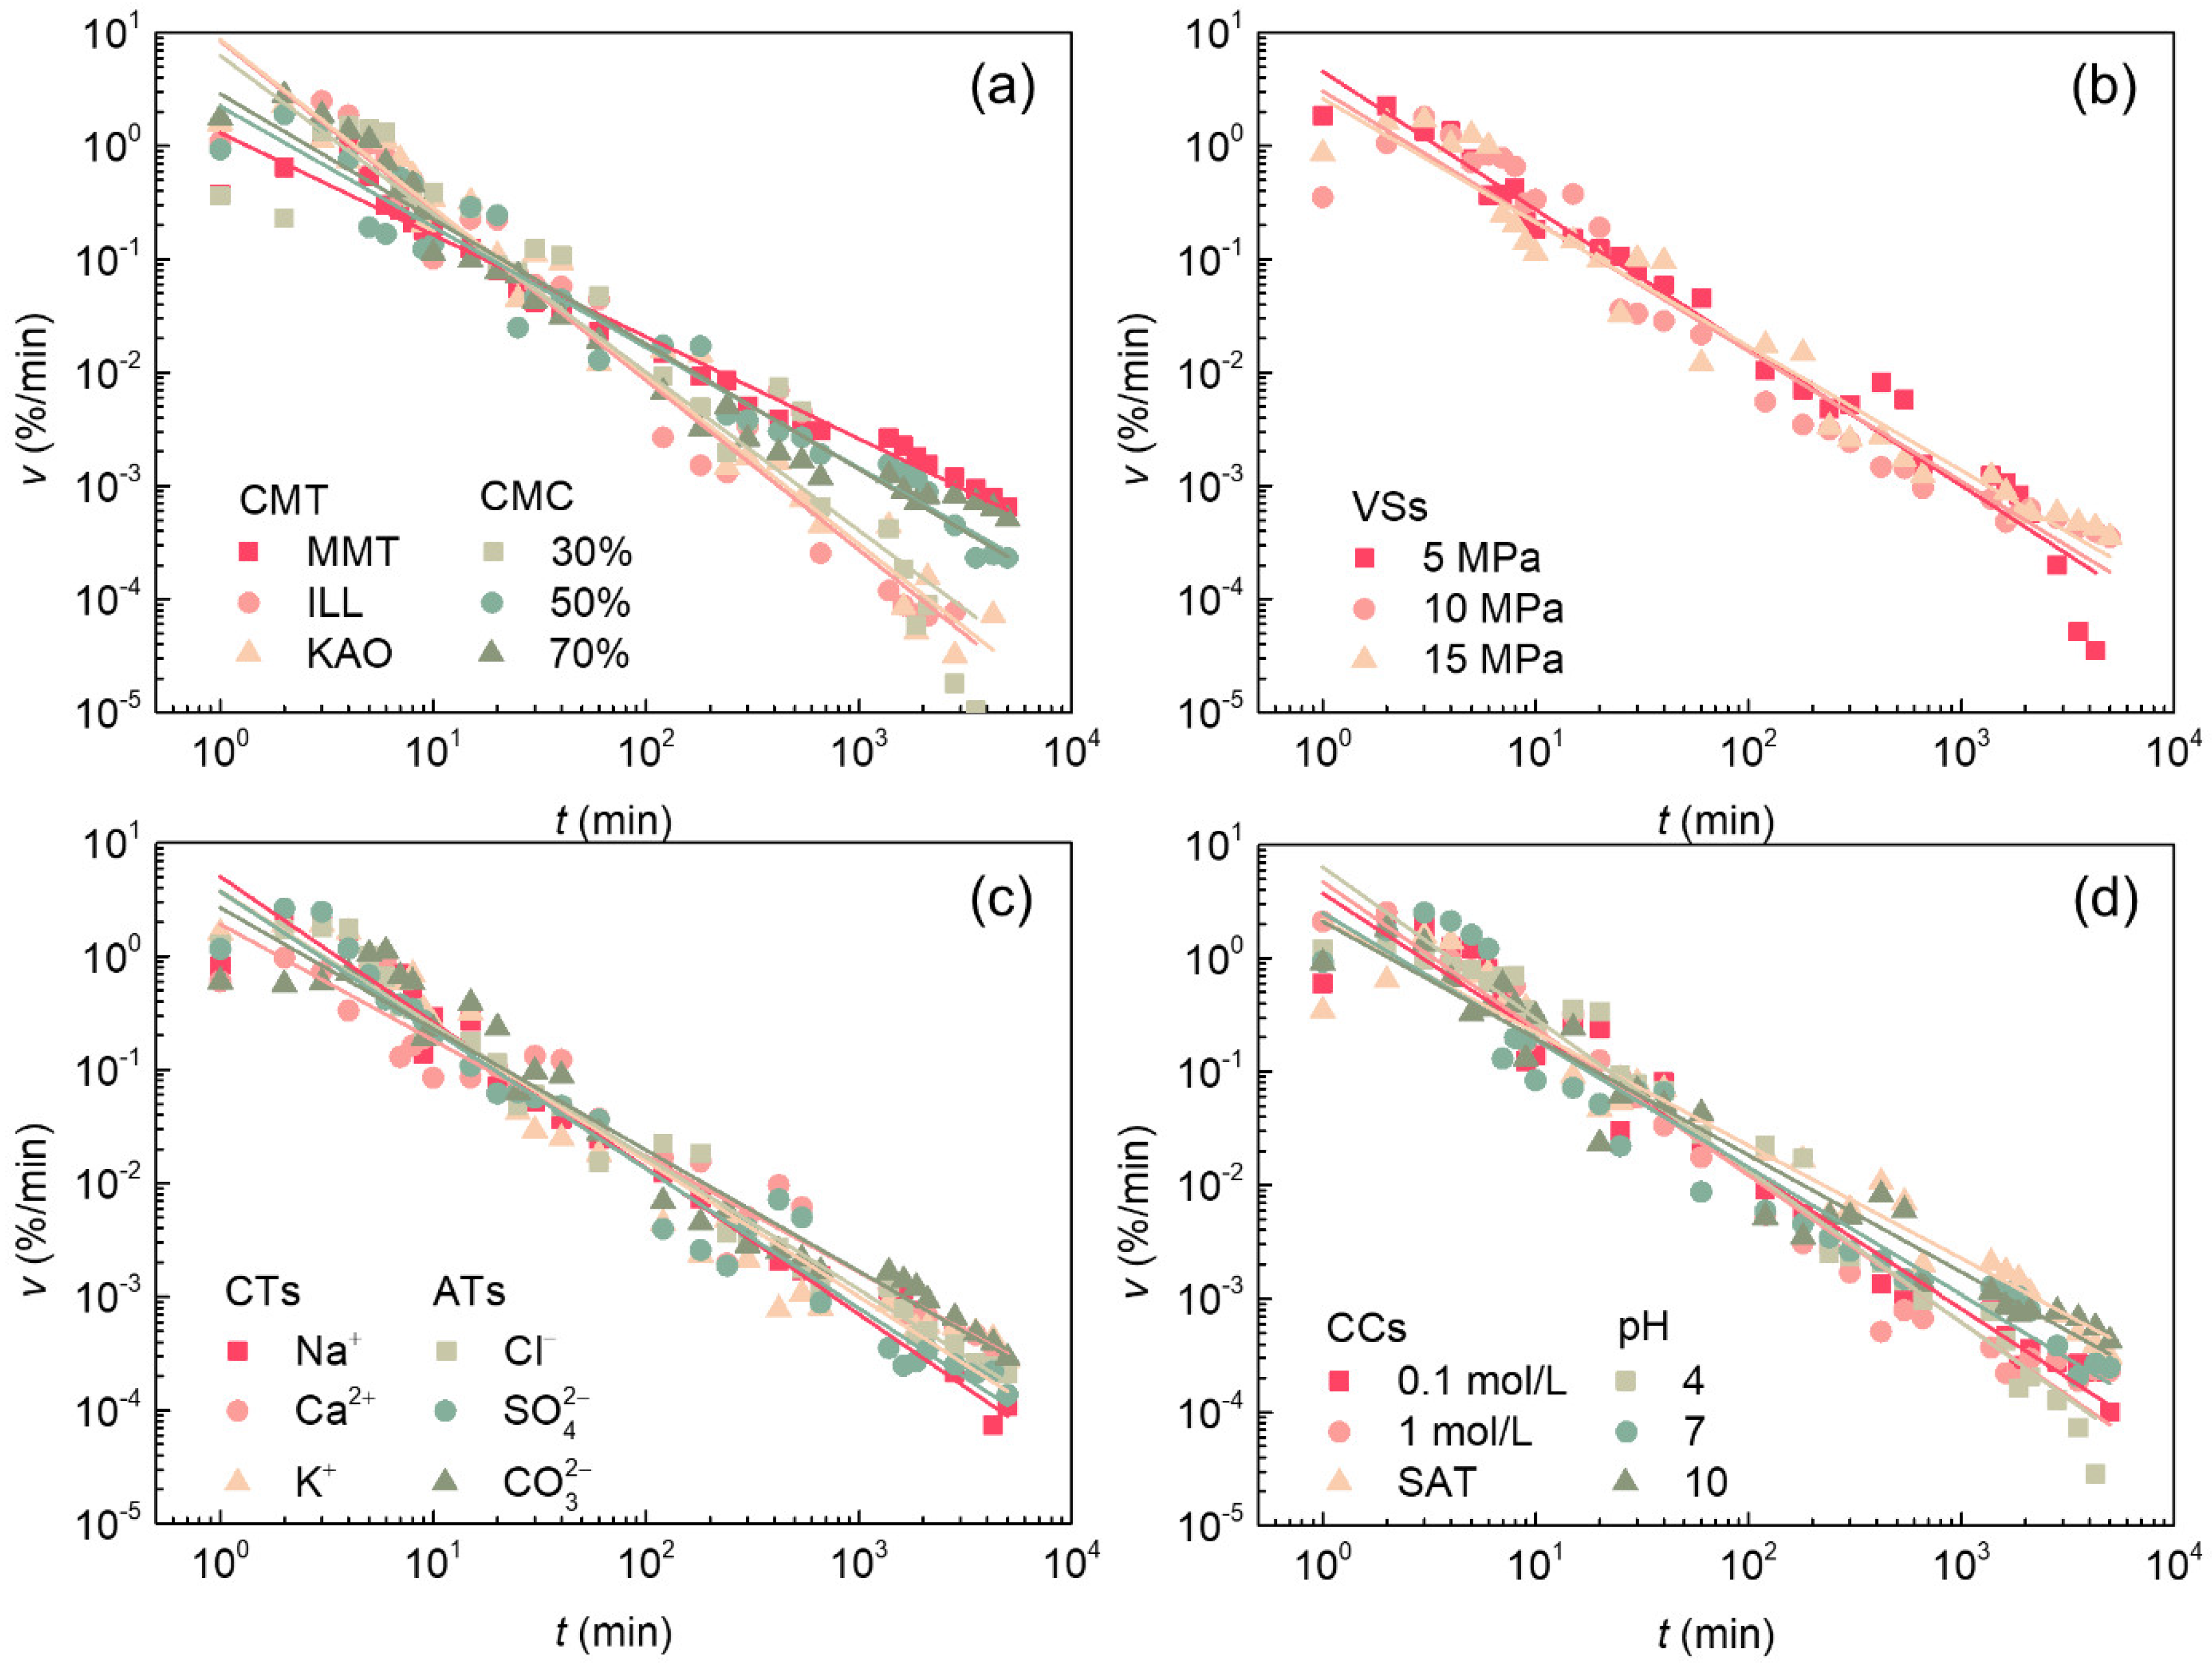
In rock engineering, water absorption by soft rock is the result of the combined action of internal and external factors. In different geological environments, the influence of different factors on the water absorption process needs to be considered. This section analyzes the experimental results for seven factors: clay mineral type, clay mineral content, vertical stress (porosity), cation type, anion type, concentration and pH value. Under the influence of various factors, the water content and water absorption velocity of rock are shown in Figure 6 and Figure 7, respectively. The experimental design in Table 1 in this study was designed according to the seven factors and three levels in the orthogonal experiment, so the data sources in Figure 6 and Figure 7 are the average of each factor and each level [43]. For example, the average value of water content for test numbers 1, 2, 3, 10, 11 and 12 in Table 1 is the effect of montmorillonite in the clay mineral type on the water absorption process. Meanwhile, the data in Figure 6 and Figure 7 are fitted with Equations (3) and (4), respectively (most of the R a d j 2 in the fitting results are greater than 0.95, indicating that the fitting results of water content and water absorption velocity over time are good). The extraction of the fitting results and comparison of the effects of each level on the water absorption characteristics are displayed in Table 2. The response data in Table 2 are normalized to obtain the degree of influence ( D I L ) of each level on the rock water absorption process, as shown in Figure 8.
By analyzing Table 2 and Figure 8, it can be seen that seven factors have different degrees of influence on rock water absorption. Among the fitting parameters, A 1 and A 2 are less affected by seven factors, while other fitting parameters are greatly affected by seven factors. The specific surface area and swellability of montmorillonite are much higher than those of illite and kaolinite, which leads to slower water absorption velocity in rocks containing montmorillonite (Sections I and II last longer, t 1 and t 2 are larger, a is smaller) and the change rate of water absorption velocity ( b ) is smaller. The effect of clay mineral content on rock water absorption cannot be ignored. With the increase in clay mineral content, the duration of Section I ( t 1 ) shortened, the duration of Section II ( t 2 ) increased and the change rate of water absorption velocity decreased ( b ). The clay mineral type and clay mineral content have little effect on the saturated water content ( w 0 ) of the rock. Generally speaking, the smaller the vertical stress is when the rock is synthesized, the higher the rock porosity, the better the rock permeability and the greater the water content and water absorption velocity [44,45]. However, when the vertical stress is too large, it will cause secondary fracture of the rock, and although its porosity is small, its permeability is very good [42]. Therefore, in this study, when the vertical stress is small and large (5 MPa and 15 MPa), the rock water absorption velocity is fast and the saturated water content is high. Regarding the influence of water solution on the water absorption process of rocks, the research mainly includes the interaction of ion type, concentration and pH value with clay minerals in rocks [22,26]. In this study, the saturated water content and the change rate of the water absorption velocity of the rock in the monovalent cation-containing solution are larger, and the solution containing Ca 2 + makes the rock water absorption velocity slower. Among the anions, the saturated water content of the rock in the SO 4 2 -containing solution is the smallest, and the change rate of the water absorption velocity is the largest, while the water absorption velocity of the rock in the CO 3 2 -containing solution is the slowest. The higher the solution concentration, the slower the rock water absorption velocity, the greater the saturated water content, and the smaller the change rate of the water absorption velocity. In the acidic solution, the rock has the fastest water absorption velocity, the largest saturated water content and the largest change rate of the water absorption velocity. The relevant indicators in the neutral and alkaline solutions are relatively close and small. Predecessors have also analyzed the above research contents and obtained fruitful results. However, there are still two problems in these studies: (1) the effects of clay minerals, porosity and solutes on the water absorption process are not comprehensively considered and (2) the water content model and water absorption velocity model are not used to quantitatively analyze the water absorption process [46,47,48].

3.3. Quantification of the Degree of Influence of Each Factor

The research in this section focuses on the degree of influence of seven factors (CMT, CMC, VSs, CTs, ATs, CC, and pH) on rock water content and water absorption velocity. According to the principle of orthogonal test analysis and the design of orthogonal table, the range analysis method is selected to analyze the degree of influence of various factors on rock water absorption [49]. The range values for all responses during water absorption process are calculated according to Equation (6), and the results are shown in Table 3.
R = K m a x K m i n ,
where R is the range value. The greater the value, the greater the impact. K m a x and K m i n are the maximum and minimum values within each factor of the representative t 1 , t 2 , w 0 and b in the equation parameters in Table 2.
From Table 3, the rock porosity (VSs) and the type of anions (ATs) in the solution have the greatest influence on the water absorption time ( t 1 and t 2 ), and the solution concentration (CCs) has the least influence on the water absorption time. The concentration of the solution had the greatest influence on the saturated water content ( w 0 ), and the clay mineral type (CMT) had the least influence on the saturated water content. The clay mineral type has the greatest influence on the change rate of water absorption velocity ( b ), and the rock porosity has the least influence on the change rate of water absorption velocity.
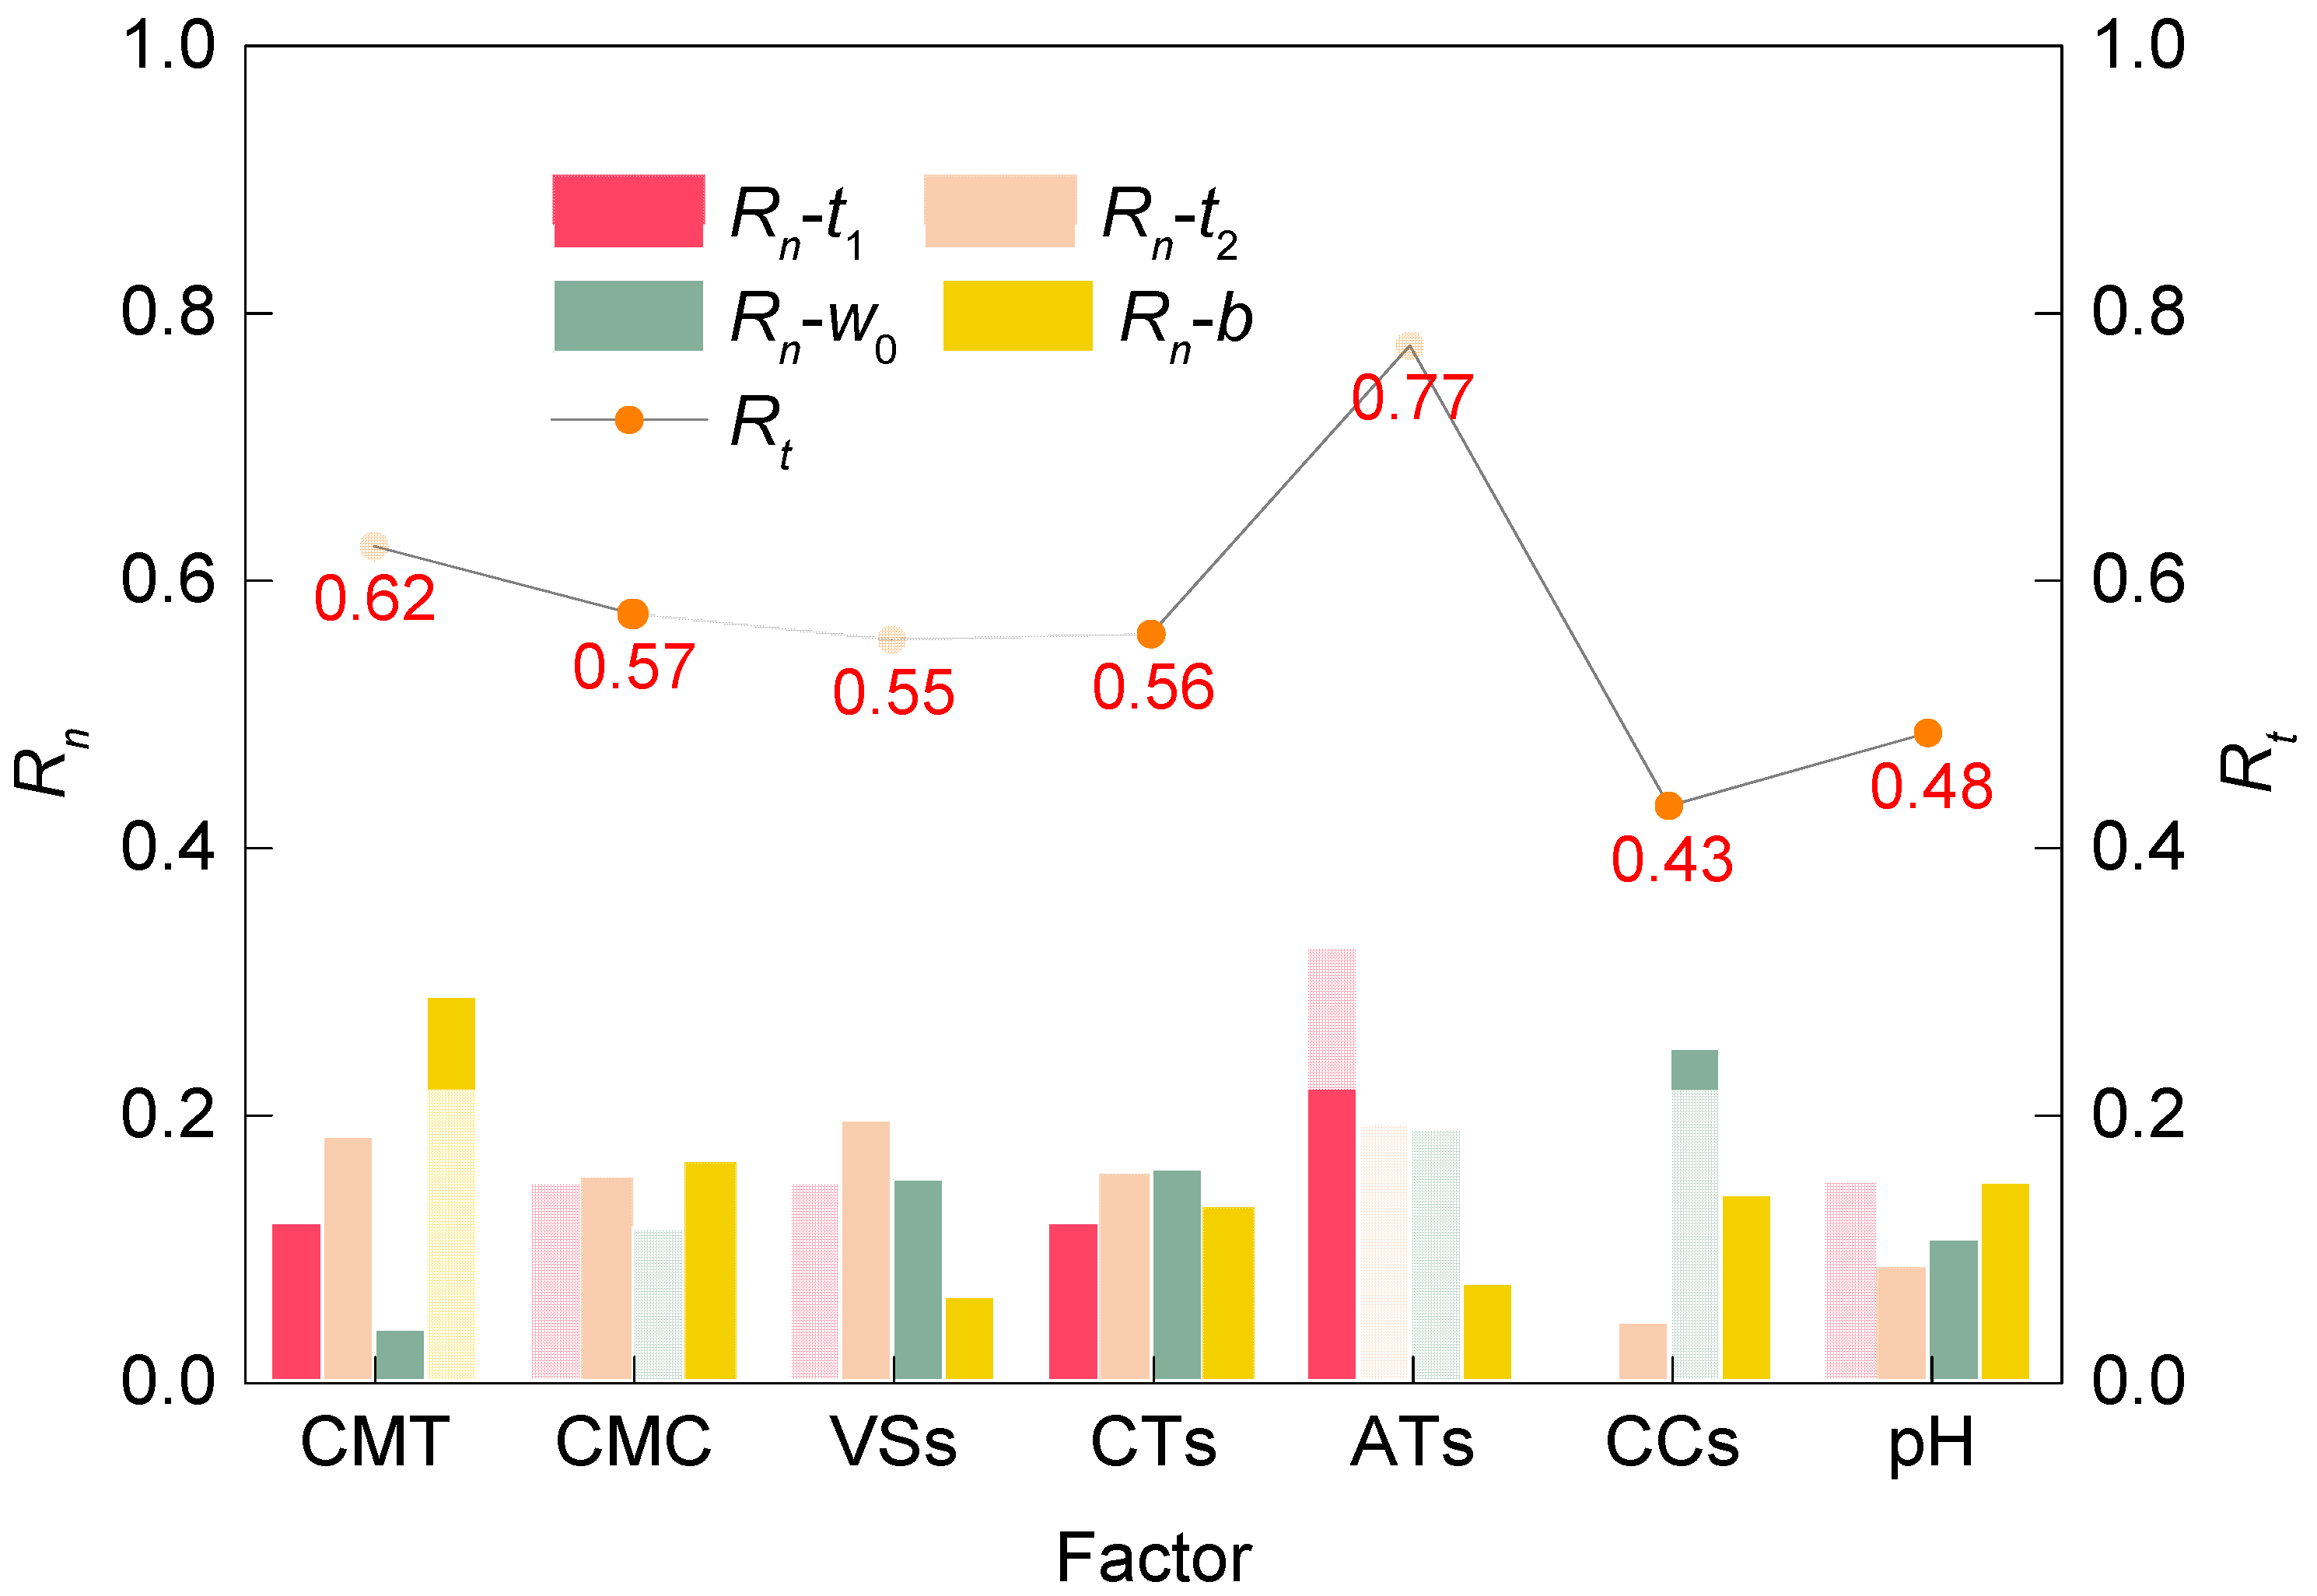
In order to eliminate the order of magnitude difference between the four parameters and facilitate the analysis, the range values are normalized and the degree of influence of the seven factors is drawn, and the overall degree of influence of each factor on the water absorption process is calculated (Figure 9, R n is the normalized degree of influence of each factor on each parameter, and R t is the sum of the degree of influence of each factor on the four parameters). It is found that seven factors have different effects on each parameter of the water absorption process. The total influence ( R t ) of the seven factors on the water absorption process of soft rock is ATs, CMT, CMC, CTs, VSs, pH and CCs from the largest to the smallest. That is, the types of anions and cations in water solutions and clay mineral compositions in rocks have the greatest influence on rock water absorption process. Predecessors also studied the influence of these seven factors on rock water absorption, but did not use the water content model and water absorption velocity model to quantify its influence [37].

3.4. Water Absorption Prediction Model of Soft Rock

On the basis of the above analysis, a prediction model of soft rock water absorption is established. The model can be used to predict the water absorption process of rocks, given the type and content of clay minerals, porosity and properties of water solutions. Firstly, build the factor and level matrices (Equations (7) and (8)). In the factor matrix, the sum of the f values equals 7. If all factors are present, then each f value is equal to 1. If only some factors exist, for example, only VSs and pH exist, then f V S s =   f p H   = 3.5, and the remaining f values are equal to 0. Similarly, in a level matrix, the l values of each column sum to 3. For the first column, all l values are 1 if all three clay minerals are present. If only one clay mineral, illite, exists, then l I L L = 3 and l M M T   =   l K A O   = 0. Then, establish the degree of influence matrices of the factor and level matrices (Equations (9) and (10)). The values in the matrix D I F are the results of the normalization of each factor R t in Figure 9, and the values in the matrix D I L are the results of the normalization of the degrees of influence of each level in Figure 8. Finally, the comprehensive influence factor ( p ) is obtained through matrix operations (Equation (11)).
F = f C M T f C M C f V S s f C T s f A T s f C C s f p H ,
where F is the factor matrix, f is the value of each factor and its value range is 0~7.
L = l M M T l 30 % l 5 MPa l Na + l Cl l 0.1 mol / L l 4 l ILL l 50 % l 10 MPa l Ca 2 + l SO 4 2 l 1.0 mol / L l 7 l K A O l 70 % l 15 MPa l K + l CO 3 2 l SAT l 10
where L . is the level matrix, l is the value of each level and the value range is 0~3.
D I F = 0.156 0.143 0.139 0.140 0.194 0.107 0.121 ,
D I L = 0.444 0.322 0.277 0.290 0.254 0.306 0.316 0.278 0.309 0.457 0.302 0.246 0.322 0.330 0.278 0.369 0.266 0.407 0.500 0.372 0.355 .
p = d i a g D I L × L 1 × 7 × d i a g D I F × F 7 × 1 ,
where p is the comprehensive influence factor, and d i a g is the operator that takes the main diagonal value of the matrix. Since the interaction between factors and levels is not considered, only the diagonal of the matrix is meaningful.
Substituting p into Equations (3) and (5) yields a multifactor water absorption prediction model (Equations (12) and (13)).
w = A 1 p × e t p t 1 + A 2 p × e t p t 2 + w 0 p ,
v = 10 a p × 10 b p × lg t .
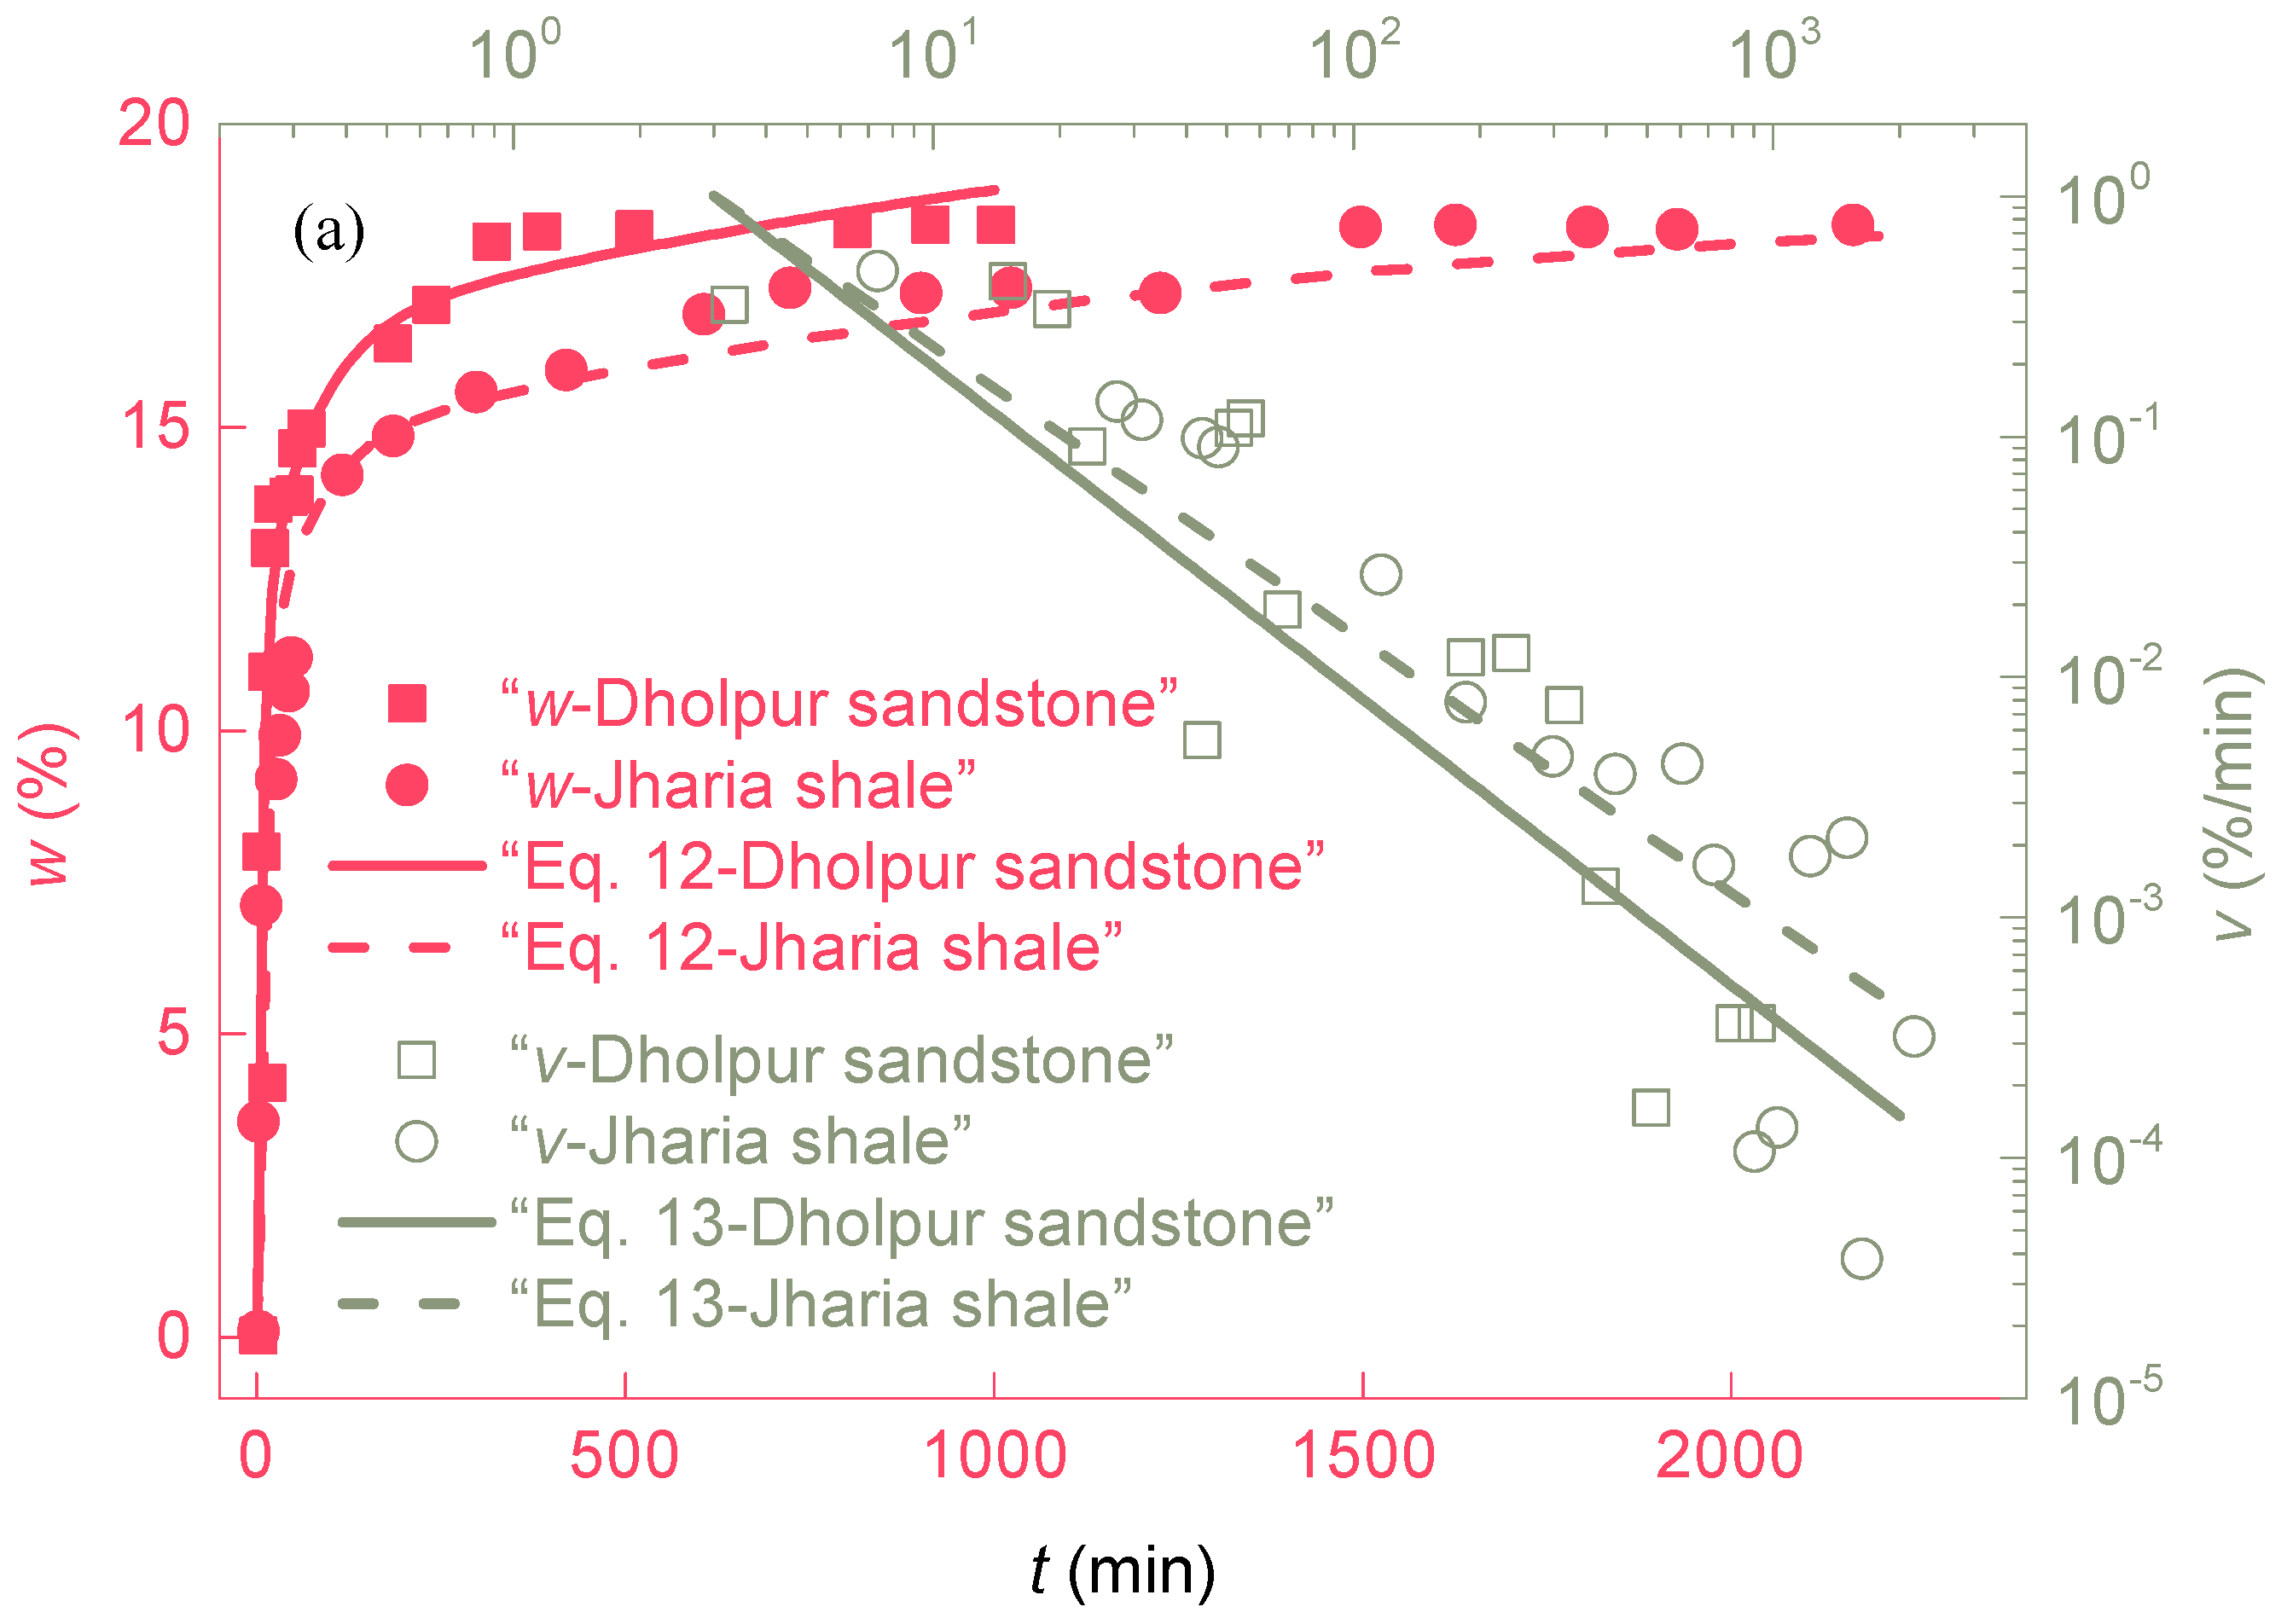
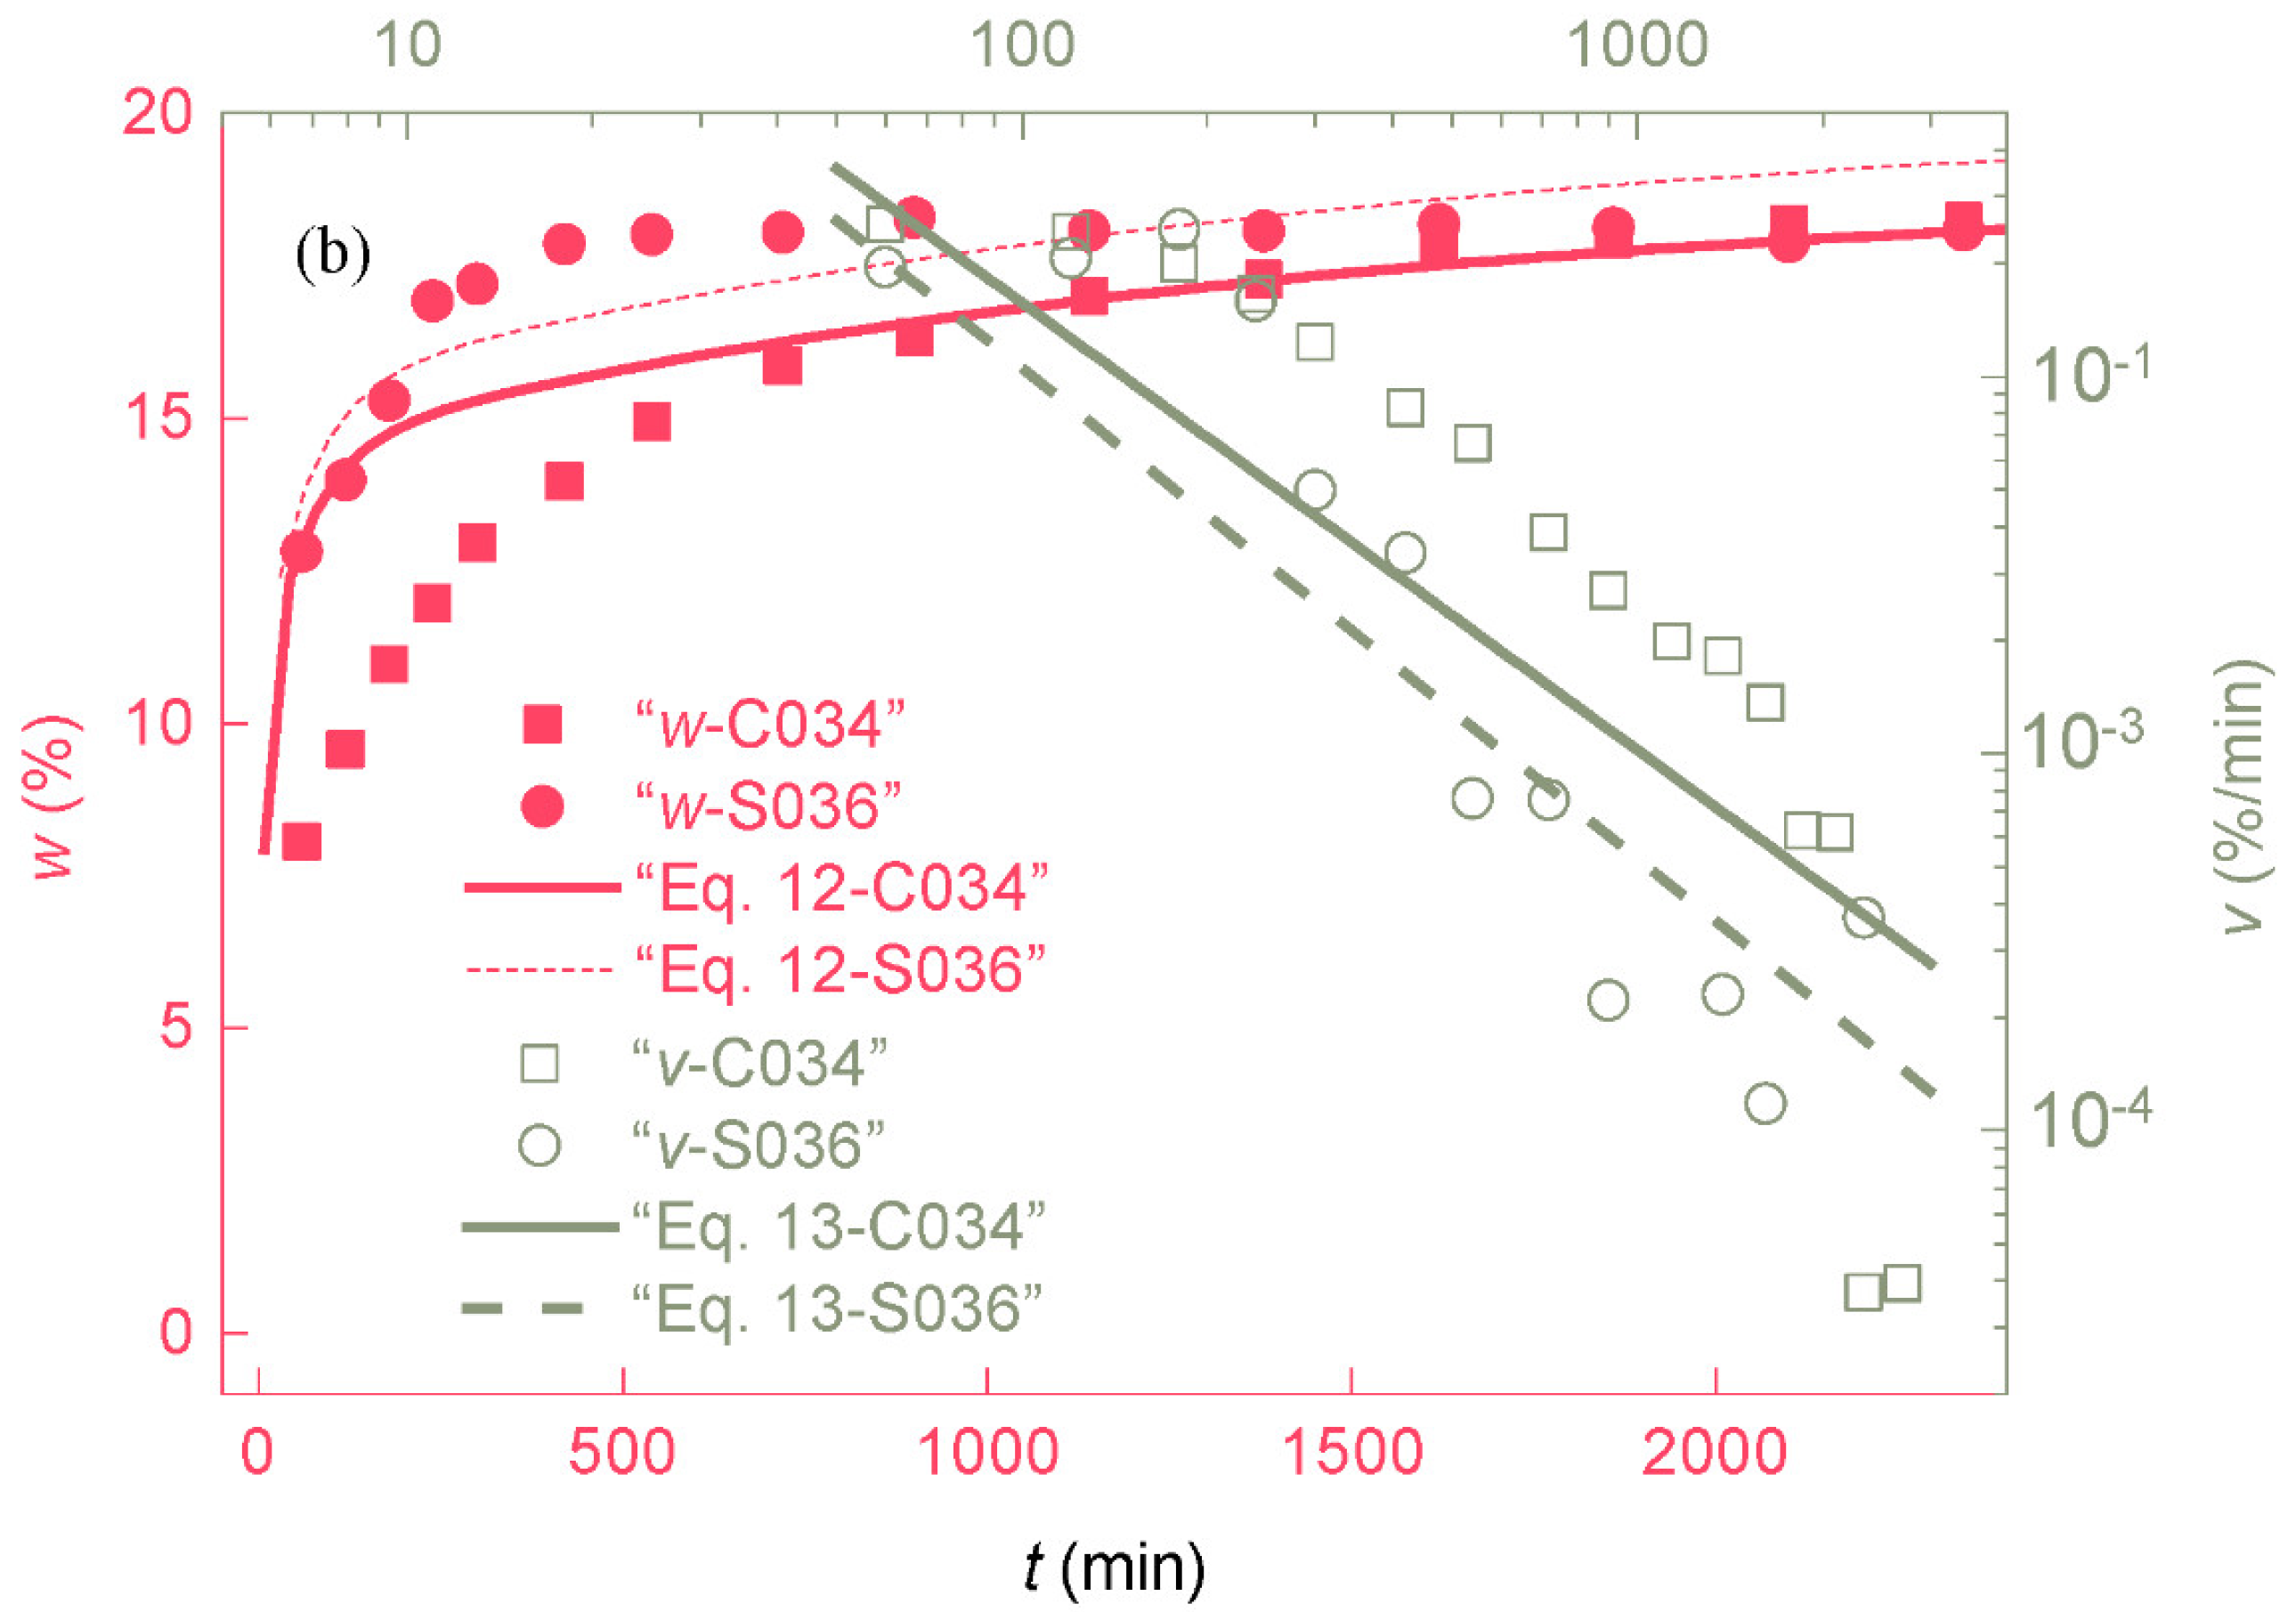
In order to verify the reliability of the soft rock water absorption prediction model, this model is compared with the related test results of the hard rock in Figure 1 of the literature [50] and the soft rock in Figure 5 of the literature [51], as shown in Figure 10. In general, the water absorption prediction model can better predict the water absorption process of rocks under the premise of known clay minerals, rock porosity and water solution properties. The curve calculated by the water absorption prediction model is basically consistent with the change trend of previous research results (except for the sample w -304). Moreover, the model can not only be used to predict the water absorption process of soft rock, but can also be used to predict the water absorption process of hard rock. Due to different experimental materials, methods and conditions, the data of some water absorption processes are different, but this does not affect the judgment of the critical time point when rocks are damaged due to changes in water content. Previous researchers also studied the water absorption prediction model, such as Zhu et al.’s entropy-based method to predict the water absorption process of rock, which has a very good prediction effect under certain conditions. However, the influence of clay minerals and solutes on the water absorption process was not considered in their study [52].

4. Conclusions

In this study, the soft rock analogs and water solutions were synthesized, water absorption tests were carried out and a soft rock water absorption prediction model was established. The changes in water content with time in the process of rock water absorption obeys a second-order exponential decay function, and the change in water absorption velocity with time obeys a linear function in the double logarithmic coordinate axis. Among the seven factors, the type of anions and cations in solution and the type and content of clay minerals in rock have the greatest influence on rock water absorption. In addition, in comparison with the water absorption process of natural rocks, the reliability of the soft rock water absorption prediction model is verified and it is proved that the model can predict the water absorption characteristics of natural rocks. The related results solve the problem of insufficient research on the prediction method of soft rock water absorption that quantitatively considers the influence of composition, porosity and solute.

Supplementary Materials

The following supporting information can be downloaded at: https://www.mdpi.com/article/10.3390/app12125938/s1, Table S1: The water absorption experimental results of 18 samples in Table 1.

Author Contributions

Conceptualization, G.C. and Z.L.; methodology, G.C.; software, G.C.; validation, G.C., Z.L. and C.Z.; formal analysis, C.Z.; investigation, G.C.; resources, G.C.; data curation, G.C.; writing—original draft preparation, G.C.; writing—review and editing, G.C., Z.L. and C.Z.; visualization, C.Z.; supervision, C.Z.; project administration, C.Z.; funding acquisition, C.Z. All authors have read and agreed to the published version of the manuscript.

Funding

The research is supported by the National Natural Science Foundation of China (NSFC) (Grant No. 41977230) and the Special Fund Key Project of Applied Science and Technology Research and Development in Guangdong (Grant No. 2015B090925016, No. 2016B010124007).

Data Availability Statement

Not applicable.

Conflicts of Interest

The authors declare no conflict of interest. The funders had no role in the design of the study; in the collection, analyses, or interpretation of data; in the writing of the manuscript, or in the decision to publish the results.

References

  1. Zhang, G.L.; Wang, P.G.; Zhao, M.; Du, X.L.; Zhao, X. Seismic structure-water-sediment-rock interaction model and its application to immersed tunnel analysis under obliquely incident earthquake. Tunn. Undergr. Space Technol. 2021, 109, 103758. [Google Scholar] [CrossRef]
  2. Li, Y.T.; Zhang, B.; Shi, L.; Ye, Y.W. Dynamic Variation Characteristics of Seawater Intrusion in Underground Water-Sealed Oil Storage Cavern under Island Tidal Environment. Water 2019, 11, 130. [Google Scholar] [CrossRef] [Green Version]
  3. Zangiabadi, B.; Gomari, S.R. Systematic Evaluation of Rock Mechanical Behavior of Chalk Reservoirs in the Presence of a Variety of Water Compositions. Int. J. Geomech. 2017, 17, 04017040. [Google Scholar] [CrossRef] [Green Version]
  4. Lawrence, J.A.; Mortimore, R.N.; Stone, K.J.; Busby, J.P. Sea saltwater weakening of chalk and the impact on cliff instability. Geomorphology 2013, 191, 14–22. [Google Scholar] [CrossRef] [Green Version]
  5. Zaid, M.; Sadique, M.R.; Samanta, M. Effect of unconfined compressive strength of rock on dynamic response of shallow unlined tunnel. SN Appl. Sci. 2020, 2, 2131. [Google Scholar] [CrossRef]
  6. Mishra, S.; Zaid, M.; Rao, K.S.; Gupta, N.K. FEA of Urban Rock Tunnels Under Impact Loading at Targeted Velocity. Geotech. Geol. Eng. 2022, 40, 1693–1711. [Google Scholar] [CrossRef]
  7. Zaid, M.; Mishra, S. Numerical Analysis of Shallow Tunnels Under Static Loading: A Finite Element Approach. Geotech. Geol. Eng. 2021, 39, 2581–2607. [Google Scholar] [CrossRef]
  8. Zaid, M.; Sadique, M.R.; Alam, M.M. Blast Resistant Analysis of Rock Tunnel Using Abaqus: Effect of Weathering. Geotech. Geol. Eng. 2022, 40, 809–832. [Google Scholar] [CrossRef]
  9. Sadique, M.R.; Zaid, M.; Alam, M.M. Rock Tunnel Performance Under Blast Loading Through Finite Element Analysis. Geotech. Geol. Eng. 2022, 40, 35–56. [Google Scholar] [CrossRef]
  10. Zaid, M.; Sadique, M.R. A Simple Approximate Simulation Using Coupled Eulerian–Lagrangian (CEL) Simulation in Investigating Effects of Internal Blast in Rock Tunnel. Indian Geotech. J. 2021, 51, 1038–1055. [Google Scholar] [CrossRef]
  11. Zaid, M.; Sadique, R. Numerical modelling of internal blast loading on a rock tunnel. Adv. Comput. Des. 2020, 5, 417–443. [Google Scholar]
  12. Zaid, M.; Shah, I.A. Numerical Analysis of Himalayan Rock Tunnels under Static and Blast Loading. Geotech. Geol. Eng. 2021, 39, 5063–5083. [Google Scholar] [CrossRef]
  13. Deng, H.F.; Zhou, M.L.; Li, J.L.; Sun, X.S.; Huang, Y.L. Creep degradation mechanism by water-rock interaction in the red-layer soft rock. Arab. J. Geosci. 2016, 9, 601. [Google Scholar] [CrossRef]
  14. Russell, T.; Pham, D.; Neishaboor, M.T.; Badalyan, A.; Behr, A.; Genolet, L.; Kowollik, P.; Zeinijahromi, A.; Bedrikovetsky, P. Effects of kaolinite in rocks on fines migration. J. Nat. Gas Sci. Eng. 2017, 45, 243–255. [Google Scholar] [CrossRef]
  15. Shi, P.X.; Zhang, D.L.; Pan, J.L.; Liu, W. Geological Investigation and Tunnel Excavation Aspects of the Weakness Zones of Xiang’an Subsea Tunnels in China. Rock Mech. Rock Eng. 2016, 49, 4853–4867. [Google Scholar] [CrossRef]
  16. Nilsen, B. Characteristics of Water Ingress in Norwegian Subsea Tunnels. Rock Mech. Rock Eng. 2014, 47, 933–945. [Google Scholar] [CrossRef]
  17. Liu, Z.; He, X.F.; Fan, J.; Zhou, C.Y. Study on the Softening Mechanism and Control of Red-Bed Soft Rock under Seawater Conditions. J. Mar. Sci. Eng. 2019, 7, 235. [Google Scholar] [CrossRef] [Green Version]
  18. Lu, Y.L.; Wang, L.G.; Sun, X.K.; Wang, J. Experimental study of the influence of water and temperature on the mechanical behavior of mudstone and sandstone. Bull. Eng. Geol. Environ. 2017, 76, 645–660. [Google Scholar] [CrossRef]
  19. Verstrynge, E.; Adriaens, R.; Elsen, J.; van Balen, K. Multi-scale analysis on the influence of moisture on the mechanical behavior of ferruginous sandstone. Constr. Build. Mater. 2014, 54, 78–90. [Google Scholar] [CrossRef]
  20. Tinnacher, R.M.; Holmboe, M.; Tournassat, C.; Bourg, I.C.; Davis, J.A. Ion adsorption and diffusion in smectite: Molecular, pore, and continuum scale views. Geochim. Cosmochim. Acta 2016, 177, 130–149. [Google Scholar] [CrossRef] [Green Version]
  21. Manaka, M.; Takeda, M. An experimental examination of the effect of the salt type on the chemo-osmotic, diffusive, and hydraulic parameters of Wakkanai mudstones. J. Hydrol. 2018, 564, 1058–1073. [Google Scholar] [CrossRef]
  22. Chai, Z.Y.; Kang, T.H.; Feng, G.R. Effect of aqueous solution chemistry on the swelling of clayey rock. Appl. Clay Sci. 2014, 93–94, 12–16. [Google Scholar] [CrossRef]
  23. Binal, A. Prediction of mechanical properties of non-welded and moderately welded ignimbrite using physical properties, ultrasonic pulse velocity, and point load index tests. Q. J. Eng. Geol. Hydrogeol. 2009, 42, 107–122. [Google Scholar] [CrossRef]
  24. Wang, L.; Bornert, M.; Héripré, E.; Chanchole, S.; Pouya, A.; Halphen, B. Microscale insight into the influence of humidity on the mechanical behavior of mudstones. J. Geophys. Res. Solid Earth 2015, 120, 3173–3186. [Google Scholar] [CrossRef]
  25. Tertre, E.; Savoye, S.; Hubert, F.; Pret, D.; Dabat, T.; Ferrage, E. Diffusion of Water through the Dual-Porosity Swelling Clay Mineral Vermiculite. Environ. Sci. Technol. 2018, 52, 1899–1907. [Google Scholar] [CrossRef]
  26. Simonyan, A.V.; Dultz, S.; Behrens, H. Diffusive transport of water in porous fresh to altered mid-ocean ridge basalts. Chem. Geol. 2012, 306, 63–77. [Google Scholar] [CrossRef]
  27. Yagiz, S. P-wave velocity test for assessment of geotechnical properties of some rock materials. Bull. Mater. Sci. 2011, 34, 947–953. [Google Scholar] [CrossRef]
  28. Fabricius, I.L.; Gommesen, L.; Krogsboll, A.; Olsen, D. Chalk porosity and sonic velocity versus burial depth: Influence of fluid pressure, hydrocarbons, and mineralogy. AAPG Bull. 2008, 92, 201–223. [Google Scholar] [CrossRef]
  29. Gonzalez, J.; Saldana, M.; Arzua, J. Analytical Model for Predicting the UCS from P-Wave Velocity, Density, and Porosity on Saturated Limestone. Appl. Sci. 2019, 9, 5265. [Google Scholar] [CrossRef] [Green Version]
  30. Pavicic, I.; Brisevac, Z.; Vrbaski, A.; Grgasovic, T.; Duic, Z.; Sijak, D.; Dragicevic, I. Geometric and Fractal Characterization of Pore Systems in the Upper Triassic Dolomites Based on Image Processing Techniques (Example from Zumberak Mts, NW Croatia). Sustainability 2021, 13, 7668. [Google Scholar] [CrossRef]
  31. Briševac, Z.; Kujundžić, T. Models to estimate the Brazilian indirect tensile strength of limestone in saturated state. Min.-Geol.-Pet. Eng. Bull. 2016, 31, 59–67. [Google Scholar] [CrossRef]
  32. Brisevac, Z.; Kujundzic, T.; Macenic, M. Estimation of Uniaxial Compressive and Tensile Strength of Rock Material from Gypsum Deposits in the Knin Area. Teh. Vjesn. 2017, 24, 855–861. [Google Scholar] [CrossRef] [Green Version]
  33. Feng, D.; Wu, K.; Wang, X.; Li, J.; Shi, J.; Zhang, Y.; Qi, P.; Li, X. Analytical investigations the effect of temperature and pressure on spontaneous countercurrent imbibition in unsaturated porous media. Energ Fuel 2019, 33, 8544–8556. [Google Scholar] [CrossRef]
  34. Erguler, Z.A.; Ulusay, R. Water-induced variations in mechanical properties of clay-bearing rocks. Int. J. Rock Mech. Min. Sci. 2009, 46, 355–370. [Google Scholar] [CrossRef]
  35. Rahromostaqim, M.; Sahimi, M. Molecular Dynamics Simulation of Hydration and Swelling of Mixed-Layer Clays. J. Phys. Chem. C 2018, 122, 14631–14639. [Google Scholar] [CrossRef]
  36. Rahromostaqim, M.; Sahimi, M. Molecular Dynamics Simulation of Hydration and Swelling of Mixed Layer Clays in the Presence of Carbon Dioxide. J. Phys. Chem. C 2019, 123, 4243–4255. [Google Scholar] [CrossRef]
  37. Feng, D.; Li, X.F.; Wang, X.Z.; Li, J.; Sun, F.R.; Sun, Z.; Zhang, T.; Li, P.H.; Chen, Y.; Zhang, X. Water adsorption and its impact on the pore structure characteristics of shale clay. Appl. Clay Sci. 2018, 155, 126–138. [Google Scholar] [CrossRef]
  38. Millero, F.J.; Feistel, R.; Wright, D.G.; McDougall, T.J. The composition of Standard Seawater and the definition of the Reference-Composition Salinity Scale. Deep Sea Res. Part I 2008, 55, 50–72. [Google Scholar] [CrossRef]
  39. Wei, G.J.; Wang, Z.B.; Ke, T.; Liu, Y.; Deng, W.F.; Chen, X.F.; Xu, J.F.; Zeng, T.; Xie, L.H. Decadal variability in seawater pH in the West Pacific: Evidence from coral delta B-11 records. J. Geophys. Res. Oceans 2015, 120, 7166–7181. [Google Scholar] [CrossRef] [Green Version]
  40. Zhang, W.N.; Hu, H.X.; Li, X.C.; Fang, Z.M. Interplay of Montmorillonite-H2O-scCO(2) System between Mechanical Behavior and Adsorption: Molecular Dynamics. J. Phys. Chem. C 2015, 119, 21959–21968. [Google Scholar] [CrossRef]
  41. Zhao, L.; Ward, C.R.; French, D.; Graham, I.T.; Dai, S.F.; Yang, C.; Xie, P.P.; Zhang, S.Y. Origin of a kaolinite-NH4-illite-pyrophyllite-chlorite assemblage in a marine-influenced anthracite and associated strata from the Jincheng Coalfield, Qinshui Basin, Northern China. Int. J. Coal Geol. 2018, 185, 61–78. [Google Scholar] [CrossRef]
  42. Cui, G.; Zhou, C.; Liu, Z.; Xia, C.; Zhang, L. The synthesis of soft rocks based on physical and mechanical properties of red mudstone. Int. J. Rock Mech. Min. Sci. 2022, 151, 105037. [Google Scholar] [CrossRef]
  43. Deng, L.N.; Feng, B.; Zhang, Y. An optimization method for multi-objective and multi-factor designing of a ceramic slurry: Combining orthogonal experimental design with artificial neural networks. Ceram. Int. 2018, 44, 15918–15923. [Google Scholar] [CrossRef]
  44. Bal, H.; Jannot, Y.; Quenette, N.; Chenu, A.; Gaye, S. Water content dependence of the porosity, density and thermal capacity of laterite based bricks with millet waste additive. Constr. Build. Mater. 2012, 31, 144–150. [Google Scholar] [CrossRef]
  45. Bataee, M.; Irawan, S. Porosity and Permeability Alteration around Wellbore during Injection Process. Int. J. Géoméch. 2018, 18, 04017145. [Google Scholar] [CrossRef]
  46. He, M.; Sun, X.; Zhao, J. Advances in interaction mechanism of water (gas) on clay minerals in China. Int. J. Min. Sci. Technol. 2014, 24, 727–735. [Google Scholar] [CrossRef]
  47. Wong, L.N.Y.; Maruvanchery, V.; Liu, G. Water effects on rock strength and stiffness degradation. Acta Geotech. 2016, 11, 713–737. [Google Scholar] [CrossRef]
  48. Zhang, Q.; Jia, W.; Fan, X.; Liang, Y.; Yang, Y. A review of the shale wellbore stability mechanism based on mechanical–chemical coupling theories. Petroleum 2015, 1, 91–96. [Google Scholar] [CrossRef] [Green Version]
  49. Zhang, J.P.; Liu, L.M.; Zhang, F.T.; Cao, J.Z. Development and application of new composite grouting material for sealing groundwater inflow and reinforcing wall rock in deep mine. Sci. Rep. 2018, 8, 5642. [Google Scholar] [CrossRef]
  50. Roy, D.G.; Singh, T.N.; Kodikara, J.; Das, R. Effect of Water Saturation on the Fracture and Mechanical Properties of Sedimentary Rocks. Rock Mech. Rock Eng. 2017, 50, 2585–2600. [Google Scholar] [CrossRef]
  51. Gao, J.; Yu, Q.C. Effect of Water Saturation on Pressure-Dependent Permeability of Carboniferous Shale of the Qaidam Basin, China. Transp. Porous Media 2018, 123, 147–172. [Google Scholar] [CrossRef]
  52. Zhu, Z.; Dou, J.; Wang, H. An entropic model for the rock water absorption process. Stoch. Environ. Res. Risk Assess. 2020, 34, 1871–1886. [Google Scholar] [CrossRef]
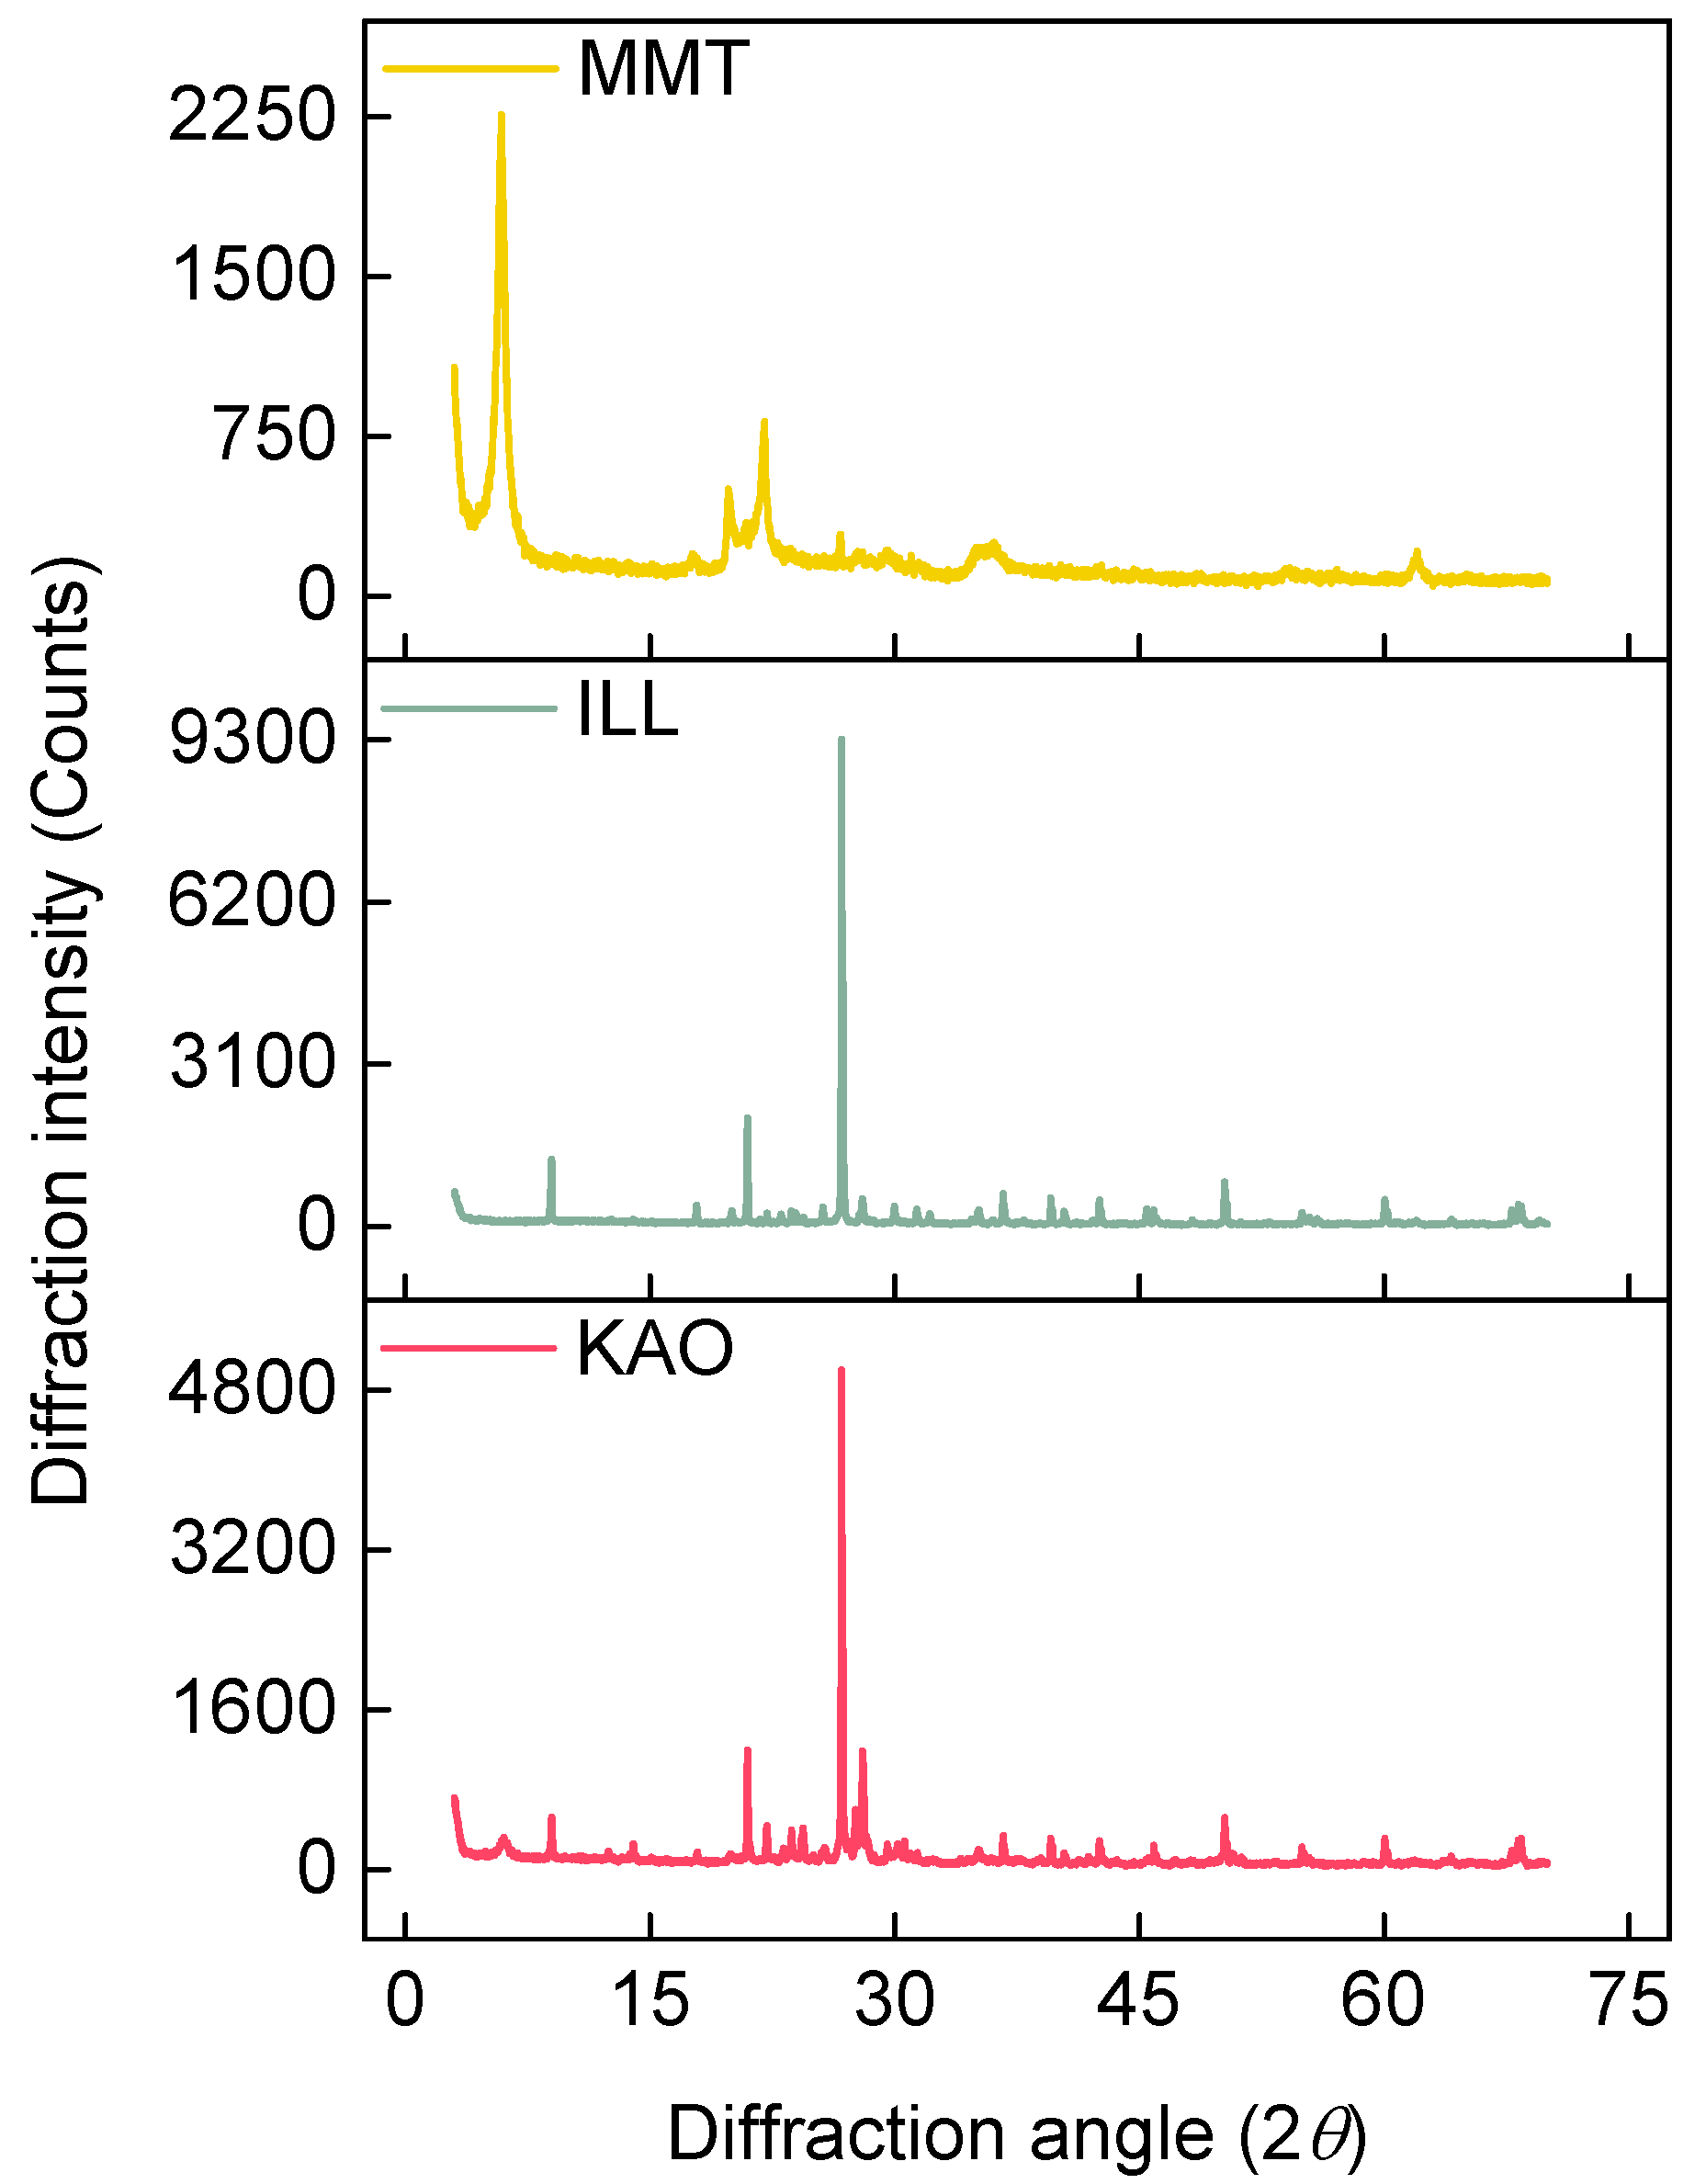
Figure 1. The X-ray diffraction topographies of the clay minerals.
Applsci 12 05938 g001
Figure 2. Test processes: (a) Cylindrical mold under hydraulic uniaxial compression; (b) Packaged sample to be tested; (c) High-precision electronic scale; (d) Water absorption process of samples; (e) Saturated sample at the end of the tests.
Applsci 12 05938 g002
Figure 3. Relationships between P-wave velocity ( V p ) and porosity ( n ) with vertical stress (VSs).
Applsci 12 05938 g003
Figure 4. Changes in water content w with time t .
Applsci 12 05938 g004
Figure 5. Changes in water absorption velocity v with time t .
Applsci 12 05938 g005
Figure 6. Water content w with time t as affected by: (a) clay mineral type (CMT) and clay mineral content (CMT), (b) vertical stress (VSs), (c) cation type (CTs) and anion type (ATs) and (d) concentration (CCs) and pH value (pH).
Applsci 12 05938 g006
Figure 7. Water absorption velocity v with time t as affected by: (a) clay mineral type (CMT) and clay mineral content (CMT), (b) vertical stress (VSs), (c) cation type (CTs) and anion type (ATs) and (d) concentration (CCs) and pH value (pH).
Applsci 12 05938 g007
Figure 8. Influence of different levels on the water absorption process of rocks. The numbers above the columns are the sum of the normalized calculation results of the four response indicators.
Applsci 12 05938 g008
Figure 9. Degree of influence of seven factors on the four parameters.
Applsci 12 05938 g009
Figure 10. Comparison between the soft rock water absorption prediction model and natural rock water absorption process. (a) Natural hard rock; (b) Natural soft rock.
Applsci 12 05938 g010aApplsci 12 05938 g010b
Table 1. Experimental design.
Exp.CMTCMC (wt%)VSs (MPa)CTsATsCCs (mol/L)pH
1MMT305Na+Cl0.14
2MMT5010Ca2+SO42−1.07
3MMT7015K+CO32−SAT10
4ILL305Ca2+SO42−SAT10
5ILL5010K+CO32−0.14
6ILL7015Na+Cl1.07
7KAO3010Na+CO32−1.010
8KAO5015Ca2+ClSAT4
9KAO705K+SO42−0.17
10MMT3015K+SO42−1.04
11MMT505Na+CO32−SAT7
12MMT7010Ca2+Cl0.110
13ILL3010K+ClSAT7
14ILL5015Na+SO42−0.110
15ILL705Ca2+CO32−1.04
16KAO3015Ca2+CO32−0.17
17KAO505K+Cl1.010
18KAO7010Na+SO42−SAT4
Note: Exp.—experiment number; CMT—clay mineral types; CMC—clay mineral contents; VSs—vertical stresses; CTs—cation types; ATs—anion types; CCs—concentrations of water solutions; MMT—montmorillonite; ILL—illite; KAO—kaolinite; SAT—saturated state of concentrations.
Table 2. Fitting results of water content and water absorption velocity changes with time for different factors at different levels.
FactorLevelEquation (3)Equation (4)
t1t2A1A2w0 R a d j 2   ab R a d j 2  
CMTMMT101338−10−818.00.9900.12−0.900.969
ILL6229−14−517.90.9850.93−1.500.945
KAO7152−14−518.40.9950.94−1.480.964
CMC30%10252−13−618.10.9910.80−1.400.909
50%8556−10−717.20.9870.35−1.060.959
70%51237−14−618.70.9850.46−1.100.959
VSs5 MPa5352−12−819.30.9900.66−1.220.965
10 MPa101584−14−416.90.9940.48−1.150.944
15 MPa6316−11−717.30.9840.42−1.090.960
CTsNa+6408−14−518.40.9910.70−1.290.939
Ca2+10378−9−716.50.9870.28−1.020.952
K+71379−15−418.60.9920.58−1.190.953
ATsCl5286−12−718.20.9900.56−1.170.980
SO42−4336−12−516.60.9850.57−1.220.969
CO32−151534−14−619.10.9970.43−1.070.954
CCs0.1 mol/L7248−12−516.20.9860.57−1.220.966
1 mol/L7277−14−317.10.9920.67−1.290.974
SAT7526−11−919.50.9890.34−1.000.955
pH410199−13−618.70.9960.81−1.340.970
75823−14−517.30.9750.40−1.120.941
109744−10−717.50.9900.33−1.030.957
Table 3. Range value of the seven factors and degree of influence on the water absorption process of rocks. The larger the range value of the factor, the higher the priority of a factor’s degree of influence. PDI refers to the priority of degree of influence.
Factort1t2w0b
RPDIRPDIRPDIRPDI
CMT45118630.570.601
CMC5298551.550.342
VSs52126812.040.137
CTs45100142.130.275
ATs111124822.520.156
CCs0727873.310.294
pH5254561.460.313
Publisher’s Note: MDPI stays neutral with regard to jurisdictional claims in published maps and institutional affiliations.