Article

Analysis and Ranking of IT Risk Factors Using Fuzzy TOPSIS-Based Approach

by
Haya Mesfer Alshahrani
1,
Saud S. Alotaibi
2,
Md Tarique Jamal Ansari
3,*,
Mashael M. Asiri
4,
Alka Agrawal
3,
Raees Ahmad Khan
3,
Heba Mohsen
5 and
Anwer Mustafa Hilal
6
1
Department of Information Systems, College of Computer and Information Sciences, Princess Nourah bint Abdulrahman University, P.O. Box 84428, Riyadh 11671, Saudi Arabia
2
Department of Information Systems, College of Computing and Information System, Umm Al-Qura University, Mecca 24382, Saudi Arabia
3
Department of Information Technology, Babasaheb Bhimrao Ambedkar University, Lucknow 226025, Uttar Pradesh, India
4
Department of Computer Science, College of Science & Art at Mahayil, King Khalid University, Abha 62529, Saudi Arabia
5
Department of Computer Science, Faculty of Computers and Information Technology, Future University in Egypt, New Cairo 11835, Egypt
6
Department of Computer and Self Development, Preparatory Year Deanship, Prince Sattam bin Abdulaziz University, AlKharj 16278, Saudi Arabia
*
Author to whom correspondence should be addressed.
Appl. Sci. 2022, 12(12), 5911; https://doi.org/10.3390/app12125911
Submission received: 11 May 2022 / Revised: 31 May 2022 / Accepted: 6 June 2022 / Published: 10 June 2022

Abstract

:
In today’s age of information and communication technology (ICT), many companies are using advanced digital technologies as well as the application of information technology to grow the company and effectively manage their processes. The risk management of information technology plays a crucial role in protecting the important information and data assets of an enterprise. The key objective of risk management in information technology is to safeguard the digital infrastructure from ICT-related harm. An efficient as well as cost effective risk managing mechanism is an integral aspect of an extensive safety system for information technology. A successful approach to IT risk management would strive to protect the company and its infrastructure, not just its digital assets, to conduct their process. Subsequently, the risk managing mechanism must not be viewed solely for instance as a procedural task performed by the IT specialists who run and administer the IT program but as the organization’s critical management task. The risks of information technology assets are of a dynamic nature; different strategies tackle the management of information security risk. This research paper is intended to review and discuss information technology risk managing procedures. We also carried out a multi-criteria decision-making (MCDM)-based empirical investigation to analyses and prioritized different IT risk factors. This has recognized that there are many reports on the techniques, and that various approaches to risk management exist.

1. Introduction

In today’s world of rapid virus incidents, malicious attacks, as well as security breaches, it is appropriate to emphasize the significance of security requirements [1,2,3,4]. One of the primary considerations that must be addressed when developing dependable and high-quality software products is software security. In recent times, we have seen several organizations become overly reliant on information innovations and advancements in order to receive more immediate assistance [5,6,7,8,9,10]. The guidelines, techniques, and practices of information systems risk management are responsible for developing the background, recognizing, investigating, evaluating, discussing, examining, as well as communicating threat. As a consequence, a particular information technology threat analysis strategy must deliver two major benefits. The first benefit is that real-world security standards are followed, and serious assets of the business organization are effectively protected. The second benefit is that it provides valuable investigation facts for future evaluations by improving trustworthy information management [11,12,13,14,15]. However, in the actual world, many organizations lack appropriate information on cybersecurity incidents due to insufficient information or undisclosed incidences. The primary reason for this is a lack of appropriate information security approaches as well as IT risk management strategy due to financial constraints. As a result, the majority of available perspectives anticipate estimating the possibility of a recognized weakness of security gap based majorly on presumption or harsh assessment [16]. Furthermore, available strategies use horizontal information with a deterministic time frame to recognize different kinds of threats that evolves over time [17]. As per a published research study, security breaches caused through new types of worms, malware, adware, as well as Trojan horses are on the rise; for example, the Conficker worm caused a large public sector organization to experience severe damage [18]. Furthermore, misleading information would therefore result in erroneous decision making on information security measures, wasting time as well as effort by decision makers attempting to control the mistake. As a result of the aforementioned constraints, we are inspired to suggest an effective information security risk evaluation method based on the survival analytical approach. Essentially, the survival analysis method yields more evolving or reliable readings while taking into account censored data as well as time space. Whereas, this strategy may be utilized to recognize which aspects have an important consequence on the incident as well as predict the likelihood of endurance based on the impact of those aspects. The risk analysis process, as shown in Figure 1, involves an evaluation of IT resources, risks to those resources, as well as security flaws to such resources [17].
Risk management process is a technique that facilitates IT administrators to manage the technical and financial costs of safeguarding procedures while delivering the products in operation functionality advancements through maintaining the IT applications and networks that endorse the organizations’ assignments. Because this technique is not unique to IT surroundings, it encompasses choice making in several aspects of everyday lives. As an instance, we may consider home security. Several people organize to have surveillance equipment installed and pay service charge to a service supplier to have such systems supervised for increased property security. Apparently, the shareholders have evaluated the cost of method installing as well as maintaining in contradiction of the significance of the residential goods as well as the security of their everyday, a basic “mission” requirement. There is little integration of optimal protecting data and reasonable price for every organization. The goal of risk controlling is to find the balance [16,17,18]. Basically put, risk managing tries to prevent or minimize damage in an organization. The term “loss” refers to the damage, rejection of entree to, or loss of homes. The strategy to risk management of information systems associated with specific points such as risk analysis, risk reduction metrics, risk monitoring, and risk recognition. The IT risk control is depicted in Figure 2.
The research results of a larger-scale risk management approach on information technology resources within organizations are discussed in this paper. (i) Using fuzzy set theory, it intends to recognize and then assess IT risk factors, as well as (ii) analyze the relative IT risk level within an organization, provided a set of risk variables. The first goal is important because it allows policymakers as well as shareholders to recognize the most important risk factors to consider when attracting business investment in the IT sector. The categorization of initiatives as well as the selection of mitigation techniques to complement those risks would be informed by understanding the increased risk areas. The second goal is to gain a thorough insight of the major risk factors and their importance in determining the final risk level of IT. Private individuals involved would then be able to eliminate risky investments if they are aware of the program’s risk level, and governments would be prompted to implement risk indicators in order to encourage investors to participate.
This work is divided into five segments. The second segment outlines the method of conducting a literature review. The third segment goes over the findings and comparisons. The fourth segment discusses the findings and risk management plan for information technology in a company or organization. The paper comes to an end with the fifth segment.

2. Literature Review

A literature review (LR) is a way of conducting bibliographic studies that evaluates and examines the research that is useful for a particular subject or topic of significance in credible sources of scientific knowledge [14]. In comparison to a conservative review of the literature, an LR-conducted survey is a strict and well-structured classification of procedures and techniques, ensuring the results’ greater scientific merit. By completing the instructions outlined in the procedure, any research scientist involved in the issue can conduct frequent reviews. There are three major activity blocks:
  • Preparing the review;
  • Conducting the review;
  • Documenting the review.
The perseverance and the potential of the work are evident when planning a review of the literature. The report’s dedication is clearly recognized over the survey questions, which are associated to the SLR’s specific purpose. Once trying to conduct the SLR, a thorough examination of selected existing literature is carried out with the goal of addressing the research queries. Literatures trying to deal with review methodology overall, as well as the strategic planning of non-technical and grey cybersecurity threats, were not analyzed (exclusion criteria). The research evidence was discovered using the databases Science Direct, Google Scholar, SCOPUS, ProQuest, IEEE Xplore Digital Library, ACM Digital Library, and EBSCO.
Bahli and Rivard [19] performed research to validate the risks associated with exporting IT procedures. As per the financial intermediation notion, three major factors that have contributed to possible causes in IT businesses that outsource are the contract, the consumer, and the supplier. Depending on these insights, preparatory metrics of IT exporting potential risks were established, and data from a survey of 132 IT practitioners were evaluated employing the partial least squares method to assess their reliability and validity. Their research confirmed that certain factors can be used to assess the risks of IT exporting jobs.
Sherer and Alter [20] proposed a framework for organizing the large numbers of risk factors found in the IS threat literary works. They demonstrated that many of the most common and highly cited risk variables for IS in procedure as well as IS projects are also major risk factor for task processes in particular. Over 50 percent of the risks caused in a sample group of the IS risk literary works are applicable to work processes in common parlance. Their outcome represents a step toward beneficial risk diagnostic equipment based on an organized set of risk variables relevant to business executives as well as IT specialists.
Rodrguez et al. [21] established a novel risk assessment approach that relies on a hybrid of the fuzzy analytic hierarchy process (FAHP) as well as the fuzzy inference system (FIS). The risk factor teams are integrated using FIS. Such risk factors were also the assessment criteria of a revised FAHP, which reduced the drawbacks of the traditional FAHP deployment to obtain a more instinctive and flexible model for multiple criteria assessment with a reduced processing requirement. Their proposed model considered the various ambiguity, the interdependence of risk factor teams, and the potential of adding or removing possibilities without losing continuity with earlier assessments.
Samadi et al. [22] introduced corresponding risks identified through a literature review in order to incorporate risk analysis in ITO. Following their review of several architectures in the literature connected to the prioritization of extracted risk variables, a novel framework was introduced to ascertain their priority. Due to the general suggested framework’s underlying network as well as the multi-dimensional character of the project threat, fuzzy ANP was used to prioritize potential risks. Furthermore, because identifying and prioritizing risk factors does not always encounter the requirements of the organization in terms of project risk, the methods to react to such variables were also assessed.
Abdelrafe et al. [23] recognized software risks as well as checks in the application development process. The focus of their research was to prioritize software risk variables based on the priority and occurrence depending on the data origin. The questionnaire was developed to gather data, and a technique of sample selection known as snowball and allocation individual frequent sampling was utilized. Their research also included 76 software project supervisors who collaborate in Palestinian application development. Participants were shown fifty software risk variables across all Stages, as well as thirty risk management methods. According to their findings, all risks in application projects were also substantial and crucial from the viewpoint of a software project supervisor.
Paré et al. [24] discussed such a challenge by first reviewing existing literature on information technology service risks, as well as undertaking a Delphi survey between 21 specialists participating in medical information system initiatives in Québec, Canada, an area in which the government has recently invested strongly in health information systems. There were 23 risk factors recognized. The utter lack of a project leader was deemed by participants to be the most important component.
Khidzir et al. [25] identified information security risk factors, which included threats as well as vulnerabilities, and they also discussed their importance in Malaysian information communication technology outsourcing projects. For the research, questionnaires have been circulated to numerous private corporations and government authorities. According to their study’s observations, the most dangerous threats are system errors as well as ICT failures, and the most serious weakness is a lack of consideration to human element in system layout and integration.
Al Kattan et al. [26] investigated the significant risk aspects in two critical companies: information technology project (ITP) management as well as construction project (CP) management. The questionnaires and personal interviews of fifty IT project leaders and construction management were also used to evaluate the primary risk control variables. According to their findings, the most important factors across both information technology as well as construction management projects were “Competent Staff” as well as “Clear Statement of Requirements”. Moreover, a direct indication of project resource requirements would also decrease the number of project modifications as well as, for the time being, qualified personnel that would then enable project implementation. According to the information technology questionnaire, there was a constant concern about an insufficiency of IT expenditure.
Schmitz and Pape [27] presented LiSRA, which is a domain-specific compact approach for supporting information security-based decision making. It is built with two inputs in which those specialists first delivered domain-specific data (for example, attack situations for a particular domain), after which users can concentrate on clarifying their security practices as well as organizational attributes by entering data that many institutions have already gathered.
Bruma [28] discussed the process of assessing information security risks and the significance of understanding the risks involved. They also proposed an approach to determine data security risk significance of the data to the organization, which offered a snapshot of security flaws and their real implications on assets. Moreover, the suggested framework assists organizations in selecting the appropriate methods for ensuring the highest level of security, in accordance with operational needs and critical data.
According to the review of the literature, over the last several years, a range of methods and systems have been established to promote robust and efficient IT risk assessment. Unlike others, to analyze and prioritize the various IT risk factors, we conducted an empirical research based on fuzzy TOPSIS-based multi-criteria decision-making (MCDM) approach. This has recognized that there are multiple reports on the methods, as well as different risk management strategies.

3. Methods and Results

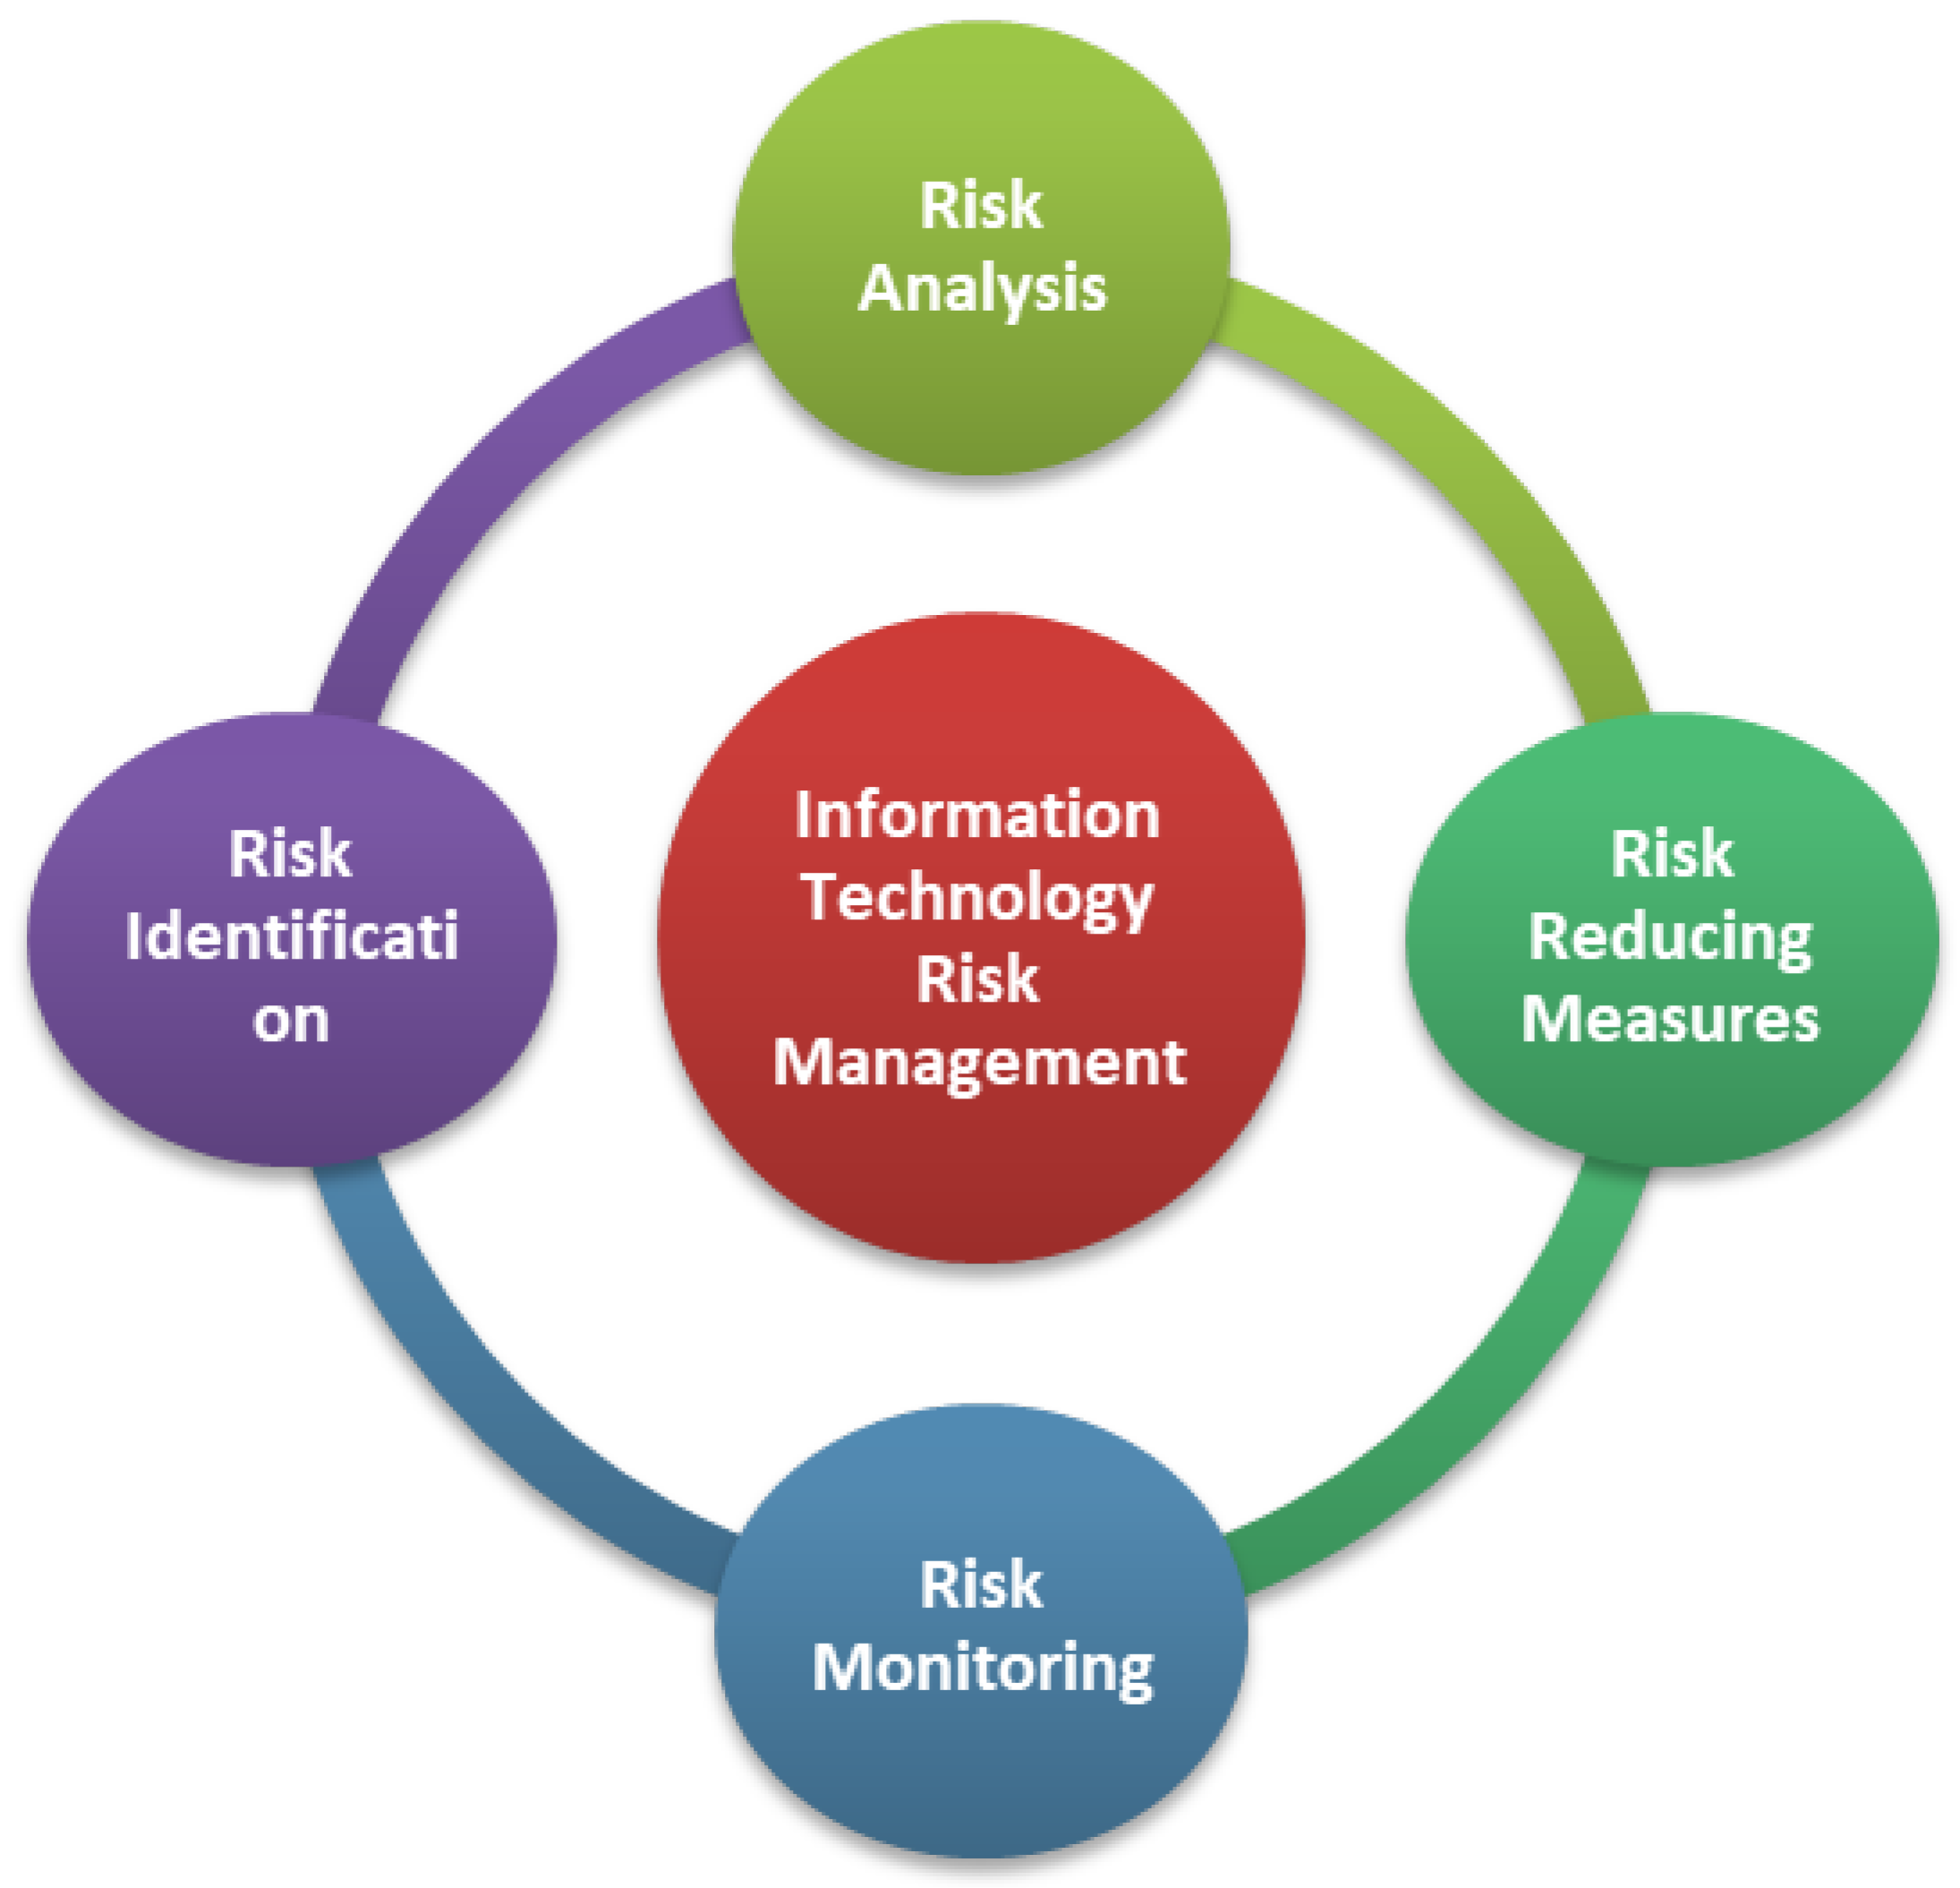
3.1. Hierarchy for the Evaluation

Risk implications evaluation is the method of evaluating the likelihood and consequences of possible risks if they are actually realized. In this research, a fuzzy multi-criteria decision-making method is presented for the analysis and ranking of IT risk factors in an organizational environment from 25 decision makers. There are many criteria in this issue, which has a hierarchical arrangement of criteria as well as numerous risk factors as alternatives. The findings of this study are then utilized to prioritize risk measures in order among most critical to least crucial significance. Scoring risks based on their criticality or significance informs project planning about where resources could be required to handle or mitigate the occurrence of possible risks of strongly likely consequences. Based on the literature review and expert’s suggestion, we have identified eight IT risk factors, i.e., Technology, Financial, People, Vendors, Operational, Policy and Procedures, Environmental, and Strategic, which are denoted by A1, A2, A3, A4, A5, A6, A7, and A8, respectively. To prioritize these IT risk factors we have also recognized some criteria, such as Effectiveness, Event frequency, Availability, Consequence, Adequacy, and Discoverability, that are denoted by C1, C2, C3, C4, C5, and C6, respectively.
The following Figure 3 shows the graphical representation of the hierarchical structure used for the evaluation of IT risk factors using fuzzy TOPSIS-based approach.

3.2. Fuzzy TOPSIS Method

The fuzzy TOPSIS tactic is an approach that was developed from the TOPSIS core principle to address a wide range of MCDM challenges in an uncertain setting. Chen and Hwang established the fuzzy TOPSIS procedure in 1992 by applying fuzzy values to the TOPSIS procedure [27]. Chen introduced a vertex process to calculate the distance among two TFNs in 2000 [28]. TFNs would then portray the decision makers’ perspectives on characteristics as well as alternatives in this strategy. The alternatives would then be ranked depending on the distance closest to ideal solutions, and the ranking consequence would be used to make the selection. The fuzzy TOPSIS process works on the same principles as the TOPSIS method, and yet in a more ambiguous setting. There are numerous benefits to using the fuzzy TOPSIS approach for solving MCDM challenges. To begin, the fuzzy TOPSIS procedure was introduced to resolve the ambiguity that frequently emerges in information derived from human decision. Let X1 = (x1, x2, x3) and Y1 = (y1, y2, y3) be two triangular fuzzy numbers (TFNs); therefore, the following Equation (1) could be used to calculate the distance between the two TFNs.
d v X 1 , Y ˜ 1 = 1 3 x 1 y 1 2 + x 2 y 2 2 + x 3 y 3 2  
Furthermore, we have discovered numerous uncertain circumstances that have been predicted using TFNs to produce an improved result when solving MCDM major issues. Moreover, the fuzzy TOPSIS strategy is simple and straightforward for tackling MCDM challenges with imprecise information. According to a review of relevant literature [29,30,31,32,33], this process could be used as a separate strategy to solving MCDM challenges such as assessing various websites as well as examining the variables that assist to enhance the comparative benefit of those targeted online platforms. 
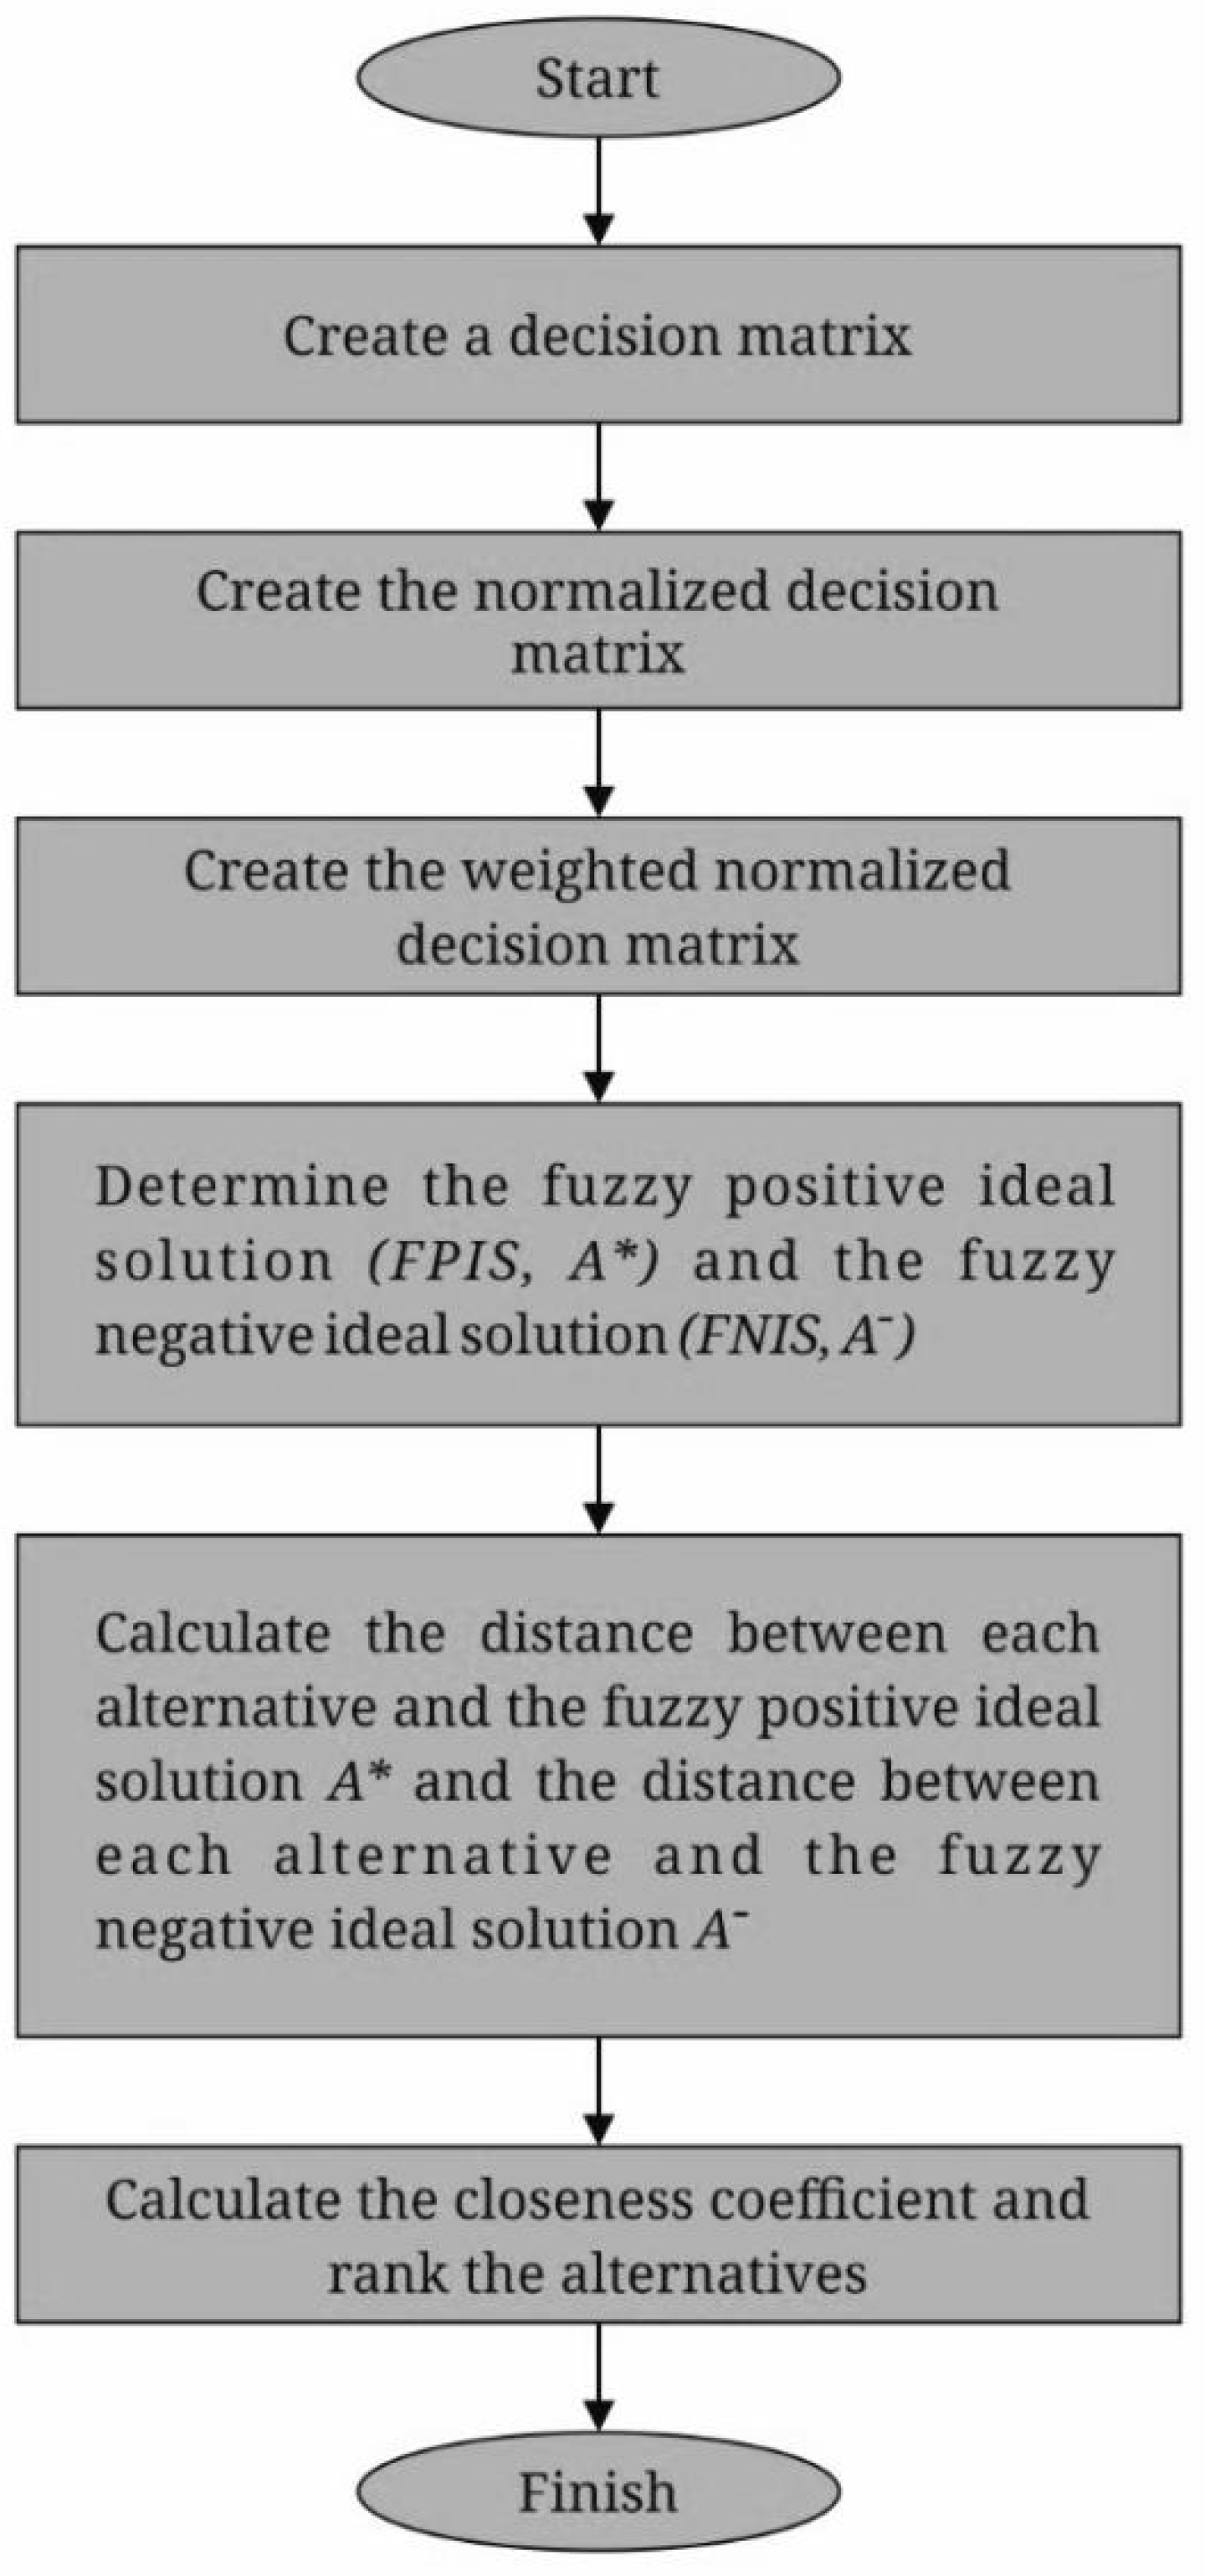
Figure 4 shows the sequential steps of the fuzzy TOPSIS method.
(1)
Step 1: Create a decision matrix.
In this research, six criteria and eight alternatives are consistently rated using the Fuzzy TOPSIS procedure. In classic multiple-criteria decision-making (MCDM) processes, the weights of characteristics illustrate correlative significance in the decision-making process. We cannot assume that each and every evaluation criterion is equally important because evaluating criteria includes a variety of perspectives and interpretations [29]. Subjective and objective strategies to weighing are the two types of weighing methods. Weight values are primarily generated using subjective strategies predicated on decision makers’ choices or decisions. A decision matrix is a set of values in columns and rows that is used to clearly compare different solutions through weighing parameters according to their importance. Table 1 below summarizes the criterion form as well as weight allocated to every set of criteria. The type represents the category of different criteria. The researchers used the standard fuzzy scale (that can be seen in Table 2) as well as Equations (1)–(10) to collect and analyze the data. The strategies are evaluated using a variety of criteria, and the results of the decision matrix are demonstrated in the following table. The arithmetic mean of all 25 decision makers’ opinions is provided in Table 3’s preference matrix.
The letters L, M, or U are used to demonstrate a triangular fuzzy number (TFN). The indicators L, M, as well as U, respectively, represent the least preferred, most preferred, and highest preferred significance. The fuzzy scale used in the model is shown in Table 2.
The alternatives are assessed in aspects of different criteria, as well as the decision matrix consequences demonstrated below in Table 3. It should be noted that if more than one expert participates in the estimation, the matrix below actually reflects the arithmetic average of all specialists.
(2)
Step 2: Make a normalized decision matrix.
A normalized decision matrix could be computed using the following relevance predicated on the positive as well as negative ideal options:
r ˜ i j = a i j c j * , b i j c j * , c i j c j *           ;           c j * = m a x i   c i j ;   Positive ideal solution
r ˜ i j = a j c i j , a j b i j , a j a i j           ;           a j = m i n i   a i j ;   Negative ideal solution
The normalized decision matrix is presented in the following Table 4.
(3)
Step 3: Make a weighted normalized decision matrix.
The weighted normalized decision matrix could be computed by multiplying the criteria weights in the normalized fuzzy decision problem by the following equations, taking into account the distinct weights of every criterion.
v ˜ i j = r ˜ i j · w ˜ i j
where w ˜ i j signifies weight of criterion c j .
The weighted normalized decision matrix can be seen in Table 5 below.
(4)
Step 4: Control the fuzzy positive ideal solution (FPIS, A*) as well as the fuzzy negative ideal solution ( F N I S , A ). The FPIS and the FNIS of the alternatives can be defined as follows:
A * = v ˜ 1 * , v ˜ 2 * , , v ˜ n * = max j   v i j | i B , min j   v i j | i C  
A = v ˜ 1 , v ˜ 2 , , v ˜ n = min j   v i j | i B , max j   v i j | i C  
The alternative solutions’ FPIS and FNIS could be demarcated as presented below: Where v ˜ i *   is the highest amount of i for all the alternatives, and v ˜ 1 is the lowest amount of i for all the alternatives options. B and C signify the positive as well as negative ideal solutions, correspondingly.
The positive as well as negative ideal solutions are presented in the following Table 6.
(5)
Step 5: Determine the difference in range among each alternative and the fuzzy positive ideal alternative solution A * , and the range among every alternative and the fuzzy negative ideal solution A .
The range among every alternative and FPIS as well as among every alternative and FNIS is calculated by using the following:
S i * = j = 1 n d ( v ˜ i j , v ˜ j * )   i = 1 ,   2 , ,   m
S i = j = 1 n d ( v ˜ i j , v ˜ j )   = 1 ,   2 , ,   m
d is the range among two fuzzy figures, when assumed two triangular fuzzy numbers ( a 1 , b 1 , c 1 ) and ( a 2 , b 2 , c 2 ), e distance among the two can be estimated as follows:
d v M ˜ 1 , M ˜ 2 = 1 3 a 1 a 2 2 + b 1 b 2 2 + c 1 c 2 2
Note that d v ˜ i j , v ˜ j * and d v ˜ i j , v ˜ j are crisp numbers.
The range from positive as well as negative ideal solutions is shown in the following Table 7.
(6)
Step 6: Determine the closeness coefficient as well as rating the options.
Every alternative’s closeness coefficient can be determined as described in the following:
C C i = S i S i + + S i
The best option is nearest to the FPIS as well as farthest away from the FNIS. The following Table 8 shows the closeness coefficient and the priority order of every alternative solution.
The graph below depicts the closeness coefficient of every alternative solution.
According to the research results in Table 8 and Figure 5, one of most significant IT risk factors is alternative A1, which really is Technology, followed by Strategic, Financial, Policy and Procedures, Environmental, Operational, Vendors, and People.

4. Discussion

Many organizations find it difficult to assess information technology risk, which seems to be the largest source of information systems risk. Furthermore, current IT risk measurements are primarily focused on functional instead of strategic security risk factors. A plethora of information generated from cybersecurity technology solutions could make risk evaluations more difficult. It is essential to determine risks to one’s IT systems as well as data, to decrease or manage the risk, and to create a reaction strategy in place of an IT disaster [34,35,36]. IT risk control strategies are influenced by legal responsibilities relating to privacy, digital transactions, and employee training. Physical and logical failures, human error, phishing, viruses, and targeted activities, as well as natural calamities such as fires, hurricanes, and floods, are all examples of IT risks. A company risk analysis can be used to handle IT risks. A planning process can assist one’s company in recovering from an IT outage.
Due to the presence of associated risks, several IT companies are currently experiencing daunting challenges and issues of forming healthy collaborations as part of their strategic plan. These dangers must be identified and adequately controlled if an efficient strategic approach is to be established. As a result, risk evaluation makes it appear to be a critical component of the venture’s progress. A hierarchical IT risk layout depiction was investigated in order to establish a conceptual framework for empirical risk evaluation in this article. The basic factors for characterizing risks as well as criteria for measuring probability and consequence have been introduced to assist in sustained evaluation. Having to convert linguistic information into mathematical risk levels has been intended using an optimized decision method based on fuzzy set theory. Decisions are made in a setting that contains three elements: certainty, uncertainty, and risk. Whilst also certainty could be assumed of a scenario where all of the variables leading to a potential situation could be precisely indicated and recognized by a decision maker, a lack of certainty is the polar contrary, producing an uncertain scenario extremely difficult to define in terms of its likelihood of occurring.
The findings in this research show that Technology is the most significant risk factor within an organization, followed by other risk factors such as Strategic, Financial, Policy and Procedures, Environmental, Operational, Vendors, and People. IT security, particularly network security, must not be treated lightly; therefore, it is important to remember that threats are not limited to exterior cyber-attacks. In reality, more subtle but iterative risks can cause massive problems in businesses despite the fact that they can be prevented. The risk evaluation highlighted here can assist in persuading management to participate in security procedures. When used appropriately, this system would give management an understanding of the significance of their IT resources, as well as the threats they face and the likelihood that such threats would be successful in endangering the assets. This risk evaluation will also provide administration with a solid foundation for making logical and dependable risk management program investments.

5. Conclusions

This study demonstrates the various strategies accessible for information systems risk assessment, but there is very little research aimed at improving the efficiency, effectiveness, and competence of the control system, which opens up possible directions for impending studies. According to the findings of this study, technology seems to be the strongest risk factor within an organization. The proclivity for IT to perform poorly or fall short of expectations necessitates the requirement to mitigate risk as an indispensable aspect of IT risk assessment. There has been little research. There seems to be little indication for the presence of a collaborative strategy to MRIS that takes into account both the layout of the RIS data system as well as the assessment of RIS. The European endeavor CORAS is conducting research that addresses this requirement. IT management teams should methodically recognize the significance of their IT investments, IT dangers at various levels, as well as the vulnerabilities of IT assets to such significant risks. This complete comprehension of the full influence of IT consequences on the complete commercial organization and its environment would provide governance with a foundation for significant and useful supposition in the IT risk assessment procedure. Future research would then concentrate on combining different fuzzy methods and techniques evolved into a framework of tools which can move information and decision making from one tactic to the other to efficiently sustain IT risk management decision-making at different stages.

Author Contributions

Conceptualization, H.M.A., S.S.A., M.T.J.A., M.M.A. and R.A.K.; methodology, M.T.J.A., M.M.A. and A.A.; software, M.T.J.A., M.M.A., A.A. and R.A.K.; validation, M.T.J.A., M.M.A., A.A., R.A.K., H.M. and A.M.H.; formal analysis, A.A., R.A.K., H.M. and A.M.H.; investigation, H.M.A., S.S.A., M.T.J.A., M.M.A. and R.A.K.; resources, A.A., R.A.K., H.M. and A.M.H.; data curation, M.T.J.A., M.M.A., A.A., R.A.K. and H.M.; writing—original draft preparation, H.M.A., M.T.J.A. and H.M.; writing—review and editing, M.M.A., A.A., R.A.K., H.M. and A.M.H.; visualization, H.M.A., M.T.J.A. and H.M.; supervision, M.T.J.A., M.M.A. and R.A.K.; project administration, H.M.A., M.T.J.A., M.M.A. and R.A.K.; funding acquisition, H.M.A., S.S.A., M.M.A., H.M. and A.M.H. All authors have read and agreed to the published version of the manuscript.

Funding

The authors extend their appreciation to the Deanship of Scientific Research at King Khalid University for funding this work through Large Groups Project under grant number (45/43). Princess Nourah bint Abdulrahman University Researchers Supporting Project number (PNURSP2022R237), Princess Nourah bint Abdulrahman University, Riyadh, Saudi Arabia. Deanship of Scientific Research at Umm Al-Qura University by Grant Code: (22UQU4210118DSR16).

Institutional Review Board Statement

Not applicable.

Informed Consent Statement

Not applicable.

Data Availability Statement

Not applicable.

Acknowledgments

The authors extend their appreciation to the Deanship of Scientific Research at King Khalid University for funding this work through Large Groups Project under grant number (45/43). Princess Nourah bint Abdulrahman University Researchers Supporting Project number (PNURSP2022R237), Princess Nourah bint Abdulrahman University, Riyadh, Saudi Arabia. Deanship of Scientific Research at Umm Al-Qura University by Grant Code: (22UQU4210118DSR16).

Conflicts of Interest

The authors declare no conflict of interest.

References

  1. Firesmith, D. Common Requirements Problems, Their Negative Consequences, and the Industry Best Practices to Help Solve Them. J. Object Technol. 2007, 6, 17–33. [Google Scholar] [CrossRef]
  2. Alassery, F.; Alzahrani, A.; Khan, A.I.; Khan, A.; Nadeem, M.; Ansari, M.T.J. Quantitative Evaluation of Mental-Health in Type-2 Diabetes Patients through Computational Model. Intell. Autom. Soft Comput. 2022, 32, 1701–1715. [Google Scholar] [CrossRef]
  3. Oh, S.R.; Kim, Y.G. Security requirements analysis for the IoT. In Proceedings of the 2017 International Conference on Platform Technology and Service (PlatCon), Busan, Korea, 13–15 February 2017; IEEE: Piscataway, NJ, USA, 2017; pp. 1–6. [Google Scholar]
  4. Ansari, M.T.J.; Pandey, D.; Alenezi, M. STORE: Security Threat Oriented Requirements Engineering Methodology. J. King Saud Univ.-Comput. Inf. Sci. 2018, 34, 191–203. [Google Scholar] [CrossRef]
  5. Stoneburner, G.; Hayden, C.; Feringa, A. Engineering Principles for Information Technology Security (A Baseline for Achieving Security); Booz-Allen and Hamilton Inc.: Mclean, VA, USA, 2001. [Google Scholar]
  6. Syalim, A.; Hori, Y.; Sakurai, K. Comparison of risk analysis methods: Mehari, Magerit, NIST800-30 and microsoft’s security management guide. In Proceedings of the 2009 International Conference on Availability, Reliability and Security, Fukuoka, Japan, 16–19 March 2009; IEEE: Piscataway, NJ, USA, 2009; pp. 726–731. [Google Scholar]
  7. Mihailescu, V.L. Risk analysis and risk management using MEHARI. J. Appl. Bus. Inf. Syst. 2012, 3, 143–162. [Google Scholar]
  8. Fenz, S.; Ekelhart, A.; Neubauer, T. Information security risk management: In which security solutions is it worth investing? Commun. Assoc. Inf. Syst. 2011, 28, 22. [Google Scholar] [CrossRef]
  9. Thuraisingham, B.; Masud, M.M.; Parveen, P.; Khan, L. Big Data Analytics with Applications in Insider Threat Detection; Auerbach Publications: New York, NY, USA, 2017. [Google Scholar]
  10. Samy, G.N.; Ahmad, R.; Ismail, Z. Threats to health information security. In Proceedings of the 2009 Fifth International Conference on Information Assurance and Security, Xi’an, China, 18–20 August 2009; IEEE: Piscataway, NJ, USA, 2009; Volume 2, pp. 540–543. [Google Scholar]
  11. Barafort, B.; Humbert, J.P.; Poggi, S. Information Security Management and ISO/IEC 15504: The link opportunity between Security and Quality. In Proceedings of the SPICE Conference, Luxembourg, 3–5 May 2006; Volume 140. [Google Scholar]
  12. Stoneburner, G.; Goguen, A.; Feringa, A. Risk management guide for information technology systems. NIST Spec. Publ. 2002, 800, 800–830. [Google Scholar]
  13. Ahmad, R.; Samy, G.N.; Ibrahim, N.K.; Bath, P.A.; Ismail, Z. Threats identification in healthcare information systems using genetic algorithm and cox regression. In Proceedings of the 2009 Fifth International Conference on Information Assurance and Security, Xi’an, China, 18–20 August 2009; IEEE: Piscataway, NJ, USA, 2009; Volume 2, pp. 757–760. [Google Scholar]
  14. Yazar, Z. A qualitative risk analysis and management tool—CRAMM. SANS InfoSec Read. Room White Pap. 2002, 11, 12–32. [Google Scholar]
  15. Faris, S.; Ghazouani, M.; Medromi, H.; Sayouti, A. Information security risk Assessment—A practical approach with a mathematical formulation of risk. Int. J. Comput. Appl. 2014, 103, 36–42. [Google Scholar]
  16. Spears, J.L.; Barki, H. User participation in information systems security risk management. MIS Q. 2010, 503–522. [Google Scholar] [CrossRef] [Green Version]
  17. Rainer, R.K., Jr.; Snyder, C.A.; Carr, H.H. Risk analysis for information technology. J. Manag. Inf. Syst. 1991, 8, 129–147. [Google Scholar] [CrossRef]
  18. Potter, C.; Beard, A. Information Security Breaches Survey 2010; Price Water House Coopers: London, UK, 2010. [Google Scholar]
  19. Bahli, B.; Rivard, S. Validating measures of information technology outsourcing risk factors. Omega 2005, 33, 175–187. [Google Scholar] [CrossRef]
  20. Sherer, S.A.; Alter, S. Information systems risks and risk factors: Are they mostly about information systems? Commun. Assoc. Inf. Syst. 2004, 14, 2. [Google Scholar] [CrossRef]
  21. Rodríguez, A.; Ortega, F.; Concepción, R. A method for the evaluation of risk in IT projects. Expert Syst. Appl. 2016, 45, 273–285. [Google Scholar] [CrossRef]
  22. Samadi, H.; Nazari-Shirkouhi, S.; Keramati, A. Identifying and analyzing risks and responses for risk management in information technology outsourcing projects under fuzzy environment. Int. J. Inf. Technol. Decis. Mak. 2014, 13, 1283–1323. [Google Scholar] [CrossRef]
  23. Abdelrafe, E.; Hussin, B.; Salleh, N. Top fifty software risk factors and the best thirty risk management techniques in software development lifecycle for successful software projects. Int. J. Hybrid Inf. Technol. 2016, 9, 11–32. [Google Scholar]
  24. Paré, G.; Sicotte, C.; Jaana, M.; Girouard, D. Prioritizing the risk factors influencing the success of clinical information system projects. Methods Inf. Med. 2008, 47, 251–259. [Google Scholar]
  25. Khidzir, N.Z.; Mohamed, A.; Arshad, N.H. Information security risk factors: Critical threats vulnerabilities in ICT outsourcing. In Proceedings of the 2010 International Conference on Information Retrieval & Knowledge Management (CAMP), Shah Alam, Selangor, Malaysia, 17–18 March 2010; IEEE: Piscataway, NJ, USA, 2010; pp. 194–199. [Google Scholar]
  26. Al Kattan, I.; Al Haddad, M.; Al Ali, Y. Analysis of risk management factors of information technology versus construction projects. Int. J. Arts Sci. 2011, 4, 41. [Google Scholar]
  27. Schmitz, C.; Pape, S. LiSRA: Lightweight security risk assessment for decision support in information security. Comput. Secur. 2020, 90, 101656. [Google Scholar] [CrossRef]
  28. Bruma, L.M. An Approach for Information Security Risk Assessment in Cloud Environments. Inform. Econ. 2020, 24, 29–40. [Google Scholar] [CrossRef]
  29. Ansari, M.T.J.; Al-Zahrani, F.A.; Pandey, D.; Agrawal, A. A fuzzy TOPSIS based analysis toward selection of effective security requirements engineering approach for trustworthy healthcare software development. BMC Med. Inform. Decis. Mak. 2020, 20, 236. [Google Scholar] [CrossRef]
  30. Alhakami, W.; Binmahfoudh, A.; Baz, A.; Alhakami, H.; Ansari MT, J.; Khan, R.A. Atrocious impinging of COVID-19 pandemic on software development industries. Comput. Syst. Sci. Eng. 2021, 8, 23–338. [Google Scholar] [CrossRef]
  31. Ansari, M.T.J.; Agrawal, A.; Khan, R.A. DURASec: Durable Security Blueprints for Web-Applications Empowering Digital India Initiative; EAI Endorsed Transactions on Scalable Information Systems: Ghent, Belgium, 2022. [Google Scholar]
  32. Bilgili, F.; Zarali, F.; Ilgün, M.F.; Dumrul, C.; Dumrul, Y. The evaluation of renewable energy alternatives for sustainable development in Turkey using intuitionistic fuzzy-TOPSIS method. Renew. Energy 2022, 189, 1443–1458. [Google Scholar] [CrossRef]
  33. Alharbi, A.; Ansari, M.T.J.; Alosaimi, W.; Alyami, H.; Alshammari, M.; Agrawal, A.; Khan, R.A. An Empirical Investigation to Understand the Issues of Distributed Software Testing amid COVID-19 Pandemic. Processes 2022, 10, 838. [Google Scholar] [CrossRef]
  34. Smith, S.S. Emerging Technologies and Implications for Financial Cybersecurity. Int. J. Econ. Financ. Issues 2020, 10, 27. [Google Scholar] [CrossRef]
  35. Daim, T.; Lai, K.K.; Yalcin, H.; Alsoubie, F.; Kumar, V. Forecasting technological positioning through technology knowledge redundancy: Patent citation analysis of IoT, cybersecurity, and Blockchain. Technol. Forecast. Soc. Chang. 2020, 161, 120329. [Google Scholar] [CrossRef]
  36. Alyami, H.; Ansari MT, J.; Alharbi, A.; Alosaimi, W.; Alshammari, M.; Pandey, D.; Khan, R.A. Effectiveness Evaluation of Different IDSs Using Integrated Fuzzy MCDM Model. Electronics 2022, 11, 859. [Google Scholar] [CrossRef]
Figure 1. The Risk Management Life Cycle.
Applsci 12 05911 g001
Figure 2. IT Risk Controls.
Applsci 12 05911 g002
Figure 3. Hierarchical structure for the evaluation.
Applsci 12 05911 g003
Figure 4. Steps of the fuzzy TOPSIS method.
Applsci 12 05911 g004
Figure 5. Closeness coefficient graph.
Applsci 12 05911 g005
Table 1. Properties of different criteria.
NameTypeWeight
1C1+(0.167,0.167,0.167)
2C2+(0.167,0.167,0.167)
3C3+(0.167,0.167,0.167)
4C4+(0.167,0.167,0.167)
5C5+(0.167,0.167,0.167)
6C6+(0.167,0.167,0.167)
Table 2. Fuzzy Scale.
CodeLinguistic TermsLMU
1Very low113
2Low135
3Medium357
4High579
5Very high799
Table 3. Decision Matrix.
C1C2C3C4C5C6
A15.640,7.640,8.7605.240,7.240,8.6804.680,6.680,8.3604.920,6.920,8.5204.920,6.920,8.4404.760,6.760,8.360
A25.080,7.080,8.5204.840,6.840,8.6805.080,7.080,8.4404.920,6.920,8.4404.680,6.680,8.5205.080,7.080,8.440
A35.240,7.240,8.8404.920,6.920,8.6804.600,6.600,8.0404.440,6.440,8.2804.120,6.120,7.8004.520,6.520,8.200
A44.680,6.680,8.2805.000,7.000,8.6005.080,7.080,8.6004.840,6.840,8.4404.680,6.680,8.2004.280,6.280,8.200
A54.760,6.760,8.3605.080,7.080,8.5205.480,7.480,8.7605.000,7.000,8.4404.280,6.280,8.1204.680,6.680,8.280
A64.680,6.680,8.3605.240,7.240,8.6805.080,7.080,8.6004.920,6.920,8.4404.840,6.840,8.4404.840,6.840,8.600
A75.160,7.160,8.5205.560,7.560,8.8404.920,6.920,8.3605.240,7.240,8.7604.440,6.440,8.0404.360,6.360,8.120
A84.680,6.680,8.2004.840,6.840,8.6005.080,7.080,8.5205.080,7.080,8.6805.320,7.320,8.6004.760,6.760,8.440
Table 4. A normalized decision matrix.
C1C2C3C4C5C6
A10.638,0.864,0.9910.593,0.819,0.9820.534,0.763,0.9540.562,0.790,0.9730.572,0.805,0.9810.553,0.786,0.972
A20.575,0.801,0.9640.548,0.774,0.9820.580,0.808,0.9630.562,0.790,0.9630.544,0.777,0.9910.591,0.823,0.981
A30.593,0.819,1.0000.557,0.783,0.9820.525,0.753,0.9180.507,0.735,0.9450.479,0.712,0.9070.526,0.758,0.953
A40.529,0.756,0.9370.566,0.792,0.9730.580,0.808,0.9820.553,0.781,0.9630.544,0.777,0.9530.498,0.730,0.953
A50.538,0.765,0.9460.575,0.801,0.9640.626,0.854,1.0000.571,0.799,0.9630.498,0.730,0.9440.544,0.777,0.963
A60.529,0.756,0.9460.593,0.819,0.9820.580,0.808,0.9820.562,0.790,0.9630.563,0.795,0.9810.563,0.795,1.000
A70.584,0.810,0.9640.629,0.855,1.0000.562,0.790,0.9540.598,0.826,1.0000.516,0.749,0.9350.507,0.740,0.944
A80.529,0.756,0.9280.548,0.774,0.9730.580,0.808,0.9730.580,0.808,0.9910.619,0.851,1.0000.553,0.786,0.981
Table 5. The weighted normalized decision matrix.
C1C2C3C4C5C6
A10.107,0.144,0.1650.099,0.137,0.1640.089,0.127,0.1590.094,0.132,0.1620.096,0.134,0.1640.092,0.131,0.162
A20.096,0.134,0.1610.091,0.129,0.1640.097,0.135,0.1610.094,0.132,0.1610.091,0.130,0.1650.099,0.137,0.164
A30.099,0.137,0.1670.093,0.131,0.1640.088,0.126,0.1530.085,0.123,0.1580.080,0.119,0.1510.088,0.127,0.159
A40.088,0.126,0.1560.094,0.132,0.1620.097,0.135,0.1640.092,0.130,0.1610.091,0.130,0.1590.083,0.122,0.159
A50.090,0.128,0.1580.096,0.134,0.1610.104,0.143,0.1670.095,0.133,0.1610.083,0.122,0.1580.091,0.130,0.161
A60.088,0.126,0.1580.099,0.137,0.1640.097,0.135,0.1640.094,0.132,0.1610.094,0.133,0.1640.094,0.133,0.167
A70.097,0.135,0.1610.105,0.143,0.1670.094,0.132,0.1590.100,0.138,0.1670.086,0.125,0.1560.085,0.124,0.158
A80.088,0.126,0.1550.091,0.129,0.1620.097,0.135,0.1620.097,0.135,0.1650.103,0.142,0.1670.092,0.131,0.164
Table 6. The positive and negative ideal solutions.
Positive IdealNegative Ideal
C1(0.107,0.144,0.167)(0.088,0.126,0.155)
C2(0.105,0.143,0.167)(0.091,0.129,0.161)
C3(0.104,0.143,0.167)(0.088,0.126,0.153)
C4(0.100,0.138,0.167)(0.085,0.123,0.158)
C5(0.103,0.142,0.167)(0.080,0.119,0.151)
C6(0.099,0.137,0.167)(0.083,0.122,0.158)
Table 7. Distance from positive and negative ideal solutions.
Distance from Positive IdealDistance from Negative Ideal
A10.0370.057
A20.0460.05
A30.0770.017
A40.0630.03
A50.0520.042
A60.0450.049
A70.0460.046
A80.0430.05
Table 8. Closeness coefficient.
CiRank
A10.6031
A20.5243
A30.1838
A40.3257
A50.4426
A60.5224
A70.5035
A80.5422
Publisher’s Note: MDPI stays neutral with regard to jurisdictional claims in published maps and institutional affiliations.

