Article

Research on the Prediction Model of Blasting Vibration Velocity in the Dahuangshan Mine

1
School of Resources and Safety Engineering, Central South University, Changsha 410083, China
2
Hongda Blasting Engineering Group Co., Ltd., Guangzhou 510623, China
*
Author to whom correspondence should be addressed.
Appl. Sci. 2022, 12(12), 5849; https://doi.org/10.3390/app12125849
Submission received: 10 May 2022 / Revised: 6 June 2022 / Accepted: 6 June 2022 / Published: 8 June 2022
(This article belongs to the Section Earth Sciences)

Abstract

:
In order to improve the prediction accuracy of blast vibration velocity, the model for predicting the peak particle velocity of blast vibration using the XGBoost (Extreme Gradient Boosting) method is improved, and the EWT–XGBoost model is established to predict the peak particle velocity of blast vibration by combining it with the EWT (Empirical Wavelet Transform) method. Calculate the relative error and root mean square error between the predicted value and measured value of each test sample, and compare the prediction performance of the EWT–XGBoost model with the original model. There is a large elevation difference between each vibration measurement location of high and steep slopes, but high and steep slopes are extremely dangerous, which is not conducive to the layout of blasting vibration monitoring equipment. The vibration velocity prediction model adopts the numerical simulation method, selects the center position of the small platform as the measurement point of the peak particle velocity, and studies the variation law of the blasting vibration velocity of the high and steep slopes under the action of top blasting. The research results show that the EWT–XGBoost model has a higher accuracy than the original model in the prediction of blasting vibration velocity; the simultaneous detonation method on adjacent high and steep slopes cannot meet the relevant requirements of safety regulations, and the delayed detonation method can effectively reduce the blasting vibration of high and steep slopes. The shock absorption effect of the elevation difference within 45 m is obvious.

1. Introduction

Blasting plays a key role in open-pit mining [1], especially in construction stone mines, which account for a large share of open-pit mining. Although blasting is widely used for rock crushing in open pit mines, the impact of blasting vibration cannot be ignored [2]. Sometimes, it is even necessary to use mechanical crushing to eliminate the negative impact of blasting vibration, so the prediction of blasting vibration velocity is particularly critical. The blasting vibration velocity prediction mainly refers to predicting the PPV (peak particle velocity). Blasting workers in open-pit mines often use blasting vibration monitoring results to optimize blasting parameters. In this way, blasting workers can reduce the impact of structures below the steep slope by controlling the PPV.
In engineering blasting, people pay more and more attention to avoid serious accidents through conducting blasting vibration prediction in advance, which can help reduce damage to structures and improve personnel safety [3,4,5]. Many scholars have conducted extensive and in-depth research on blasting vibration prediction, and their research methods include empirical formulas, machine learning, and numerical simulations.
The ground vibration level is described by empirical formulas mainly considering rock characteristics, distance, maximum single-shot charge, and other blasting conditions [6,7,8]. The improved formula of the traditional Sadovskii formula is well applied. Lin et al. [9] used the dimensionless analysis method to improve the nonlinear regression prediction model of the blasting vibration propagation law. After the improvement, the model can reflect the elevation effect. According to the measured data, the prediction accuracy of the improved model is improved by 13.55% compared with that of the original model.
Machine learning methods have been introduced into the field of blasting vibration prediction, and many scholars have conducted in-depth research on it. Yue et al. [10] established a least squares support vector machine model to predict the blasting vibration effect of open pit mines and optimized the regularization parameters and kernel function width coefficients through a particle swarm optimization algorithm, so that the model has a higher generalization ability and prediction accuracy. Sun et al. [11] considered eight factors, including blast center distance, elevation difference, propagation medium conditions, maximum single-stage charge, total charge, differential time, detonation direction, and the shock absorption effect of the excavated chamber, and established the PSO–LSSVM model to predict the blasting vibration of underground gas storage caverns. YAN et al. [12] used the GEO–ELM model to predict the PPV and frequency of the ground vibration when, caused by blasting demolition, the building collapses. The model has a higher prediction accuracy after combining it with the gray wolf algorithm. The random forest algorithm is widely used in the blasting vibration problem, and the improved method for its algorithm has been proven to have a higher accuracy [13,14].
The low cost of the numerical simulation method can provide a certain reference for blasting vibration safety evaluation and the optimization of blasting parameters. Lak et al. [15] compared Green′s function solution, the experimental results, and the numerical simulations for the PPV results of rock blasting, and the results show that the three are highly consistent. Aiming at the problem of the demolition of adjacent buildings by bench blasting construction, Lei et al. [16] took a bench blasting project as the background and studied the blasting vibration propagation law with a maximum single-shot charge of 3.8 kg and a blast hole diameter of 38 mm under the combined action of horizontal distance and elevation.
The blasting vibration velocity is affected by many aspects in the open-pit mine [17,18,19], which affects the accuracy of the blasting vibration velocity prediction. Compared with the machine learning method, the empirical formula has great disadvantages considering the number of factors and the consumption of resources and time. In this paper, the improved machine learning algorithm XGBoost and the finite element numerical simulation method are used to establish the blasting vibration velocity prediction model of the Dahuangshan tuff rock mine. This paper focuses on the prediction of blasting vibration velocity.

2. Materials and Methods

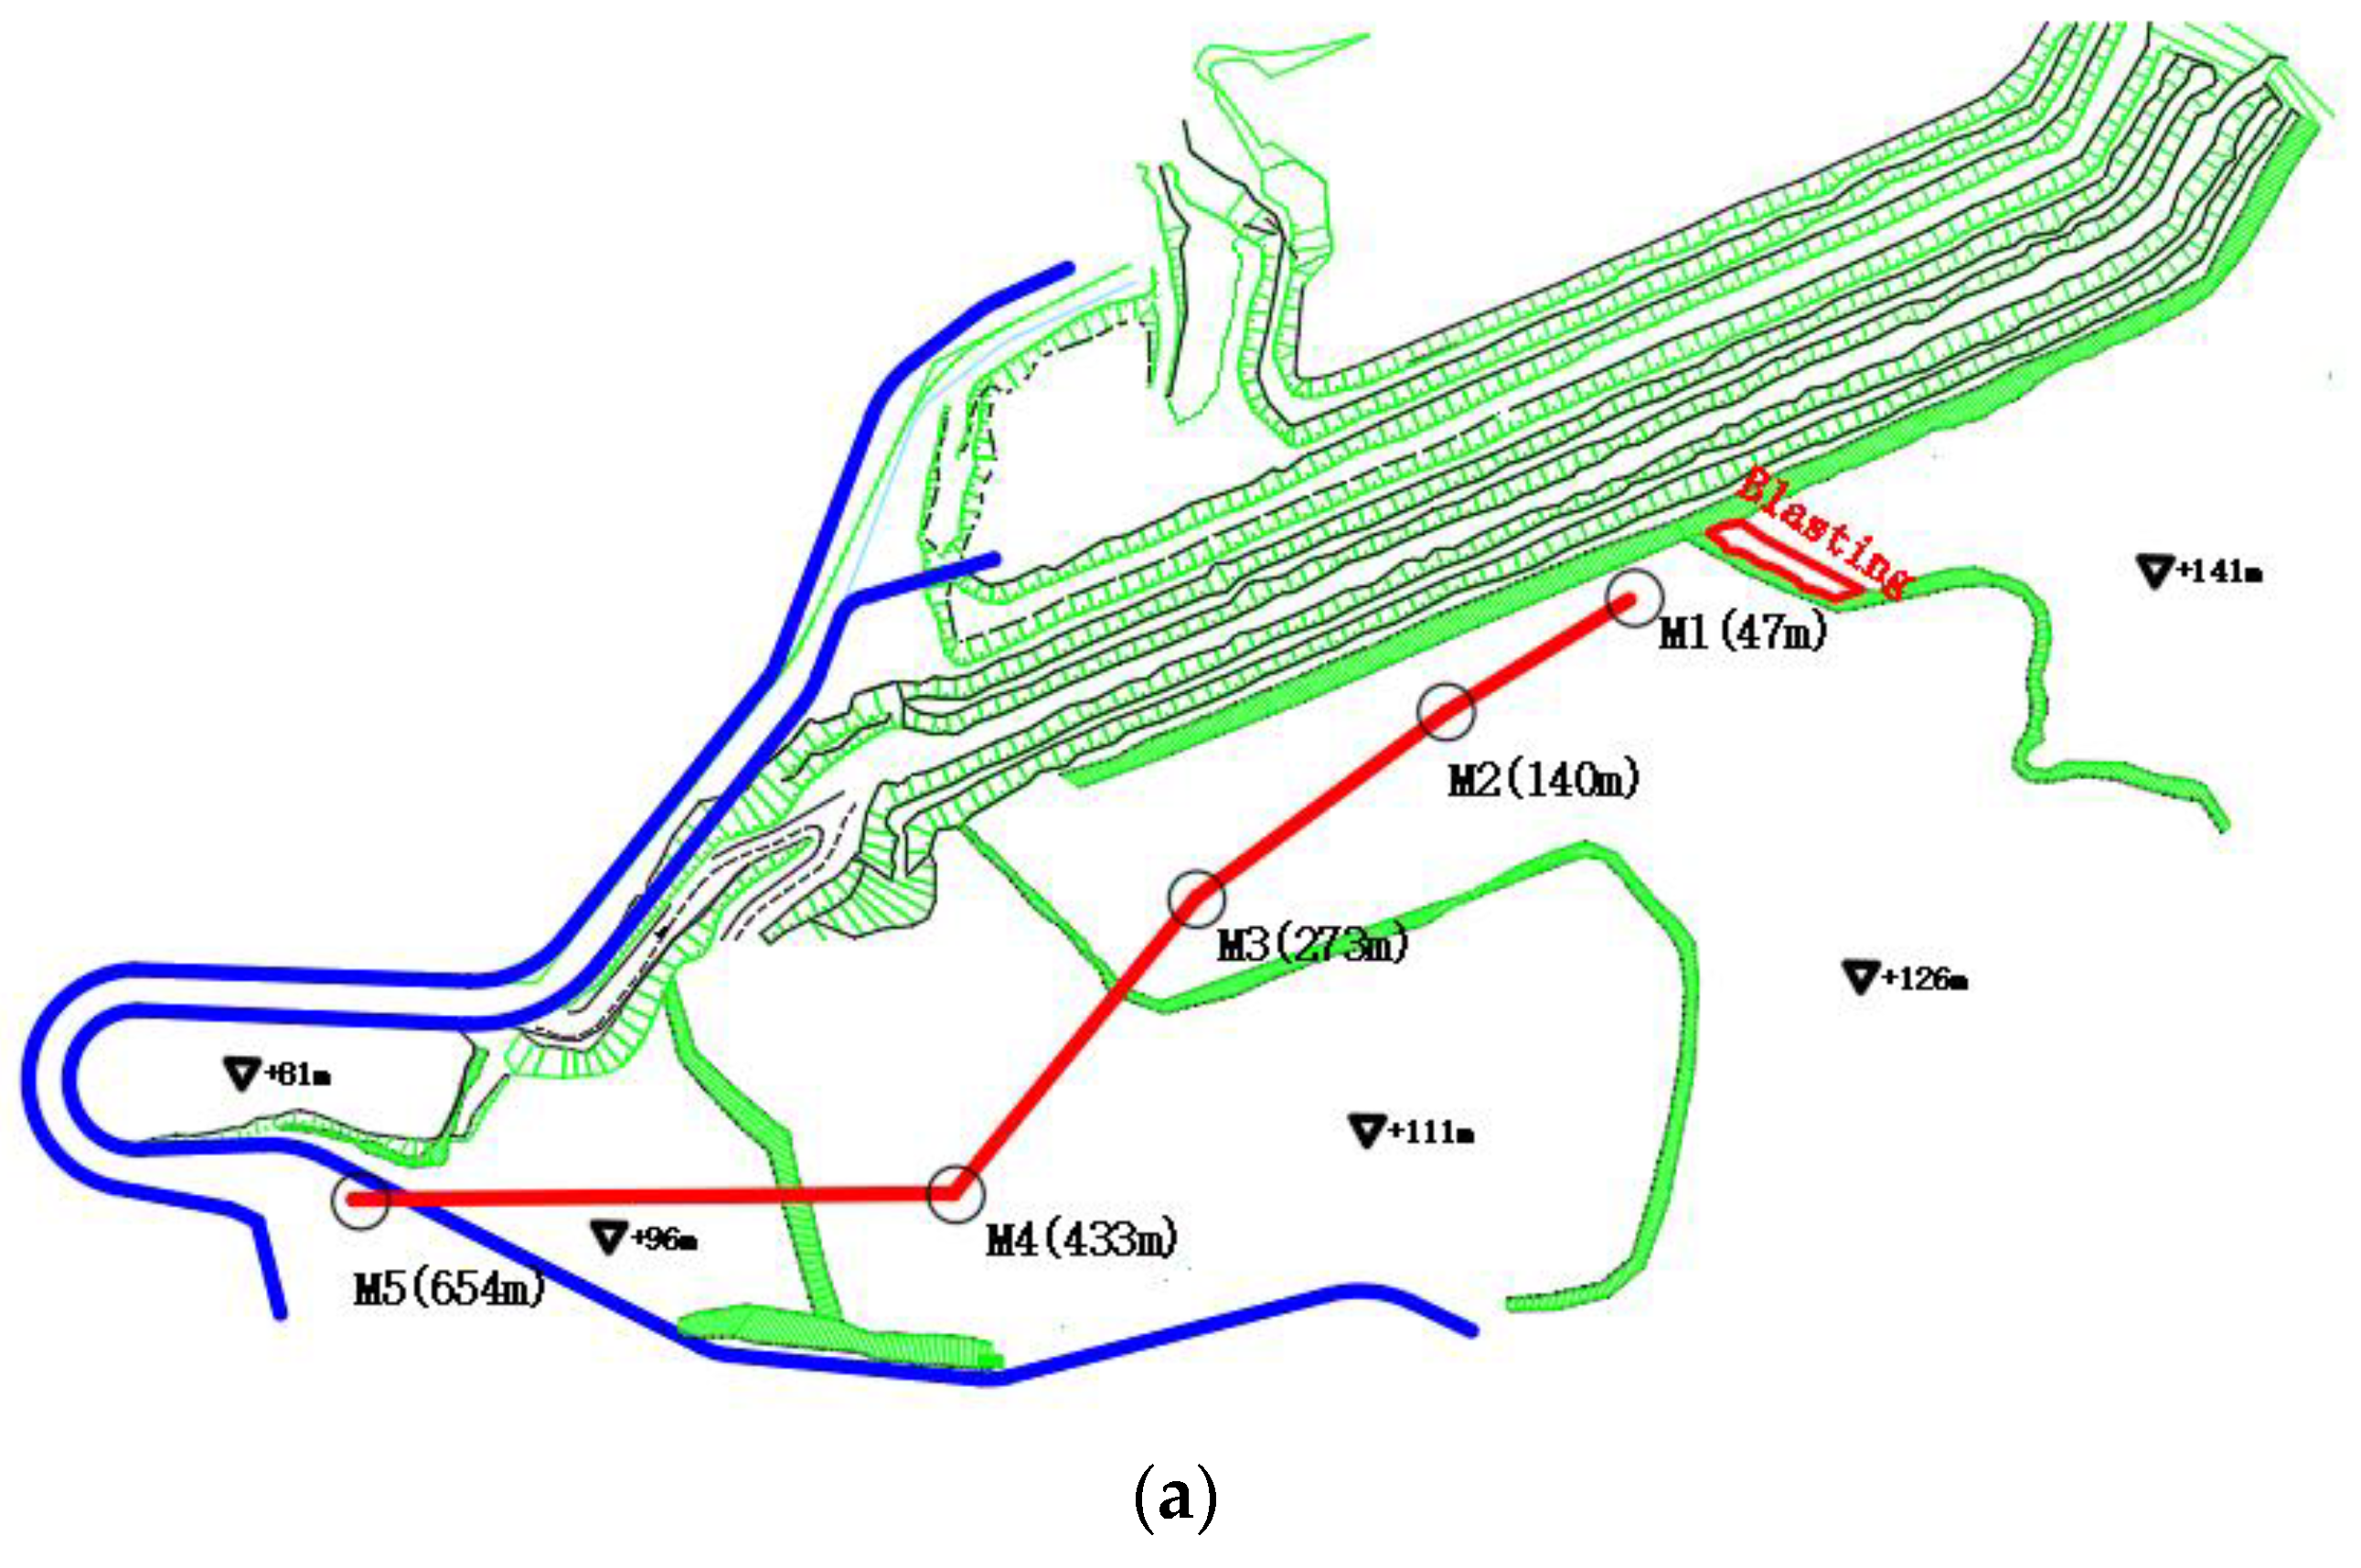
2.1. Engineering Overview

The Dahuangshan Tuff Building Stone Mine is an open-pit mine. The mining area is located in the hilly area in the north of Cezi Island and belongs to Taoyaomen Community, Cengang Street, Dinghai District, Zhoushan City, Zhejiang Province. The location of the mine area is shown in Figure 1. The rock formations in the mining area are mainly tuff and hard rocks with a compact structure. The mining process includes DTH drilling, medium and deep hole blasting, mechanical secondary crushing, loader shovel loading, and truck transportation, and the mining process is discharged to the designated location. The minimum mining elevation is +6 m.

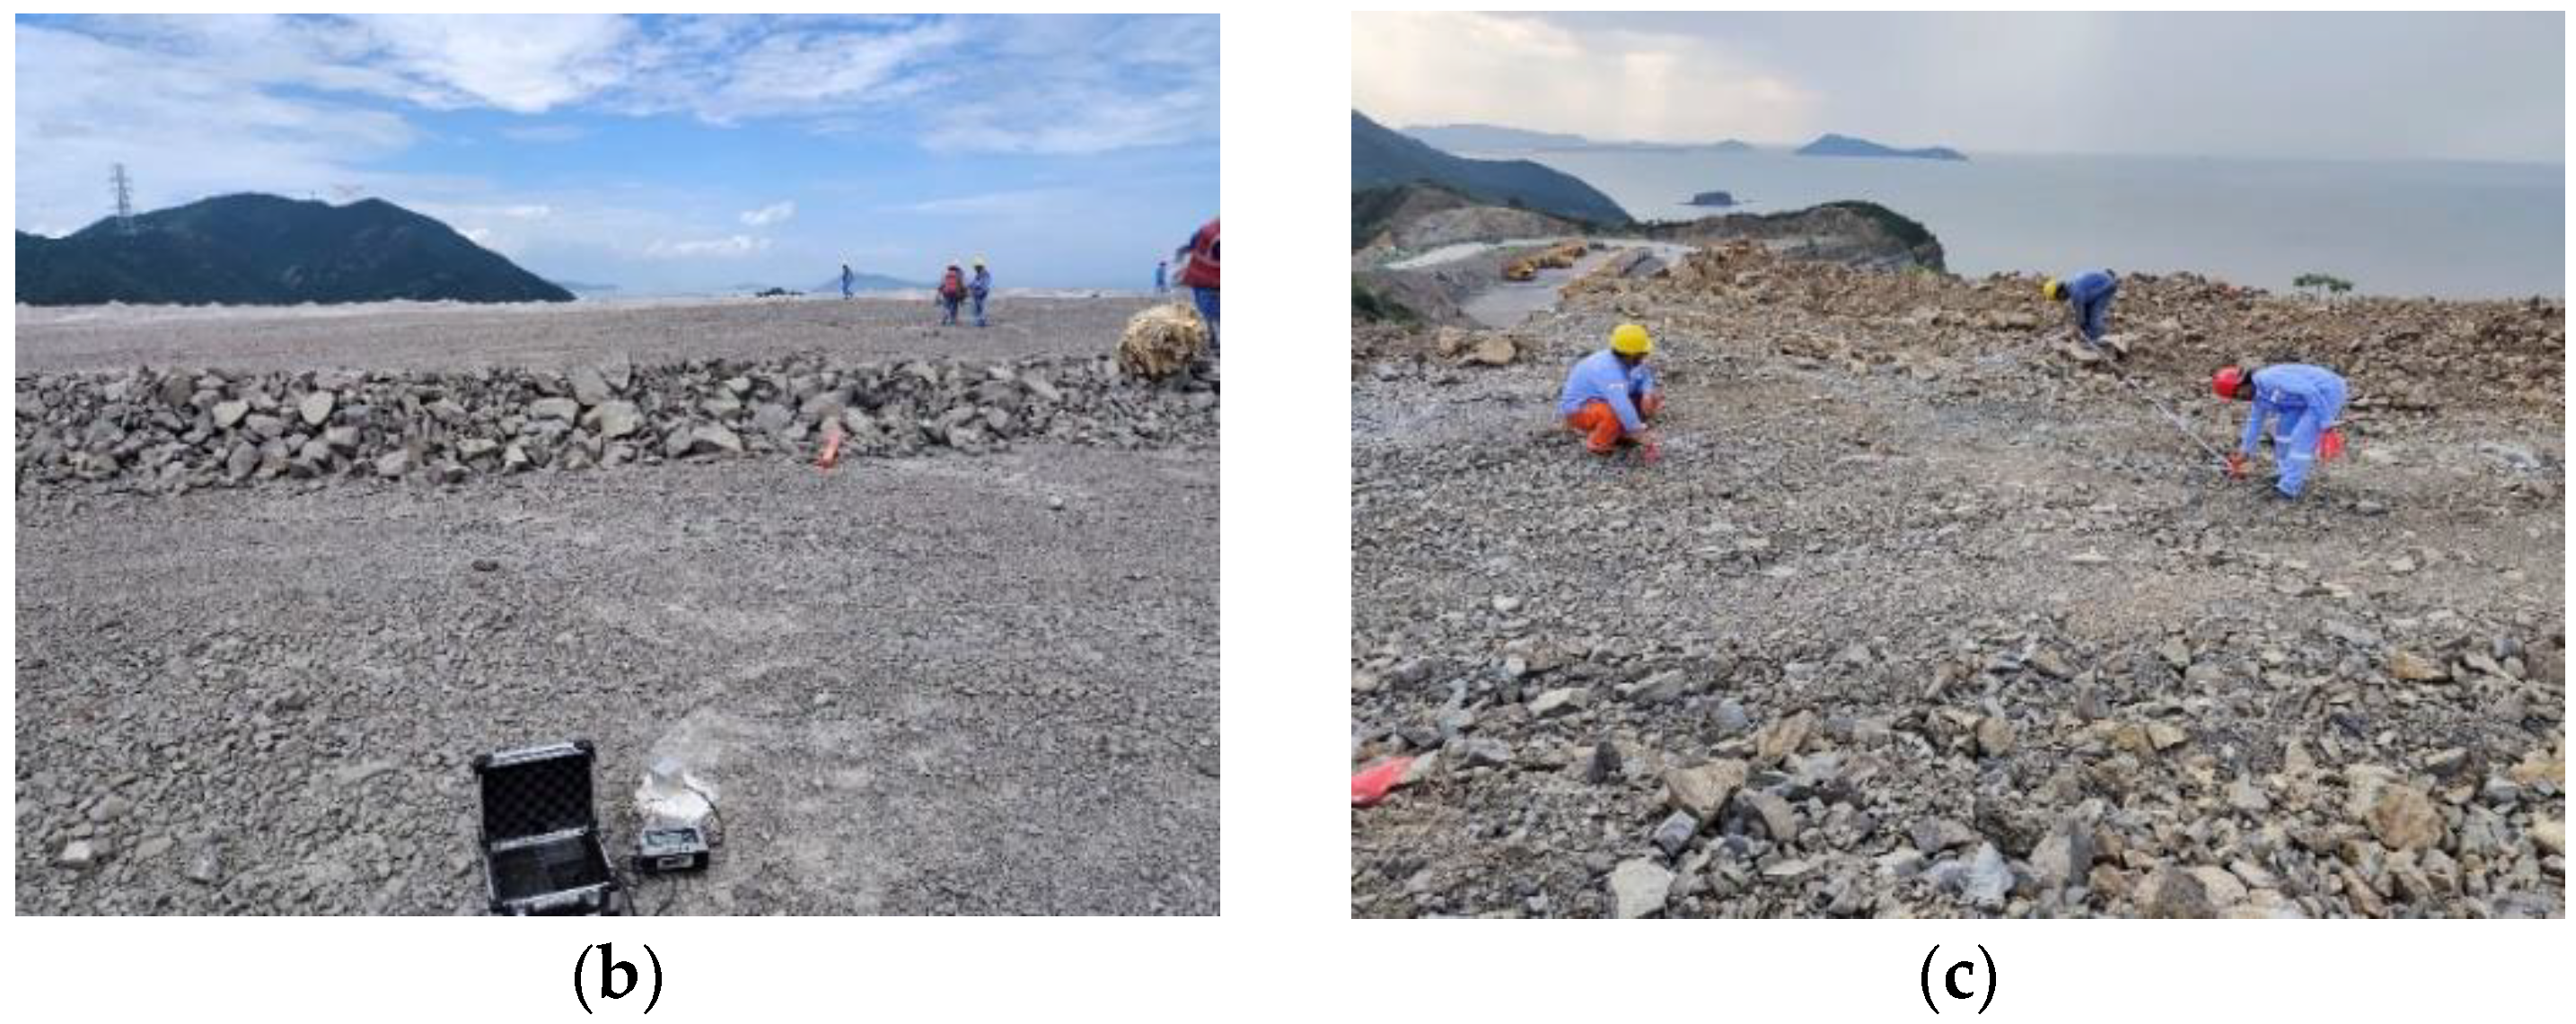
2.2. Blasting Vibration Monitoring

The blasting vibration monitoring uses the T-4850 sensor to collect blasting signals. The Figure 2 shows the layout of the monitoring points during blasting on the 141 platform. The blasting adopts a digital electronic detonator detonation network, a total of 77 holes, a total of 195 detonators, and 18 m in the hole. The digital electronic detonator and the 10 m digital electronic detonator are used to process the priming charge. The interval delay between the rows is set to 130 ms, and the interval delay between the holes is set to 50 ms.

2.3. Theory of the EWT Method

The empirical wavelet transform method was proposed by Gilles [20] in 2013. It integrates the EMD algorithm [21] and the wavelet transform method [22,23,24], so it has the characteristics of both methods. The EMD algorithm has data-driven adaptivity, a high signal-to-noise ratio, a good time-frequency focus, and advantages in terms of analyzing nonlinear and non-stationary signal sequences, and the original signal can be decomposed into each intrinsic mode function by the EMD algorithm. The equation is as follows:
f t = k = 0 N f k t
The algorithm process of the empirical wavelet transform method is as follows: firstly, the Fourier transform is performed on the original input signal, the empirical scale function and empirical wavelet are defined by the following formula, and, finally, the wavelet filter is constructed to decompose the signal to obtain each mode function.
ϕ ^ n ω = 1                                                               i f ω 1 γ ω n cos π 2 β 1 2 γ ω n ω 1 γ ω n i f 1 γ ω n ω 1 + γ ω n 0                                                                                             o t h e r w i s e
ψ ^ n ω = 1                     i f 1 + γ ω n ω 1 γ ω n + 1 cos π 2 β 1 2 γ ω n + 1 ω 1 γ ω n + 1   i f 1 γ ω n + 1 ω 1 + γ ω n + 1 sin π 2 β 1 2 γ ω n ω 1 γ ω n i f 1 γ ω n ω 1 + γ ω n 0                                                                                             o t h e r w i s e

2.4. Theory of the XGBoost Method

The XGBoost method is an ensemble learning method based on decision trees. It was proposed by Chen Tianqi et al. [25] in 2016. Each decision tree learns the residual between the target value and the sum of the predicted values of all previous trees. The XGBoost model fuses multiple tree models and adds the prediction results of many trees to obtain the final prediction result. The basic principles are as follows:
y ^ i = Φ x i = k = 1 K f k x i         ( f k F )
F = f x = ω q x     q : m T , ω T
In the formula, y ^ i represents the predicted value of the XGBoost model, which is superimposed by multiple decision trees f k ( x i ) in the series; K represents the number of decision trees; F represents the decision tree function space; q(X) represents that the sample X is mapped to the leaf nodes of the tree; ω q x represents the weight of the leaf nodes; m represents the m-dimensional real vector; T represents the number of leaf nodes of the decision tree; and T represents the T-dimensional real vector.
The XGBoost method improves the calculation accuracy by adding a regular term to the loss objective function and by performing a second-order Taylor expansion. The loss objective function is composed of an error term l and a regular term Ω . The formula is as follows:
L = i l y ^ i , y i + k Ω f k
Ω f = γ T + 1 2 λ ω 2
In the formula, l y ^ i , y i represents the error between the predicted value and the actual value; Ω f k represents the regular term, which is used to constrain the number of leaf nodes T and the leaf weight ω of the decision tree; γ represents the L2 square of the T modulus coefficient; and λ denotes the L2 squared modulus coefficient of ω.
For regression problems, the accuracy evaluation index of the model is often measured by the RMSE (root-mean-square error). The formula is as follows:
R M S E = Σ i = 1 n X p r e d , i X m e a , i 2 n
In the formula, X p r e d , i represents the predicted value, X m e a , i represents the measured value, and n represents the number of samples.

3. Model

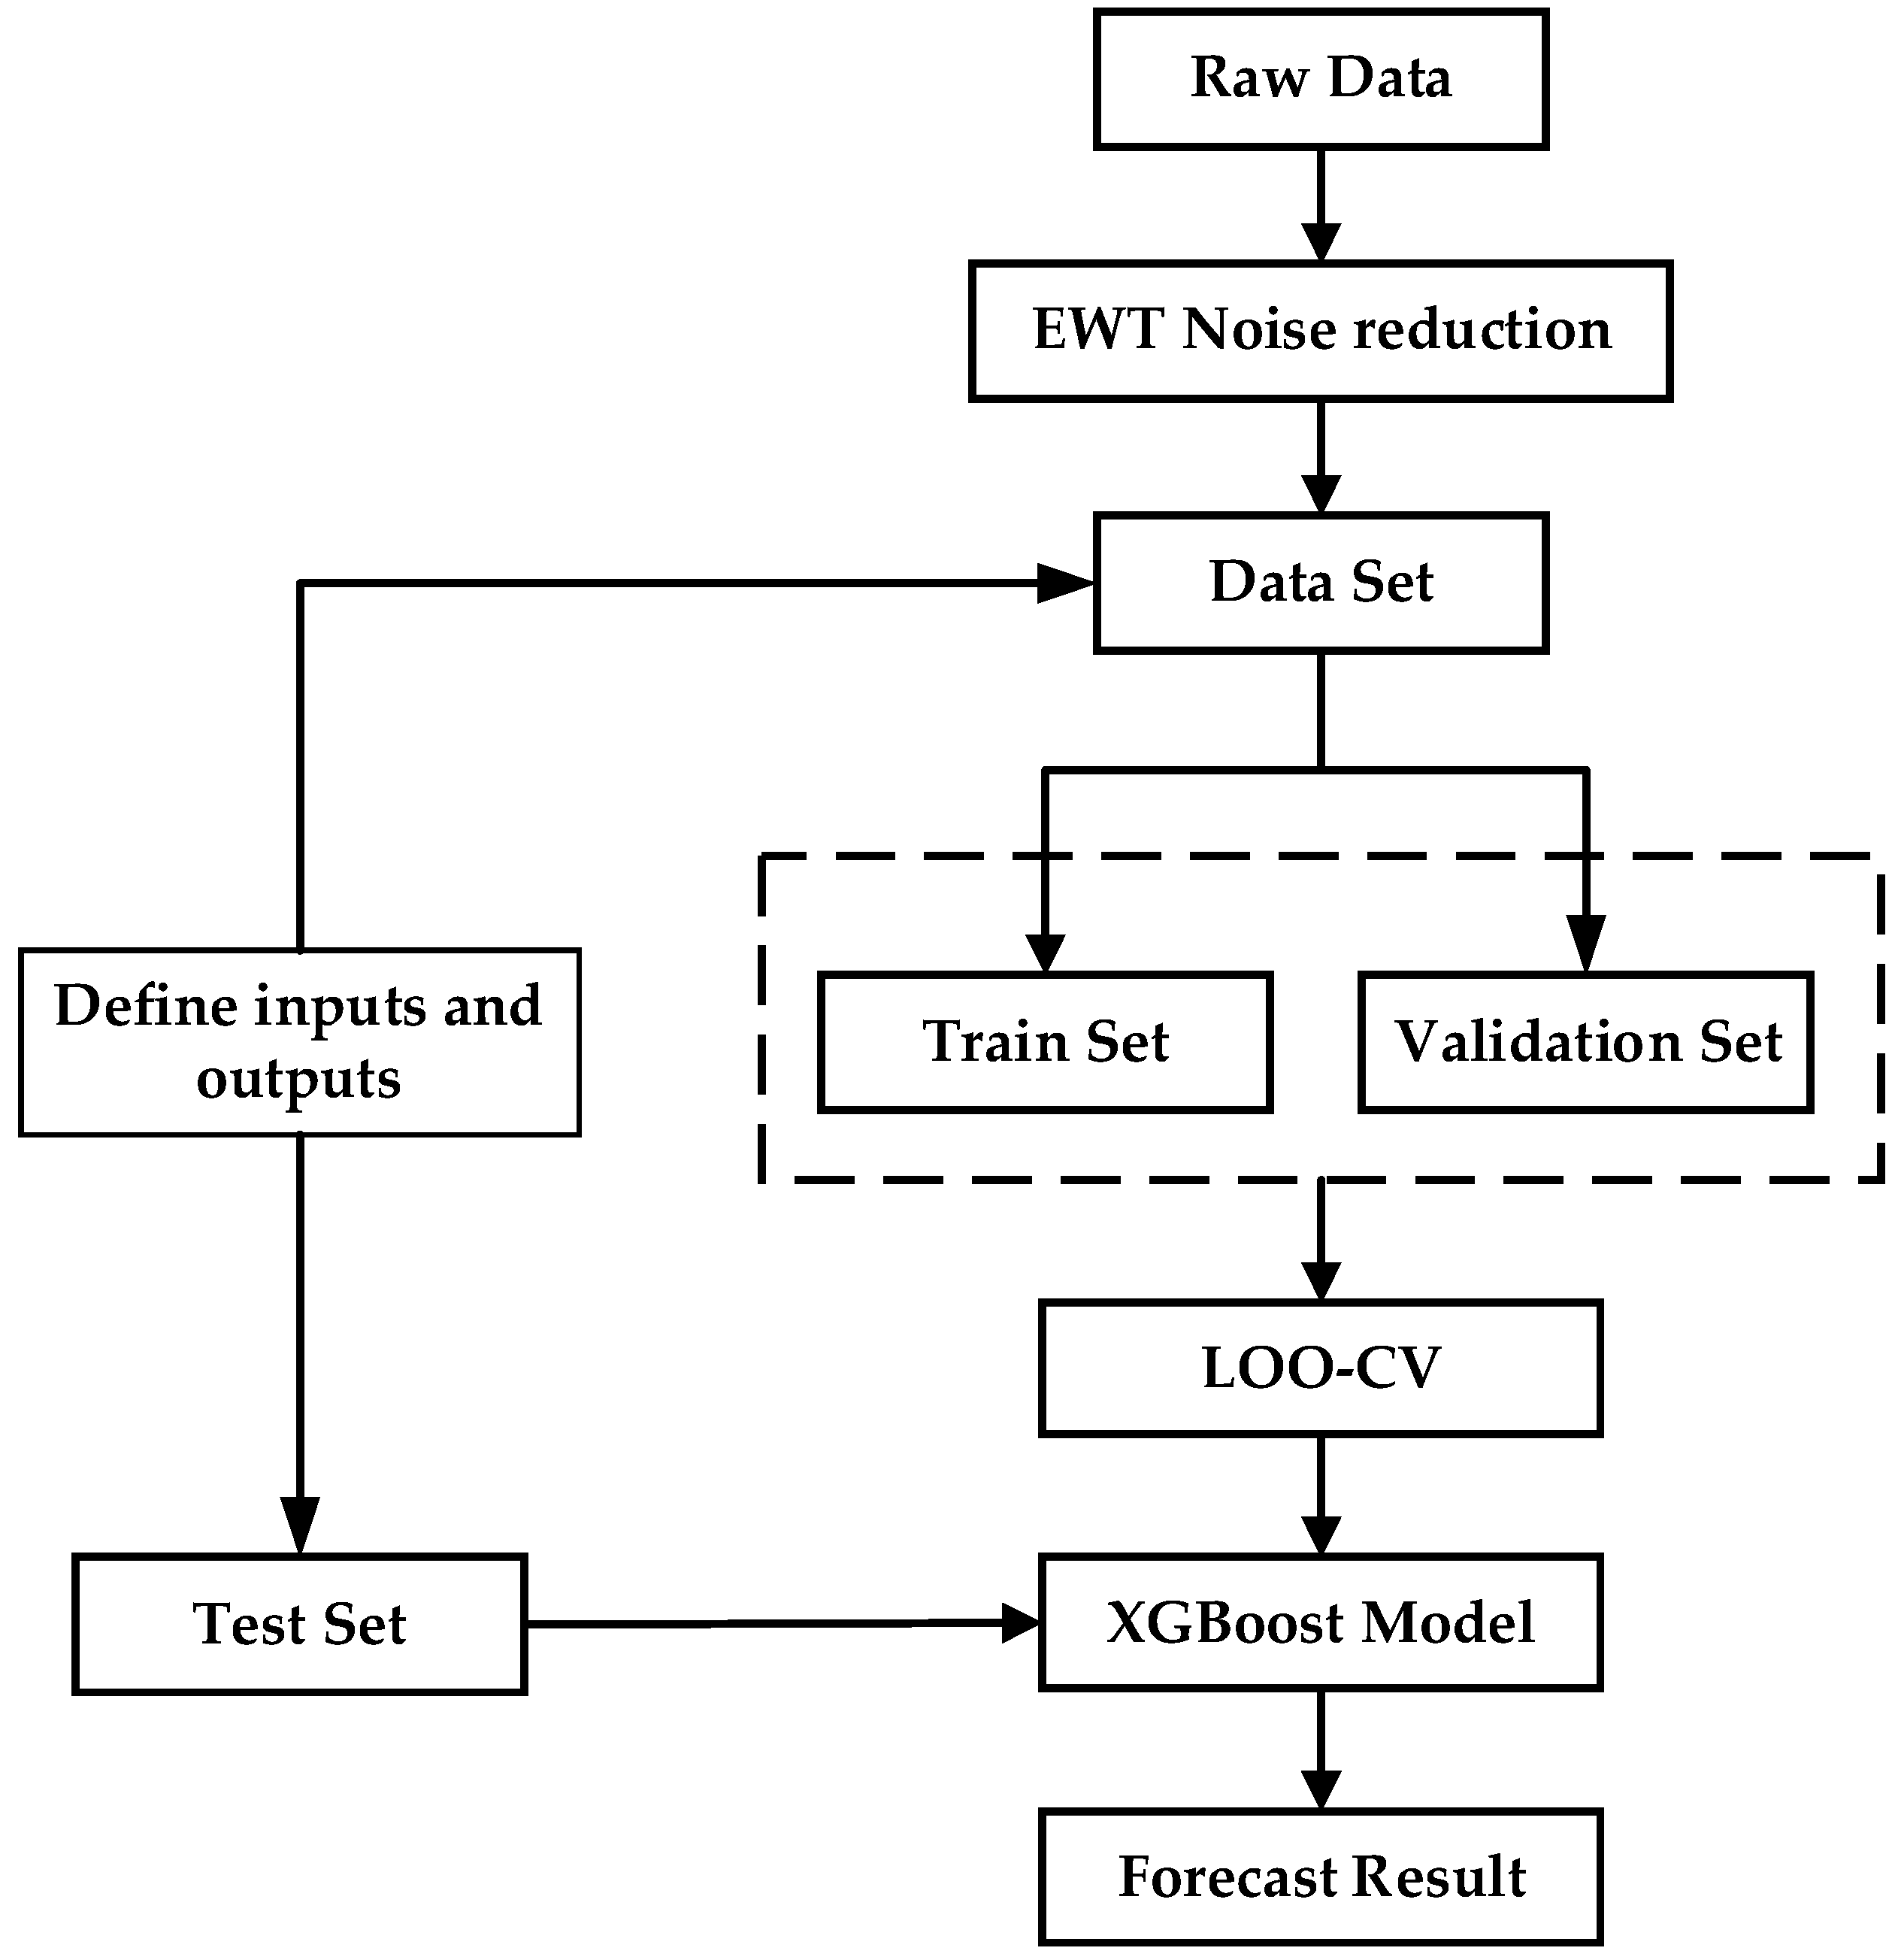
3.1. EWT–XGBoost Model

The process of using the EWT–XGBoost model to achieve PPV prediction is shown in Figure 3. The original data of the blasting vibration are denoised by EWT, and the obtained data are divided into the training set and the test set. The cross-validation method can obtain the parameters that optimize the generalization performance of the model. The common hyperparameters of the XGBoost model are the learning rate, the minimum leaf weight, the number and depth of the tree, etc. It divides the dataset into multiple subsets, among which a subset is used as the validation set, and the average error is calculated for multiple trainings to improve the generalization performance of the model. Because the amount of blasting vibration data collected this time is small, the leave-one-out cross-validation method is used to make the number of samples equal to the divided number of training subsets.
When predicting blasting vibration velocity, the amount of explosives (Q), blasting center distance (R), and elevation difference (H) are input as features, and the output is the blasting peak particle velocity (PPV). Both the training data samples and test data samples are derived from the blasting vibration data of the Dahuangshan mine project from July 8 to July 20; the original data samples are shown in Table 1:
By performing empirical wavelet decomposition on the collected blasting vibration signals, each mra component can be obtained, as shown in Figure 4. The blasting signal can be found by removing the noise, and the maximum value among them can be selected as the new particle peak particle velocity data sample, as input to the EWT–XGBoost blasting vibration velocity prediction model.

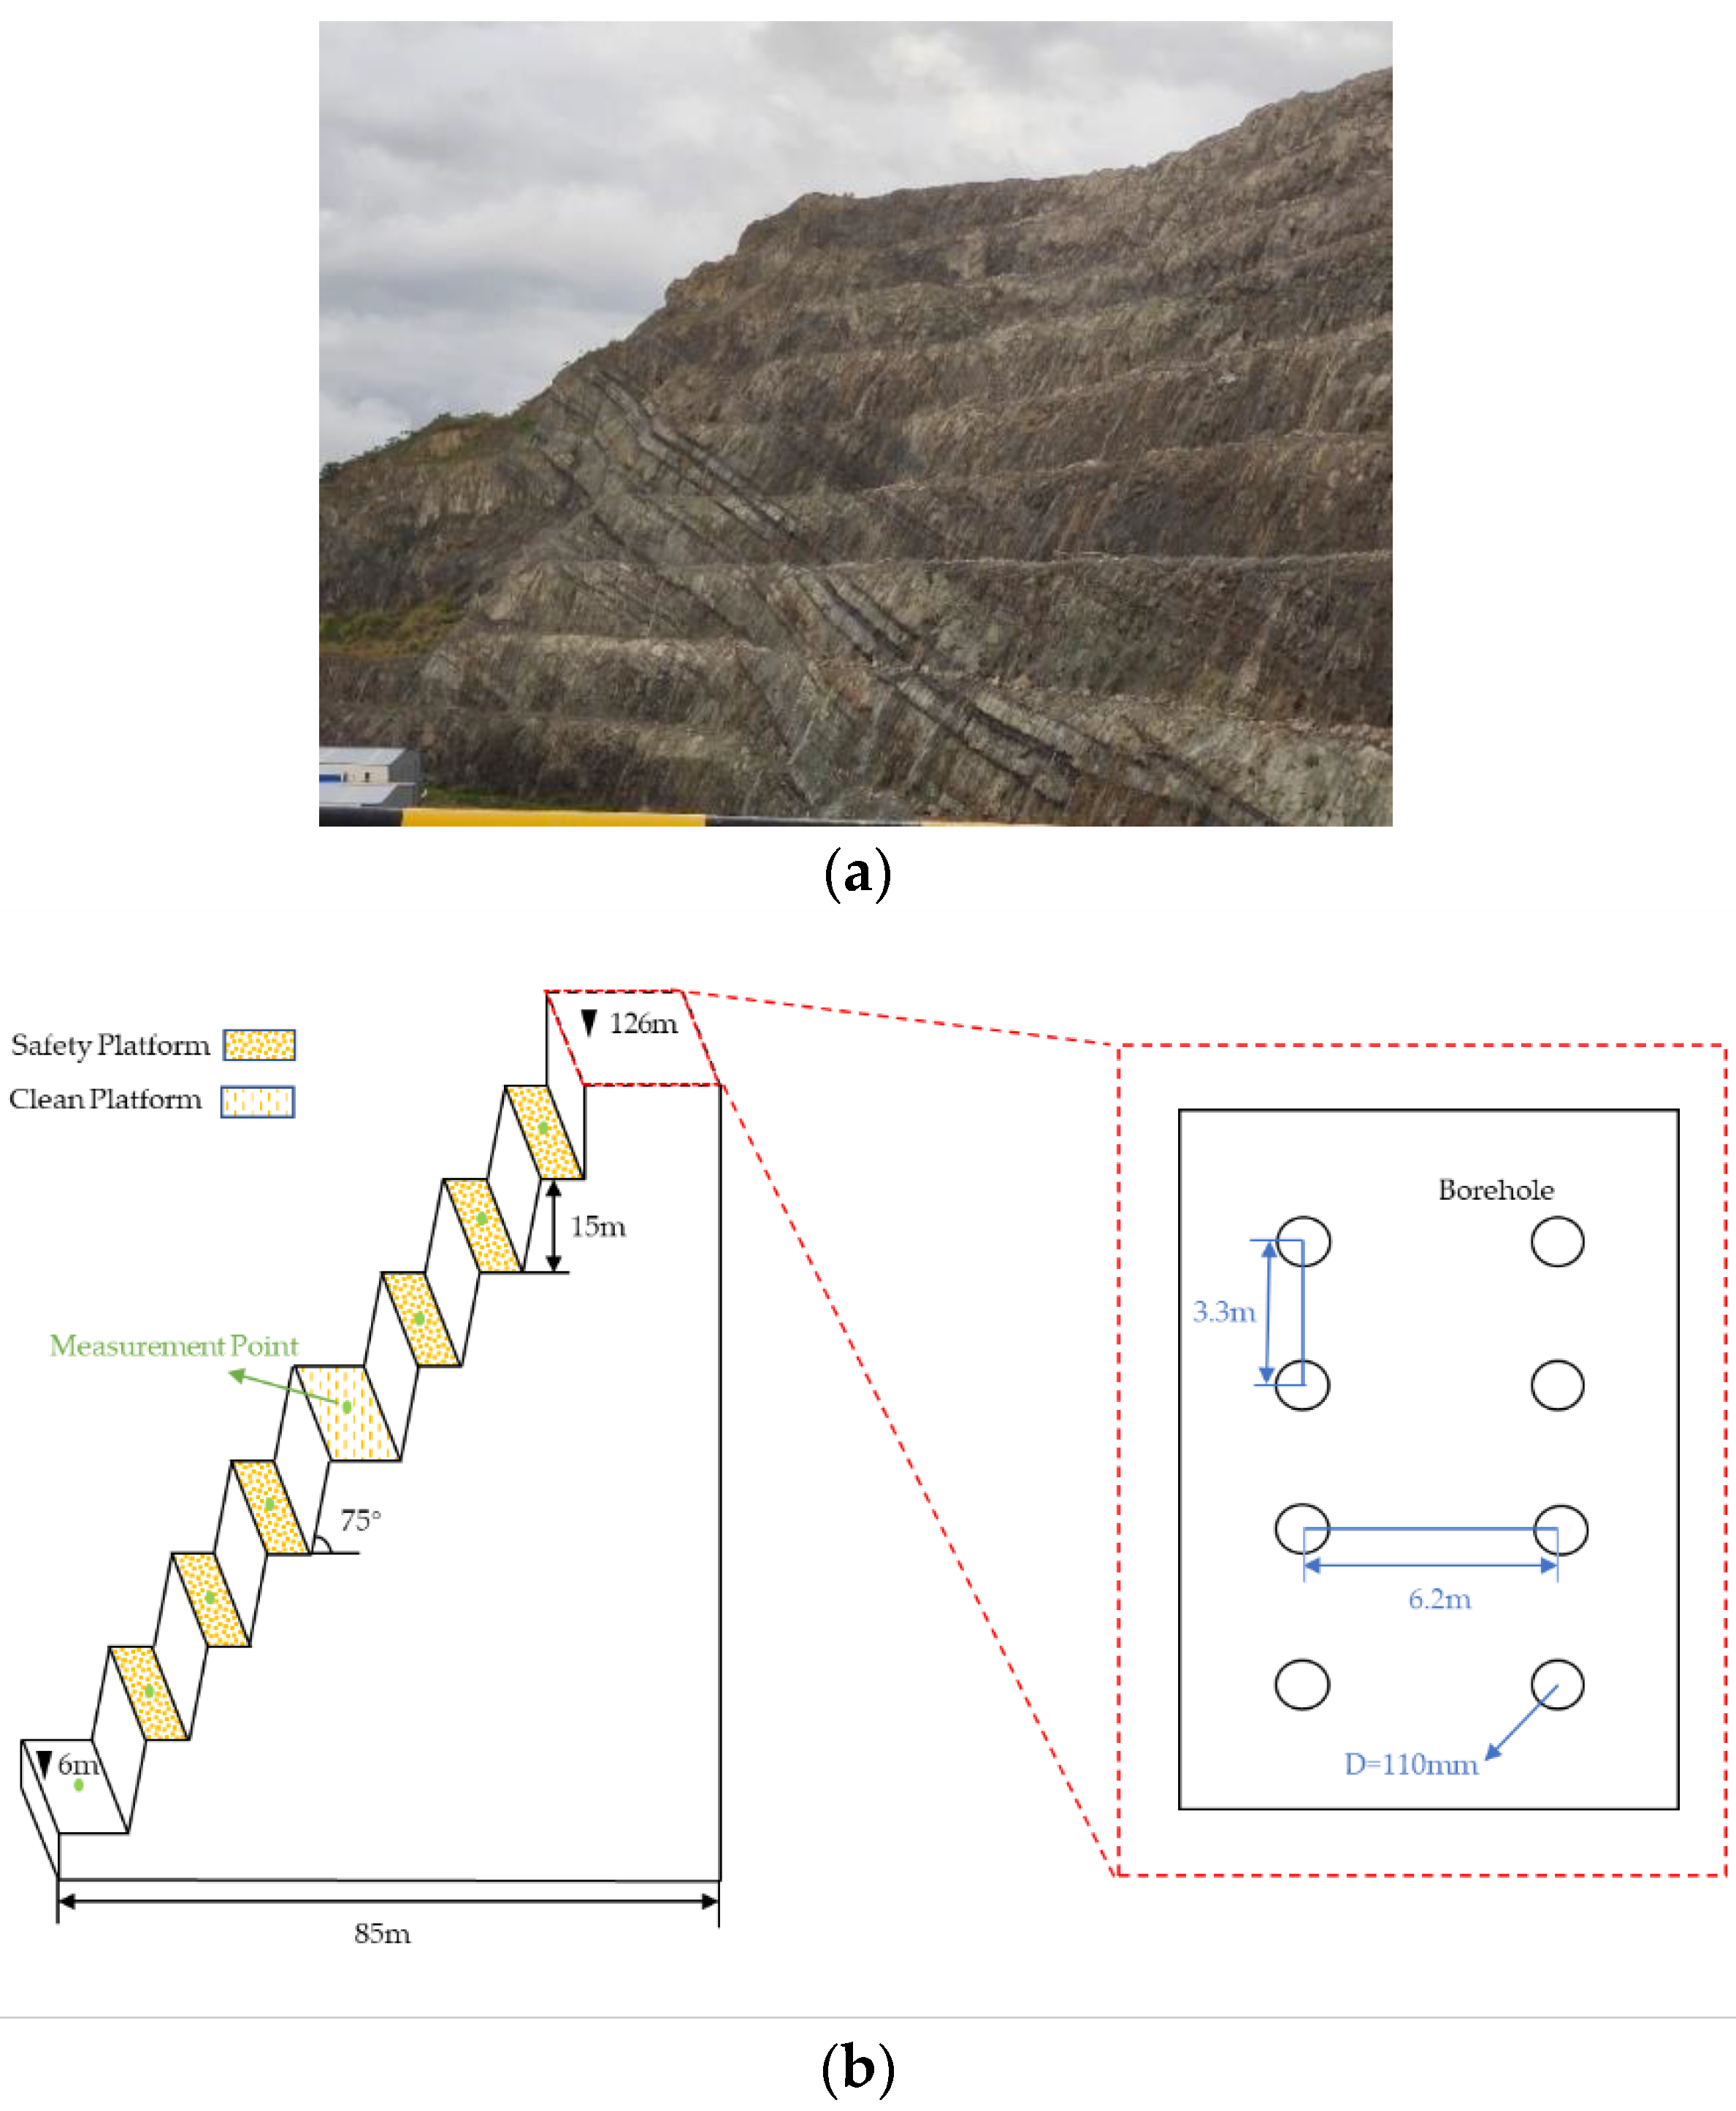
3.2. High Steep Slopes Model

Simulation of the blasting on adjacent high and steep slopes is carried out, and the parameters of the model include the slope parameters and blasting parameters. The slope parameters include the foot of the slope (+6 m), the step height (15 m), eight steps, the foot of the step (75°), the safety platform (5 m), the cleaning platform (8 m), and three safety platforms with one cleaning platform at the intervals (safety platform at the +111 m, +96 m, +81 m, +51 m, +36 m, +21 m mining levels; cleaning platform at the +66 m mining level). The blasting parameters include the borehole diameter (110 mm), the depth of the borehole (16.5 m), the length of the stemming (4 m), the length of the charge (12.5 m), the charge diameter (90 mm), the hole space (the column distance is 6.2 m; the row distance is 3.3 m), the minimum burden (3 m), and the subdrilling (1.5 m). The schematic diagram of the site and the corresponding model are shown in Figure 5.
Among the various material ontological models provided by LS-DYNA, the ontological models that are often used to describe the rock material are the RHT model, the HJC model, etc. In this paper, the HJC ontological model is used to describe the tuff material, and the relevant parameters of the tuff are derived from reference [26], as shown in Table 2.
The air domain is used for the contact between the solid and fluid media. The fluid-solid coupling algorithm is used to couple the fluid parts, such as the air and explosives, with the solid rock part. The keyword MAT_NULL is used to add air materials. The state equation formula is:
P = C 0 + C 1 μ + C 2 μ 2 + C 3 μ 3 + C 4 + C 5 μ + C 6 μ 2 E        
In the formula, E is the specific energy, which refers to the energy per unit volume; C0~C6 are constants; and μ is the specific volume. The air-related parameters are shown in Table 3.
The explosive material is defined by the keyword “MAT_HIGH_EXPLOSIVE_BURN”. The JWL equation of state is used to represent the pressure and volume changes during the explosion. The No. 2 rock emulsion explosive is used in the field. Its parameters are derived from reference [27], as shown in Table 4:
Set the top and slope faces as free boundaries and the rest as transmission boundaries with fixed displacement directions.

4. Result and Discussion

4.1. Analysis of the Learning Results

Import the test samples into the trained EWT–XGBoost blasting vibration velocity prediction model for prediction. The comparison of the test samples and prediction results is shown in Table 5:
It can be seen from the Figure 6 that the maximum relative error of the prediction result of the blasting vibration velocity of the EWT–XGBoost model is 7.69%, which is less than the maximum relative error of the XGBoost model (11.8%). The average relative error of the prediction results of the EWT–XGBoost model can be obtained by statistical calculation of the relative error, which yields 2.03%, which is less than the average relative error of the prediction results of the XGBoost model (4.49%). Formula 8 is used to calculate the root mean square error of the two models. According to the calculation, it can be concluded that the root mean square error of the prediction result of the EWT–XGBoost model is 0.0035, which is smaller than the root mean square error of the prediction result of the XGBoost model, which is 0.0836. Therefore, in terms of predicting the blasting vibration velocity The EWT–XGBoost model is better than the XGBoost model.

4.2. Predictive Analysis of Nodal Vibration Velocity

By building a numerical model of high and steep slopes and comparing and analyzing the variation of blasting vibration velocity at the center positions of different platforms, the following rules are found: the Figure 7 shows the blasting vibration velocity changes at the center positions of the platforms 51, 66, 81, 96, and 111 within the initial 10 ms, when the blastholes are detonated at the same time. The vibration velocity of the 111 platform exceeds the safe vibration velocity specified in the blasting safety regulations [28]. From the 96 platform to the 111 platform, the blasting vibration velocity decays rapidly. The vibration velocity of the 51, 66, and 81 platforms does not change significantly, and the peak particle velocity is less than 1 cm/s.
The 111 platform is close to the explosion source and is greatly affected by the shock wave, so the response fluctuates violently in the vibration velocity. With the increase in the explosion center distance, the vibration parameters change gradually. According to this, the safety monitoring of the 111 platform should be strengthened, and active protection should be carried out.
The Figure 8 is a line chart of the peak blasting vibration velocity of each platform height with different delay times. Compared with simultaneous blasting, delayed blasting has a significant impact on the peak particle velocity of the 66–111 platform. The difference in elevation is 45 m. The peak blasting vibration of the delay times of 130 ms and 80 ms is not significantly reduced, and, among them, the peak particle velocity of the 111 platform has the largest decrease. The peak particle velocity of the 80 ms delayed detonation is reduced by 17% compared to the 130 ms delayed detonation on the 111 platform. The 51 platform is located in the middle, and its peak particle velocity has been significantly strengthened. The blasting vibration velocity below the 51 platform has an amplification effect, and the peak particle velocity has slightly rebounded.

5. Conclusions

In this study, a machine learning model and a numerical simulation model were developed to predict blast vibration velocity at the Dahuangshan mine. A machine learning model for blast vibration prediction considering elevation difference was established, and the mean relative error and root mean square error were calculated by training the original blast vibration monitoring data and predicting the test sample data. It was found that the EWT–XGBoost model reduces the average relative error by 2.46% and the root mean square error by 0.0801 compared with the XGBoost model, so the improved XGBoost method can be applied to the analysis of blasting events in open-pit mines. In terms of PPV prediction, the EWT–XGBoost model can achieve a higher prediction accuracy compared with that of the original model. A numerical model for predicting the vibration velocity of high and steep slope blasting is established, and the simulation results show that the vibration velocity of platform 111 exceeds the safety regulations when the simultaneous detonation method is used compared with when the hole-by-hole method is used. The peak particle velocity of blasting at the top of the mountain decreases sharply when using the deferred detonation method, and the deferred blasting can have a good vibration damping effect on the high and steep slope. The vibration damping effect is especially obvious within a 45 m difference in elevation. The high and steep slopes are dangerous, so we did not place the sensors. This is an oversight in our work, and we will improve it in future studies.

Author Contributions

J.G. and S.X. provided the experimental ideas and carried out the experiment; Y.L. directed and assisted the experiment; C.Z. wrote the paper; J.G. reviewed the paper. All authors have read and agreed to the published version of the manuscript.

Funding

This research was funded by the Central South University School-Enterprise Joint Project “Research on rapid evaluation technology of open-pit blasting effect in plateau mines” (2021xqlh065) and by the Central South University-Hongda Blasting Engineering Group Postgraduate Joint Training Base (2020pyjd91).

Conflicts of Interest

The authors declare no conflict of interest.

References

  1. Nikkhah, A.; Vakylabad, A.B.; Hassanzadeh, A.; Niedoba, T.; Surowiak, A. An Evaluation on the Impact of Ore Fragmented by Blasting on Mining Performance. Minerals 2022, 12, 258. [Google Scholar] [CrossRef]
  2. Gharehgheshlagh, H.H.; Alipour, A. Ground vibration due to blasting in dam and hydropower projects. Rud.-Geol.-Naft. Zb. 2020, 35, 59–66. [Google Scholar]
  3. Feher, J.; Cambal, J.; Pandula, B.; Kondela, J.; Sofranko, M.; Mudarri, T.; Buchla, I. Research of the technical seismicity due to blasting works in quarries and their impact on the environment and population. Appl. Sci. 2021, 11, 2118. [Google Scholar] [CrossRef]
  4. Jiang, N.; Zhang, Y.; Zhou, C.; Wu, T.; Zhu, B. Influence of Blasting Vibration of MLEMC Shaft Foundation Pit on Adjacent High-Rise Frame Structure: A Case Study. Energies 2020, 13, 5140. [Google Scholar] [CrossRef]
  5. Ma, Y.; Liu, C.; Wang, P.; Zhu, J.; Zhou, X. Blast Vibration Control in A Hydropower Station for the Safety of Adjacent Structure. Appl. Sci. 2020, 10, 6195. [Google Scholar] [CrossRef]
  6. Lutovac, S.; Medenica, D.; Gluščević, B.; Tokalić, R.; Beljić, Č. Some Models for Determination of Parameters of the Soil Oscillation Law during Blasting Operations. Energies 2016, 9, 617. [Google Scholar] [CrossRef] [Green Version]
  7. Mesec, J.; Strelec, S.; Tezak, D. Ground vibrations level characterization through the geological strength index (GSI). Rud.-Geol.-Naft. Zb. 2017, 32, 1–6. [Google Scholar] [CrossRef]
  8. Yin, Z.Q.; Hu, Z.X.; Wei, Z.D.; Zhao, G.M.; Ma, H.F.; Zhuo, Z.; Feng, R.M. Assessment of Blasting-Induced Ground Vibration in an Open-Pit Mine under Different Rock Properties. Adv. Civ. Eng. 2018, 2018, 4603687. [Google Scholar] [CrossRef]
  9. LIN, H. Blasting vibration propagation law and control technology of high slope. Eng. Blasting 2020, 26, 69–74. [Google Scholar]
  10. Yue, Z.; Wu, Y.; Wei, Z.; Wang, G.; Wang, Y.; Li, X.; Zhou, Y. Prediction of blasting vibration effect in open-pit mine based on PSO-LSSVM model. Eng. Blasting 2020, 26, 1–8. [Google Scholar]
  11. Sun, M.; Wu, L.; Yuan, Q.; Zhou, Y.; Ma, C. Blasting vibration prediction of underground gas storage caverns based on PSO-LSSVM algorithm. Blasting 2017, 34, 145–150. [Google Scholar]
  12. Yan, Y.; Hou, X.; Cao, S.; Li, R.; Zhou, W. Forecasting the Collapse-Induced Ground Vibration Using a GWO-ELM Model. Buildings 2022, 12, 121. [Google Scholar] [CrossRef]
  13. Yu, Z.; Shi, X.; Zhou, J.; Chen, X.; Qiu, X. Effective Assessment of Blast-Induced Ground Vibration Using an Optimized Random Forest Model Based on a Harris Hawks Optimization Algorithm. Appl. Sci. 2020, 10, 1403. [Google Scholar] [CrossRef] [Green Version]
  14. Zhang, H.; Zhou, J.; Jahed Armaghani, D.; Tahir, M.M.; Pham, B.T.; Huynh, V.V. A Combination of Feature Selection and Random Forest Techniques to Solve a Problem Related to Blast-Induced Ground Vibration. Appl. Sci. 2020, 10, 869. [Google Scholar] [CrossRef] [Green Version]
  15. Lak, M.; Marji, M.F.; Bafghi, A.Y.; Abdollahipour, A. Analytical and numerical modeling of rock blasting operations using a two-dimensional elasto-dynamic Green’s function. Int. J. Rock Mech. Min. Sci. 2019, 114, 208–217. [Google Scholar] [CrossRef]
  16. Lei, Z.; Gao, Z.; Zhuo, Y.; He, X.; Yuan, Y.; He, L. Research on vibration propagation law and dynamic response characteristics of bench blasting. Blasting 2019, 36, 137–145. [Google Scholar]
  17. Choi, Y.-H.; Lee, S.S. Predictive Modelling for Blasting-Induced Vibrations from Open-Pit Excavations. Appl. Sci. 2021, 11, 7487. [Google Scholar] [CrossRef]
  18. Gonen, A. Investigation of Fault Effect on Blast-Induced Vibration. Appl. Sci. 2022, 12, 2278. [Google Scholar] [CrossRef]
  19. Yan, B.; Liu, M.; Meng, Q.; Li, Y.; Deng, S.; Liu, T. Study on the Vibration Variation of Rock Slope Based on Numerical Simulation and Fitting Analysis. Appl. Sci. 2022, 12, 4208. [Google Scholar] [CrossRef]
  20. Gilles, J. Empirical wavelet transform. IEEE Trans. Signal Processing 2013, 61, 3999–4010. [Google Scholar] [CrossRef]
  21. Huang, N.E.; Shen, Z.; Long, S.R.; Wu, M.C.; Shih, H.H.; Zheng, Q.; Yen, N.-C.; Tung, C.C.; Liu, H.H. The empirical mode decomposition and the Hilbert spectrum for nonlinear and non-stationary time series analysis. Proc. R. Soc. London. Ser. A Math. Phys. Eng. Sci. 1998, 454, 903–995. [Google Scholar] [CrossRef]
  22. Daubechies, I. Ten Lectures on Wavelets; SIAM: Philadelphia, PA, USA, 1992. [Google Scholar]
  23. Jaffard, S.; Meyer, Y.; Ryan, R.D. Wavelets: Tools for Science and Technology; SIAM: Philadelphia, PA, USA, 2001. [Google Scholar]
  24. Meyer, Y. Wavelets, Vibrations and Scalings; American Mathematical Soc.: Providence, RI, USA, 1998. [Google Scholar]
  25. Chen, T.; Guestrin, C. Xgboost: A scalable tree boosting system. In Proceedings of the 22nd Acm Sigkdd International Conference on Knowledge Discovery and Data Mining, San Francisco, CA, USA, 13 August 2016; pp. 785–794. [Google Scholar]
  26. Qin, F.; Xiang-zhen, K.; Hao, W.; Zi-Ming, G. Determination of Holmquist-Johnson-Cook consitiutive model parameters of rock. Eng. Mech. 2014, 31, 197–204. [Google Scholar]
  27. Feng, M.; Wenhua, Z.; Dongqing, L. Application of water-couple charge blasting in tunnel excavation. Chin. J. Undergr. Space Eng. 2012, 8, 1008–1013. [Google Scholar]
  28. Safety Regulations for Blasting: GB 6722-2014; China Standards Press: Beijing, China, 2015.
Figure 1. Geographical location of the mining area.
Applsci 12 05849 g001
Figure 2. Blasting Vibration Monitoring: (a) Measuring point layout (141 Blasting area); (b) Monitoring instrument at the measuring point; (c) The site of the blasthole layout.
Applsci 12 05849 g002aApplsci 12 05849 g002b
Figure 3. EWT–XGBoost prediction model flowchart.
Applsci 12 05849 g003
Figure 4. Blasting vibration signal EWT and spectrogram.
Applsci 12 05849 g004
Figure 5. Schematic diagram of the scene and the corresponding model: (a) Site map of the slope; (b) Schematic diagram of the model.
Applsci 12 05849 g005
Figure 6. Relative results histogram of the prediction results.
Applsci 12 05849 g006
Figure 7. 10 ms blasting vibration velocity diagram of the 51–111 platform.
Applsci 12 05849 g007
Figure 8. Line graph of the peak particle velocity of the 6–111 platform.
Applsci 12 05849 g008
Table 1. Raw sample data.
No.Q (Kg)R (m)H (m)PPV (cm/s)
19072466810.335
29518389810.343
39942486960.339
4997538308.390
59975201450.193
6997570753.710
79975129900.350
857456711210.043
957456831210.051
1010,07780−156.730
1110,077152300.210
1210,077522450.783
1310,077678900.192
14740147155.830
157401140151.774
167401273150.416
177401432300.143
187401654510.152
19954555152.283
209545161150.717
219545286150.524
229545677511.012
238041484960.287
249812523810.798
258041461900.149
269812209753.108
278041592750.116
289812304603.979
298041588450.198
309812381300.948
318041601300.323
32981252159.026
Table 2. HJC model parameters of the tuff material.
ρ/(g·cm−3)G/(MPa)ABCNfc/(MPa)
1.865430.551.770.00970.7750
T/(MPa)ε0/(s−1)εf,minSmaxPc/(MPa)UcPL/(MPa)
3.31 × 10−60.0117170.002532500
ULD1D2K1/(MPa)K2/(MPa)K3/(MPa)fs
0.380.0413100600084000.035
ρ: mass density, G: shear modulus, A: normalized cohesive strength, B: normalized pressure hardening, C: strain rate coefficient, N: pressure hardening exponent, fc: quasi-static uniaxial compressive strength, T: maximum tensile hydrostatic pressure, ε0: quasi-static threshold strain rate, εf,min: amount of plastic strain before fracture, Smax: normalized maximum strength, Pc: crushing pressure, Uc: crushing volumetric strain, PL: locking pressure, UL: locking volumetric strain, D1: damage constant, D2: damage constant, K1: pressure constant, K2: pressure constant, K3: pressure constant, fs: failure type.
Table 3. Air parameters.
C0C1C2C3C4C5C6E/(MPa)
00000.40.400.25
Table 4. Parameters of the No. 2 rock emulsion explosive.
ρ/(kg/m3)D/(m/s)G/(MPa)A/(GPa)B/(Gpa)R1R2ωE/(MPa)
110036003500214.40.1824.20.90.154 192
Table 5. Test sample data and comparison of forecast results.
No.Q(Kg)R(m)H(m)XGBoost ModelEWT–XGBoost Model
Measured ValuePredicted ValueMeasured ValuePredicted Value
1997538308.390 8.231 3.882 3.877
257456831210.051 0.057 0.013 0.012
3740147155.830 5.800 1.566 1.563
4954555152.283 2.369 0.941 0.946
59812523810.798 0.806 0.063 0.064
Publisher’s Note: MDPI stays neutral with regard to jurisdictional claims in published maps and institutional affiliations.

