Article

Rethinking Healthcare Teams’ Practices Using Network Science: Implications, Challenges, and Benefits

by
Davide Aloini
1,
Giovanna Ferraro
2,
Antonio Iovanella
3 and
Alessandro Stefanini
1,*
1
Department of Energy, Systems, Territory and Construction Engineering, University of Pisa, 56126 Pisa, Italy
2
Department of Engineering and Architecture, University of Parma, 43121 Parma, Italy
3
School of Economics, Università degli Studi Internazionali di Roma—UNINT, 00147 Roma, Italy
*
Author to whom correspondence should be addressed.
Appl. Sci. 2022, 12(12), 5841; https://doi.org/10.3390/app12125841
Submission received: 10 May 2022 / Revised: 3 June 2022 / Accepted: 6 June 2022 / Published: 8 June 2022

Abstract

:
Healthcare teams act in a very complex environment and present extremely peculiar features since they are multidisciplinary, work under quickly changing conditions, and often stay together for a short period with a dynamically fluctuating team membership. Thus, in the broad discussions about the future of healthcare, the strategy for improving providers’ collaboration and team dynamics is becoming a central topic. Within this context, this paper aims to discuss different viewpoints about the application of network science to teamworking. Our results highlight the potential benefits deriving from network science-enabled analysis, and also show some preliminary empirical evidence through a real case study. In so doing, we intend to stimulate discussions regarding the implications of network science in the investigation and improvement of healthcare teams. The intention is to pave the way for future research in this context by suggesting the potential advantages of healthcare teamwork analysis, as well as recognising its challenges and threats.

1. Introduction

In healthcare, as also in other business contexts, teams act in very complex environments and present very peculiar features [1,2,3]. Indeed, they are multidisciplinary, work under quickly changing conditions, and often stay together for a short period with a dynamically fluctuating team membership [4]. These aspects are particularly emphasised in complex and dynamic health operational contexts, e.g., in surgery, emergency departments, or intensive care units. Given the growing number of care activities delivered by teams and their potential societal impact, the optimal management of teams plays a relevant role in providing effective and efficient care for the entire health system [5,6]. Thus, in the broad discussions about the future of healthcare, the strategy for improving the collaboration of medical teams is becoming a central topic. The increasing availability of data, models, and smart tools can help health managers to evaluate team collaboration dynamics, teamwork, and team performance determinants. However, the analysis of teamwork, particularly during the real operation of healthcare teams, remains a non-trivial task.
Teams are highly complex and dynamic systems that are generally influenced by a large number of variables and evolutionary paths, e.g., the interactions between team members (individual agents) and their social structures; thus, they are driven to the final outcomes by the unpredictable patterns that emerged from these interactions [7,8,9]. Such characteristics of healthcare teams make them social complex systems; therefore, investigating team dynamics through the lens of complexity theory is a valuable and still underexplored research perspective [10].
Complexity theory regards the identification and analysis over time of complex systems—including health teams—in which the constituent elements give rise to the collective behaviours of the system [11,12]. Such complex systems, as teams, can be described through their structural characteristics (e.g., team member features, behaviours, and interaction dynamics) and modelled as networks of interacting entities [13,14,15]. Hence, network analysis can be useful to describe and analyse the structure and behaviours of several complex systems found in the real world, as healthcare teams systematically explore performance drivers by exploiting concepts such as emergence, adaptability, self-organisation, resilience, and flexibility. In this aim, the rapidly increasing mass of data that has become available in many different healthcare domains contributes to making the empirical investigation of such complex system more and more suitable at affordable efforts [16].
In an attempt to explore this novel direction, this paper aims to discuss the different viewpoints about the application of complexity science and, in particular, the application of network science to teamworking in healthcare. Specifically, we highlight the potential benefits deriving from network science-enabled analysis and we stimulate the discussions regarding future implications and challenges in health environments. This work also tries to shed a light on the applications and potential impacts—in terms of efficiency and effectiveness—of network analysis during health service delivery. The intention is to pave the way for future research in this context by suggesting potential advantages and recognising the challenges and the threats of such an approach.
We corroborate our discussion by providing a real case study in the Breast Unit of an Italian University Hospital. The network analysis of breast surgery teams permitted to understand and assess the influence of teams’ structure and communication on the care performance in the operating rooms, in terms of occurrence of surgical glitches. Case results show that teams should adjust their communication and structure to meet changing situational needs when they face uncertain situations that have varying levels of complexity.
The paper is organised as follows. Section 2 briefly describes the relationship between complex systems, networks, and teamwork in healthcare; Section 3 discusses the implications, challenges, and benefits of network science for investigating teamwork in healthcare; Section 4 shows empirical evidence of network analysis for exploring healthcare services; and, finally, Section 5 concludes the paper, opening new directions and perspectives for both health managers and researchers.

2. Complexity and Teamwork

Ref. [17] confirms that for improving teamwork “the goal must be collaboration, the principle must be complexity, and the activity must be engaged communication”. In accord with this assumption, we will introduce, in the following section, the concept of complexity, how complex systems can be represented, and, finally, how these concepts affect teamwork.

2.1. Complexity and Complex Systems

The complexity theory has found application in many knowledge domains where it usually dispensed valuable methodological and theoretical insight [8,18,19]. Herein, based on the available literature, we discuss the main complexity properties related to networks and teamwork.
Complex systems are inherently incomplete ensembles of entities interacting without distinctive borders, in a non-linear nature, without an accurate (or even, perfect) representation of the system, and with direct and indirect cycles of feedback [12]. These arguments claim that an unavoidable limitation of the representation should be acknowledged [20].
Literature recognises the challenges of identifying future behaviours of a complex system. Such behaviours typically arise from six different complexity science concepts: irreversibility of time, path dependence, sensitivity to initial conditions, emergence and systemness, attractor states, and complex causation [21]. We use such six concepts as a baseline for our discussion and we deeply explain them subsequently in the paper.
Taking into account the concept of time irreversibility, complexity science offers the scientific foundations on which to build the recognition of the plurality of the future and the uncertainty related to this. It recognises that there is no simple relationship between a past trajectory through time and the present situations running to a single identifiable future. Partially related to this concept is path dependence, which is a consequence of nonlinearity and signifies that rules and past interactions impact the future. In other words, the uncertainties that we face can be limited since they are influenced by previous events and we can have early, at least weak, signals on future events by examining the present.
The concept of sensitivity to initial conditions is linked to the idea of weak signals that are early warnings referred to a certain trend. One of the most familiar related concepts is the “butterfly effect”, which is a powerful and simple image of how small initial differences in the starting states can provoke very different outcomes.
The emergence is perhaps one of the most widely known properties [11,12,13,14,15,16,17,18,19,20,21,22]. This phenomenon is related to a rise in a variety of macroscopic states and systemic properties that are unexpected a priori only by the entities in the system. It is a function of hierarchical levels of reality that both affects and is affected by the others; moreover, it indicates the occurrence of new and unexpected events. Thus, it is important to consider the behaviour at the micro and macro level.
Complex systems are exposed to the attractor states. This means that all paths of development that fall within the basin of the attractor have the same future outcome, implying a reiteration of past patterns of development leading to the same outcome. Examples are local cycles of recurrence in stable systems that return into their periods after a perturbation.
A complex causation of events involves more than a single event that influences a cause–effect another event through concomitance. It is related to the concept of self-organised critical systems [12] that are conceived to behave out of equilibrium towards a critical point as an attractor. The entities in the system manage to independently find the critical point by means of non-linearity deriving from interactions between causal factors that lead to an unexpected future.
These six properties highlight the fact that such systems cannot be described considering an analytical paradigm; thus, it is not possible to make predictions. Indeed, in complex systems, the interactions are determined by a list of rules regarding how the dynamics of the system update its states and future interactions, which then lead to new constraints on the dynamic at the next step [12]. In other terms, complex systems are best described by an algorithmic description that considers the evolution of states of the entities in the system, as well as the evolution of their internal states determining the evolution of the system in the future.

2.2. Networks: Mapping the Connected Worlds

In complex systems, interactions are usually non-uniform and heterogeneous, but interactions between elements can be specific [12]. Networks are the preferred tool for mapping such interactions among such elements, keeping track also of the strength, dynamics, and modality of relations. In practice, everything that can be stored in a relational database can be mapped by a network and described by its structure (i.e., nodes (individual agents) and links (their connections)) and its behaviour (i.e., what the network “does” as a result of the interactions among the nodes and links).
Network science is an interdisciplinary field of study which aims to understand the structure, development, and dynamic of networks through different methods and tools attributed to several disciplines such as mathematics, statistics, physics, and computer science [23]. In this respect, it can be considered as an abstraction of observable reality which can explain the performance of real systems since it correlates form with functions and structure with behaviours [24,25].
However, each research field using network science has a diverse working meaning. For example, power engineers analyse networks in terms of electrical power grids; sociologists think of networks as influence diagrams denoting the social interactions among people; marketing business people deem networks as population of buyers; and economists consider networks to analyse economic phenomena. Hence, network science has various terminology and different methods of analysis in each field of research.
Network science contemplates the application of networks to many subfields, e.g., social network analysis (SNA), collaboration networks (bibliographic citations and product marketing), synthetic emergent systems (power grids and the Internet), physical science systems (phase transition and percolation theory), or life science systems (epidemics and genetics).
By considering healthcare teams as complex systems, this paper seeks to foster the discussion about the application of network science for analysing and potentially improving teamwork dynamics.

2.3. Teamwork: An Interconnected World

Teams are defined as a group of two or more individuals working together to achieve indicated and shared goals [4,26]. Typically, members of a team have specialised roles deriving from task-specific competencies, use shared resources, and thus interact by coordinating their actions. As a result, teams and their effective operations turn out to be complex systems.
Moreover, teams perform very different types of functions depending on the specific context and targets. Accordingly, different types of teams face different objectives and demands and, as a result, they come in many different configurations and tend to operate quite differently [27].
Given the high relevance of teams in industrial and service sectors, researchers have developed different frameworks for investigating working teams, most notably the input–processes–output (IPO) model and its evolution input–mediator–output–input (IMOI) model [27,28,29,30,31]. Following the lens of these frameworks, scholars have studied different aspects of teams, such as the role of input, processes/mediators, and outcomes, to understand the potential determinants of team effectiveness in different contexts.
Specifically, inputs describe antecedent factors that enable and constrain team members’ interactions. Inputs include individual team member characteristics (e.g., competencies, experience levels, and personalities), team-level factors (e.g., task structure and external leader influences), and organisational and contextual factors (e.g., organisational design features and environmental complexity). These various antecedents combine to drive team processes, which describe members’ interactions directed toward task accomplishment. Processes are important because they describe how team inputs are transformed into outcomes, i.e., results and by-products of team activity that are valued by one or more constituencies [27]. Broadly speaking, these may include performance (e.g., quality and quantity) and members’ affective reactions (e.g., satisfaction, commitment, and viability).
Although teams have been largely investigated by several authors in literature, methodological concerns still remain in how to systematically and objectively evaluate their different aspects [32,33]. However, taking advantage of smart technologies and novel methodologies, it will be possible to assess teamwork through innovative data-driven approaches [33,34].
Network science tools can be significant in revealing the underlying structure and organisation of teams. Indeed, starting from the idea that teams can be considered as complex systems given that they are composed of different interacting components, we may use network science to observe and analyse their dynamics and performance. For instance, taking into account the interactive team cognition approach [35], team adaptation can be analysed through the interactions among team members that can be evaluated with quantitative measures, such as the social network analysis [36]. Indeed, SNA utilises social network metrics based on different data and can quantitatively evaluate team adaptation [37] in order to understand organisational and team processes, such as knowledge sharing and coordination [38].
In addition, new technologies such as wearable sensors can provide automatic, objective, and real-time measurements of team interactions during the operations of work teams [33,39]. This may enable new perspectives for team network analyses and, then, offer dynamic indications for modifying the ongoing “behaviours” and attitudes of team members to improve team performance [40].
The previously described aspects are particularly valid for healthcare teams, which arise as very complex systems to be analysed [4,6,41]. Furthermore, teams and teamwork play a crucial role in patient care and safety in healthcare systems, e.g., [3,42,43], given the growing number of care activities delivered by teams of health providers [44]. For these reasons, the analysis of healthcare teams and the related proposal of improvement directions, possibly in real time, are particularly relevant. In fact, healthcare team members should adapt their activities with respect to such a complex environment by adjusting interactions and structure to meet different objectives and fluctuating situations [4,5].

3. The Implications, Challenges, and Benefits of Network Science for Health Teamworking

The aim of this paper is to discuss the implications, challenges, and potential benefits of the network science for teams working in the health sector. To achieve this, we draw on the discussion of the six concepts of the complexity science, as reported by [21]: irreversibility of time; path dependence; sensitivity to initial conditions; emergency and systematicity; attracting states; and complex causality (Table 1).
The irreversibility of time is a concept regarding history, intended as a complex evolutionary path of the teams taken to the present thought the past and how they are affected by many influencing factors, such as internal and external relations and interactions, team configuration, accumulated bundle of skills and expertise of providers, stress or fatigue, and past conflicts. Such factors are among the fundamental determinants of team performance. Indeed, the peculiar combination of such variables leads to a single and sometimes unique future of the team and organisation that cannot make simple predictions with complete information about the past conditions. Typically, decisions during the team life cycle and team operations lead to the irreversibility of the state of the organisational system in which teams work. For example, decisions about possible team configurations are essential determinants of the overall team performance, e.g., rostering policy for nurses and providers; education and training of team members, as well as their mutual interactions; scheduling and assignment of tasks that can influence both providers’ specialisation and expertise; and fatigue and working stress.
Path dependence is strongly related to irreversibility of time but mostly refers to the indeterminism of the future of a system, or at least a weak determinism, which is related to the scarce possibility of identifying a finite number of trajectories for the system analysed. The past influences the future, which is true for teams of health providers. Nevertheless, two healthcare teams that perform similarly might have had a very different past and evolution leading to two completely different paths.
A number of drivers in the team life cycle can determine such different paths, including selected team configuration, skills and expertise of team members, their relationships or interaction dynamics, personal experience, work specialisation, connection or interdependence with external actors, changing patient conditions, contextual factors, etc. To detect such trajectories and dependence, analysing the past is a necessary but not sufficient condition, which means that researchers need to be able to continuously collect data from a very complex system, characterised by a huge number of heterogeneous variables.
Sensitivity to initial conditions focuses the attention on weak signal detection [45] and mostly refers to the difficulty in complex systems to detect determined paths or processes since it can be difficult to distinguish randomness and non-randomness in process trajectories; thus, it can be extremely hard to analyse team evolutionary trajectories in healthcare organisations. Teams are highly dynamic systems with a huge number of possible future paths depending on initial conditions, team configuration, growth, matured experience of members, operational tasks, internal/external context factors, changing patient conditions, etc. All these trajectories, mostly singular, can lead to very heterogeneous team behaviours and, in turn, to very different outcomes.
Emergence and systemness is a focal concept for complexity science related to hierarchical layering and nesting level of the systems. This concept has significant implications for the study of teams. Indeed, from the nonlinear interplay between micro- and macro-organisational levels, new patterns can emerge at a higher hierarchical level in a way that are not reducible to the sum of the parts of lower hierarchical levels and, therefore, not amenable to traditional forms of ‘analysis’. For example, the referral process within a practice can evolve over time as team members provide feedback and gain experience [46].
Regarding the systemness, it is related to the presence of several hierarchical levels within the organisation or as the whole organisation since the organisation may be part of a wider network. Healthcare organisations increasingly organise their service by teams of practitioners and are inserted in healthcare ecosystems, i.e., networks of health organisations (hospitals, house assistance organisations, family doctors, etc.). Focusing just on a single level may be misleading and dangerous for understanding complex system behaviours. High-level aggregations cannot be analysed by simply aggregating individual behaviours since non-linear effects exist. The ability to consider both micro- and macro-level analysis (e.g., individual, team, organisation, and district), as well as dynamically aggregating data, patterns, and process outcomes by appropriate real-time business analytics, is really valuable for future studies in order to understand teams and the related performance. Thus, the wide adoption of information systems in health organisations and, more generally, the rise of smart technology, such as wearable sensors, can contribute to providing both researchers and practitioners with a huge amount of data—potentially Big Data—about teamwork in real time, as well as new enhanced computational data analysis and visualisation capabilities. Such data and novel capabilities may enable a dynamic analysis of teams and thus effective real-time management.
The concept of attractor states is mostly opposed to the previous ones and refers to specific conditions, making the future system outcome deterministic. Different evolutionary trajectories and characteristics of the system, independent of their past, can obtain the same outcome or converge into the same final state if they share the same attractor state. In health teamwork analysis, for example, the presence of an attractor can be related to the detection of a significant driver related to team members (leadership) or a specific network or team configuration, emergent coordination patterns or interaction dynamics, evolving health technologies, as well as individual behaviour (possibly explaining the outcome or performance of the team).
Finally, complex causation refers to the interaction between possible concomitant causes, leading to a consequence, outcome, or performance. For health teams, it means that the future state of the team and the team performance are not simply conjunctions of the previous states and transition events, or simply due to the cause–effect relationship, but rather due to a complex non-linear domino effect, which is typical in this domain. Team interaction and collaboration dynamics, during and beyond work operations, are typically characterised by non-simple cause–effect relations, whose understating can greatly benefit from an appropriate model of analysis. Complex systems and, in particular, network theory can be of great support for such understanding.
We consider a team as a social entity in which social relationships are interactions fostering sense-making, learning, improvisation, and other functions [46,47]. Such teams are embedded in organisations where plenty of different practices and knowledge shape a variety of different configurations which are difficult to map in a single coherent conceptual framework.
Building on complex analysis, network representations can provide significant advantages to those organisations, in particular hospitals and healthcare centres, which own a great amount of data and benefit from the opportunity to extract much more information than it is reasonable to imagine. Network science tools are indeed useful to explain the complex dynamics as well as to extrapolate information flowing through the different layers of organisations, strategies, and knowledge, and across macro, meso, and micro levels of observation.
Complex analysis also makes it possible to understand structures and functions under a new perspective, which potentially allows for the introduction of innovative systems, such as novel technology or strategies used to meet various conditions which are usually difficult to conceptualise using standard tools [48].
Thus, the use of networks to represent complex systems is motivated by the large availability of methodologies, measures, tools, and software [13,14,49]. Through networks analysis, it is possible to recognise many different aspects of health-related systems and adopted measures can be easily transformed into concepts [25,50]; moreover, the emergence of hidden patterns or weak signals can be detected by means of consolidated theories. Additionally, the progress in data availability, computing power, and appropriate algorithms can make the systems easier to understand in the future.
There is a current tendency to rely on artificial intelligence or on machine learning to obtain information from Big Data currently available [51,52]. These data-driven approaches are fantastic methods for recognising and learning patterns in health environments, but their results may be hard to interpret. Indeed, making sense of the patterns discovered and linking them with possible underlying mechanisms may be very hard in such a context [12]. The use of complexity enables us to overcome such issues thanks to its capability in understanding co-evolving systems.
Knowledge management becomes of crucial importance since team working in the health environment should therefore adopt the new paradigm of complexity. Thus, learning can help to achieve excellent performance, and continuous improvement can be achieved considering multiple sources of knowledge as well as an inclination to accept new cultural paradigms.
Outcomes can be created by involving the exchange, sharing, and usage of information among network members. This can enhance members’ access to sources of knowledge, allow information mechanism tracing, and facilitate the assimilation and awareness of information among members of the system. Knowledge flow will also allow members to diversify and improve access to information and know-how, as well as diffuse best practices, business experience, projects, and reports.

4. Case Study

4.1. Case Study Context and Analysis

In this section, we propose an empirical case study to support our conceptualisation and to provide an example of how network analysis methods can be exploited to analyse the teamwork dynamics of health teams and to improve the decision-making process.
We collected data from 75 breast surgeries in the Breast Unit of an Italian University Hospital. All cases underwent breast quadrantectomy or breast mastectomies related to cancer problems and were chosen randomly. These surgeries tend to present quite a high level of task routineness [53], with the procedures being well defined beforehand.
Every breast surgery is carried out by two to four surgeons, assisted by two anaesthesiologists, one scrub nurse, and one assistant nurse. The surgeons involved in each surgery are planned in a weekly unit-planning meeting and are defined based on their availability and, mostly, on who followed the patient in the diagnostic phases.
To study the surgical team composition and its influence on performance, we collected all the data related to the surgeons taking part in each surgery under investigation. In the end, we collected and analysed 212 surgeon distinct recordings for about 110 h of surgery observed.
In addition, we also gathered the main features of the surgeries such as the duration, the size of the operating team, and the number of people present in the operating room.
Finally, the surgical performance was evaluated through the occurrence of surgical glitches as reported by the surgical register, given that providing a safe and effective operation is the main goal of surgery and that a surgical glitch may have a highly relevant repercussion on patient health and on hospital expenditure.
The details on network building and analysis are provided in Appendix A, while the main results of the investigation are presented in the following section.
To summarise, the data collected were used to build a network composed of 75 surgeries, which constitute the nodes, and 1236 links meaning that two nodes are connected if at least one surgeon took part in both surgeries. Such a network is depicted on the right side of Figure 1.
As reported in the Appendix A section, we obtained both the network of the individuals’ interactions and the network of teams. We decided to analyse the latter since the Breast Unit is composed of a limited number of surgeons; thus, the network is not fully significant, as such a network has only 12 nodes. In cases where the staff is more numerous, it is possible to extend the analysis to the individual network.

4.2. Case Study Findings

This section reports the main findings we obtained in the case study following the procedures described in Appendix A. Thus, for more details on the methodology and measurements exploited, please refer to such section.
Figure 1 displays the plot of the surgery network (left panel) and the correlations between glitches and centrality measures (right panel). Such values were computed by means of the classical Pearson correlation.
The first main observable network characteristic is the distribution of the degree across the network. It results in a random distribution with a mean of 32.96 connections for each node. The absence of any notable degree distribution (e.g., log-normal, etc.) highlights the fact that the network lacks the emergence of hubs, i.e., a similar number of surgeons have operated and an excessive unbalanced workload does not emerge. Since this latter may be identified as a problem associated with incidents [1,54,55], we cannot sustain the main correlation between glitches and team fatigue.
Another argument which brings us in the direction of the absence of preferential staff in terms of an elite subgroup of surgeons as well as in terms of team mix—seniors with other senior members instead of seniors with junior members—is a neutral value of the degree assortativity (see Appendix A for further details).
In this case study, the randomness of the degree distribution raises some challenges for the understanding of deviations from the expected path and the unveiling of self-organised patterns, mainly caused by the difficulties in knowing which dyads dominate in the network.
However, the centrality measures provided interesting results, emphasising a relationship between surgical team network and surgical performance, evaluated in terms of glitch occurrence. Specifically, the negative correlation of transitivity and the positive correlation of betweenness centrality (see Figure 1, right panel) with the glitches indicate that the emergence of stable groups of surgeons might not be a good strategy for improving surgical performances, at least in high routine surgery. These measures appear to reveal that a low variability in the operating team composition—i.e., a potential attractor state—establishes a path dependence that increases the probability of surgeries to experience a glitch in the future. Thus, surgeons should work with different colleagues, instead of forming sub-groups that work continuously together.
The reasons behind such evidence may be related to two main aspects. Firstly, if the surgeons taking part in surgery have had different surgery experiences, they will be able to face a wide spectrum of potential and unplanned issues [56,57]. In addition, by collaborating with different colleagues, surgeons can observe and learn relevant “best practices” to apply in the future [58,59]. The second reason is related to the fact that the operating team very often establishes a very high “intimacy” so that they tend to pay less attention to the specific tasks and to be more prone to distractions, increasing the probability to face a glitch [1,60,61]. In these cases, the team members might introduce a novel complex cause–effect relationship that alters the dynamics and, finally, the team performance. This aspect seems to assume a particularly significant role in routine surgeries, as breast surgery [4,62,63,64,65].

4.3. Managerial Implications

The results obtained and their interpretations provide hospital managers with relevant managerial implications which are not immediately available considering the classical statistical methods. Indeed, network analysis permits to highlight hidden patterns of cause and effect in a very sophisticated way, providing managers with a further point of view on their baseline of data.
The findings obtained in the case study were also debated with the hospital managers, the Brest Unit managers, the surgeons, and the rest of the staff (i.e., anaesthesiologists, scrub nurses, and other assistant nurses). This discussion permitted a sound interpretation of the results and, most of all, an evaluation of the best potential solutions to improve teamworking of surgical teams.
The two main managerial indications deriving from it are the following.
First, health managers should favour a greater rotation of the surgery team composition avoiding, voluntarily or not, to form “sub-groups” of practitioners that work continuously together. This solution provides surgical teams with the ability to face a wider spectrum of potential problems and the ability to maintain a higher level of attention. These indications may be valid not just for breast surgery but, more in general, for routine surgeries.
Moreover, Breast Unit managers should pay attention to the task assignment during the activity planning of the unit in order to better balance surgery and non-surgical activities (e.g., diagnostic visits, ward activities, check-up visits, etc.) for each doctor, promoting variety, e.g., turnovers. Thanks to a more appropriate surgical workload, the doctors should be less subject to the stress induced by physical and psychological overload conditions, improving the final performance of surgeries.
Although the analysis approach can be applied in many different health contexts, the managerial implications described here tend to be valid only for the breast surgery and, more generally, for the routine surgery.

5. Discussions on Network Science for Teamwork

Our findings help to deepen the discussion of the implications, challenges, and benefits deriving from network science for teams working in the health sector, with the final aim of revealing new directions and means for studying healthcare teamworking. In parallel with Table 1 (Section 3), implications, challenges, and benefits are discussed in light of the six complexity science concepts—i.e., irreversibility of time, path dependence, sensitivity to initial conditions, emergence and systemness, attractor states, and complex causation [21].
Table 2 summarises, for each of the six concepts above, the results, the consequences, and the benefits of the network analyses carried out. The reader should consider such table as a “checklist” of the possible outcome of the analysis of healthcare teams through network science.

6. Conclusions

The contingent and evolutionary nature of complex systems, such as healthcare organisations, entails that our understanding of the system has to be continually updated and revised [66]. Indeed, the turbulence and dynamism which characterise such a complex operational environment ask for continuous changes to the frames of the adopted interpretative models as the boundaries of complex systems cannot be identified objectively, completely, and definitively [20].
Looking at the more specific literature, to our best knowledge, there is not yet a general and rigorous framework for the application of network science to team studies in healthcare. In the attempt to provide some first elements of such a framework, the main contribution of this paper is to set out a number of explicit implications, challenges, and benefits for teamwork in healthcare derived from network science (See Table 1 and Table 2), which can successfully represent such complex systems. Moreover, we highlighted a list of enabling concerns to consider for addressing network science in this field. Finally, empirical evidence provided by a real case study shows the potential benefits deriving from network science-enabled analysis in such a context. Though the results obtained in the case study can be considered specific for the breast surgery, the approach of analysis proposed may be applied to analyse healthcare teams in different settings (e.g., emergency department teams, multidisciplinary cancer teams, laparoscopic surgery teams).
Undoubtedly, the efficiency and effectiveness of healthcare systems may widely benefit from a complexity theory lens and, specifically, from the application of network science. Indeed, network theory and related methods/tools can offer new interpretative and predictive models to understand team behaviours and performance drivers. In this aim, effective tools supporting health providers, based on network science, are expected to be highly desirable. However, although technologies are very critical to support real-time data collection and analysis, a proper culture and an enabling environment can be essential in any health organisation for exploiting network science tools and to thrive with a valuable contribution (at all levels).
This research is not exempt from limitations. Drawing on a single case study, our case results might be affected by the specific application and cultural context. This is a common issue for many studies involving human resources and their behaviours, and clearly limits the results from being generalised [67]. Moreover, even though the number of network tools and indicators considered was high, the study is clearly not conclusive. Other significant implications, challenges, and benefits of network science application for teamwork, which are not discussed in Table 2, might exist.
As a future development, it might be interesting to increase the network aspects observed and to repeat this study in different application and cultural contexts to confirm our findings and to strengthen the practical recommendations. In addition, we urge researchers to apply the approach of analysis used in the case study for studying different healthcare teams, e.g., the emergency teams, to further confirm the effectiveness and the extensibility of such approach. Finally, future studies should investigate the possibility of implementing network methods, models, and tools into health decision support systems for supporting managers and providers in daily and long-term decisions regarding the management of work teams.

Author Contributions

Conceptualization, D.A., G.F., A.I. and A.S.; Investigation, D.A., G.F., A.I. and A.S.; Methodology, D.A., G.F., A.I. and A.S.; Writing—original draft, D.A., G.F., A.I. and A.S.; Writing—review & editing, D.A., G.F., A.I. and A.S. All authors contributed in equal parts to the manuscript. All authors have read and agreed to the published version of the manuscript.

Funding

This research received no external funding.

Institutional Review Board Statement

Informed consent was obtained from all subjects involved in the study.

Informed Consent Statement

The study was conducted in accordance with the Declaration of Helsinki.

Data Availability Statement

The data presented in this study are available on request from the corresponding author. The data are not publicly available due to privacy reason.

Conflicts of Interest

The authors declare no conflict of interest.

Appendix A

The mathematical description of networks is found in graph theory [68]. A graph G = (V, E) is composed of a set V of n nodes, which represent the elements of the system, and a set E of m links that define the interactions between nodes. We refer to a node by an index i, allowing a one-to-one correspondence between an index and a node.
The graph representation allows for the calculation of several measures that reveal the network characteristics. As the network science approach includes social network analysis (SNA), this paper considers the main centrality values [49], which represent the relative importance of a node within a graph, with the assertion that a higher centrality index of a node can increase its perceived centrality in the graph. Moreover, centrality measures assess the involvement of nodes in contributing to the cohesiveness of the network [69,70].
The concept of centrality has an inherent ambiguity; there is no point in including all measures in one method [71]. Deciding which option to choose requires consideration of the specificity of the measures and the requirements of different applications. There are several quantities describing the centrality that depend on the type of statistics on which they are based; the most commonly used are reported in Table A1.
To build our networks, we considered a database of surgeries where we extracted all the teams of surgeons for each of them. For each surgery, the database reports the main characteristics, such as the team composition, the duration, and the patient age. To be noted that all the sensitive data were anonymised to be complied with the ethical protocols. In addition, we respected the privacy of the study participants since we did not observe the operating activities carried out during the surgery but the team composition.
In fact, we restricted our analysis to the data useful for building the “networks”, i.e., the corresponding team of participants (surgeons, nurses, etc.), and if in those surgeries was reported a glitch (as a binary variable, 0 no glitch, 1 if a glitch occurred). Since data were a simple merge of teams and binary variables, and since the outcome was a network, it was not necessary any pre-processing procedures, as, for instance, those reported in [72].
Such data were used to build a bipartite network in which there are the 12 surgeons in one side and 75 surgeries on the other side (see the central network in Figure A1). A link appears when a surgeon took part to a surgery; thus, the degree of a node on the right side is the number of surgeons within the team. The data processing, the network analysis, and all simulations were conducted using the software R [73] with the igraph package [74] and some other package for data manipulation and for correlations. In particular, we computed correlations using the package inspectdf available on CRAN (https://cran.r-project.org/web/packages/inspectdf/index.html, accessed on 20 April 2022).
Note that surgeons who took part in a surgery where a glitch occurred on the left side are reported as red node, and nodes on the right side correspond to surgeries where a glitch happened.
It is a common procedure to study bipartite networks projecting them into one of their partitions [75]. The procedure is very easy, and nodes of one partition are connected to each other according to their connection pattern to nodes on the other partition. Figure A1 reports the left and the right projections of the starting network: the bottom one (bottom in Figure A1) is composed of surgeons—a link can appear when the joints take part in a same surgery (34 links in total), and the top one (top in Figure A1) is composed of surgeries—a link can appear when two nodes are connected if at least one surgeon took part in both surgeries (1236 links in total). Note that the left network is weighted since it reports the number of common surgeons and has nodes of a colour gradient proportional to the number of glitches, i.e., green when no glitches occurred and dark red when the maximum number of glitches occurred for the correspondent surgeon. We considered a glitch any medical/procedural problem that might affect the patient (e.g., for example small bleedings, incorrect counting of gauzes, imperfect stitching, and defects in sampling for cancer tests). In our analysis, we mainly focused on the right projection (surgeries) for which we computed the main centrality measures, namely the degree centrality, transitivity, closeness centrality, betweenness centrality, eigenvector centrality, PageRank, Bonacich index, authority, and, finally, coreness. In Table A1, we report a short glossary of the used centrality measure with their meaning. For further details, please refer to [49,76].
In addition, we computed the degree distribution which has basically a random shape with a mean of 32.96 connections for each node. The absence of any notable degree distribution (e.g., log normal, etc.) highlights the fact that our network lacks hubs, i.e., surgeons operated in a similar number of surgeons.
The absence of degree correlation is also confirmed by another measure called degree assortativity [77], which is computed as the degree–degree Pearson correlation coefficient r. A network is disassortative when a tendential link connects two nodes of different degree, then r is negative and has a value which lies in the range −1 ≤ r < 0; a network is assortative when a tendential link connects two nodes of similar degree, then r is positive and has a value which lies in the range 0 < r ≤ 1; and, finally, a network is neutral if r = 0. In our test, the network has degree assortativity r = 0.016; thus, we can consider it as neutral.
Table A1. A short glossary of centrality measures.
MeasureDefinitionMeaning
Degree centrality (ki)The number of links incident upon a node, which can be interpreted as the neighbourhood size of each member within the network.This highlights the immediate risk of a node catching, whatever is flowing through the network. It quantifies how well it is connected to the other elements of the graph. The degree centrality is an indicator of the spread of node connectivity along the graph and is a crucial gauge in defining the network organisation.
Transitivity (Ci)For any node i is the fraction of the connected neighbours of i.It determines the capacity of link creations among neighbours, i.e., the tendency in the network to create stable groups.
Closeness centrality (CC)The natural distance between all pairs of nodes is defined by the length of their shortest paths. Thus, the more central a node is, the lower its distance is to all other nodes.This value measures how long it takes to spread information from a member to all others sequentially.
Betweenness centrality (CB)The number of times a node acts as a bridge along the shortest path between two other nodes.This measure reveals the intermediary members that are essential for connecting different regions of the network.
Eigenvector centrality (CE)The influence of a node in a network according to the number and the quality of its connections.Indeed, a node with a smaller number of high-quality links has more power than one with a larger number of mediocre contacts.
Pagerank A node has high rank if the sum of the ranks of its in-edges is high.It quantifies the overall importance of a component based on the relative importance of the components it is part of.
Bonacich index (CBP)The power of a node is recursively defined by the sum of the power of its alters.Positive values imply that members become more powerful as their alters, i.e., neighbours, come to be more powerful, while negative values imply that members are more powerful only as their alters become weaker, as occurs in competitive or antagonistic relations.
Authority (Kleinberg centrality scores) (CA)A node is an authority if it is linked by hubs; it is a hub if it links to authorities.A node is important if it receives many links from other important sources.
CorenessThe k-core of the graph is a maximal subgraph in which each vertex has at least degree k. The coreness of a vertex is k if it belongs to the k-core but not to the (k + 1)-core.It helps identify tightly interlinked core areas in a network.
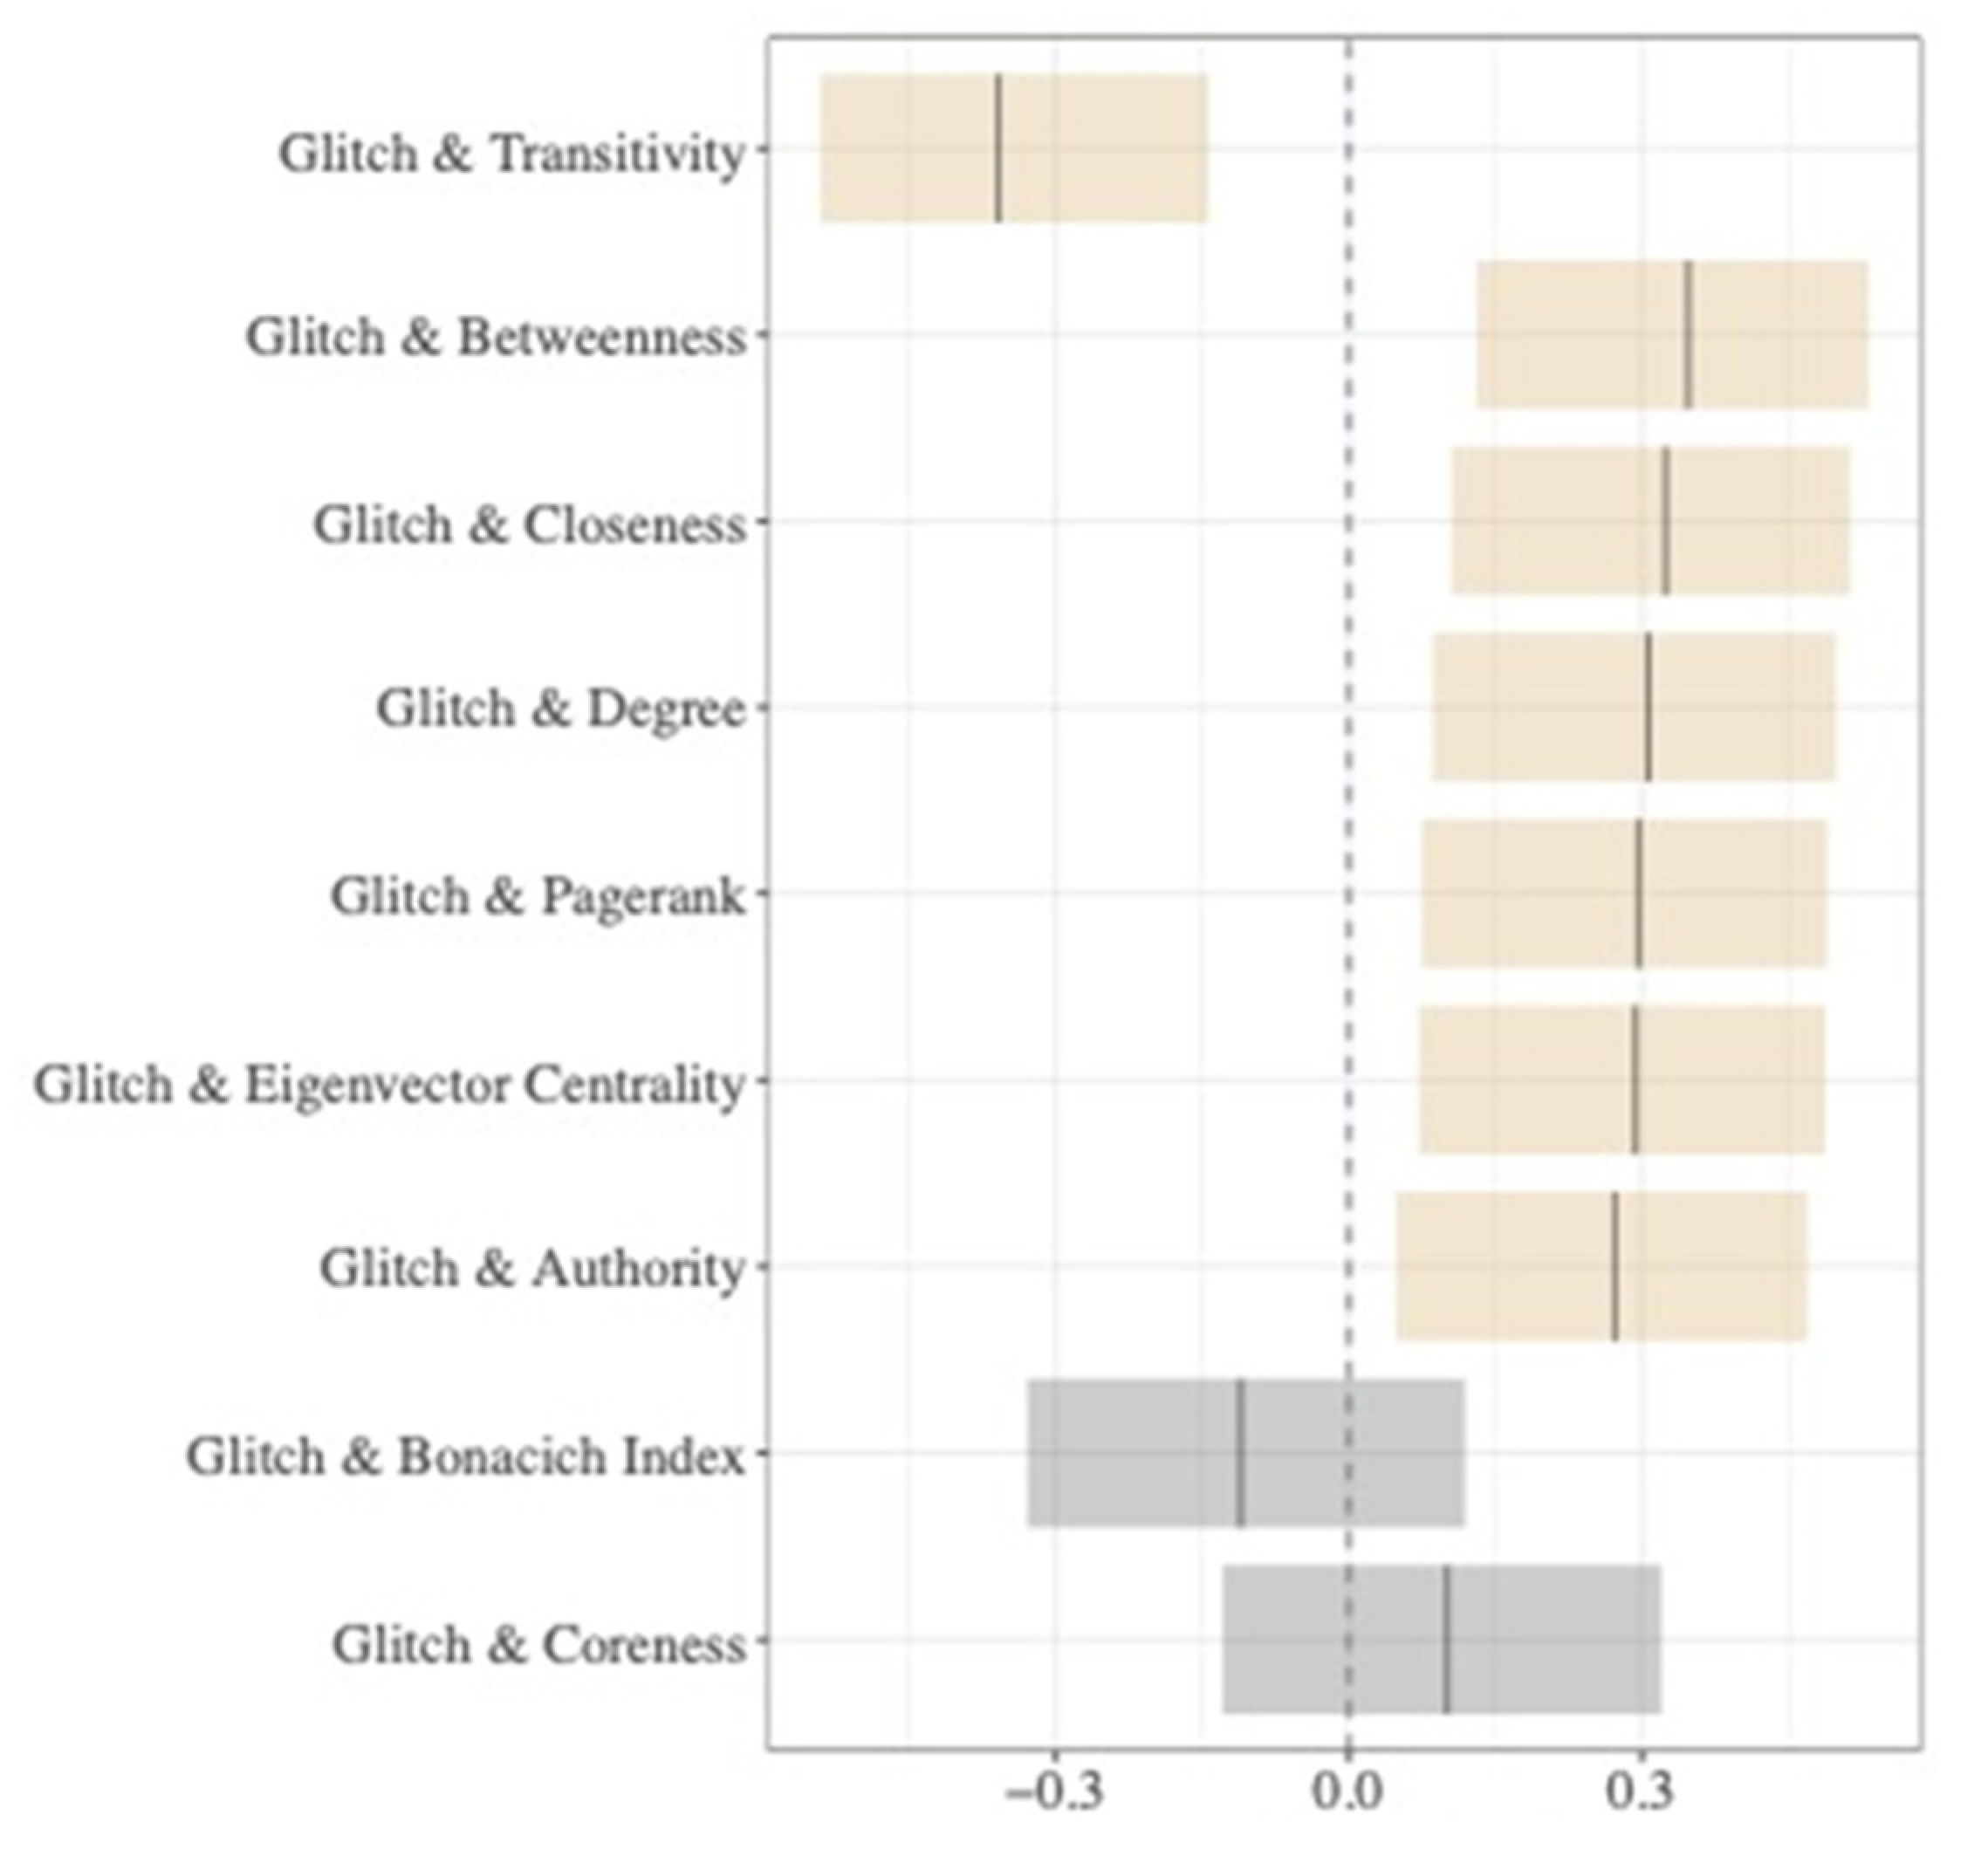
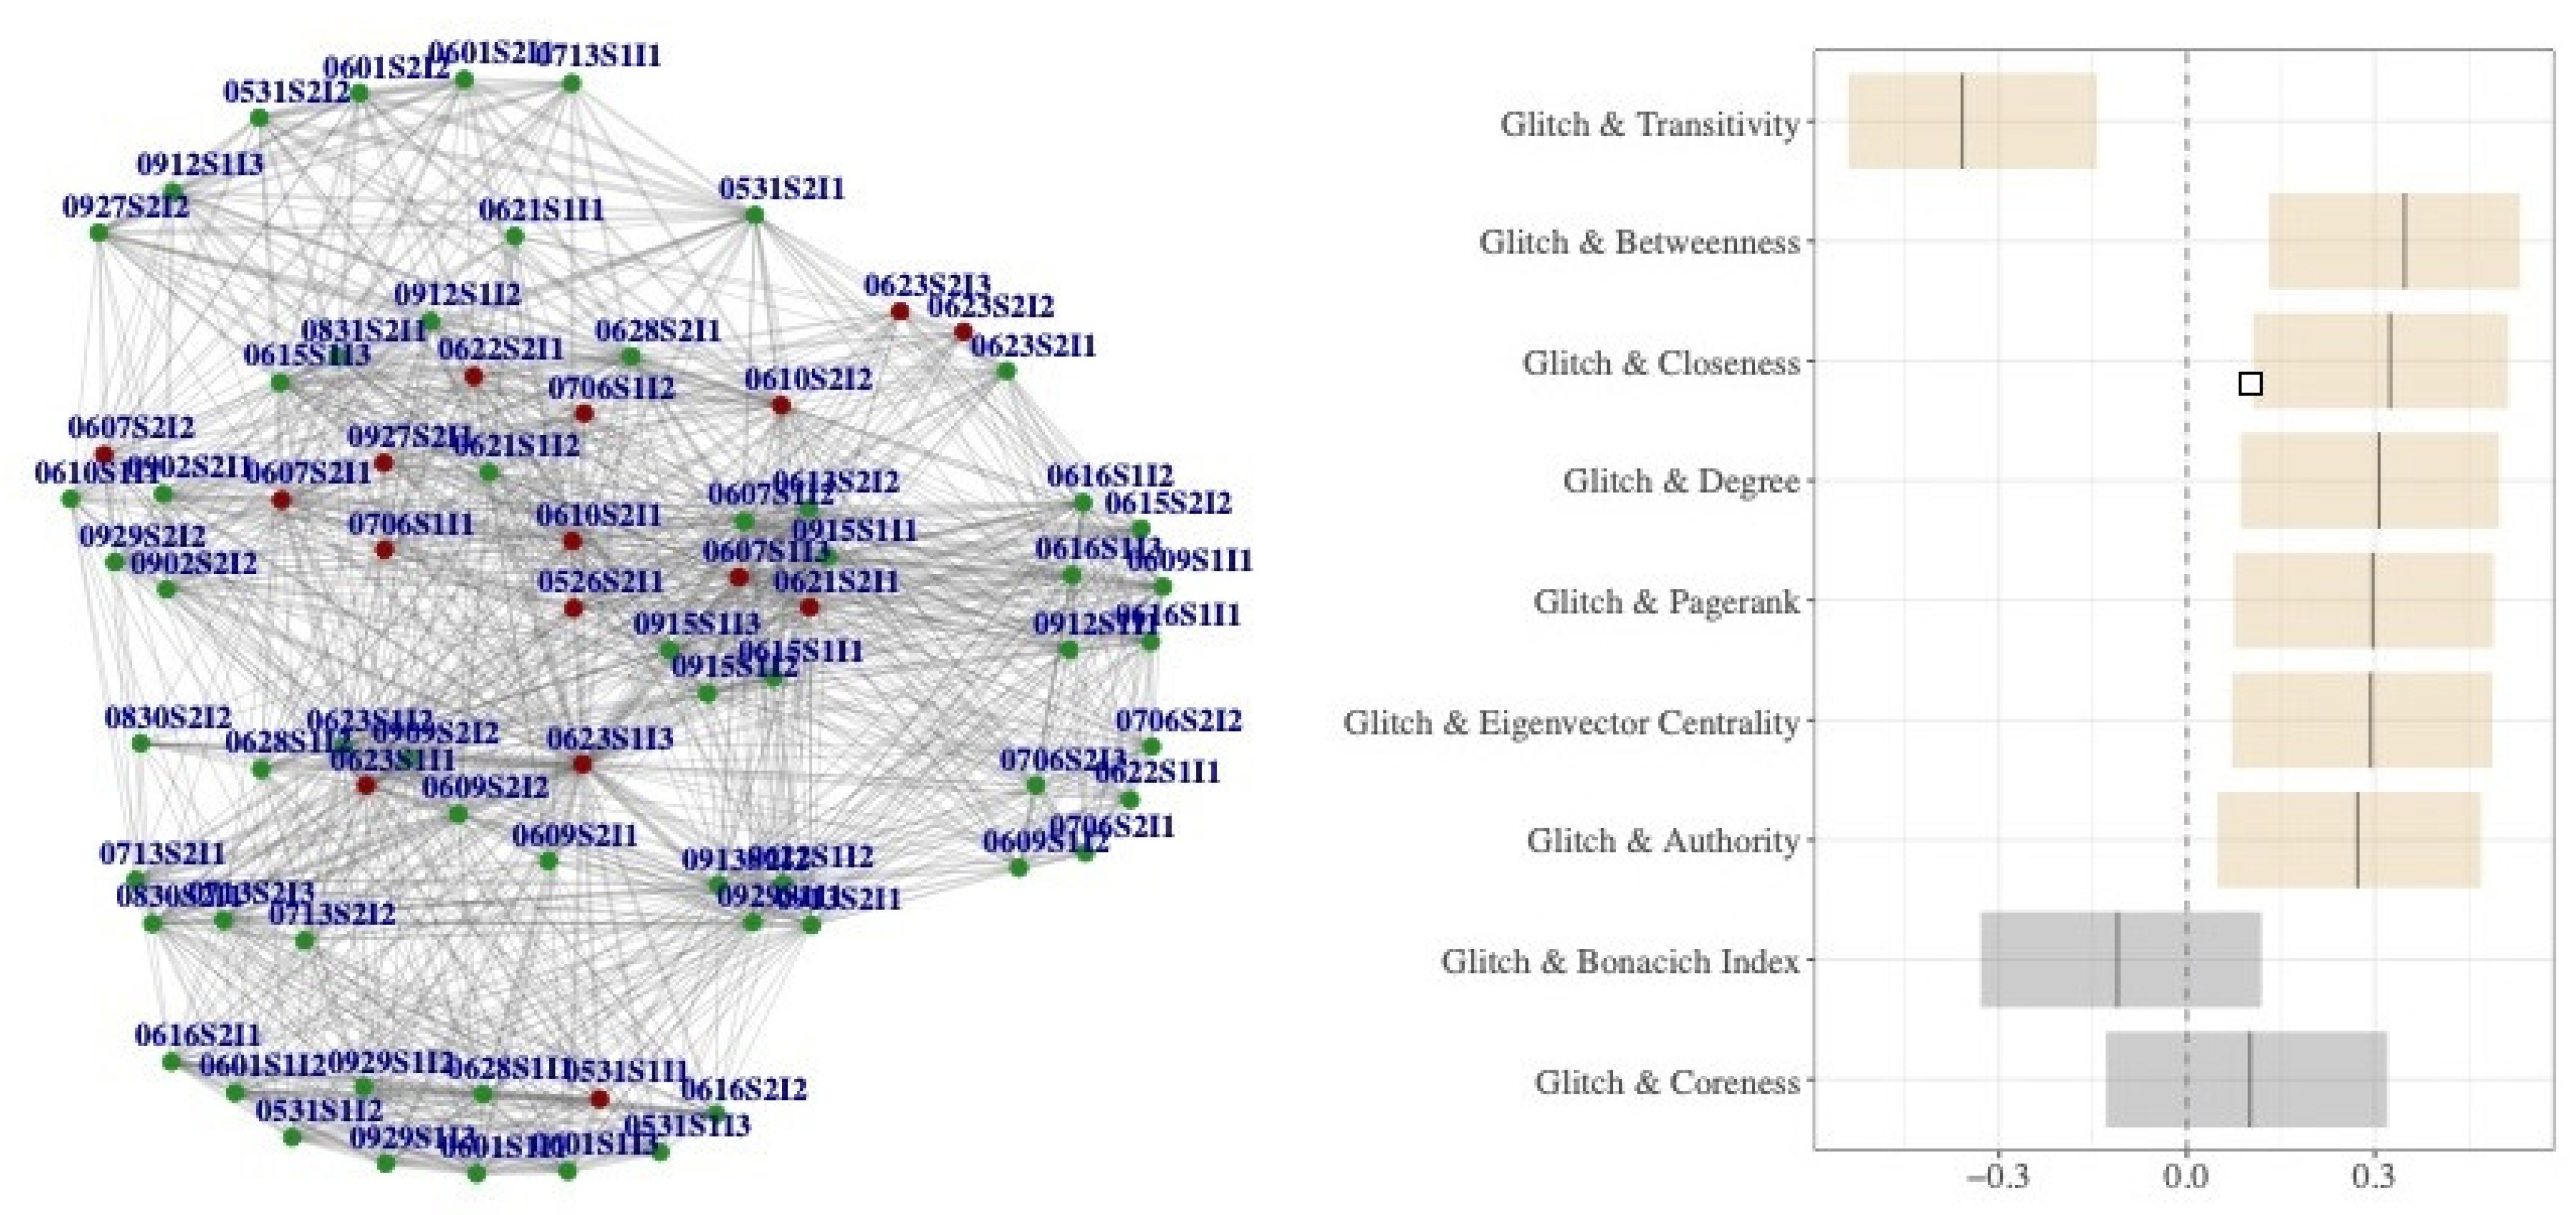
Figure A1. The two-mode starting network (central network), the top one-mode projection of doctor interactions (top), and the bottom one-mode projection of the surgery rooms interactions (bottom).
Applsci 12 05841 g0a1
In order to discover the reasons behind a glitch, we studied the relationships between the occurrence of glitch and centrality measures via Pearson correlation, and Figure A2 shows that centrality measures as transitivity negatively correlates with glitches, while betweenness, closeness, degree, PageRank, and eigenvector centrality positively correlate with glitches. Finally, the Bonacich index and coreness are not significant.
Figure A2. Correlations between glitches and centrality measures. In orange, the values for which a p-value is less than 0.05 (see Table A2 for the p-values).
Applsci 12 05841 g0a2
Table A2 shows the numerical values for Pearson correlation, also considering the p-value and the lower and upper values of the confidence interval for the correlations.
We statistically validate the obtained correlations by computing probability p of finding higher values considering a standard procedure [78] in which we compare a null model of our network in which all links are randomly rewired.
Table A2. Pearson correlations.
Glitch vs. CentralityCorrp-ValueLowerUpperp
1Glitch–transitivity−0.3590.00158−0.542−0.1430/1000
2Glitch–betweenness0.3480.002240.1310.53367/1000
3Glitch–closeness0.3240.004530.1050.5130/1000
4Glitch–degree0.3070.007440.08570.4990/1000
5Glitch–pagerank0.2960.009850.07430.4901000/1000
6Glitch–eigenvector centrality0.2940.01060.07140.488770/1000
7Glitch–authority0.2720.01810.04830.470994/1000
8Glitch–Bonacich index −0.1110.344−0.3300.119276/1000
9Glitch–coreness0.1010.390−0.1290.320995/1000
The procedure consists in considering the degree sequence of our network, i.e., the non-decreasing list of all the degree, and then creates 1000 networks via random rewiring of connections by preserving the degree sequence. For each of them, we recomputed the Pearson correlation, and considered the glitches still present in the same nodes in the original configuration.
In Table A2, we report a column where we counted the times in which the correlation was higher with respect to the original values (see column of p). As it is possible to see, for transitivity, closeness, and degree, it never happens that a random ensemble performs better than in the original case, while for betweenness it happens in a very few cases. These values highlight the fact that surgeons behave under a human agency which captures non-linear interactions; thus, the above-reported measures are meaningful in order to understand team behaviours.

References

  1. Wheelock, A.; Suliman, A.; Wharton, R.; Babu, E.D.; Hull, L.; Vincent, C.; Sevdalis, N.; Arora, S. The impact of operating room distractions on stress, workload, and teamwork. Ann. Surg. 2015, 261, 1079–1084. [Google Scholar] [CrossRef] [PubMed] [Green Version]
  2. Chang, H.T.; Lin, C.C.; Chen, C.H.; Ho, Y.H. Explicit and implicit team coordination: Development of a multidimensional scale. Soc. Behav. Personal. Int. J. 2017, 45, 915–929. [Google Scholar] [CrossRef]
  3. Brubakk, K.; Svendsen, M.V.; Deilkås, E.T.; Hofoss, D.; Barach, P.; Tjomsland, O. Hospital work environments affect the patient safety climate: A longitudinal follow-up using a logistic regression analysis model. PLoS ONE 2021, 16, e0258471. [Google Scholar] [CrossRef] [PubMed]
  4. Manser, T. Teamwork and patient safety in dynamic domains of healthcare: A review of the literature. Acta Anaesthesiol. Scand. 2009, 53, 143–151. [Google Scholar] [CrossRef]
  5. Berry, J.C.; Davis, J.T.; Bartman, T.; Hafer, C.C.; Lieb, L.M.; Khan, N.; Brilli, R.J. Improved safety culture and teamwork climate are associated with decreases in patient harm and hospital mortality across a hospital system. J. Patient Saf. 2016, 16, 130–136. [Google Scholar] [CrossRef] [PubMed]
  6. Dinh, J.V.; Schweissing, E.J.; Venkatesh, A.; Traylor, A.M.; Kilcullen, M.P.; Perez, J.A.; Salas, E. The Study of Teamwork Processes within the Dynamic Domains of Healthcare: A Systematic and Taxonomic Review. Front. Commun. 2021, 6, 3. [Google Scholar] [CrossRef]
  7. Antonacopoulou, E.; Chiva, R. The social complexity of organizational learning: The dynamics of learning and organizing. Manag. Learn. 2007, 38, 277–295. [Google Scholar] [CrossRef]
  8. Andersson, C.; Törnberg, P. Wickedness and the anatomy of complexity. Futures 2018, 95, 118–138. [Google Scholar] [CrossRef]
  9. Brešan, M.; Erčulj, V.; Lajovic, J.; Ravljen, M.; Sermeus, W.; Grosek, Š. The relationship between the nurses’ work environment and the quality and safe nursing care: Slovenian study using the RN4CAST questionnaire. PLoS ONE 2021, 16, e0261466. [Google Scholar] [CrossRef]
  10. Turner, J.R.; Baker, R.M.; Romine, K. Complex Adaptive Team Systems (CATS): Scaling of a Team Leadership Development Model. In Leadership; IntechOpen: London, UK, 2019. [Google Scholar]
  11. Funtowicz, S.; Ravetz, J.R. Emergent complex systems. Futures 1994, 26, 568–582. [Google Scholar] [CrossRef]
  12. Thurner, S.; Hanel, R.; Klimek, P. Introduction to the Theory of Complex Systems; Oxford University Press: Oxford, UK, 2018. [Google Scholar]
  13. Barabási, A.-L. Network Science; Cambridge University Press: Cambridge, UK, 2018. [Google Scholar]
  14. Newman, M. Networks; Oxford University Press: Oxford, UK, 2018. [Google Scholar]
  15. Russell, M.G.; Smorodinskaya, N.V. Leveraging complexity for ecosystemic innovation. Technol. Forecast. Soc. Chang. 2018, 136, 114–131. [Google Scholar] [CrossRef]
  16. Hassanien, A.E.; Azar, A.T.; Snasael, V.; Kacprzyk, J.; Abawajy, J.H. Big Data in Complex Systems; Springer International Publishing: Berlin/Heidelberg, Germany, 2015. [Google Scholar]
  17. Bokeno, M. Complexity: An alternative paradigm for teamwork development. Dev. Learn. Organ. Int. J. 2008, 22, 7–10. [Google Scholar] [CrossRef]
  18. Vasileiadou, E.; Safarzyńska, K. Transitions: Taking complexity seriously. Futures 2010, 42, 1176–1186. [Google Scholar] [CrossRef]
  19. Cilliers, P.; Nicolescu, B. Complexity and transdisciplinarity–Discontinuity, levels of Reality and the Hidden Third. Futures 2012, 44, 711–718. [Google Scholar] [CrossRef]
  20. Cilliers, P. Knowledge, limits and boundaries. Futures 2015, 37, 605–613. [Google Scholar] [CrossRef]
  21. Derbyshire, J. The implications, challenges and benefits of a complexity-oriented Futures Studies. Futures 2016, 77, 45–55. [Google Scholar] [CrossRef] [Green Version]
  22. Corning, P.A. The Re-Emergence of “Emergence”: A Venerable Concept in Search of a Theory. Complexity 2002, 7, 18–30. [Google Scholar] [CrossRef]
  23. Börner, K.; Sanyal, S.; Vespignani, A. Network Science. Annu. Rev. Inf. Sci. Technol. 2007, 41, 537–607. [Google Scholar] [CrossRef]
  24. Lewis, T.G. Network Science: Theory and Applications; John Wiley & Sons, Inc.: Hoboken, NJ, USA, 2009. [Google Scholar]
  25. Cerqueti, R.; Ferraro, G.; Iovanella, A. A new measure for community structure through indirect social connections. Expert Syst. Appl. 2018, 114, 196–209. [Google Scholar] [CrossRef] [Green Version]
  26. Brannick, M.T.; Prince, C. An overview of team performance measurement. In Team Performance Assessment and Measurement; Psychology Press: London, UK, 1997; pp. 15–28. [Google Scholar]
  27. Mathieu, J.; Maynard, M.T.; Rapp, T.; Gilson, L. Team effectiveness 1997–2007: A review of recent advancements and a glimpse into the future. J. Manag. 2008, 34, 410–476. [Google Scholar] [CrossRef] [Green Version]
  28. McGrath, J.E. Social Psychology: A Brief Introduction; Holt, Rinehart & Winston: New York, NY, USA, 1964. [Google Scholar]
  29. Cohen, S.G.; Bailey, D.E. What makes teams work: Group effectiveness research from the shop floor to the executive suite. J. Manag. 1997, 23, 239–290. [Google Scholar] [CrossRef]
  30. Ilgen, D.R.; Hollenbeck, J.R.; Johnson, M.; Jundt, D. Teams in organizations: From input-process-output models to IMOI models. Annu. Rev. Psychol. 2005, 56, 517–543. [Google Scholar] [CrossRef] [PubMed] [Green Version]
  31. Kozlowski, S.W.; Ilgen, D.R. Enhancing the effectiveness of work groups and teams. Psychol. Sci. Public Interest 2006, 7, 77–124. [Google Scholar] [CrossRef] [PubMed] [Green Version]
  32. Schmutz, J.; Manser, T.D. Do team processes really have an effect on clinical performance? A systematic literature review. Br. J. Anaesth. 2013, 110, 529–544. [Google Scholar] [CrossRef] [Green Version]
  33. Chaffin, D.; Heidl, R.; Hollenbeck, J.R.; Howe, M.; Yu, A.; Voorhees, C.; Calantone, R. The promise and perils of wearable sensors in organizational research. Organ. Res. Methods 2017, 20, 3–31. [Google Scholar] [CrossRef]
  34. Rosen, M.A.; Dietz, A.S.; Yang, T.; Priebe, C.E.; Pronovost, P.J. An integrative framework for sensor-based measurement of teamwork in healthcare. J. Am. Med. Inform. Assoc. 2014, 22, 11–18. [Google Scholar] [CrossRef] [Green Version]
  35. Cooke, N.J.; Gorman, J.C.; Myers, C.W.; Duran, J.L. Interactive team cognition. Cogn. Sci. 2013, 37, 255–285. [Google Scholar] [CrossRef]
  36. Barth, S.; Schraagen, J.M.; Schmettow, M. Network measures for characterising team adaptation processes. Ergonomics 2015, 58, 1287–1302. [Google Scholar] [CrossRef]
  37. Houghton, R.J.; Baber, C.; Mcmaster, R.; Stanton, N.A.; Salmon, P.; Stewart, R.; Walker, G. Command and control in emergency services operations: A social network analysis. Ergonomics 2006, 49, 1204–1225. [Google Scholar] [CrossRef] [Green Version]
  38. Antonacci, G.; Fronzetti Colladon, A.; Stefanini, A.; Gloor, P. It is rotating leaders who build the swarm: Social network determinants of growth for healthcare virtual communities of practice. J. Knowl. Manag. 2017, 21, 1218–1239. [Google Scholar] [CrossRef] [Green Version]
  39. Kim, T.; McFee, E.; Olguin, D.O.; Waber, B.; Pentland, A. Sociometric badges: Using sensor technology to capture new forms of collaboration. J. Organ. Behav. 2012, 33, 412–427. [Google Scholar] [CrossRef]
  40. Aloini, D.; Covucci, C.; Stefanini, A. Collaboration Dynamics in Healthcare Knowledge Intensive Processes: A State of the Art on Sociometric Badges. In Digital Technology and Organizational Change; Springer: Cham, Switzerland, 2018; pp. 213–225. [Google Scholar]
  41. Leonard, M.; Graham, S.; Bonacum, D. The human factor: The critical importance of effective teamwork and communication in providing safe care. BMJ Qual. Saf. 2014, 13, i85–i90. [Google Scholar] [CrossRef] [Green Version]
  42. Burtscher, M.J.; Manser, T. Team mental models and their potential to improve teamwork and safety: A review and implications for future research in healthcare. Saf. Sci. 2012, 50, 1344–1354. [Google Scholar] [CrossRef]
  43. Rosen, M.A.; DiazGranados, D.; Dietz, A.S.; Benishek, L.E.; Thompson, D.; Pronovost, P.J.; Weaver, S.J. Teamwork in healthcare: Key discoveries enabling safer, high-quality care. Am. Psychol. 2018, 73, 433–450. [Google Scholar] [CrossRef] [PubMed]
  44. Valentine, M.A.; Nembhard, I.M.; Edmondson, A.C. Measuring teamwork in health care settings: A review of survey instruments. Med. Care 2015, 53, e16–e30. [Google Scholar] [CrossRef] [PubMed]
  45. Ansoff, H.I. Managing strategic surprise by response to weak signals. Calif. Manag. Rev. 1975, 18, 21–33. [Google Scholar] [CrossRef]
  46. Stroebel, C.K.; McDaniel, R.R., Jr.; Crabtree, B.F.; Miller, W.L.; Nutting, P.A.; Stange, K.C. How complexity science can inform a reflective process for improvement in primary care practices. Jt. Comm. J. Qual. Patient Saf. 2005, 31, 438–446. [Google Scholar] [CrossRef]
  47. Bae, S.H.; Nikolaev, A.; Seo, J.Y.; Castner, J. Health care provider social network analysis: A systematic review. Nurs. Outlook 2015, 63, 566–584. [Google Scholar] [CrossRef]
  48. Kukk, P.; Moors, E.H.M.; Hekkert, M.P. The complexities in system building strategies—The case of personalized cancer medicines in England. Technol. Forecast. Soc. Chang. 2015, 98, 47–59. [Google Scholar] [CrossRef] [Green Version]
  49. Scott, J.; Carrington, P.J. The SAGE Handbook of Social Network Analysis; SAGE Publications: Thousand Oaks, CA, USA, 2011. [Google Scholar]
  50. Cinelli, M.; Ferraro, G.; Iovanella, A. Network processes for collaborative innovation. Int. J. Entrep. Small Bus. 2019, 36, 430–452. [Google Scholar]
  51. Murdoch, T.B.; Detsky, A.S. The inevitable application of big data to health care. JAMA 2013, 309, 1351–1352. [Google Scholar] [CrossRef] [PubMed]
  52. Bates, D.W.; Saria, S.; Ohno-Machado, L.; Shah, A.; Escobar, G. Big data in health care: Using analytics to identify and manage high-risk and high-cost patients. Health Aff. 2014, 33, 1123–1131. [Google Scholar] [CrossRef] [PubMed] [Green Version]
  53. McLaughlin, S.A. Surgical management of the breast: Breast conservation therapy and mastectomy. Surg. Clin. 2013, 93, 411–428. [Google Scholar]
  54. Leach, L.S.; Myrtle, R.C.; Weaver, F.A.; Dasu, S. Assessing the performance of surgical teams. Health Care Manag. Rev. 2009, 34, 29–41. [Google Scholar] [CrossRef] [PubMed] [Green Version]
  55. Arora, S.; Sevdalis, N.; Nestel, D.; Woloshynowych, M.; Darzi, A.; Kneebone, R. The impact of stress on surgical performance: A systematic review of the literature. Surgery 2010, 147, 318–330. [Google Scholar] [CrossRef]
  56. Cox, C.E.; Salud, C.J.; Cantor, A.; Bass, S.S.; Peltz, E.S.; Ebert, M.D.; Reintgen, D.S. Learning curves for breast cancer sentinel lymph node mapping based on surgical volume analysis. J. Am. Col. Surg. 2001, 193, 593–600. [Google Scholar] [CrossRef]
  57. Mansel, R.E.; MacNeill, F.; Horgan, K.; Goyal, A.; Britten, A.; Townson, J.; Senior Guildford Breast Surgeons, On Behalf of the New Start Training Group. Results of a national training programme in sentinel lymph node biopsy for breast cancer. Br. J. Surg. 2013, 100, 654–661. [Google Scholar]
  58. Paige, J.T. Surgical team training: Promoting high reliability with nontechnical skills. Surg. Clin. 2010, 90, 569–581. [Google Scholar] [CrossRef]
  59. Gardner, A.K.; Scott, D.J.; Pedowitz, R.A.; Sweet, R.M.; Feins, R.H.; Deutsch, E.S.; Sachdeva, A.K. Best practices across surgical specialties relating to simulation-based training. Surgery 2015, 158, 1395–1402. [Google Scholar] [CrossRef]
  60. Singer, S.J.; Molina, G.; Li, Z.; Jiang, W.; Nurudeen, S.; Kite, J.G.; Berry, W.R. Relationship between operating room teamwork, contextual factors, and safety checklist performance. J. Am. Coll. Surg. 2016, 223, 568–580. [Google Scholar] [CrossRef]
  61. Son, Y.J.; Lee, E.K.; Ko, Y. Association of working hours and patient safety competencies with adverse nurse outcomes: A cross-sectional study. Int. J. Environ. Res. Public Health 2019, 16, 4083. [Google Scholar] [CrossRef] [PubMed] [Green Version]
  62. Keller, S.; Tschan, F.; Beldi, G.; Kurmann, A.; Candinas, D.; Semmer, N.K. Noise peaks influence communication in the operating room. An observational study. Ergonomics 2016, 59, 1541–1552. [Google Scholar] [CrossRef] [PubMed]
  63. Allard, M.A.; Blanie, A.; Brouquet, A.; Benhamou, D. Learning non-technical skills in surgery. J. Visc. Surg. 2020, 157, S131–S136. [Google Scholar] [CrossRef]
  64. Rasoulkhani, K.; Mostafavi, A. Resilience as an emergent property of human-infrastructure dynamics: A multi-agent simulation model for characterizing regime shifts and tipping point behaviors in infrastructure systems. PLoS ONE 2018, 13, e0207674. [Google Scholar]
  65. Soto-Rubio, A.; Giménez-Espert, M.D.C.; Prado-Gascó, V. Effect of emotional intelligence and psychosocial risks on burnout, job satisfaction, and nurses’ health during the COVID-19 pandemic. Int. J. Environ. Res. Public Health 2020, 17, 7998. [Google Scholar] [CrossRef]
  66. Goñi, J.; Avena-Koenigsberger, A.; Velez de Mendizabal, N.; van den Heuvel, M.P.; Betzel, R.F.; Sporns, O. Exploring the morphospace of communication efficiency in complex networks. PLoS ONE 2013, 8, e58070. [Google Scholar] [CrossRef] [PubMed]
  67. Tröster, C.; Mehra, A.; van Knippenberg, D. Structuring for team success: The interactive effects of network structure and cultural diversity on team potency and performance. Organ. Behav. Hum. Decis. Processes 2014, 124, 245–255. [Google Scholar] [CrossRef] [Green Version]
  68. West, D.B. Introduction to Graph Theory; Prentice Hall: Hoboken, NJ, USA, 2001. [Google Scholar]
  69. White, D.R.; Harary, F. The Cohesiveness of Blocks in Social Networks: Node Connectivity and Conditional Density. Sociol. Methodol. 2002, 31, 305–359. [Google Scholar] [CrossRef] [Green Version]
  70. Borgatti, S.P.; Everett, M.G. A Graph-theoretic perspective on centrality. Soc. Netw. 2006, 28, 466–484. [Google Scholar] [CrossRef]
  71. Rowley, T.J. Moving beyond dyadic ties: A network theory of stakeholder influences. Acad. Manag. Rev. 1997, 22, 887–910. [Google Scholar] [CrossRef]
  72. Jäntschi, L. A Test Detecting the Outliers for Continuous Distributions Based on the Cumulative Distribution Function of the Data Being Tested. Symmetry 2019, 11, 835. [Google Scholar] [CrossRef] [Green Version]
  73. R Core Team. R: A Language and Environment for Statistical Computing; R Core Team: Vienna, Austria, 2013. [Google Scholar]
  74. Csardi, G.; Nepusz, T. The igraph software package for complex network research. InterJ. Complex Syst. 2006, 1695, 1–9. [Google Scholar]
  75. Wasserman, S.; Faust, K. Social Network Analysis-Methods and Applications; Cambridge University Press: Cambridge, UK, 1999. [Google Scholar]
  76. Diudea, M.V.; Gutman, I.; Jantschi, L. Molecular Topology; Nova Science Publishers: New York, NY, USA, 2001. [Google Scholar]
  77. Newman, M.E.J. Assortative mixing in networks. Phys. Rev. Lett. 2002, 89, 208701. [Google Scholar] [CrossRef] [PubMed] [Green Version]
  78. Maslov, S.; Sneppen, K. Specificity and stability in topology of protein networks. Science 2002, 296, 910–913. [Google Scholar] [CrossRef] [Green Version]
Figure 1. The network projection of the surgery rooms interactions (left panel) and correlations between glitches and centrality measures. In the left panel, red nodes indicate the occurrence of a glitch; in the right panel, for the p-values, we obtained 0.00234 for glitch–transitivity, 0.00318 for glitch–betweenness, 0.00592 for glitch–closeness, 0.00926 for glitch–degree, 0.0119 for glitch–pagerank, 0.0127 for glitch–eigenvector centrality, and 0.0209 for glitch–authority, while we obtained 0.347 for glitch–Bonacich index and 0.393 for glitch–coreness (note that these last two correlations are depicted with the boxplot filled in grey).
Applsci 12 05841 g001
Table 1. Summary of implications, challenges, and benefits for teamwork from complexity science and network representation.
ConceptImplicationsChallengesBenefits
Irreversibility of time
  • Change in team dynamics that occurs as time unfolds.
  • Mutual exclusivity of decisions taken by teams and closing-down of options over time.
  • Options foregone have opportunity costs.
  • How can we define the roles in teams and their evolution during their operations?
  • How can we identify the best team dynamics for the more creative tasks? There is no linear relationship between creative input and creative output.
  • How can we determine which dyads dominate in local network of interest?
  • Dynamic analysis of the work of teams that may enable better and quick decisions.
  • “Crucial decisions” can be taken based on network analysis results.
  • Identification of (formal and informal) roles and of expertise associated with team members.
Path dependence
  • Two teams with identical present states may have very different past trajectories.
  • The path taken to reach a present team network goes on to influence the future.
  • Intertwining of perspectives of past, present, and future.
  • How can we take account of the history of the team and the related interactions?
  • How can we simultaneously take account of different potential evolutions of the team organisation in the future?
  • The presence of numerous factors affecting the evolution of team dynamics and the related performance.
  • Understanding of deviations from the expected path.
  • Awareness that interpretation of the present team network affects interpretation of what might come to be in the future.
  • Identification of the most relevant factors affecting the evolution of team dynamics and team performance.
  • Differentiation between deviation errors to correct vs. opportunity to explore.
  • Support to long-term decision making.
  • Support to predictive risk mitigation, i.e., interpretation of possible future trajectories.
Sensitivity to initial condition
  • Difficulty of distinguishing between randomness and non-randomness results.
  • A fully determined process can have multiple possible team network and/or outcomes.
  • Inability to evaluate the initial conditions of teams with infinite accuracy.
  • Is the concept of ‘weak signals’ useful when considering the networks? Should they be included in the analyses?
  • How can teamwork factors that subsequently turn out to be important be distinguished from those that do not (i.e., those which are just random)?
  • Questioning unquestioned assumptions and past relationships between team behaviours/dynamics and team performances.
  • Awareness of the potential uncertainty associated with the future evolution of the team networks.
  • Identification of initial conditions affecting team networks and team performance.
  • Pursuing events otherwise understood as deviations.
  • Understanding deviations as opportunities, pursuing the most favourable ones.
Emergence and systemness
  • The interplay between micro- and macro-organisational levels.
  • What emerges at a higher hierarchical level is not reducible to the sum of the parts of lower hierarchical levels and, therefore, not amenable to traditional forms of ‘analysis’.
  • The presence of dyadic relationships.
  • The presence of self-assertive tendencies and integrative tendencies.
  • The interplay between networks of health organisations (hospitals, house assistance organisations, family doctors, etc.) while providing “combined” health services.
  • How can network tools be adapted to avoid overly focusing on either the micro- or macro-organisational levels, leading to a ‘micro-fallacy’ or ‘macro-fallacy’?
  • How can we effectively ‘analyse’ networks of health organisations by examining individuals and communities of individuals?
  • How can we distinguish what information is needed from whom, when, and how?
  • How can we unveil self-organising patterns?
  • Easy formalisation through networked representations.
  • Both micro and macro organisation levels can be considered through network analysis.
  • Awareness that aggregate-level effects from particular actions or behaviours can lead to uncertain and emergent outcomes not discernible from individual behaviour.
  • Existence of countless opportunities for collaboration that may be unseen and unpredictable from initial conditions or directions.
  • Feedbacks provided by network analysis can also enhance mutual trust.
  • Systemic view as a way to mitigate systemic risk effects.
Attractor states
  • A team may be governed by a specific attractor (e.g., a team leader, a specific configuration, etc.), implying a repetition of past patterns of development, leading to the same or similar outcomes (determinism).
  • The future team dynamics and outcomes can sometimes be guessed because of this tendency for unfolding patterns to repeat, implying a degree of usefulness for network analysis tools for discovering related elements.
  • To what extent can we change the team outcomes if an attractor is present? What is the balance between changing some team factors and leaving the team free to develop?
  • How can we investigate the interactions between different team components and, eventually, among numerous attractors? How can such dynamics affect team outcomes?
  • How can we disturb a focal system (e.g., a hub, a community, etc), including an attractor, into the system? How can we evaluate the emerging potential conflicts?
  • Awareness that team dynamics and team outcomes can be subject to determinism and not only indeterminism.
  • Identification of attractors (and related potential effects on the team) through advanced network analysis tools.
  • Exploration of why the teamwork networks often continue to look like the past despite considerable effort to change their course.
  • Understanding of emergent conflicts (e.g., creative conflict and stressing conflict).
Complex causation
  • Team interaction and collaboration dynamics are typically characterised by non-simple cause–effect relations due to a complex non-linear domino effect.
  • The future state of the team and the team performance are not simply conjunctions of the previous states and transition events.
  • Complex systems and, in particular, network theory can be of great support for such understanding.
  • How can network tools be adapted to take a broader account of teamwork complexity?
  • How can we investigate human behaviours and motivations as determinants of team performance?
  • How can we comprehensively evaluate the “current state” of the teams?
  • How can we take account of rules/causes for future team states and/or outcomes?
  • Performance perceived by the team is strongly influenced by team satisfaction, which may have implications on team motivation.
  • Broader and more sophisticated understanding of causes behind team performance.
  • Move away from simplistic and ‘efficient’ cause–effect relationships in team interaction and collaboration dynamics.
  • Awareness that different types of cause dominate in different types of team networks.
  • Identification of “blurred roles” and expectations to achieve future objectives.
  • Increasing closed-loop communications (enhancing mutual trust) and building relationships of connection and support.
  • Understanding the complex dynamics related to creativity and problem-solving.
Table 2. Summary of the implications, challenges, and benefits of network science application for teamwork in the case study.
ConceptImplicationsChallengesBenefits
Irreversibility of time
  • Randomness of degree distribution.
  • Emergence of stable groups.
  • The network implies a mature process.
  • No hub will emerge in the future.
  • Glitches are independent from fatigue.
  • Group thinking.
  • Peculiar team dynamic prevents excessive workload.
  • Straightforward alert against group thinking.
  • Dyads becomes explicit.
Path dependence
  • Randomness of degree distribution.
  • High values of clustering coefficient.
  • The network implies a mature process.
  • Low variety in team composition.
  • Straightforward alert against scheduling of same sub-groups.
  • Promotion of team variety in the future.
  • Support to predictive risk mitigation.
Sensitivity to initial condition
  • Apparent randomness of glitches.
  • The team formation process brings to a random degree distribution, suggesting the absence of preferential selections.
  • Team composition is a weak signal.
  • Second-order measures are needed to understand dynamics.
  • Undercover and understanding weak signal as opportunities.
  • Pursuing events otherwise understood as deviations or underestimated.
Emergence and systemness
  • Absence of preferential dyads.
  • No emergence of relationships among workload and glitches.
  • Team scheduling operations avoid the emergence of hub.
  • Emergence of stable groups.
  • Absence of preferential staff mixing.
  • Glitches appear under systemic occurrence.
  • Balanced workload.
  • Stable groups correlate with glitches.
  • The dynamic prevents the formation of an elite.
  • Awareness that aggregate-level effects from particular actions or behaviours can lead to glitches and emergent outcomes not discernible from individual behaviour.
  • Micro- and macro-organisation levels operate accordingly.
  • Awareness of the relationship between stable groups and surgical performances.
Attractor states
  • Absence of hubs as attractor.
  • Low variety in the group composition.
  • No repetitions of past patterns of development, leading to the same or similar outcomes (determinism).
  • Establishment of a path dependence that increases the probability of glitches.
  • Awareness that team dynamics and team outcomes can be subject mainly to indeterminism or unknown deterministic aspects worth analysing.
  • Identification of attractors (and related potential effects on the team) to avoid glitches in the future.
Complex causation
  • Team interaction and collaboration dynamics are typically characterised by a non-simple cause–effect relations due to a complex non-linear domino effect.
  • The future state of the team and the team performance is not simply in conjunction with the previous states and transition events.
  • Complex system and particularly network theory can be of great support for such understanding.
  • Broader account of teamwork complexity.
  • Human behaviours and motivations as determinants of team performance.
  • The “current state” of the teams is known in a broader sense.
  • Rules which cause team satisfaction may have implications on team motivation.
  • Broader and more sophisticated understanding of causes behind team performance.
  • Move away from simplistic and ‘efficient’ cause–effect relationships in team interaction and collaboration dynamics.
  • Awareness that different types of cause dominate in different types of teams.
  • Identification of “blurred roles” and expectations to achieve the future objectives.
  • Increasing closed loop communications (enhancing mutual trust) and building relationships of connection and support.
  • Understanding the complex dynamics related to creativity and problem solving.
Publisher’s Note: MDPI stays neutral with regard to jurisdictional claims in published maps and institutional affiliations.

