SDA-Vis: A Visualization System for Student Dropout Analysis Based on Counterfactual Exploration
Abstract
:1. Introduction
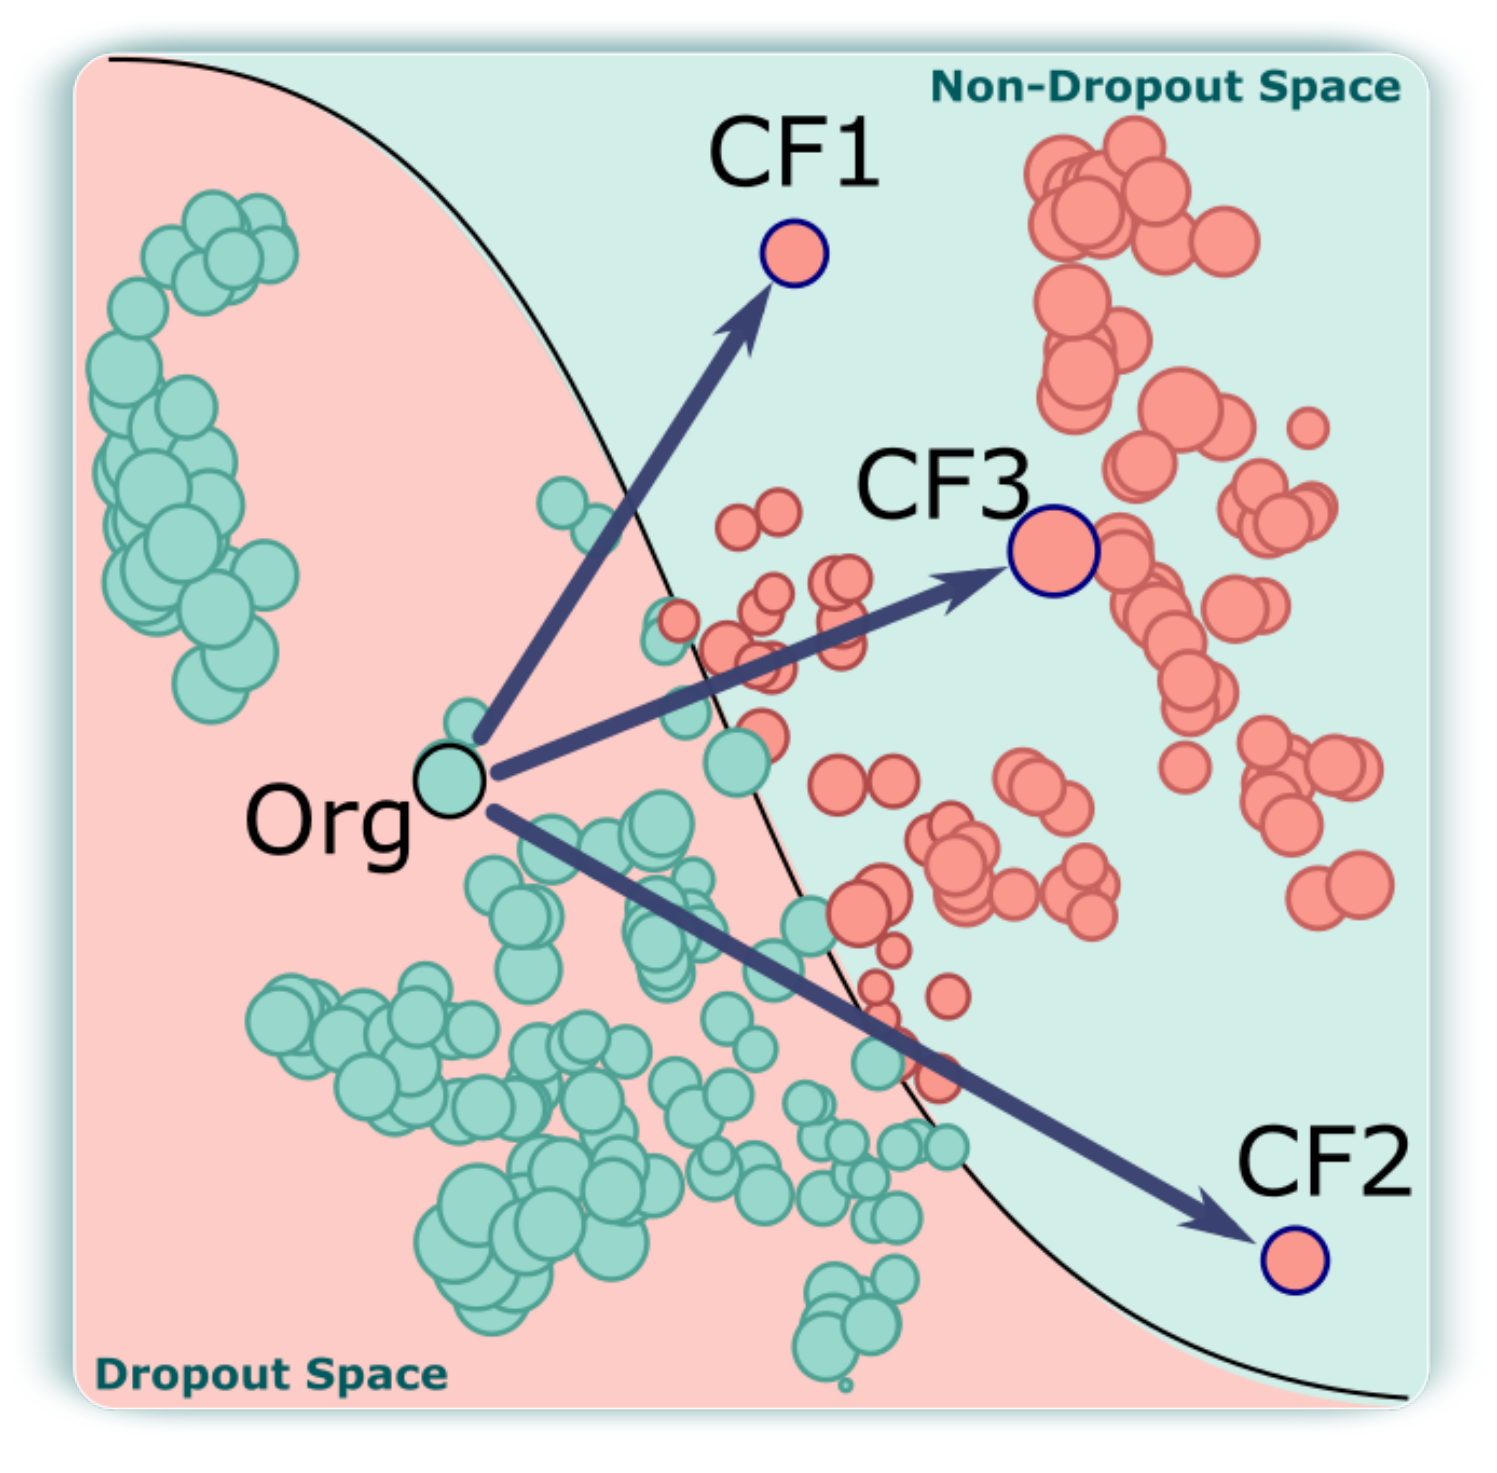
- A counterfactual-based analysis for finding recommendations using feature-perturbed feasible alternatives to avoid student dropouts.
- A visual analytic system named SDA-Vis that supports the interactive exploration of student characteristics and counterfactuals to support the decision-making process in educational institutions.
- A set of real-world case studies that demonstrate the usefulness and practicality of our approach to reducing student dropout rates.
2. Related Work
2.1. Student Dropout Analysis
2.2. Counterfactual Explanation
2.3. Visual Analytic
3. Student Counterfactual Analysis
3.1. Analytical Objectives
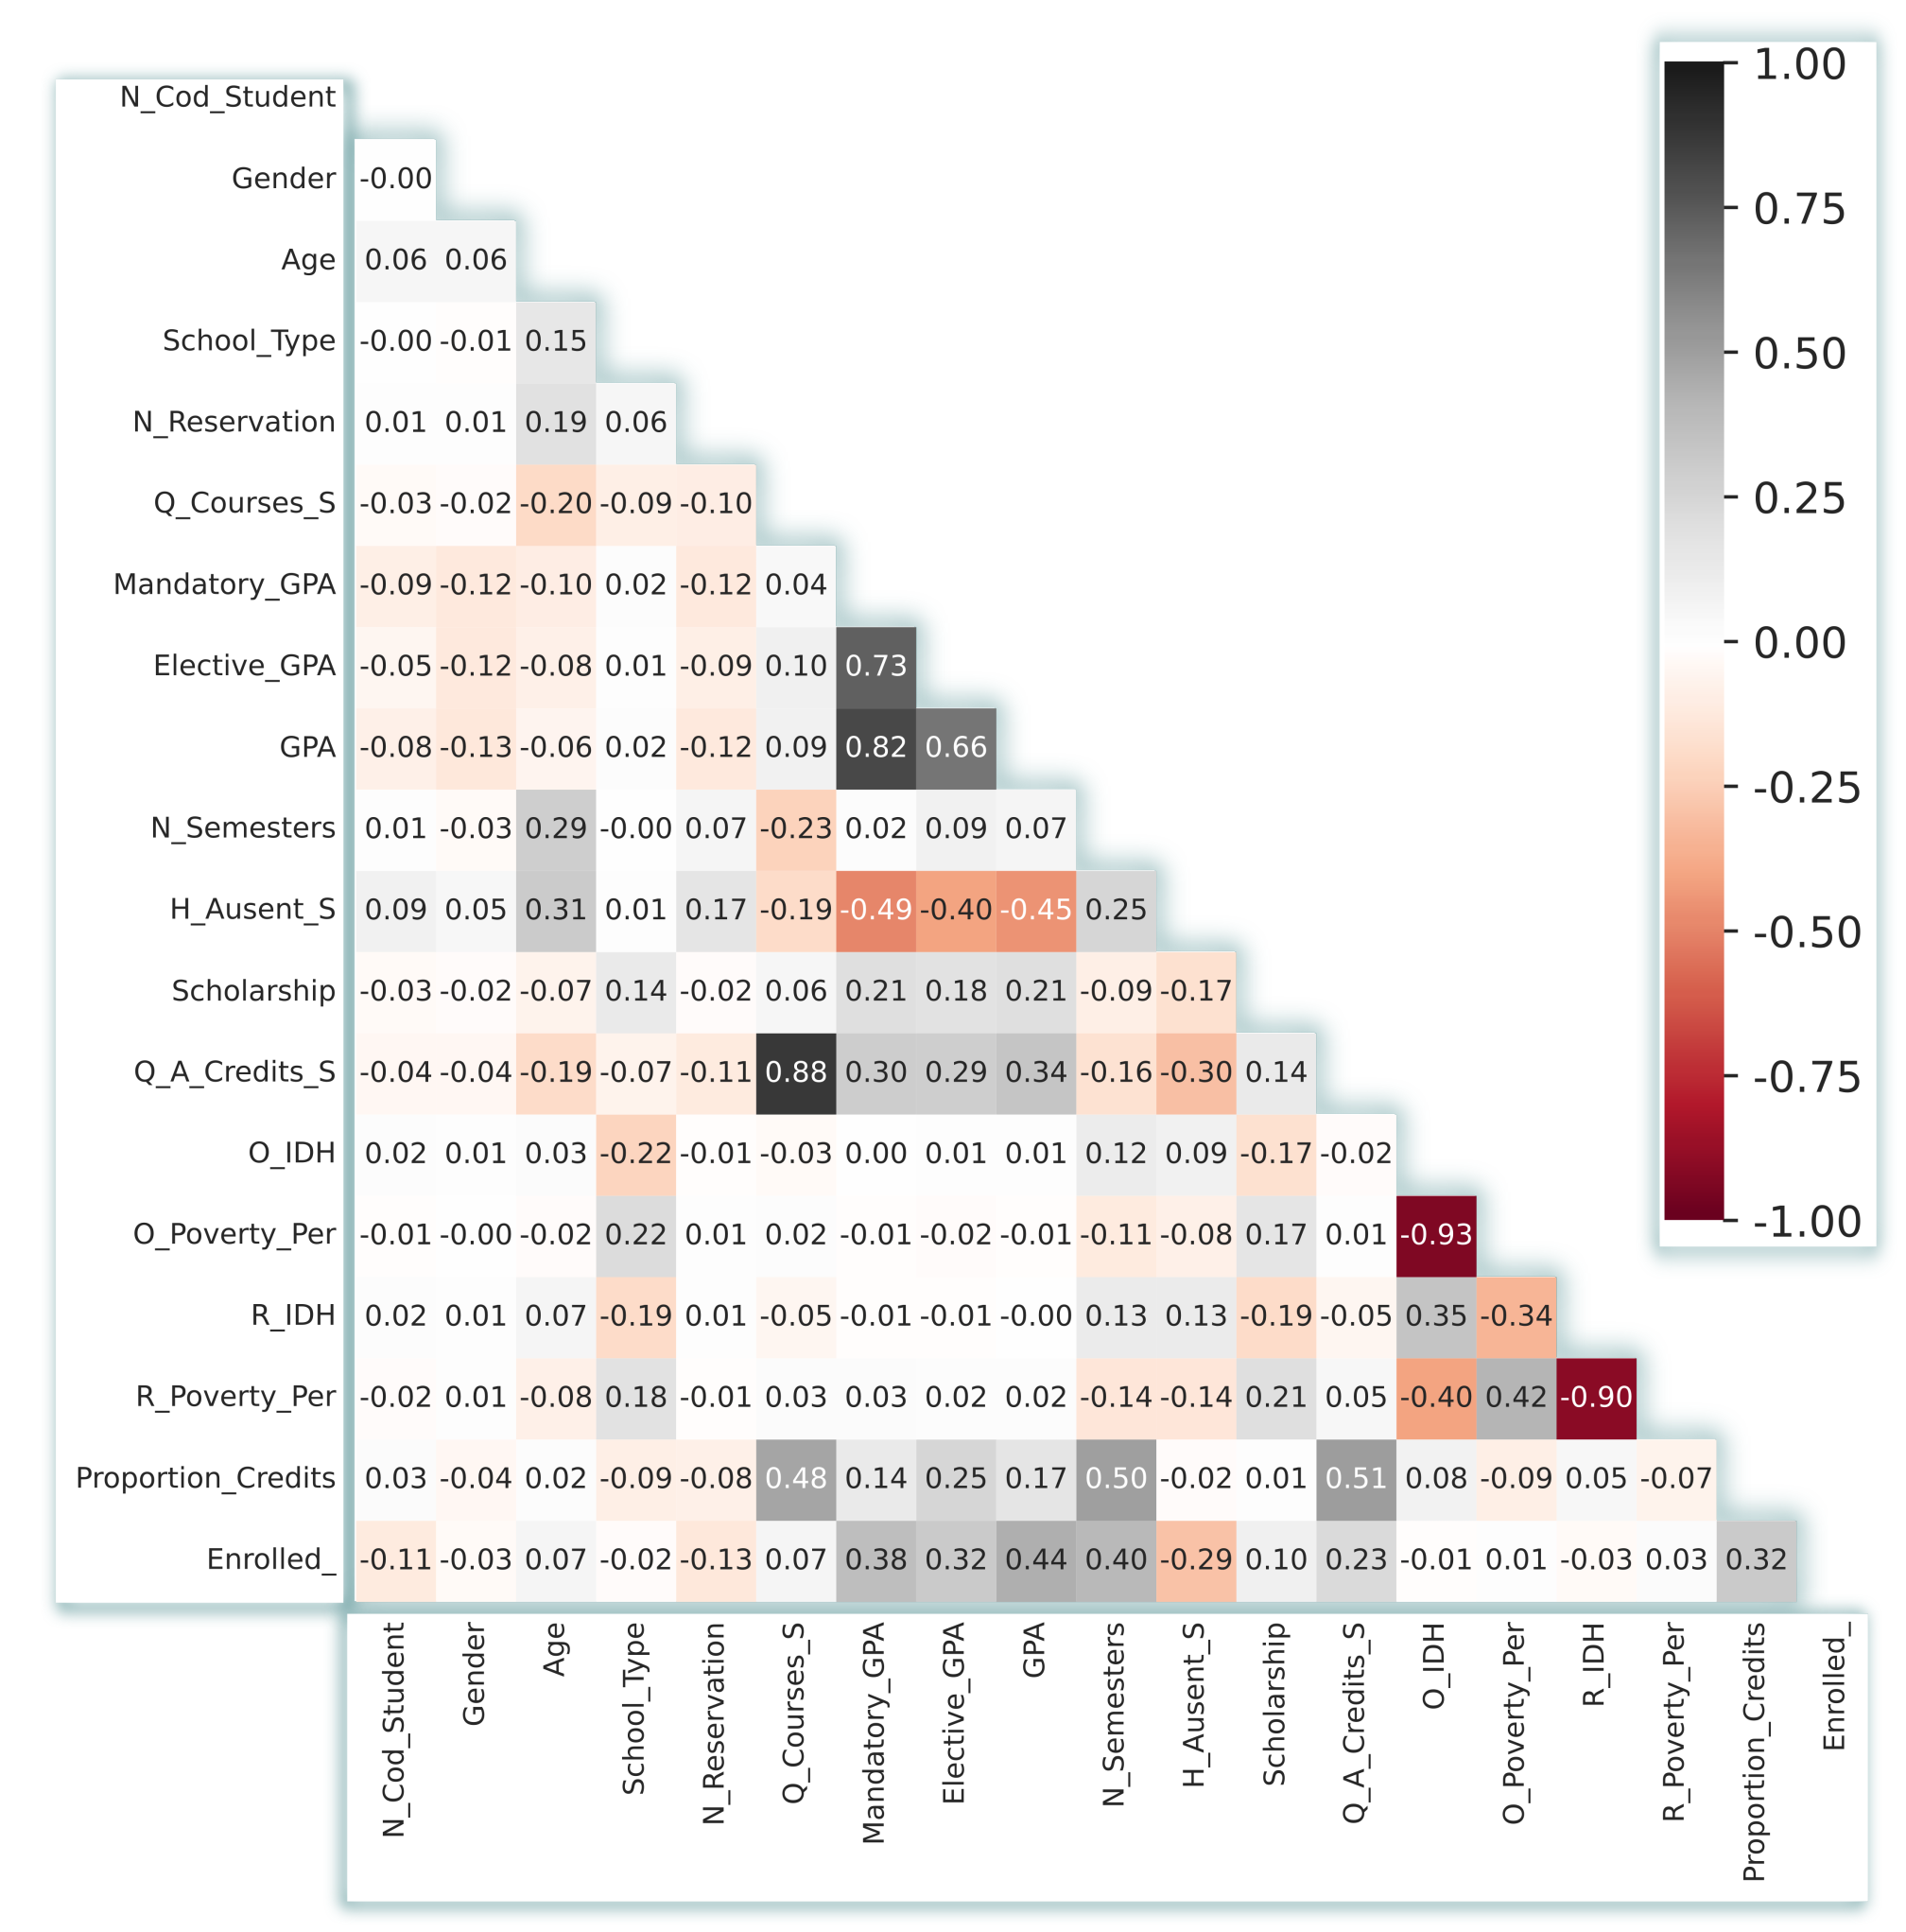
3.2. Data Set Description
3.3. Counterfactual Explanation
4. SDA-Vis: Visual Design and Overview
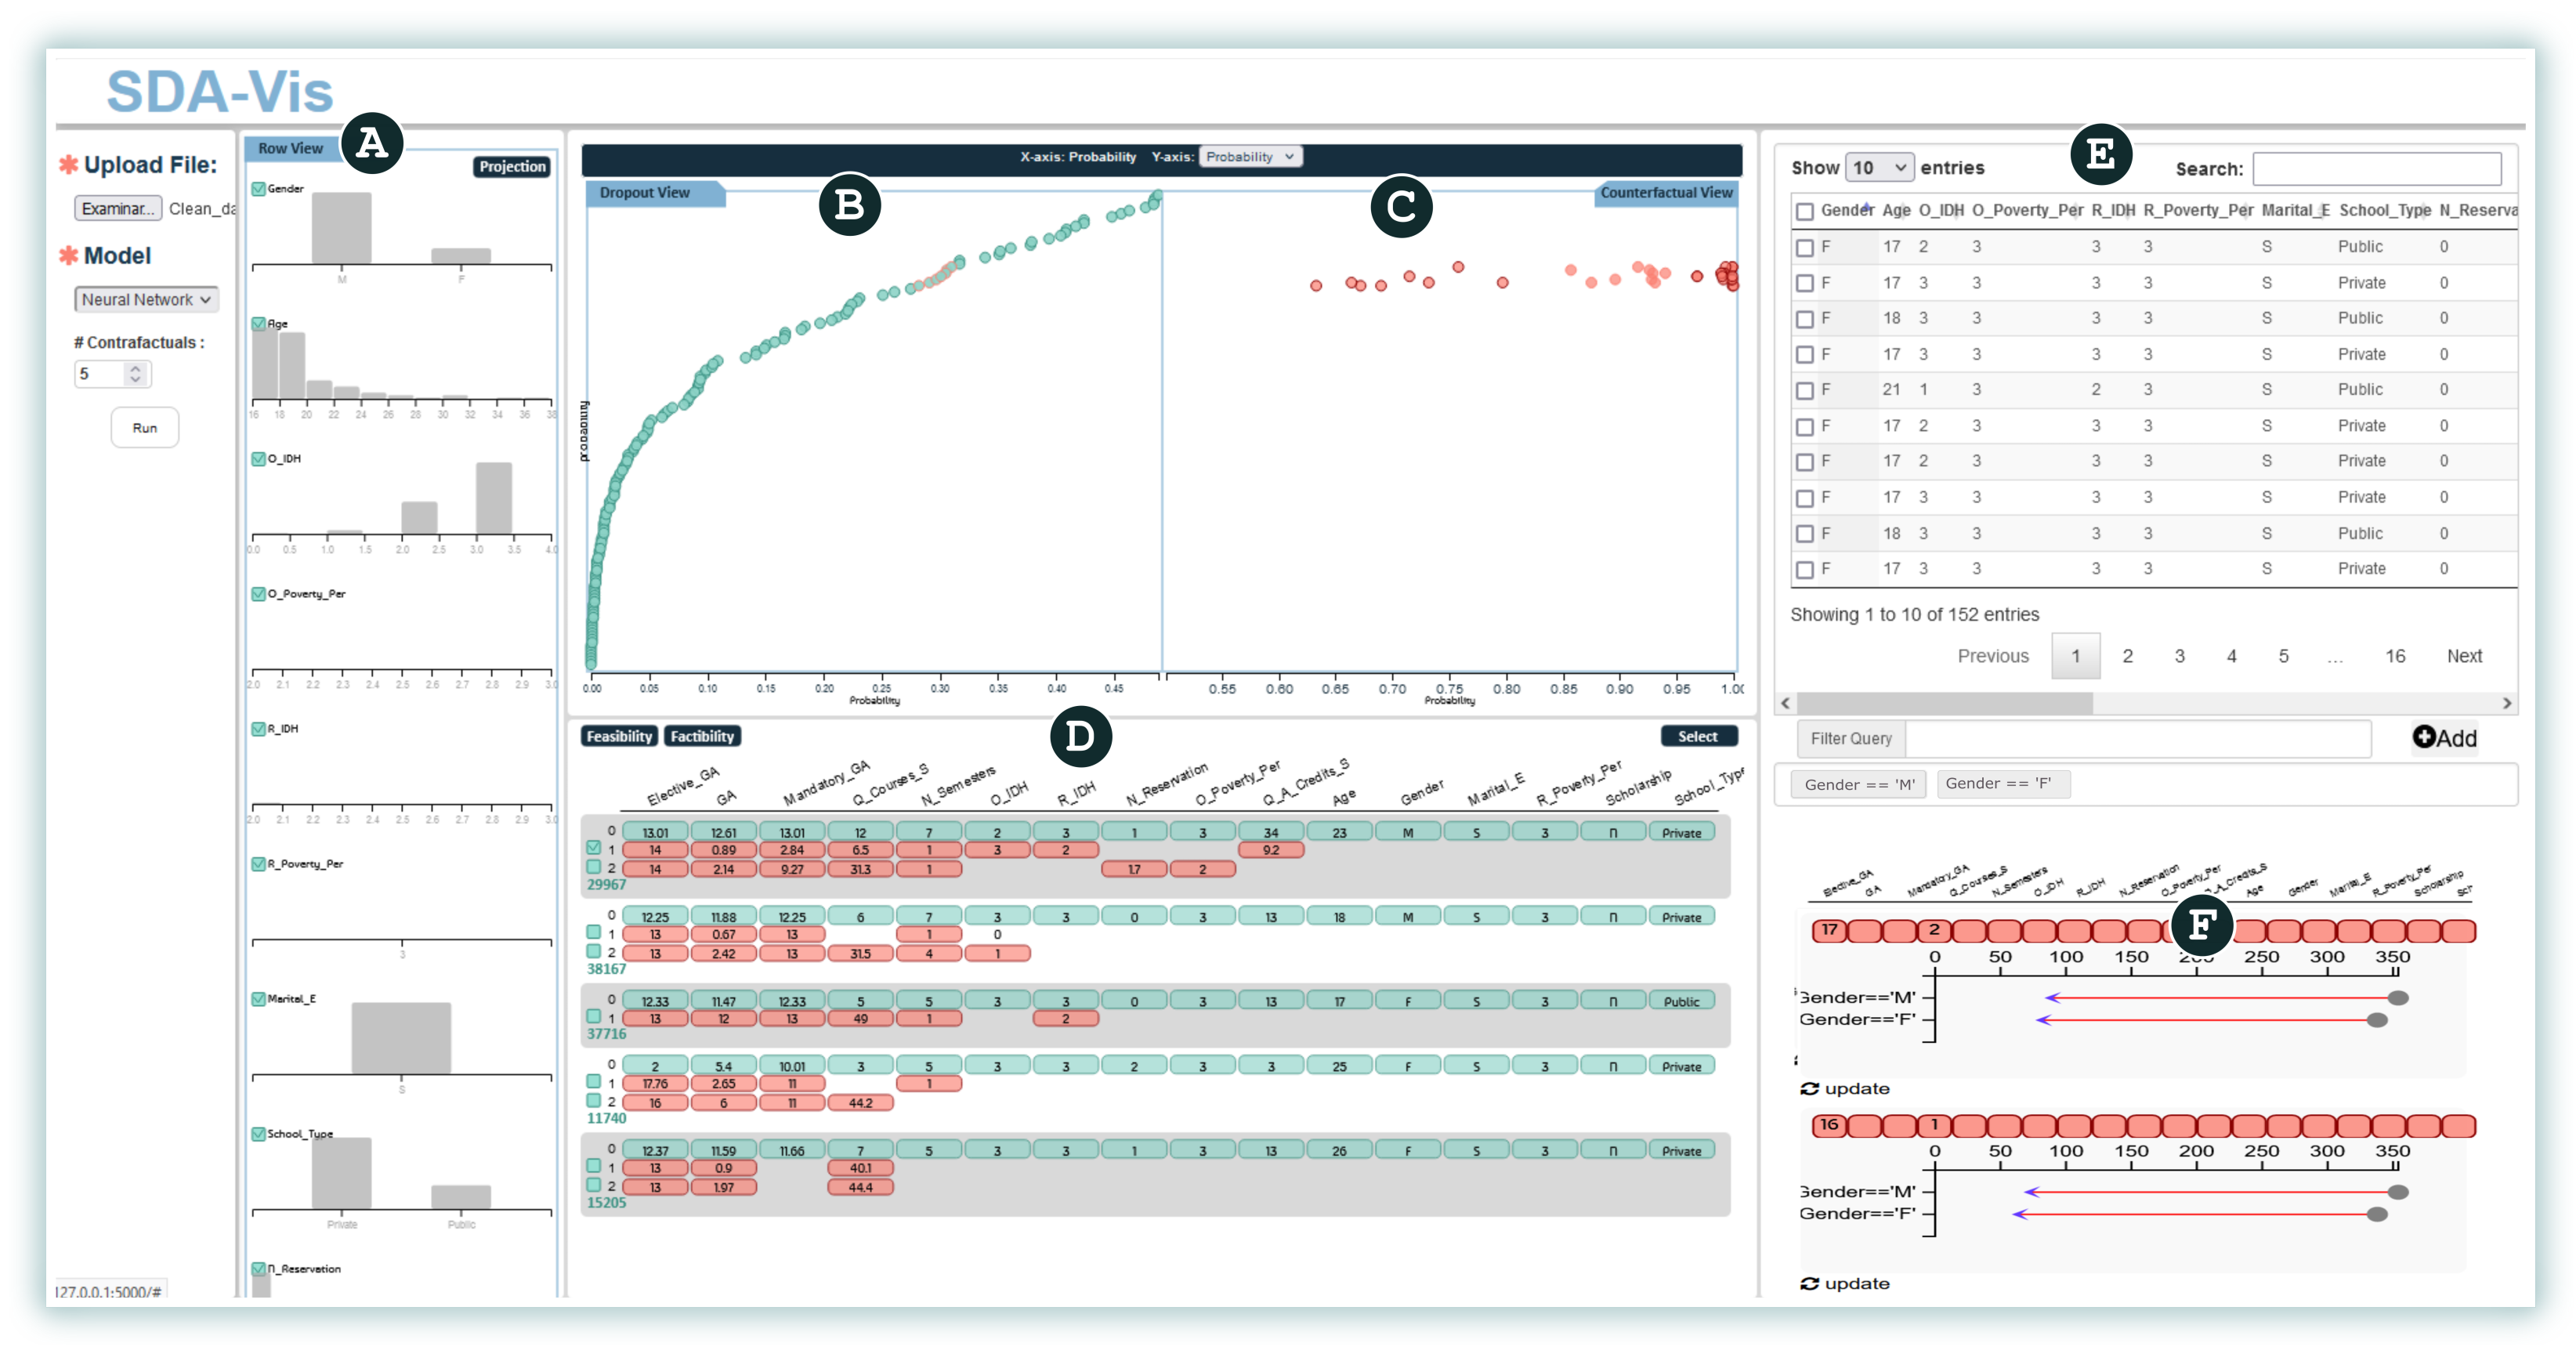
 histograms to represent the distribution of students’ characteristics,
  a projection to represent the probabilities for students based on the model threshold,
  a projection to represent the counterfactuals and their probabilities,
  counterfactual exploration to represent the synthetic values,
  a table showing all real dropout students’ values, and
  a visualization of the impact of some counterfactuals on a certain group of students.
 , summarizes the distribution of values for each feature from the predicted dropout students (AO1). Additionally, this view enables the analyst to select a subset of features to limit its use as the input for the remaining exploration process.
- +
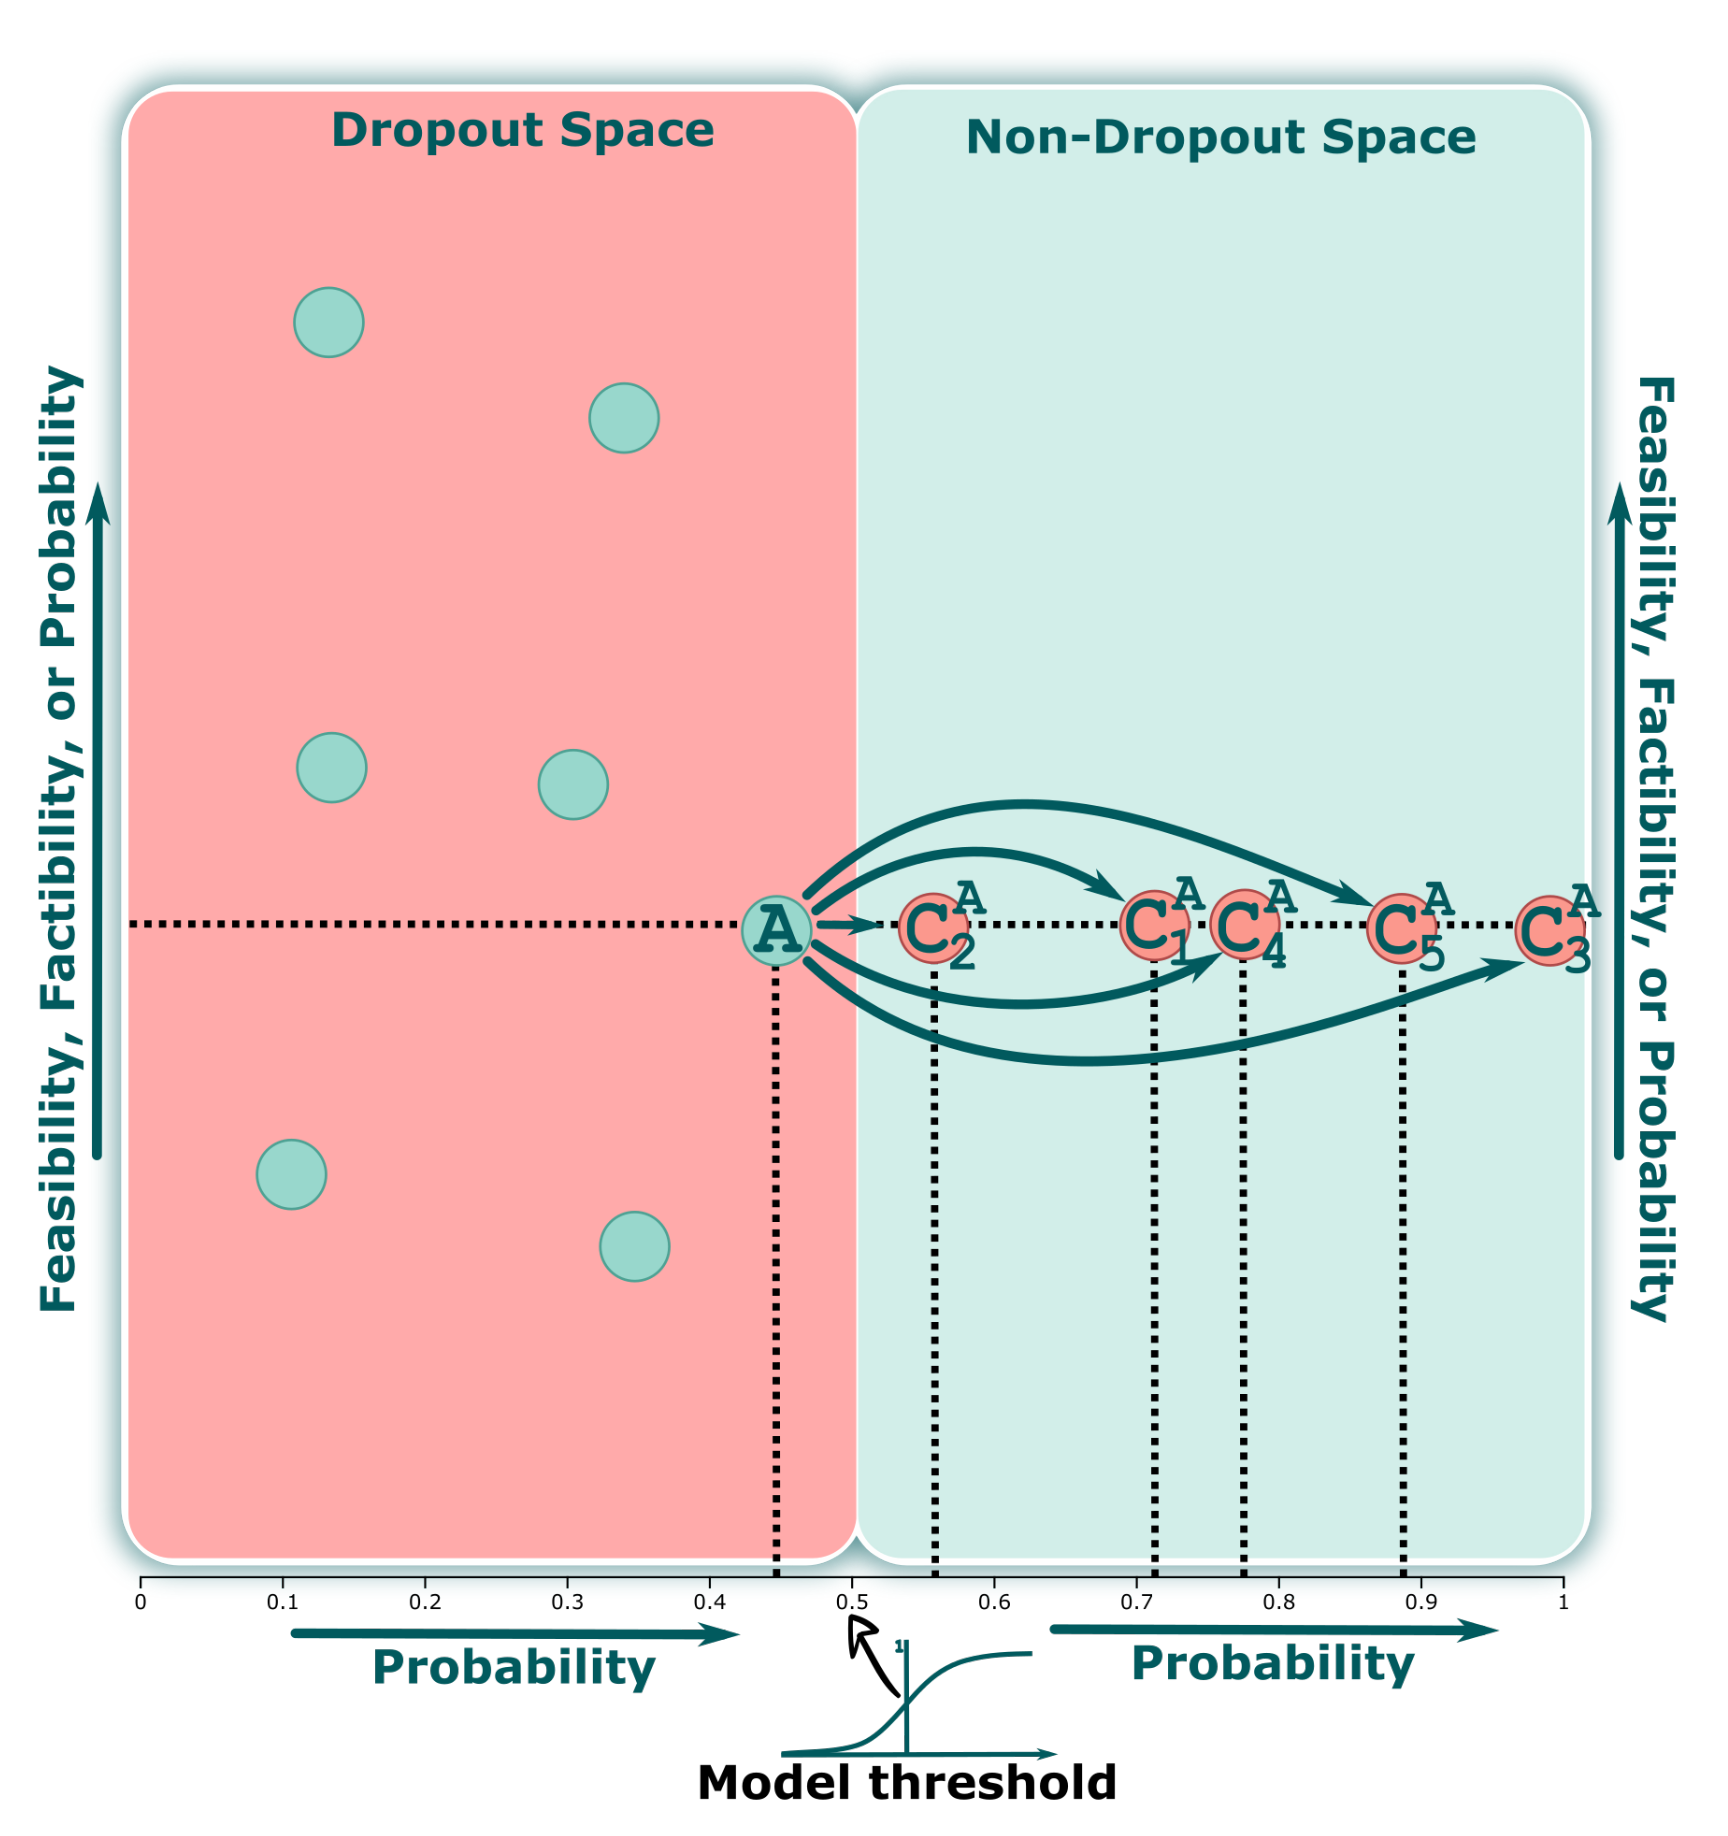
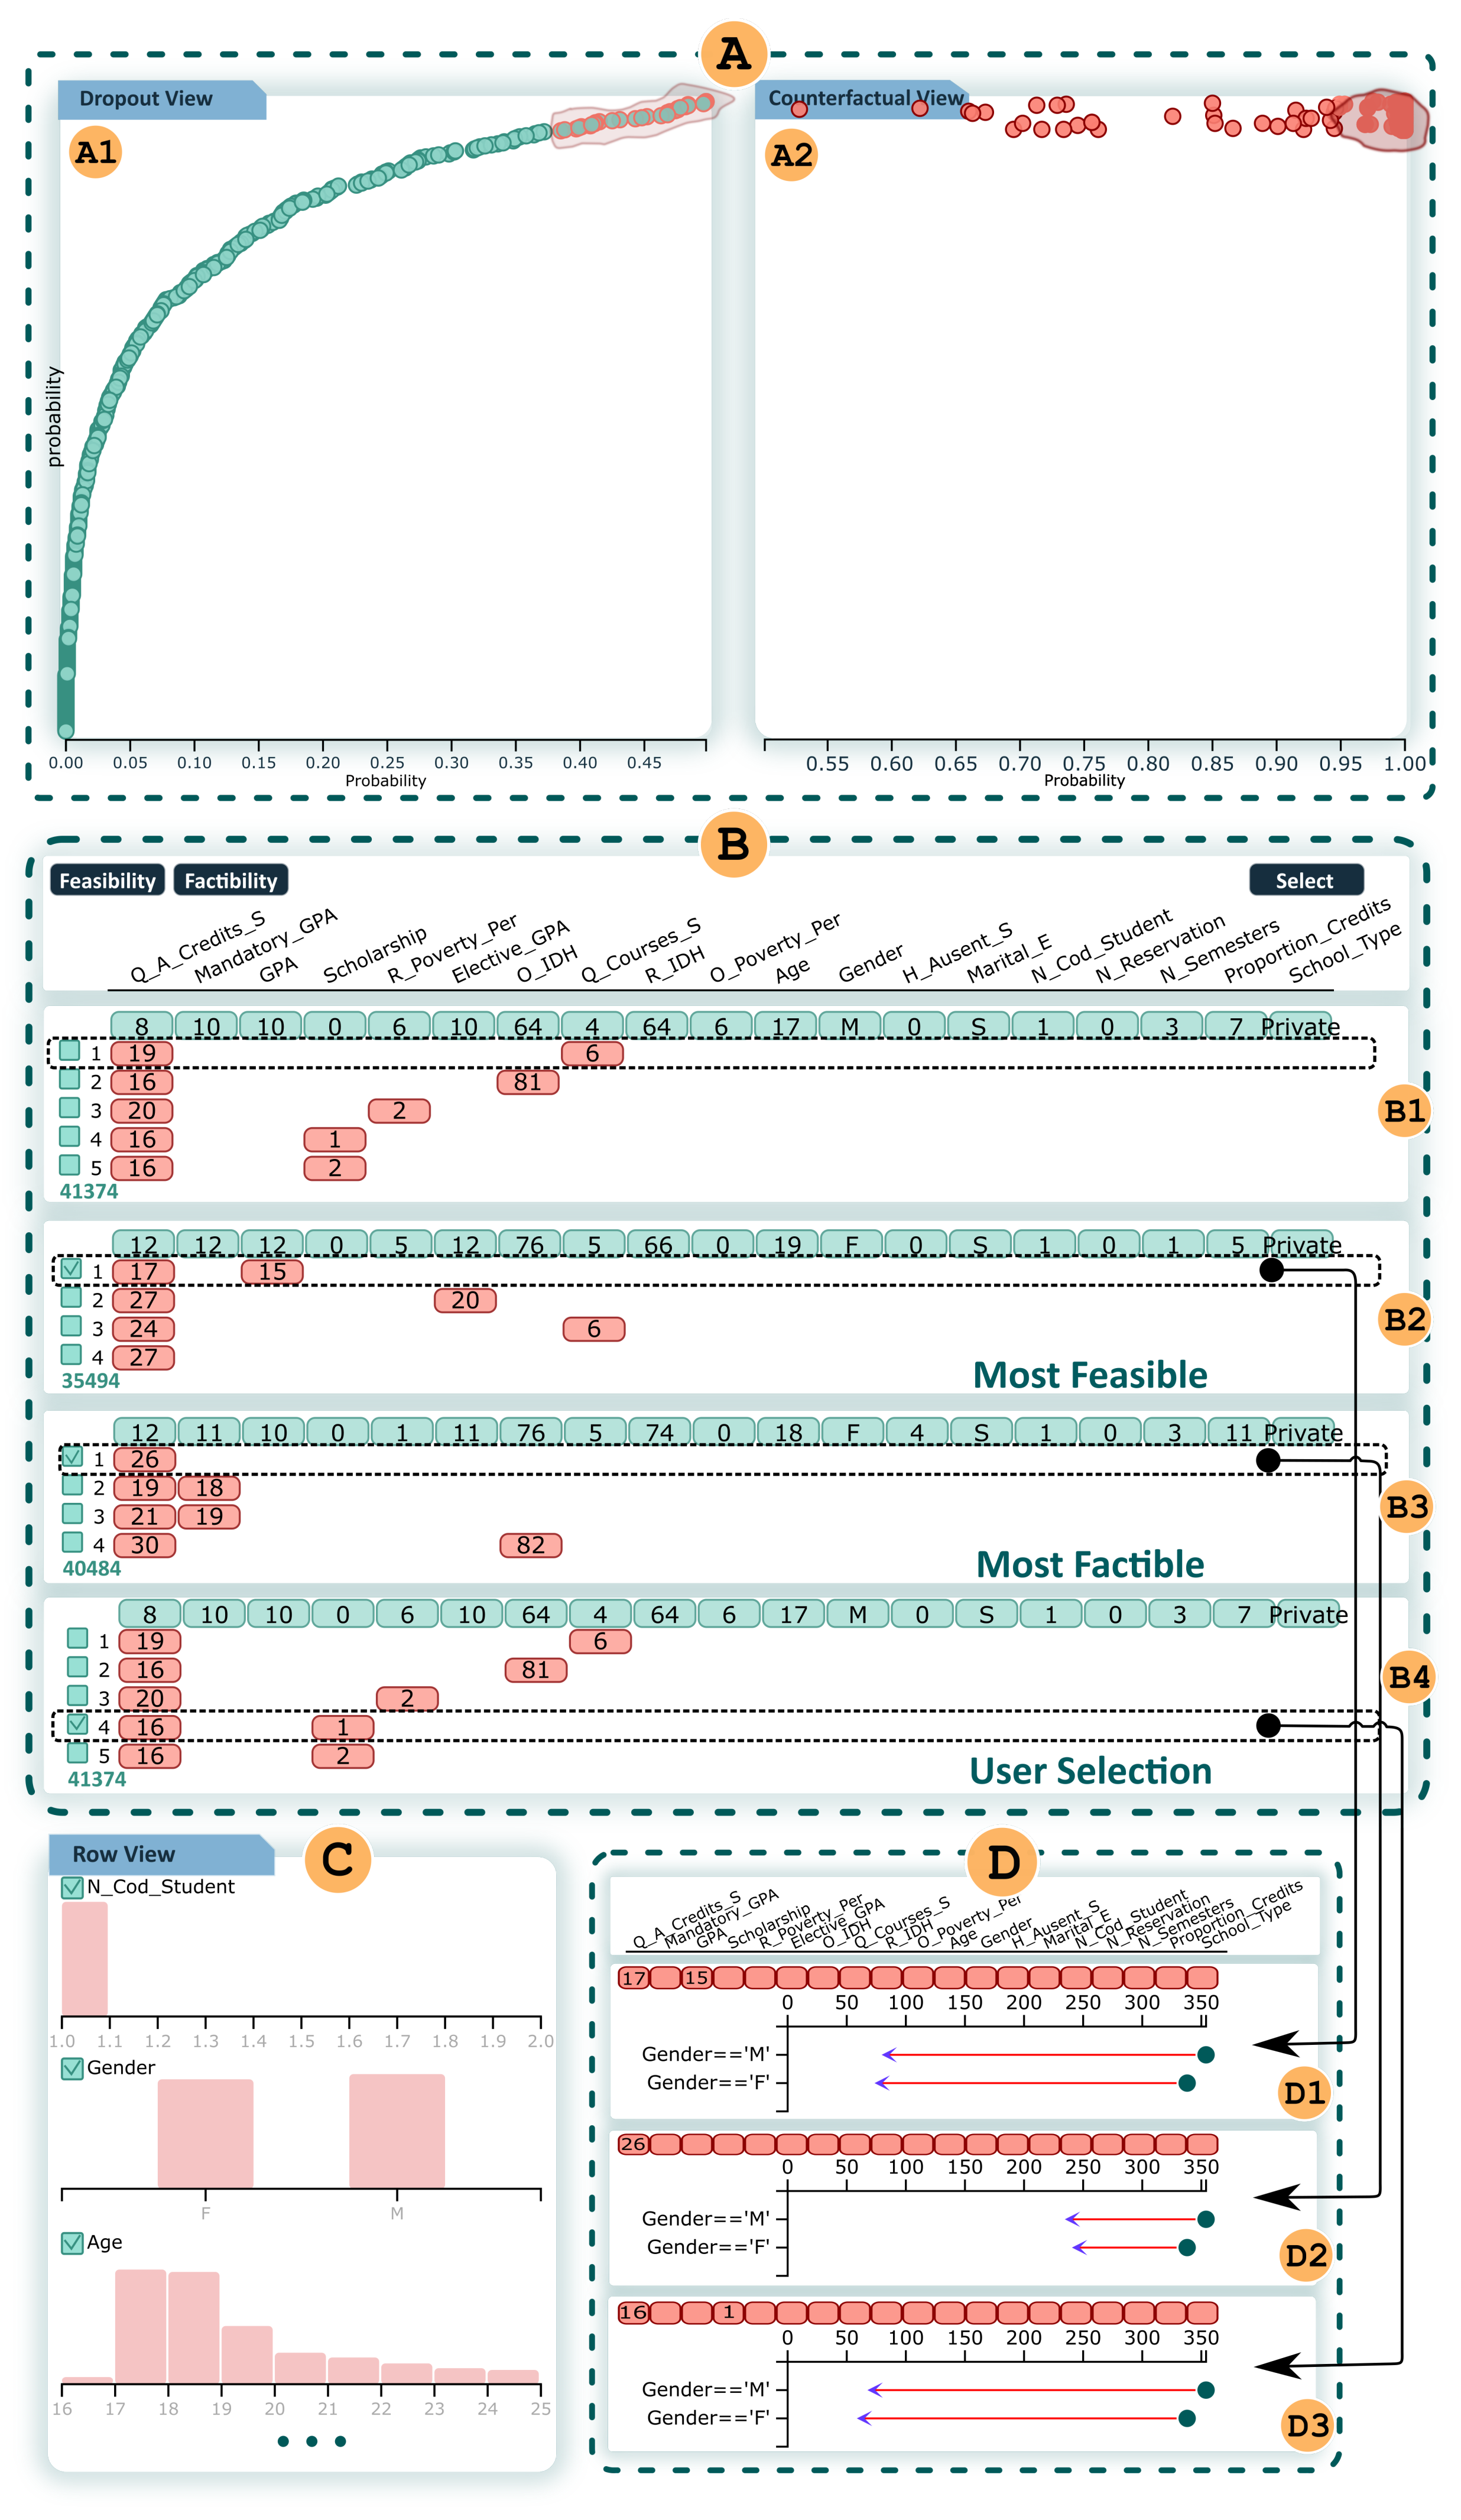
- Student Projection (SP) view. Once the features have been selected from the first view, potential dropout students are mapped into a 2D visual space, considering these variables. This view aims to explore the students’ information based on certain metrics. It is placed in the inner left region of our interface, as shown in Figure 3
. Additionally, this view enables the analyst to find a specific student or group of students by using different metrics on the y-axis or to select a subset by drawing different shapes in the design space. Analogously to traditional classification models, we can consider this space the “dropout region”, where all students are at risk of dropping out (AO2).
- +
- Counterfactual Projection (CP) view. One primary requirement for our work is to seek and propose different ways to avoid student dropouts. Therefore, we compute a set of counterfactuals for each student containing information on which attributes and values of one or more students should be changed in order to reduce their probabilities of becoming dropout students (AO3). Once a group of interest is selected in the SP view, our CP view displays all of the counterfactuals associated with this selection, as shown in Figure 3
. Furthermore, the analyst can freely choose a set of counterfactuals to inspect using the view described in the following subsection.
 ,
,  employ the probability on both axes.
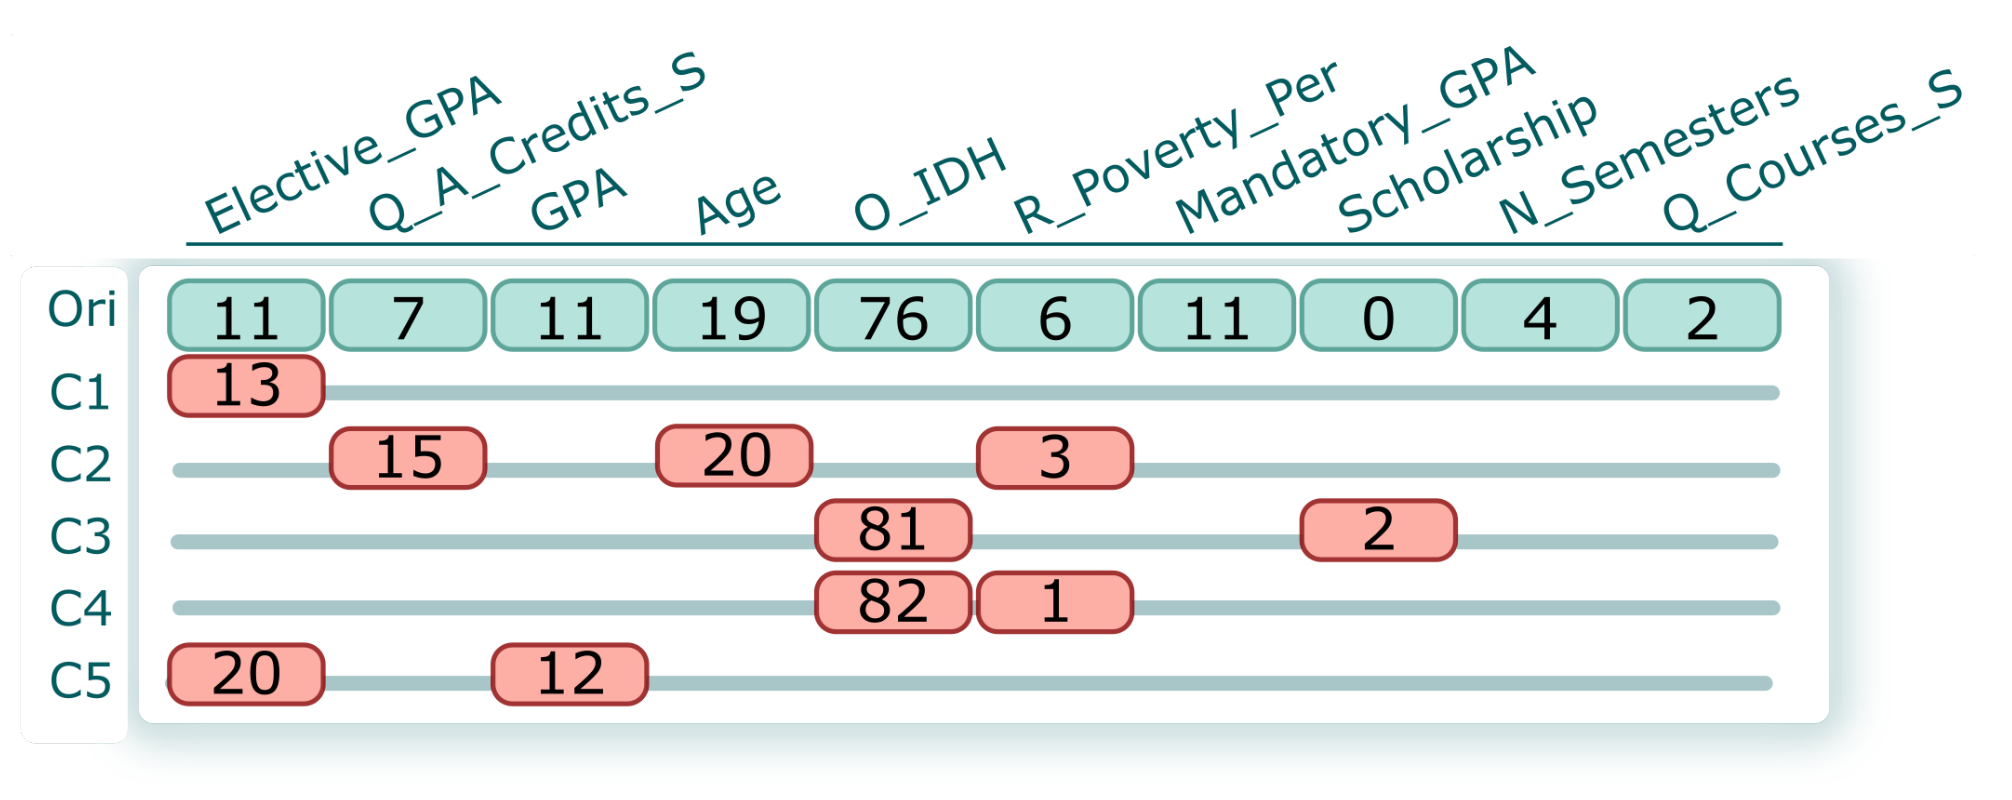
 , relies on a matrix representation comprising a set of blocks, with each block corresponding to a student and their counterfactuals. Figure 5 shows an example of a block. The first row (light-green background) displays the original values for each attribute. At the same time, the line (C1–C5) represents the computed counterfactual of a student. Note that we have included the value and highlighted (red background) the specific characteristic that the counterfactuals suggest modifying. For instance, the counterfactual C1 suggests supporting the student to improve the grade for Elective_GPA (GPA from elective courses) from 11 to 13 (0–20 scale). In contrast, C4 suggests that socioeconomic variables play an important role in avoiding dropout for a student. Therefore, C4 suggests increasing O_IDH (origin IDH) from 76% to 81% and reducing R_Poverty_Per (residence poverty percentage) from 6% to 1%. The students and their counterfactuals could be re-sorted based on previously calculated quantitative metrics (feasibility and factibility). This organization helps analysts select specific counterfactuals for further analysis and investigation (AO4).
 , shows the real values of the students. Each row corresponds to the students’ feature values. It is possible to filter interactively using the header of each column (using ascending and descending sorting). Furthermore, suppose the analyst needs to filter a group of students based on some conditions. In this case, it can be achieved by using a Filter query based on the DataFrame structure from Python’s pandas library (AO5).
 ). Once the analysts have determined the group of students they want to analyze, it is possible to select some counterfactuals in the Counterfactual Exploration view and measure how these changes could influence each group. For this purpose, for a group of students, we change the values based on the counterfactual’s suggestion, and using the pre-trained model we compute how many of the students are no longer dropouts (AO6). For instance, in Figure 6, for two groups (female and male), the same counterfactual has a different impact. The gray dot shows the number of dropouts from that group, and the arrowhead represents the number of dropouts from that group after implementation of a counterfactual suggestion.
4.1. Visual Exploration Workflow
 . Once the users are familiar with the attributes, it is necessary for the analysis of potential dropout students to be mapped onto the SP view
  . Users could select a different set of students based on the indicators (e.g., probability, factibility, and feasibility). Once a group of interest is identified in the SP view, our CP view
  displays all the counterfactuals associated with the previous selection. Users can freely choose a set of counterfactuals to inspect. For counterfactual inspection, the next step is to use the Counterfactual Exploration view
  , which shows the original values for each attribute. At the same time, the computed counterfactuals show only the values that need to be modified. The students and their counterfactuals could be re-sorted based on feasibility and factibility, to help users select specific counterfactuals for further analysis and investigation. Finally, the users could measure how the changes suggested by a selected counterfactual could influence some students using the Impact view
  , which shows the extent to which it could be possible to reduce the number of dropouts. For this purpose, it is necessary to select subsets of students for which the users can measure the impact. To choose the subsets, the users could use Table view
  , applying some filters.
 , and
, and  ) to consider a new group of students/counterfactuals and obtain a further analysis.
4.2. Implementation Details
5. Case Studies
5.1. Analyzing Counterfactuals on a Specific Group of Students
 shows the Dropout Analysis dual view of the students and the counterfactuals involved in the analysis. Based on the default presentation of these views (Student Projection view and Counterfactual Projection view), Expert_1 redefined his analysis. He wanted to analyze the students near the threshold line (high probability) and to determine which variables should be improved to prevent dropouts. Using lasso selection, Expert_1 selected students with the highest probability of becoming non-dropouts (highlighted in
  ), expecting that they would need fewer changes in their original values to become non-dropouts. This selection consisted of 30 students, all predicted as dropouts. Figure 7
  shows around 150 counterfactuals (5 for each student). However, Expert_1 noted that the counterfactuals are also sorted by their probabilities, and therefore his analysis focused on certain groups based on their probabilities. Analyzing the counterfactuals, Counterfactual Exploration view (Figure 7
  ) showed that the most relevant variables were linked to Q_A_Credits_S (), Mandatory_GPA (), GPA (), Scholarship (), R_Poverty_Per (), Elective_GPA (), O_HDI (), Q_Courses_S (), and so on. For instance, the first alternative for the first student (dashed line in
  ) was to increase the number of approved credits per semester (from 8 to 19) and the quantity of lectures in one semester (from 4 to 6). In the same way, it is possible to analyze all the counterfactuals. However, analyzing each student’s counterfactuals individually is a tedious task, and using some organization based on metrics is a better alternative.
 shows the student with the most feasible alternative, suggesting a change in Q_A_Credits_S from 12 to 17 and in GPA from 12 to 15. In the same vein, it is possible to consider counterfactuals based on Factibility, as shown in
  .
. , and therefore Expert_1 was interested in selecting male and female groups. Expert_1 used the Table view, using the pandas queries (Gender “M” and Gender “F”). In these impact analyses, Expert_1 considered the most feasible and factible counterfactuals. He also selected one counterfactual based on his own expertise (
  ). The Impact view (
  ) shows the impact of each selected counterfactual. As shown in Table 3, the most feasible counterfactual (
  ) and its suggested changes achieved a reduction of for male dropouts, for female dropouts, and for total dropouts. In the same way, the most factible counterfactual (
  ) reduced male dropouts by , female dropouts by , and total dropouts by . Finally, Expert_1’s selected counterfactual (
  ) gave the best results, reducing dropouts by for males, for females, and for total dropouts.
5.2. Inter-Office Cooperation
6. Domain Experts’ Validations
- Q1: Does the methodology of the SDA-Vis system help you to analyze and reduce dropouts?
- Q2: Are the findings of the SDA-Vis system relevant?
- Q3: Is the SDA-Vis system more suitable for dropout reduction than the system you use?
- Q4: Is the SDA-Vis system easier to use than the current system?
7. Discussion and Limitations
- Automatic student performance prediction. We used a counterfactual explanation to generate synthetic solutions for a dropout student. However, the domain experts were also interested in automatically determining student performance. This analysis can improve the quality of feedback given to students [65]. In future work, we plan to address the analysis of secondary school grades in our research. Moreover, our approach could also design proper vocational orientation for a particular student.
- Multiple Data Sources and Scenarios. Combining different types of information about students and their environments such as high school grades, parents’ educational level, socioeconomic level, distance to the university, and university infrastructure would be helpful for analyzing the whole scenario. Given the increasing number of initiatives by the university authorities to provide that information, an immediate direction for future work will be to combine different data sources to enrich the SDA-Vis system. Moreover, although this system was applied to the studied university, our approach could be extended to other universities, considering different data types and scenarios. The user can choose the model, data source, and scenario to improve academic performance, student retention, and curriculum design. Our approach could be versatile enough to be applied to different contexts such as loan analysis, crime reduction, and analysis of the spread of disease.
- Global approach. SDA-Vis only used the counterfactual explanations to prevent student dropout. Although this satisfied the users’ requirements, we have discussed constructing a global student scenario analysis system. This could be used, for instance, to apply counterfactuals to improve the design structure of lectures, recommend courses to students, improve a professor’s performance, and calibrate the university’s fee. We are interested in tackling educational problems by using counterfactuals or other mathematical and computational mechanisms in a unique integrated analytical system, in future work.
- Longitudinal analysis. Despite the experiments, case studies, and validation process we conducted with the university’s real data set, we consider that a longitudinal study of current students could be interesting, to address the system’s usefulness in reality. We are interested in applying SDA-Vis’s suggested actions to current students and analyzing the changes over time, in future analyses.
8. Conclusions
Supplementary Materials
Author Contributions
Funding
Institutional Review Board Statement
Informed Consent Statement
Data Availability Statement
Conflicts of Interest
References
- Gregorio, J.D.; Lee, J.W. Education and income inequality: New evidence from cross-country data. Rev. Income Wealth 2002, 48, 395–416. [Google Scholar] [CrossRef]
- Asha, P.; Vandana, E.; Bhavana, E.; Shankar, K.R. Predicting University Dropout through Data Analysis. In Proceedings of the 4th International Conference on Trends in Electronics and Informatics (ICOEI)(48184), Tirunelveli, India, 15–17 June 2020; pp. 852–856. [Google Scholar]
- Solís, M.; Moreira, T.; Gonzalez, R.; Fernandez, T.; Hernandez, M. Perspectives to predict dropout in university students with machine learning. In Proceedings of the 2018 IEEE International Work Conference on Bioinspired Intelligence (IWOBI), San Carlos, Costa Rica, 18–20 July 2018; pp. 1–6. [Google Scholar]
- Pachas, D.A.G.; Garcia-Zanabria, G.; Cuadros-Vargas, A.J.; Camara-Chavez, G.; Poco, J.; Gomez-Nieto, E. A comparative study of WHO and WHEN prediction approaches for early identification of university students at dropout risk. In Proceedings of the 2021 XLVII Latin American Computing Conference (CLEI), Cartago, Costa Rica, 25–29 October 2021; pp. 1–10. [Google Scholar]
- Ameri, S.; Fard, M.J.; Chinnam, R.B.; Reddy, C.K. Survival analysis based framework for early prediction of student dropouts. In Proceedings of the 25th ACM International on Conference on Information and Knowledge Management, Indianapolis, IN, USA, 24–28 October 2016; pp. 903–912. [Google Scholar]
- Rovira, S.; Puertas, E.; Igual, L. Data-driven system to predict academic grades and dropout. PLoS ONE 2017, 12, 171–207. [Google Scholar] [CrossRef] [PubMed] [Green Version]
- Barbosa, A.; Santos, E.; Pordeus, J.P. A machine learning approach to identify and prioritize college students at risk of dropping out. In Brazilian Symposium on Computers in Education; Sociedade Brasileira de Computação: Recife, Brazil, 2017; pp. 1497–1506. [Google Scholar]
- Palmer, S. Modelling engineering student academic performance using academic analytics. IJEE 2013, 29, 132–138. [Google Scholar]
- Gitinabard, N.; Khoshnevisan, F.; Lynch, C.F.; Wang, E.Y. Your actions or your associates? Predicting certification and dropout in MOOCs with behavioral and social features. arXiv 2018, arXiv:1809.00052. [Google Scholar]
- Aulck, L.; Aras, R.; Li, L.; L’Heureux, C.; Lu, P.; West, J. STEM-ming the Tide: Predicting STEM attrition using student transcript data. arXiv 2017, arXiv:1708.09344. [Google Scholar]
- Gutierrez-Pachas, D.A.; Garcia-Zanabria, G.; Cuadros-Vargas, A.J.; Camara-Chavez, G.; Poco, J.; Gomez-Nieto, E. How Do Curricular Design Changes Impact Computer Science Programs?: A Case Study at San Pablo Catholic University in Peru. Educ. Sci. 2022, 12, 242. [Google Scholar] [CrossRef]
- Wachter, S.; Mittelstadt, B.; Russell, C. Counterfactual explanations without opening the black box: Automated decisions and the GDPR. Harv. JL Tech. 2017, 31, 841. [Google Scholar] [CrossRef] [Green Version]
- Mothilal, R.K.; Sharma, A.; Tan, C. Explaining machine learning classifiers through diverse counterfactual explanations. In Proceedings of the 2020 Conference on Fairness, Accountability and Transparency, Barcelona, Spain, 27–30 January 2020; pp. 607–617. [Google Scholar]
- Cheng, F.; Ming, Y.; Qu, H. DECE: Decision Explorer with Counterfactual Explanations for Machine Learning Models. IEEE Trans. Vis. Comput. Graph. 2020, 27, 1438–1447. [Google Scholar] [CrossRef] [PubMed]
- Molnar, C.; Casalicchio, G.; Bischl, B. Interpretable Machine Learning - A Brief History, State-of-the-Art and Challenges. In Proceedings of the Joint European Conference on Machine Learning and Knowledge Discovery in Databases, Ghent, Belgium, 14–18 September 2020. [Google Scholar]
- Zoric, A.B. Benefits of educational data mining. In Proceedings of the Economic and Social Development: Book of Proceedings, Split, Croatia, 19–20 September 2019; pp. 1–7. [Google Scholar]
- Ganesh, S.H.; Christy, A.J. Applications of educational data mining: A survey. In Proceedings of the 2015 International Conference on Innovations in Information, Embedded and Communication Systems (ICIIECS), Coimbatore, India, 19–20 March 2015; pp. 1–6. [Google Scholar]
- Da Fonseca Silveira, R.; Holanda, M.; de Carvalho Victorino, M.; Ladeira, M. Educational data mining: Analysis of drop out of engineering majors at the UnB-Brazil. In Proceedings of the 18th IEEE International Conference On Machine Learning And Applications (ICMLA), Boca Raton, FL, USA, 16–19 December 2019; pp. 259–262. [Google Scholar]
- De Baker, R.S.J.; Inventado, P.S. Chapter X: Educational Data Mining and Learning Analytics. Comput. Sci. 2014, 7, 1–16. [Google Scholar]
- Rigo, S.J.; Cazella, S.C.; Cambruzzi, W. Minerando Dados Educacionais com foco na evasão escolar: Oportunidades, desafios e necessidades. In Proceedings of the Anais do Workshop de Desafios da Computação Aplicada à Educação, Curitiba, Brazil, 17–18 July 2012; pp. 168–177. [Google Scholar]
- Agrusti, F.; Bonavolontà, G.; Mezzini, M. University Dropout Prediction through Educational Data Mining Techniques: A Systematic Review. Je-LKS 2019, 15, 161–182. [Google Scholar]
- Baranyi, M.; Nagy, M.; Molontay, R. Interpretable Deep Learning for University Dropout Prediction. In Proceedings of the 21st Annual Conference on Information Technology Education, Odesa, Ukraine, 13–19 September 2020; pp. 13–19. [Google Scholar]
- Agrusti, F.; Mezzini, M.; Bonavolontà, G. Deep learning approach for predicting university dropout: A case study at Roma Tre University. Je-LKS 2020, 16, 44–54. [Google Scholar]
- Brdesee, H.S.; Alsaggaf, W.; Aljohani, N.; Hassan, S.U. Predictive Model Using a Machine Learning Approach for Enhancing the Retention Rate of Students At-Risk. Int. J. Semant. Web Inf. Syst. (IJSWIS) 2022, 18, 1–21. [Google Scholar] [CrossRef]
- Waheed, H.; Hassan, S.U.; Aljohani, N.R.; Hardman, J.; Alelyani, S.; Nawaz, R. Predicting academic performance of students from VLE big data using deep learning models. Comput. Hum. Behav. 2020, 104, 106189. [Google Scholar] [CrossRef] [Green Version]
- Waheed, H.; Anas, M.; Hassan, S.U.; Aljohani, N.R.; Alelyani, S.; Edifor, E.E.; Nawaz, R. Balancing sequential data to predict students at-risk using adversarial networks. Comput. Electr. Eng. 2021, 93, 107274. [Google Scholar] [CrossRef]
- Zhang, L.; Rangwala, H. Early identification of at-risk students using iterative logistic regression. In International Conference on Artificial Intelligence in Education; Springer: Berlin/Heidelberg, Germany, 2018; pp. 613–626. [Google Scholar]
- Qiu, J.; Tang, J.; Liu, T.X.; Gong, J.; Zhang, C.; Zhang, Q.; Xue, Y. Modeling and predicting learning behavior in MOOCs. In Proceedings of the Ninth ACM International Conference on Web Search and Data Mining, San Francisco, CA, USA, 22–25 February 2016; pp. 93–102. [Google Scholar]
- Lee, E.T.; Wang, J. Statistical Methods for Survival Data Analysis; John Wiley & Sons: Hoboken, NJ, USA, 2003; Volume 476. [Google Scholar]
- Rebasa, P. Conceptos básicos del análisis de supervivencia. Cirugía Española 2005, 78, 222–230. [Google Scholar] [CrossRef]
- Chen, Y.; Johri, A.; Rangwala, H. Running out of stem: A comparative study across stem majors of college students at-risk of dropping out early. In Proceedings of the 8th International Conference on Learning Analytics and Knowledge, Sydney, NSW, Australia, 7–9 March 2018; pp. 270–279. [Google Scholar]
- Juajibioy, J.C. Study of university dropout reason based on survival model. OJS 2016, 6, 908–916. [Google Scholar] [CrossRef] [Green Version]
- Yang, D.; Sinha, T.; Adamson, D.; Rosé, C.P. Turn on, tune in, drop out: Anticipating student dropouts in massive open online courses. In Proceedings of the 2013 NIPS Data-Driven Education Workshop, Lake Tahoe, NV, USA, 9 December 2013; Volume 11, p. 14. [Google Scholar]
- Stepin, I.; Alonso, J.M.; Catala, A.; Pereira-Fariña, M. A survey of contrastive and counterfactual explanation generation methods for explainable artificial intelligence. IEEE Access 2021, 9, 11974–12001. [Google Scholar] [CrossRef]
- Artelt, A.; Hammer, B. On the computation of counterfactual explanations–A survey. arXiv 2019, arXiv:1911.07749. [Google Scholar]
- Kovalev, M.S.; Utkin, L.V. Counterfactual explanation of machine learning survival models. Informatica 2020, 32, 817–847. [Google Scholar] [CrossRef]
- Verma, S.; Dickerson, J.; Hines, K. Counterfactual Explanations for Machine Learning: A Review. arXiv 2020, arXiv:2010.10596. [Google Scholar]
- Spangher, A.; Ustun, B.; Liu, Y. Actionable recourse in linear classification. In Proceedings of the 5th Workshop on Fairness, Accountability and Transparency in Machine Learning, New York, NY, USA, 23–24 February 2018. [Google Scholar]
- Ramon, Y.; Martens, D.; Provost, F.; Evgeniou, T. Counterfactual explanation algorithms for behavioral and textual data. arXiv 2019, arXiv:1912.01819. [Google Scholar]
- White, A.; Garcez, A.d. Measurable counterfactual local explanations for any classifier. arXiv 2019, arXiv:1908.03020. [Google Scholar]
- Laugel, T.; Lesot, M.J.; Marsala, C.; Renard, X.; Detyniecki, M. Comparison-based inverse classification for interpretability in machine learning. In IPMU; Springer: Berlin/Heidelberg, Germany, 2018; pp. 100–111. [Google Scholar]
- Dhurandhar, A.; Chen, P.Y.; Luss, R.; Tu, C.C.; Ting, P.; Shanmugam, K.; Das, P. Explanations based on the missing: Towards contrastive explanations with pertinent negatives. In Proceedings of the Advances in Neural Information Processing Systems, Montreal, QC, Canada, 3–8 December 2018. [Google Scholar]
- Dhurandhar, A.; Pedapati, T.; Balakrishnan, A.; Chen, P.Y.; Shanmugam, K.; Puri, R. Model agnostic contrastive explanations for structured data. arXiv 2019, arXiv:1906.00117. [Google Scholar]
- Van Looveren, A.; Klaise, J. Interpretable counterfactual explanations guided by prototypes. arXiv 2019, arXiv:1907.02584. [Google Scholar]
- Goyal, Y.; Wu, Z.; Ernst, J.; Batra, D.; Parikh, D.; Lee, S. Counterfactual Visual Explanations. In Proceedings of the International Conference on Machine Learning, Long Beach, CA, USA, 9–15 June 2019; Volume 97, pp. 2376–2384. [Google Scholar]
- Yuan, J.; Chen, C.; Yang, W.; Liu, M.; Xia, J.; Liu, S. A survey of visual analytics techniques for machine learning. Comput. Vis. Media 2020, 7, 3–36. [Google Scholar] [CrossRef]
- Liu, S.; Wang, X.; Liu, M.; Zhu, J. Towards better analysis of machine learning models: A visual analytics perspective. Vis. Informatics 2017, 1, 48–56. [Google Scholar] [CrossRef]
- Hohman, F.; Kahng, M.; Pienta, R.; Chau, D.H. Visual analytics in deep learning: An interrogative survey for the next frontiers. IEEE Trans. Vis. Comput. Graph. 2018, 25, 2674–2693. [Google Scholar] [CrossRef]
- Sacha, D.; Kraus, M.; Keim, D.A.; Chen, M. Vis4ml: An ontology for visual analytics assisted machine learning. IEEE Trans. Vis. Comput. Graph. 2018, 25, 385–395. [Google Scholar] [CrossRef] [Green Version]
- Wang, Q.; Xu, Z.; Chen, Z.; Wang, Y.; Liu, S.; Qu, H. Visual analysis of discrimination in machine learning. IEEE Trans. Vis. Comput. Graph. 2020, 27, 1470–1480. [Google Scholar] [CrossRef]
- Wexler, J.; Pushkarna, M.; Bolukbasi, T.; Wattenberg, M.; Viégas, F.; Wilson, J. The what-if tool: Interactive probing of machine learning models. IEEE Trans. Vis. Comput. Graph. 2019, 26, 56–65. [Google Scholar] [CrossRef] [Green Version]
- Spinner, T.; Schlegel, U.; Schäfer, H.; El-Assady, M. explAIner: A visual analytics framework for interactive and explainable machine learning. IEEE Trans. Vis. Comput. Graph. 2019, 26, 1064–1074. [Google Scholar] [CrossRef] [PubMed] [Green Version]
- Collaris, D.; van Wijk, J.J. ExplainExplore: Visual exploration of machine learning explanations. In Proceedings of the 2020 IEEE Pacific Visualization Symposium (PacificVis), Tianjin, China, 3–5 June 2020; pp. 26–35. [Google Scholar]
- Zhang, J.; Wang, Y.; Molino, P.; Li, L.; Ebert, D.S. Manifold: A model-agnostic framework for interpretation and diagnosis of machine learning models. IEEE Trans. Vis. Comput. Graph. 2018, 25, 364–373. [Google Scholar] [CrossRef] [Green Version]
- Ming, Y.; Qu, H.; Bertini, E. Rulematrix: Visualizing and understanding classifiers with rules. IEEE Trans. Vis. Comput. Graph. 2018, 25, 342–352. [Google Scholar] [CrossRef] [PubMed] [Green Version]
- Gomez, O.; Holter, S.; Yuan, J.; Bertini, E. ViCE: Visual counterfactual explanations for machine learning models. In Proceedings of the 25th International Conference on Intelligent User Interfaces, Cagliari, Italy, 17–20 March 2020; pp. 531–535. [Google Scholar]
- Deng, H.; Wang, X.; Guo, Z.; Decker, A.; Duan, X.; Wang, C.; Ambrose, G.A.; Abbott, K. Performancevis: Visual analytics of student performance data from an introductory chemistry course. Vis. Informatics 2019, 3, 166–176. [Google Scholar] [CrossRef]
- Pedregosa, F.; Varoquaux, G.; Gramfort, A.; Michel, V.; Thirion, B.; Grisel, O.; Blondel, M.; Prettenhofer, P.; Weiss, R.; Dubourg, V.; et al. Scikit-learn: Machine Learning in Python. J. Mach. Learn. Res. 2011, 12, 2825–2830. [Google Scholar]
- Xenos, M.; Pierrakeas, C.; Pintelas, P. A survey on student dropout rates and dropout causes concerning the students in the Course of Informatics of the Hellenic Open University. Comput. Educ. 2002, 39, 361–377. [Google Scholar] [CrossRef]
- Pappas, I.O.; Giannakos, M.N.; Jaccheri, L. Investigating factors influencing students’ intention to dropout computer science studies. In Proceedings of the 2016 ACM Conference on Innovation and Technology in Computer Science Education, Arequipa, Peru, 11–13 July 2016; pp. 198–203. [Google Scholar]
- Lent, R.W.; Brown, S.D.; Hackett, G. Contextual supports and barriers to career choice: A social cognitive analysis. J. Couns. Psychol. 2000, 47, 36. [Google Scholar] [CrossRef]
- Reisberg, R.; Raelin, J.A.; Bailey, M.B.; Hamann, J.C.; Whitman, D.L.; Pendleton, L.K. The effect of contextual support in the first year on self-efficacy in undergraduate engineering programs. In Proceedings of the 2011 ASEE Annual Conference & Exposition, Vancouver, BC, Canada, 26–29 June 2011; pp. 22–1445. [Google Scholar]
- Bonaldo, L.; Pereira, L.N. Dropout: Demographic profile of Brazilian university students. Procedia-Soc. Behav. Sci. 2016, 228, 138–143. [Google Scholar] [CrossRef] [Green Version]
- Ononye, L.; Bong, S. The Study of the Effectiveness of Scholarship Grant Program on Low-Income Engineering Technology Students. J. STEM Educ. 2018, 18, 26–31. [Google Scholar]
- Sheshadri, A.; Gitinabard, N.; Lynch, C.F.; Barnes, T.; Heckman, S. Predicting student performance based on online study habits: A study of blended courses. arXiv 2019, arXiv:1904.07331. [Google Scholar]
 Feature Distribution Bars view,
  Student Projection view,
  Counterfactual Projection view,
  Counterfactual Exploration view,
  Table view, and
  Impact view.
 Feature Distribution Bars view,
  Student Projection view,
  Counterfactual Projection view,
  Counterfactual Exploration view,
  Table view, and
  Impact view.

 represents selection of students and their counterfactuals, respectively,
  shows the counterfactuals, where
  shows random counterfactuals,
  shows the most feasible,
  shows the most factible, and
  shows the user-selected counterfactual. In addition,
  shows the student distribution and
  shows the impact of the selected counterfactuals (B2–B4).
 represents selection of students and their counterfactuals, respectively,
  shows the counterfactuals, where
  shows random counterfactuals,
  shows the most feasible,
  shows the most factible, and
  shows the user-selected counterfactual. In addition,
  shows the student distribution and
  shows the impact of the selected counterfactuals (B2–B4).
| Attribute | Variable |
|---|---|
| ID | Student ID |
| N_Cod_Student | Number of enrollments at the university |
| Gender | Gender of student (male/female) |
| Age | Age of student (birth date) |
| O_IDH | Origin HDI |
| O_Poverty_Per | Origin percentage of poverty |
| R_IDH | Residence HDI |
| R_Poverty_Per | Residence percentage of poverty |
| Marital_S | Whether the student is married or not |
| School_Type | School type (private or public) |
| N_Reservation | Average number of reservations per semester |
| Q_Courses_S | Number of lectures per semester. |
| Q_A_Credits_S | Number of passed credits |
| Mandatory_GPA | Average GPA of the mandatory lectures |
| Elective_GPA | Average GPA of elective lectures |
| GPA | Final GPA score |
| N_Semesters | Number of completed semesters |
| H_Ausent_S | Average absence rate per semester |
| scholarship | Whether the student has a scholarship or not |
| Enrolled | The student status (target) 1: Yes, 0: No |
| AO1 | AO2 | AO3 | AO4 | AO5 | AO6 | |
|---|---|---|---|---|---|---|
| Feature Distribution Bars view | ✓ | |||||
| Student Projection view | ✓ | |||||
| Counterfactual Projection view | ✓ | |||||
| Counterfactual Exploration view | ✓ | |||||
| Table view | ✓ | ✓ | ||||
| Impact view | ✓ | ✓ |
| Gender == ‘M‘ | Gender == ‘F‘ | Total | ||
|---|---|---|---|---|
| Most Feasible |  | |||
| Most Factible |  | |||
| User Selection |  | |||
| Average |
Publisher’s Note: MDPI stays neutral with regard to jurisdictional claims in published maps and institutional affiliations. |
© 2022 by the authors. Licensee MDPI, Basel, Switzerland. This article is an open access article distributed under the terms and conditions of the Creative Commons Attribution (CC BY) license (https://creativecommons.org/licenses/by/4.0/).
Share and Cite
Garcia-Zanabria, G.; Gutierrez-Pachas, D.A.; Camara-Chavez, G.; Poco, J.; Gomez-Nieto, E. SDA-Vis: A Visualization System for Student Dropout Analysis Based on Counterfactual Exploration. Appl. Sci. 2022, 12, 5785. https://doi.org/10.3390/app12125785
Garcia-Zanabria G, Gutierrez-Pachas DA, Camara-Chavez G, Poco J, Gomez-Nieto E. SDA-Vis: A Visualization System for Student Dropout Analysis Based on Counterfactual Exploration. Applied Sciences. 2022; 12(12):5785. https://doi.org/10.3390/app12125785
Chicago/Turabian StyleGarcia-Zanabria, Germain, Daniel A. Gutierrez-Pachas, Guillermo Camara-Chavez, Jorge Poco, and Erick Gomez-Nieto. 2022. "SDA-Vis: A Visualization System for Student Dropout Analysis Based on Counterfactual Exploration" Applied Sciences 12, no. 12: 5785. https://doi.org/10.3390/app12125785
APA StyleGarcia-Zanabria, G., Gutierrez-Pachas, D. A., Camara-Chavez, G., Poco, J., & Gomez-Nieto, E. (2022). SDA-Vis: A Visualization System for Student Dropout Analysis Based on Counterfactual Exploration. Applied Sciences, 12(12), 5785. https://doi.org/10.3390/app12125785


