Article

Records of Organic Carbon Isotopic Composition and Its Paleoenvironmental Implications in Shengshan Island Loess Deposition in the East China Sea during the Last Glacial Period

1
Key Laboratory of Geo-Information Science of Ministry of Education, East China Normal University, Shanghai 200241, China
2
State Key Laboratory of Isotope Geochemistry, CAS Center for Excellence in Deep Earth Science, Guangzhou Institute of Geochemistry, Chinese Academy of Sciences, Guangzhou 510640, China
*
Author to whom correspondence should be addressed.
Appl. Sci. 2022, 12(11), 5724; https://doi.org/10.3390/app12115724
Submission received: 6 April 2022 / Revised: 26 May 2022 / Accepted: 31 May 2022 / Published: 4 June 2022
(This article belongs to the Special Issue Solar Cycle and Climate Effect)

Abstract

:
Organic carbon isotopic composition (δ13Corg) in loess deposits is an important indicator of terrestrial paleovegetation, and it has been widely used for paleoenvironmental reconstruction in aeolian sediments around the world. However, little research has been done on the variation and paleoenvironmental implication of δ13Corg from loess deposits on Shengshan Island, East China Sea, during the last glacial period (LG). In this research, we present optically stimulated luminescence (OSL) ages, total organic carbon (TOC) data and δ13Corg records of the loess section at Chenqianshan (CQS) on Shengshan Island. Additionally, to study the effectiveness of δ13Corg in documenting paleoenvironmental changes, magnetic susceptibilities and diffuse reflectance spectra were surveyed. TOC concentration for the CQS loess section ranged from 0.11% to 0.47%, and the δ13Corg composition of the CQS loess section varied between −20.80‰ and −24.56‰ during the LG. The average value of C4 abundance was 21.31%. TOC, δ13Corg, χfd, and Hm/(Hm + Gt) curves for the CQS loess section showed similar patterns. The results of our study indicated that the vegetation of the CQS loess deposit was mainly C3/C4 mixed vegetation, and C3 vegetation was the most important vegetation. The comparison between the δ13Corg curve for the CQS section and other existing δ13Corg records of the loess sections from central and northern China showed similar trends and their vegetation succession exhibited synchronous change during the LG. Based on a comparison of the δ13Corg record, C4 abundance and χfd of the CQS section and other global geological records, it was concluded that the mutual effects of precipitation and temperature caused the change of paleovegetation in loess deposits on islands in the East China Sea during the LG.

1. Introduction

Because of their different photosynthesis, terrestrial plants are commonly called C3 plants and C4 plants. The values of carbon isotopic composition (δ13Corg) of modern C3 plants range between ~−22‰ and −30‰. The δ13Corg composition of modern C4 plants varies from ~−9‰ to −19‰ [1,2]. Pure C3 plants prefer to grow in cold, humid and high concentration CO2 conditions, but pure C4 plants prefer to grow in hot, arid and low concentration CO2 conditions [3]. The δ13Corg composition of the soil is controlled by vegetation and environmental conditions. Theoretically, the δ13Corg composition of the soil can be used to study the change of relative abundance of C3/C4 plants and the reconstruction of paleoenvironment and paleoclimate in the past geological history period [4,5,6]. Many studies have shown that, in addition to genetic factors, environmental factors, such as precipitation, temperature and CO2 concentrations, could affect the δ13Corg composition of soil [7,8,9]. The climate was cold and dry, and the atmospheric CO2 concentration was low during the last glacial period (LG). A relatively dry climate and low CO2 concentration were beneficial to the growth of C4 plants, however, low temperature limited the growth of C4 plants [7]. It was demonstrated that during the LG, the values of δ13Corg in loess deposits have been more negative than those in paleosols [10,11,12]. However, in the eastern part of Europe, in the Tianshan Mountains and the northwest of the Chinese Loess Plateau, the δ13Corg composition in loess deposits has been more positive than those in paleosols during the LG [6,13,14]. Moreover, the vegetation was mainly controlled by C3 plants, and the signal of C4 vegetation was not obvious in these regions. Thus, it is necessary to further investigate the response of δ13Corg composition from the loess-paleosol sequences to climate or environmental conditions in different time scales and regions during the LG [7,15,16].
Marine isotope stages (MIS) are an alternate stage of cold and warm in the earth’s paleoclimate, inferred from oxygen isotope data reflecting temperature changes. Modern times are marked as the first stage of the MIS. The even stage usually has a high level of 18O, and it is a cold ice stage, while the odd stage is a warm interglacial stage [17]. Malan loess was formed by the accumulation of dust and the process of loess formation during the last glacial period [18]. An et al. [19] divided Malan loess into three stages, namely L1L1, L1S1 and L1L2. Among them, L1L1 and L1L2 are the early and late Malan loess deposits, and L1S1 is the paleosol in the middle of the Malan loess. Kukla et al. [20] found that the magnetic susceptibility in the middle part of the Malan loess is higher than that in other horizons, which can be compared with MIS 3. Therefore, the L1L1, L1S1 and L1L2 stages in Malan loess correspond to MIS 2, MIS 3 and MIS 4, respectively [21].
There are many islands in the eastern extension areas of China, and they are scattered with loess deposits [22]. Studies of island loess deposits mainly focused on ages, particle sizes, spectral characteristics, elements and magnetic proxy indicators [23,24,25,26,27]. Shengshan Island is one of the Zhoushan Islands. The hillside of the island comprises exposed granite bedrock, and it is covered with loess deposits. Until now, little study has been done on the variation and paleoenvironmental implication of loess deposits’ δ13Corg composition on Shengshan Island, East China Sea. Therefore, the process and response mechanism of the δ13Corg change in this area is still unclear.
Here, we display total organic carbon (TOC) data, organic carbon isotope composition (δ13Corg), frequency-dependent magnetic susceptibility (χfd) and diffuse reflectance spectra (DRS) for the loess section on Shengshan Island. By combining these data with the results of optically stimulated luminescence (OSL) dating, this study is intended to (1) recognize the variation characteristics of the δ13Corg composition from the CQS loess section in the Shengshan Island area and (2) discuss the mechanism driving the δ13Corg variations in Shengshan Island loess during the LG. Accordingly, the study results will enhance understanding of the paleoenvironment evolution of the East China Sea islands.

2. Materials and Methods
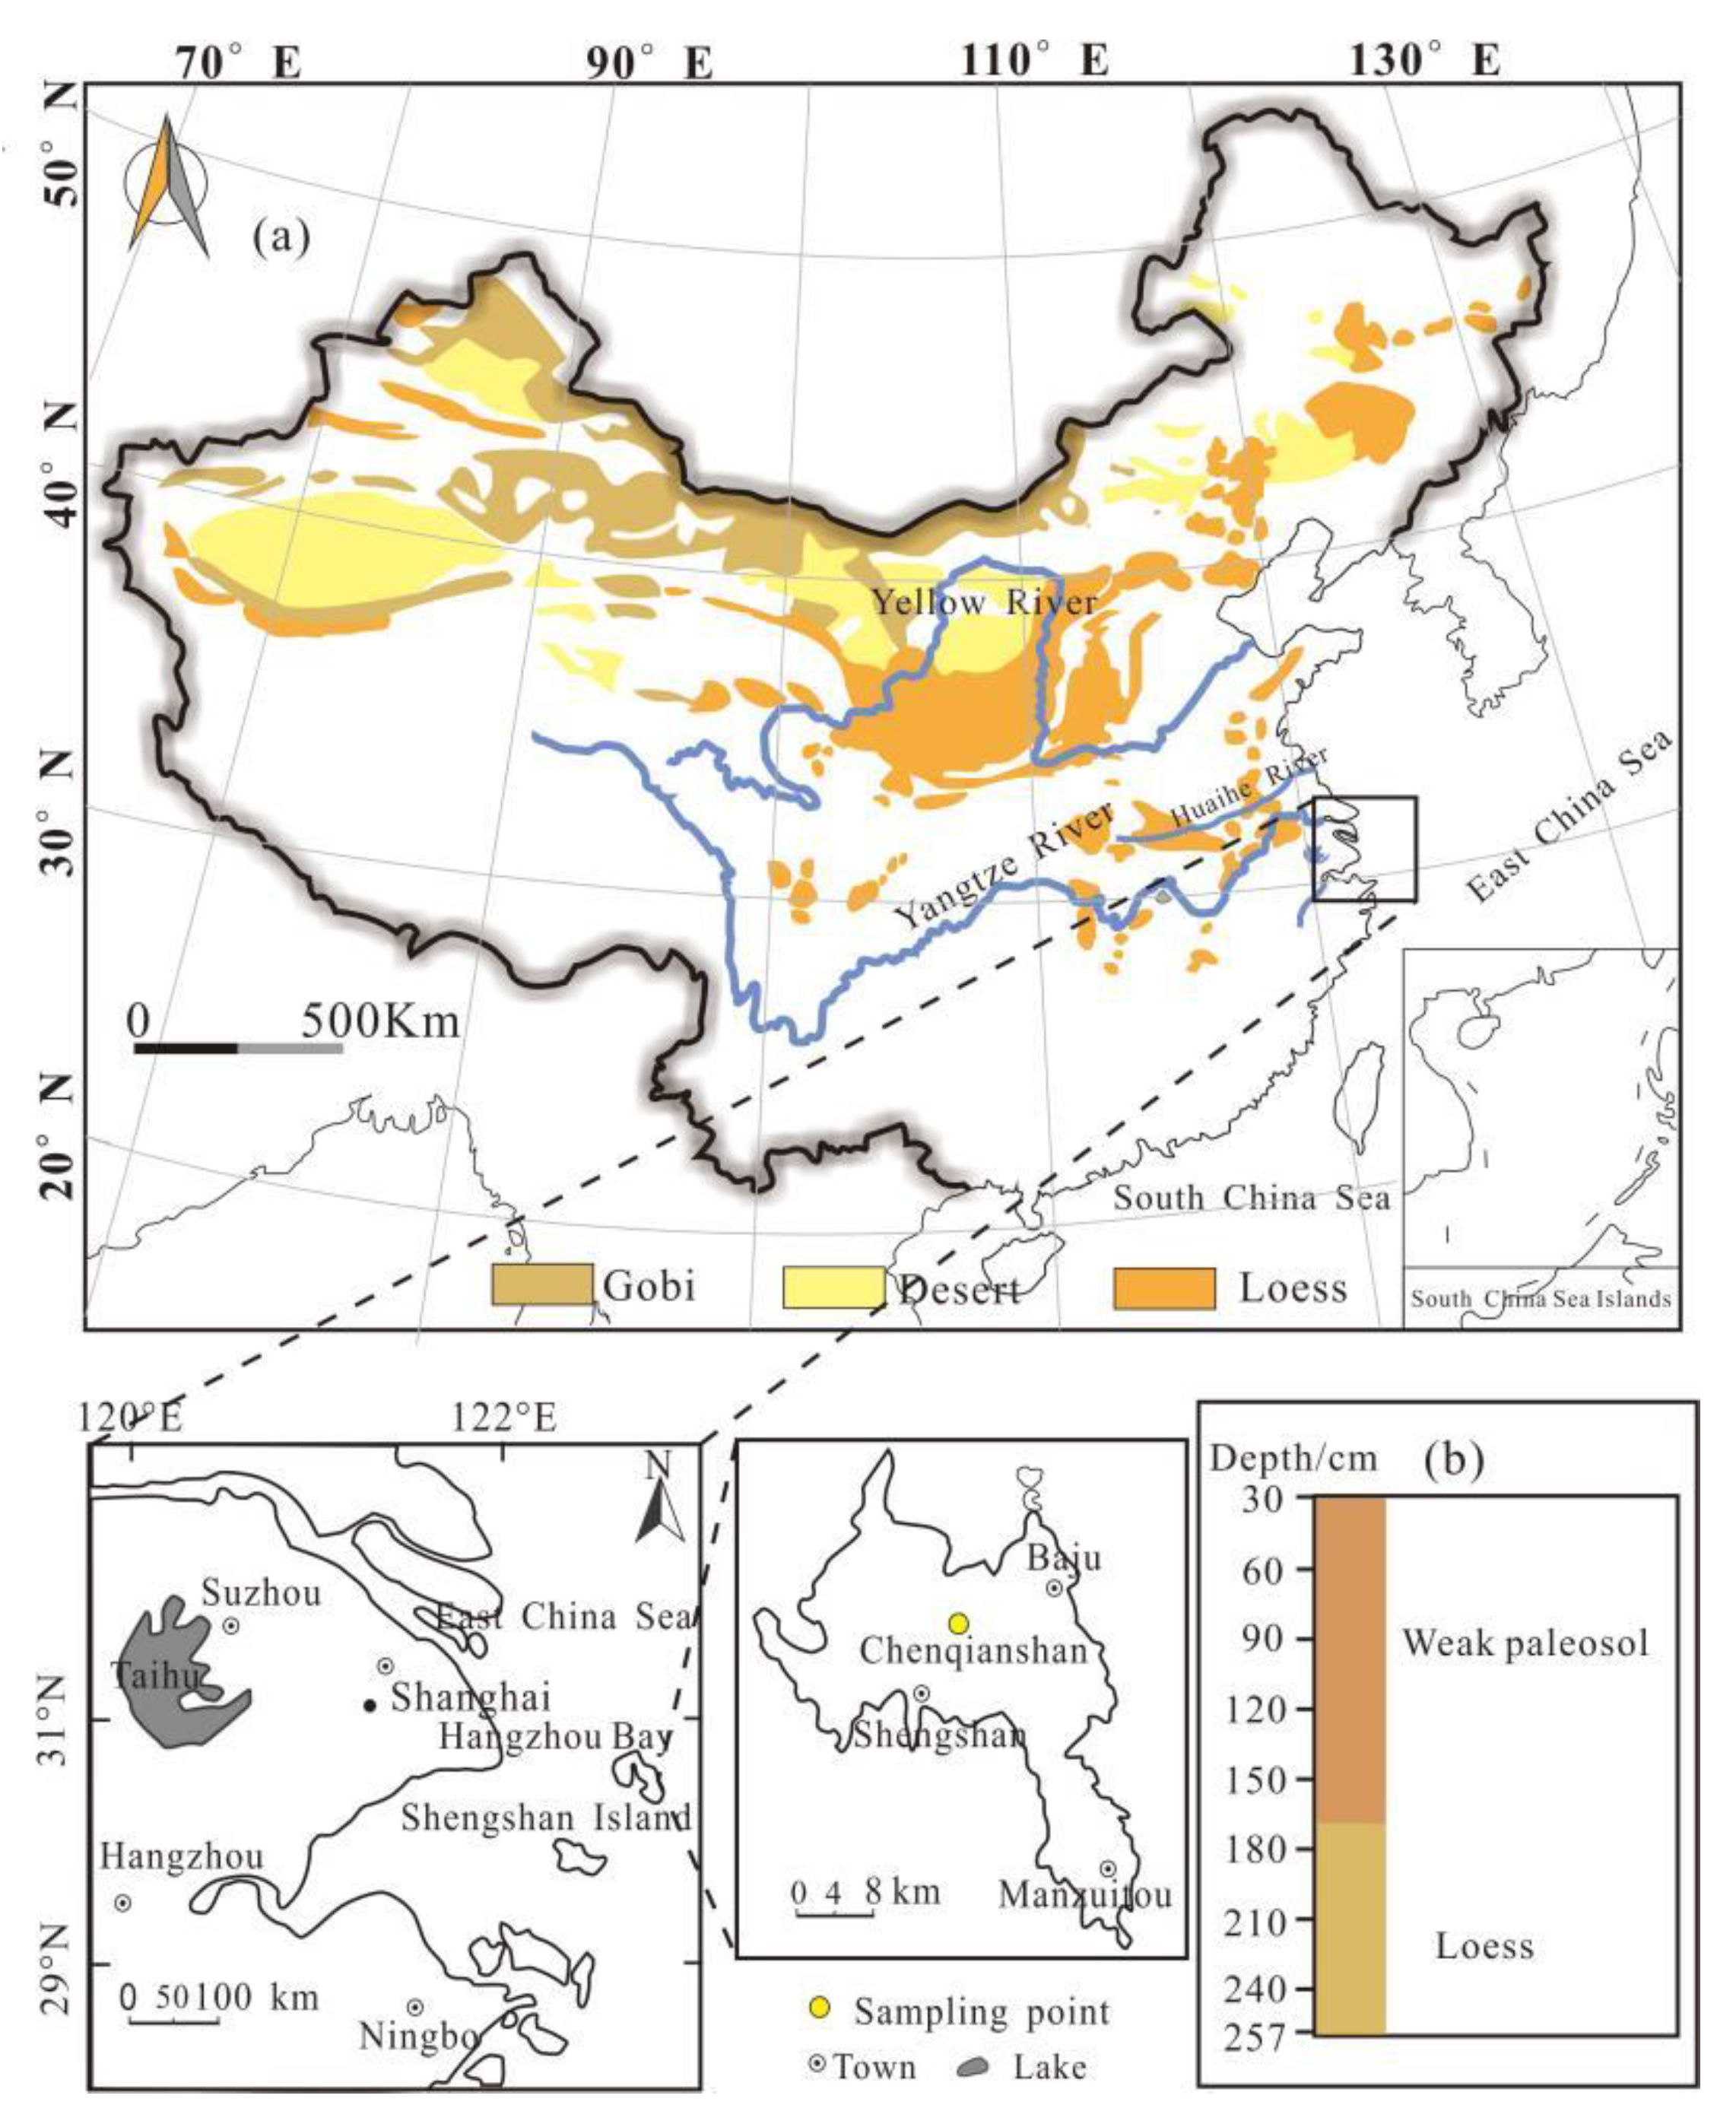
2.1. Study Site

The landscape of Shengshan Island is mountainous and hilly. The climate is mainly controlled by the East Asian monsoon. The mean annual temperature (MAT) is 15~17 °C, the mean annual precipitation (MAP) is 1072 mm, and the solar radiation rate is 48% [26]. Because of the influences of altitude and ecological environment, the vegetation of Shengshan Island is mainly coniferous forests (including mainly black pine forests and Chinese fir forests), with scattered broad-leaved forests. Chenqianshan (CQS) is the highest peak on Shengshan Island, and its average altitude is ~3400 m above sea level. The CQS loess profile is located on the northwest slope of Shengshan Island (latitude 30.73° N, longitude 122.817° E, and altitude 150 m). The 0–30 cm thick CQS loess section is a modern soil layer, which is obviously artificially disturbed. Therefore, this study does not involve a 0–30 cm layer. The lithology of the CQS loess section in this study (30–257 cm thickness) is described as follows (Figure 1): (1) 30–172 cm: this unit is composed of brown weak paleosol, multiferroic manganese film and hard texture, corresponding to the interstadial weak paleosol layer of Malan loess (L1S1) (the L1 loess layer corresponds to the Malan loess in loess stratigraphy); (2) 172–257 cm: the unit consists of brown-yellow loess, and weathered debris of granite bedrock can be seen at the layer, corresponding to the early Malan loess layer (L1L2) [7,18].

2.2. Sample Collection and Preparation

Samples for the OSL were light-proof samples obtained by hammering steel tubes into a fresh loess section. Then, the steel tubes with the samples were wrapped using black plastic bags and adhesive tape to avoid light and water loss before testing. A total of 227 bulk samples were obtained at a 1 cm interval. All samples were dried in an oven at 60 °C for 24 h. The samples were ground and separated into <75 µm parts with a dry sieve. They were measured for TOC, δ13Corg, DRS and geochemical element contents. Unscreened samples were used for magnetic susceptibility analysis.

2.3. Analytical Methods

2.3.1. OSL Dating

Pre-treatment of samples and OSL measurements were carried out at the Luminescence Dating Laboratory of East China Normal University. For OSL dating, quartz grains (38–63 μm) were purified and extracted, then etched with H2SiF6 in a dark room under red light and prepared according to the method of Nian et al. [28]. Quartz grains were used to determine equivalent doses by the single-aliquot regenerative dose method [29]. Neutron activation analysis (NAA) of uranium (U), thorium (Th) and potassium (K) was used to determine the radionuclide concentrations of all samples. The water content of the samples was the actual measured water content. Considering the changes in water content during the geological stage, the given absolute error is 7%.

2.3.2. TOC and δ13Corg Measurements

All 227 sieved samples were used for TOC and δ13Corg analyses. Samples (~1.5 g) were pre-treatment with 10 mL of 10% HCl (v:v) to remove carbonates. Then, the samples were centrifuged and rinsed with distilled water repeatedly to neutrality, and finally, freeze-dried and ground again. Subsequently, a MAT-253 stable isotope ratio mass spectrometer was used to measure the TOC and δ13Corg composition of the samples. The standard deviations of TOC and δ13Corg composition were less than 0.5% and 0.15‰, respectively. All δ13Corg compositions were reported in the V-PDB (Vienna Pee Dee Belemnite) formula: δ13C‰ = [(13C/12C)sample/(13C/12C)standard − 1] × 1000‰.
The method used to calculate the ratio of the C4 plants was to apply the measured δ13Corg composition to the isotope mass balance equation [30]:
C4(%) = [(δ13Corg − δ13C3)/(δ13C4 − δ13C3)] × 100,
where δ13Corg was the carbon isotope composition of the CQS loess section, δ13C3 and δ13C4 represented the average value of the carbon isotope composition from modern C3 and C4 plants, respectively. In order to estimate the relative abundance of C4 plants in the CQS loess section, we took −25‰ and −12‰ as the δ13C composition for C3 and C4 plants, respectively [6].

2.3.3. Magnetic Susceptibility Measurement

The magnetic measurement of the samples referred to the method of Lv et al. [31]. An amount of ~5.0 g of the samples was weighed with precision scales and placed into the magnetic plastic boxes (2 × 2 × 2 cm3). The low-frequency magnetic susceptibility (χlf) (0.47 kHz) and high-frequency magnetic susceptibility (χhf) (4.7 kHz) were measured by the Bartington MS2B dual-frequency magnetic susceptibility meter and calculated. Then, frequency-dependent susceptibility was defined as χfd% = (χlf − χhf)/χlf × 100%.

2.3.4. Diffuse Reflectance Spectra (DRS) Measurement

The sieved samples were put into a plastic ring with a diameter of 4 cm (under a pressure of 15 MPa) to make the test loess piece. The reflectivities of 227 samples were measured by a Perkin Elmer Lambda 950 spectrophotometer. The measured wavelength range was 400–700 nm, and the measurement interval was 2 nm. The reflectivity percentage of the standard color bands was obtained by analyzing the measured reflectivity data [27]. The reflectance percentage of the color band referred to the ratio of the reflectance percentage in a wavelength band to the total visible wavelength reflectance in the sample [32]. We calculated hematite and goethite concentrations in loess samples according to the method of Cheng et al. [27]. The loess samples extracted by the CBD experimental method were used as matrices. Then, standard goethite (Gt) (Hover Color Corp: Arlington Heights, IL, USA, SY610), hematite (Hm) (Bayferrox Corp: Köln, Germany, R4399) and Al(NO3)·9H2O powders with known contents were artificially added into the matrices, respectively. Finally, a series of aluminum substituted standard samples were synthesized (n = 20). After calculation, the linear regression models for the hematite (Hm) and goethite (Gt) contents and characteristic peak intensities were:
Hm% = 2.766 × (I575 + 0.007 × Hm(Al mol%) − 0.002) − 0.077
Gt% = 13.404 × (I535 + 0.002 × Gt(Al mol%) + 0.071 × Hm% + 0.002) − 1.096
where I575 and I535 were the peak intensities corresponding to the characteristic peak for Hm and the main peak for Gt in the first derivative diffuse reflectance spectra of natural samples, respectively. Hm (Al mol%) and Gt (Al mol%) were the aluminum substitution amounts of Hm and Gt in loess samples obtained by XRD tests and calculations. Finally, the ratio of Hm/(Hm + Gt) was calculated according to the values of Hm and Gt.

2.3.5. Geochemical Elemental Composition Measurement

A total of 227 sieved samples were used for the geochemical elemental composition measurement. The contents of Fe2O3, Na2O, CaO, K2O and Al2O3 in the samples were determined with a SHIMADZU1800 X-ray fluorescence spectrometer. The analytical uncertainties of all elements are within 5%. The chemical index of alteration (CIA) was calculated as CIA = [Al2O3/(Al2O3 + CaO* + Na2O + K2O)] × 100 (molar ratio), where CaO* represents the amount of CaO in the silicate fraction of the sample [33,34].

3. Results

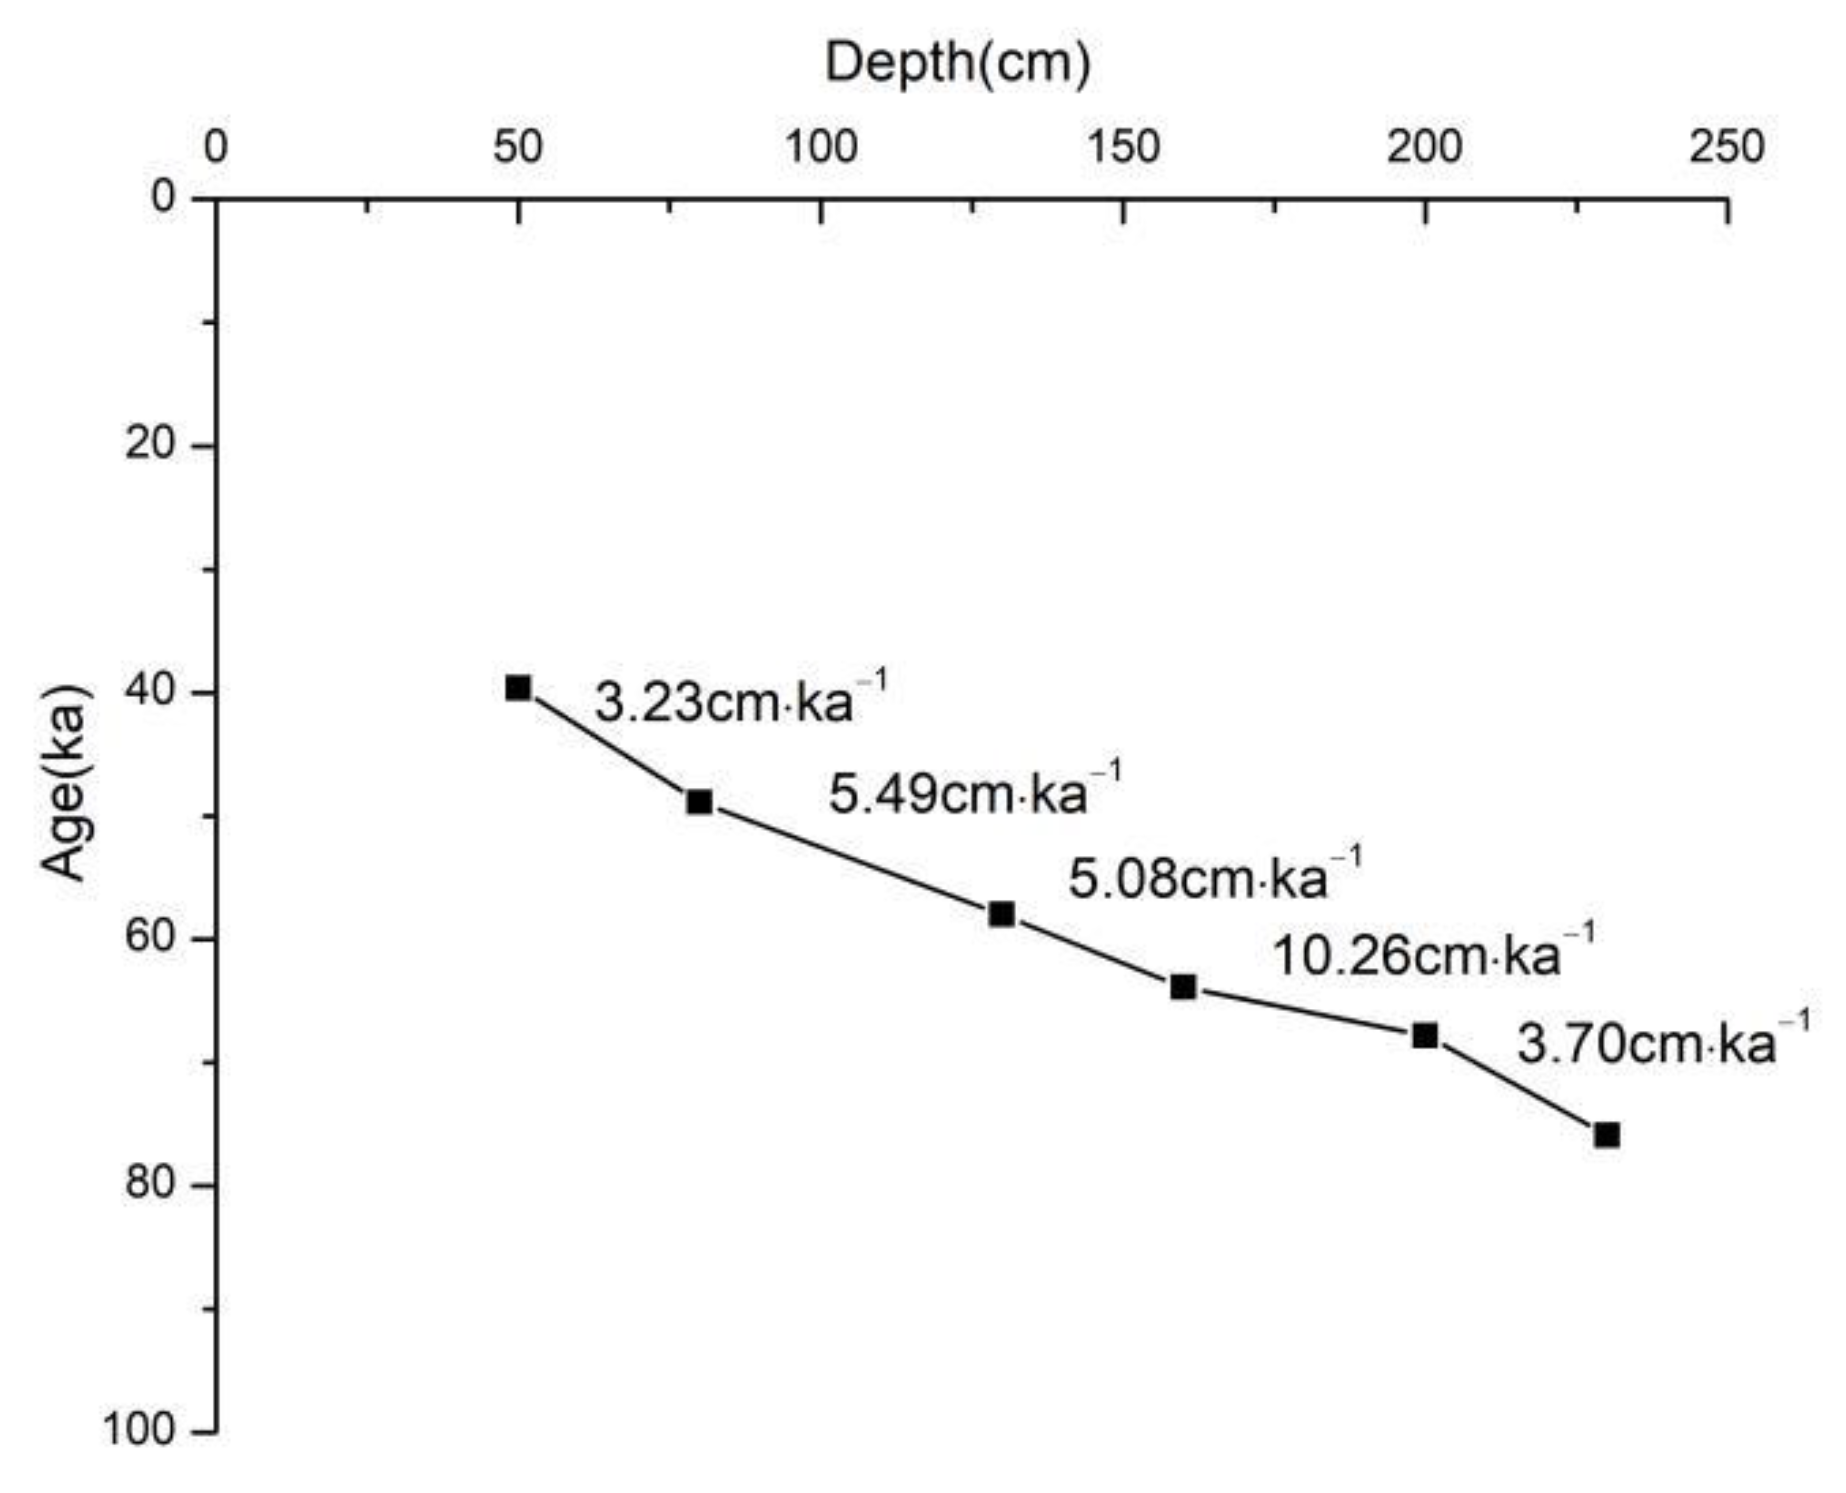
3.1. Chronology of the CQS Loess

The dating results for the six loess deposit samples obtained from different depths of the CQS section are shown in Table 1. The ages of OSL in the CQS loess profile indicated that the age ranges of the loess deposition section were from 75.9 ± 7.5 ka (depth ~ 230 cm) to 39.7 ± 3.4 ka (depth ~ 50 cm). The generalized age-depth model adopted in the whole loess section is presented in Figure 2. It demonstrated different sedimentation rates during the LG. The sedimentation rate from 75.9 ± 7.5 ka to 67.8 ± 6.2 ka was calculated to be ~ 3.70 cm·ka−1. It was observed that the sedimentation rate increased significantly to over ~ 10.26 cm·ka−1 between 67.8 ± 6.2 ka and 63.9 ± 5.8 ka (depth ~ 200 to ~160 cm), and then it decreased from ~ 5.08 cm·ka−1 between 63.9 ± 5.8 ka and 58.0 ± 5.3 ka to ~3.23 cm·ka−1 from 48.9 ± 4.6 ka to 39.7 ± 3.4 ka. No obvious erosion-deposition discontinuity was found in the CQS loess section during the field investigations; therefore, it was inferred that the loess stratigraphy with a thickness of 257 cm constituted aeolian deposition, and accumulation was continuous.

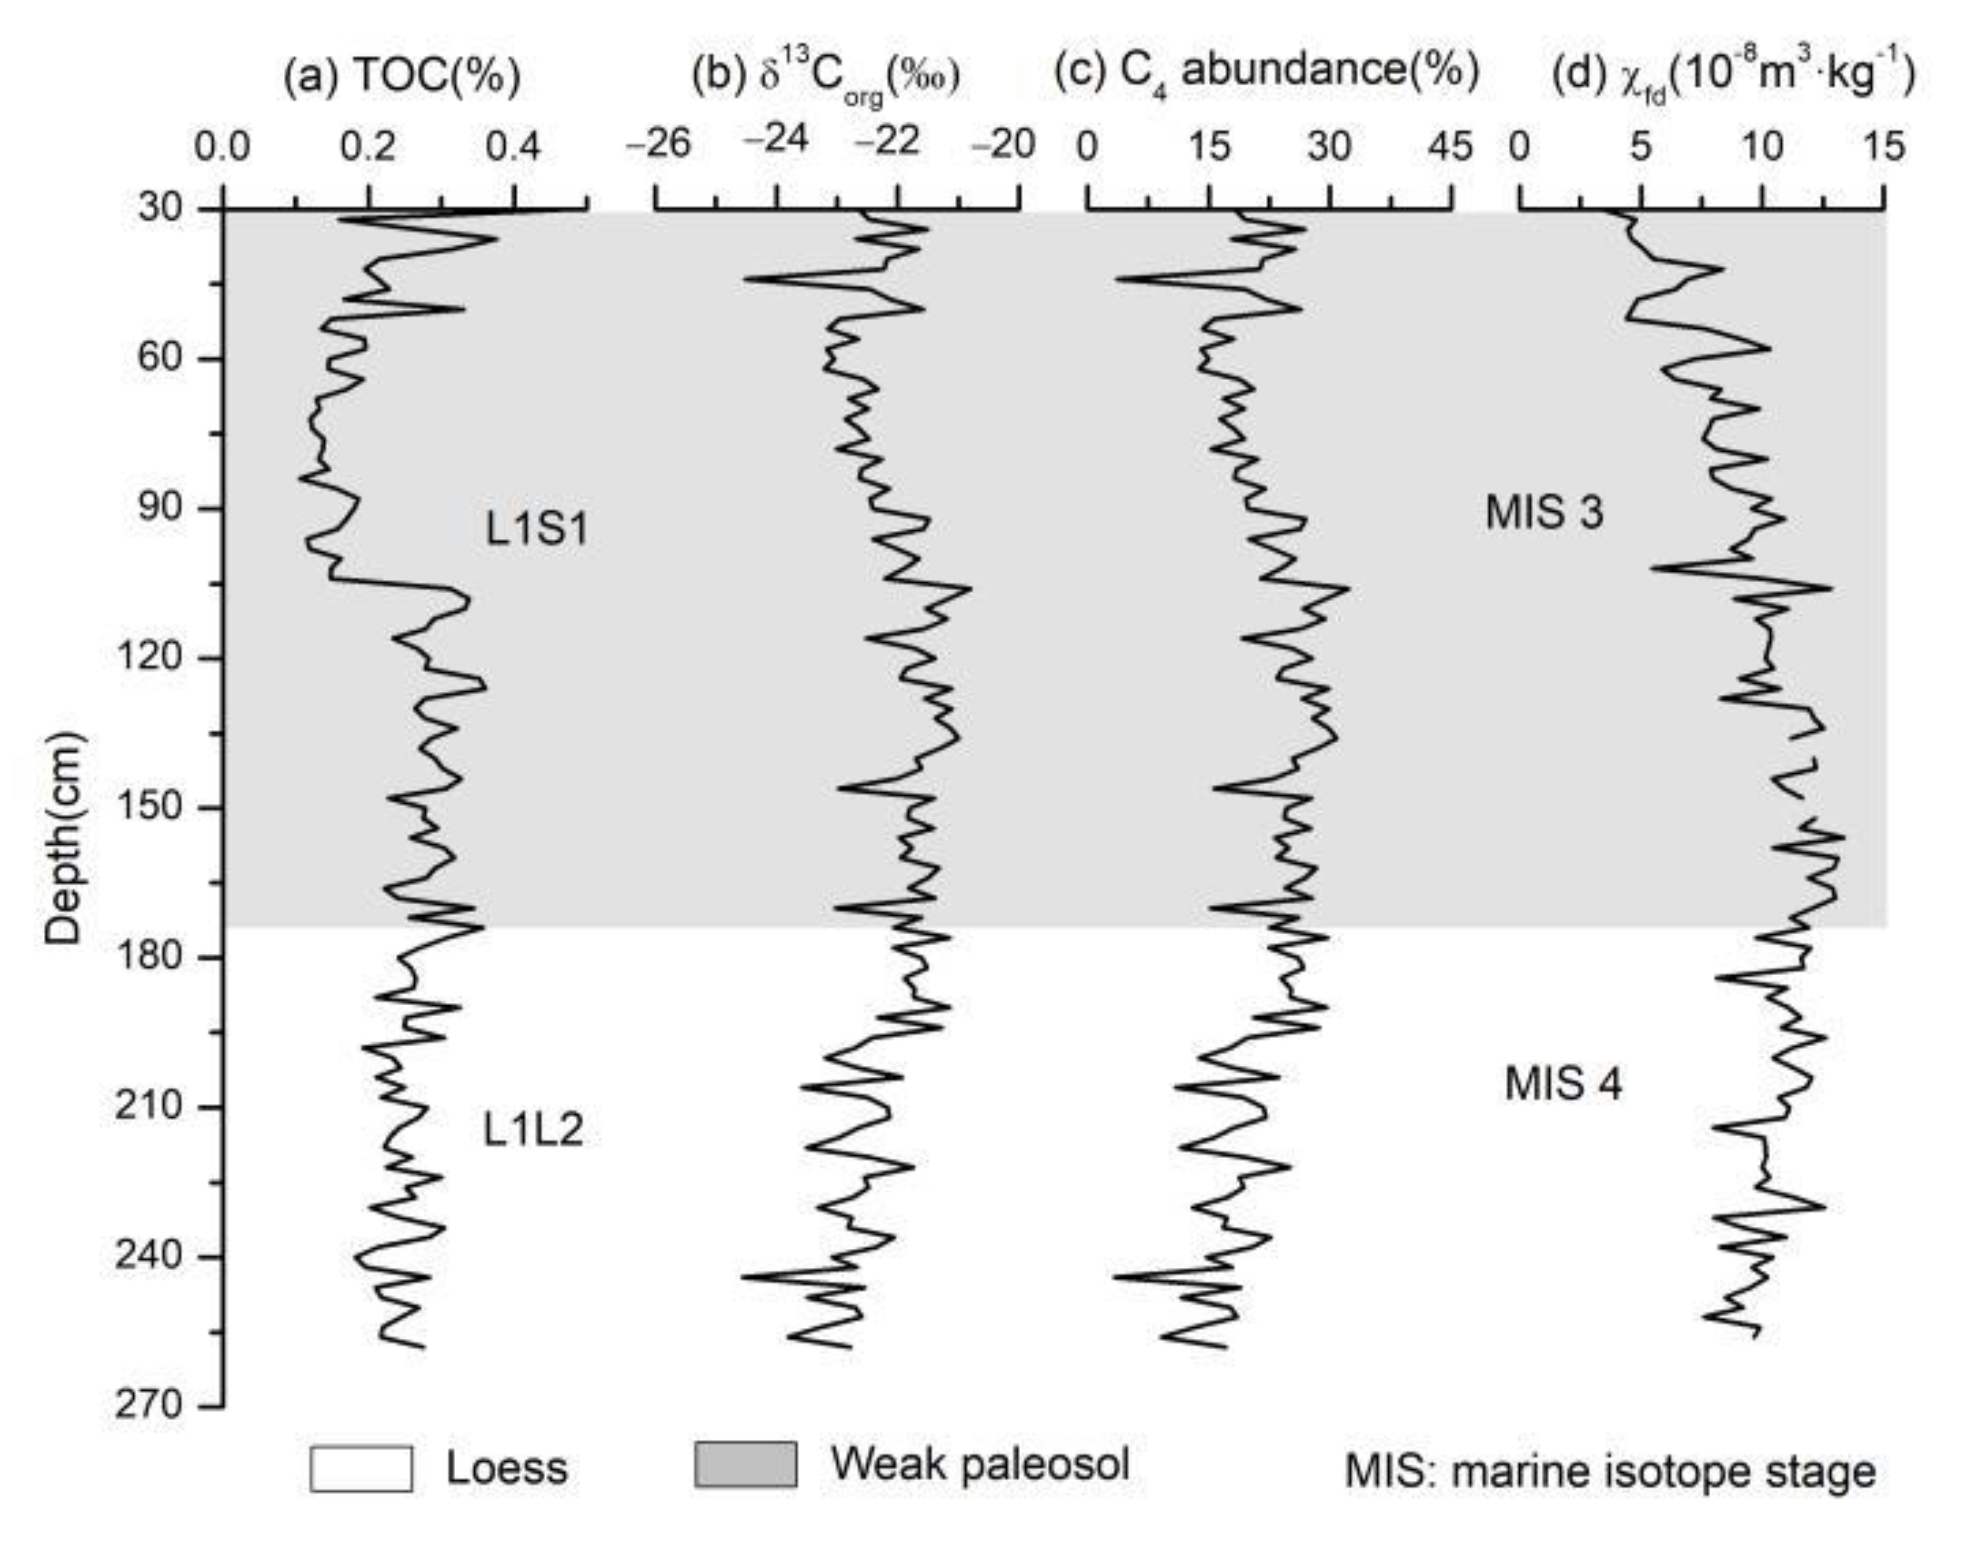
3.2. TOC, δ13Corg and χfd Characteristics

Figure 3 shows the results for the δ13Corg composition, TOC concentration, C4 abundance and χfd of the CQS loess section. The values of all indicators showed similar variations with depth. In the weak paleosol layer (L1S1), the values of all indicators were higher than in the loess layer (L1L2) (Figure 3). The TOC concentration for the loess section ranged from 0.11% to 0.47%, and the average was 0.24% (Figure 3a). The δ13Corg composition varied between 24.56‰ and −20.80‰, and the average was −22.19‰ (Figure 3b). The value of δ13Corg in the weak paleosol layer (L1S1) gradually increased with increasing depth, while the value of δ13Corg in the loess layer (L1L2) gradually decreased with increasing depth. The minimum value of δ13Corg is displayed in the loess layer (L1L2). Figure 3c shows the variation of the relative abundance of C4 plants in the CQS loess section. The value of C4 abundance ranged from 3.35% to 32.32%, and the average was 21.31%. The curve of χfd for the CQS loess deposits showed fluctuation (Figure 3d). The variation range of χfd was from 3.40 × 10⁻⁸ m3·kg−1 to 13.92 × 10⁻⁸ m3·kg−1, and the average value was 9.70 × 10⁻⁸ m3·kg−1. The highest value of χfd appeared in the L1S1 layer.

3.3. Geochemistry and Diffuse Reflectance Spectra (DRS) and Hm/(Hm + Gt) Ratio Characteristics

Figure 4 shows that the value range for the Fe2O3 concentration in the CQS loess section was 6.04% ~ 6.60%, with an average of 6.25%. CIA did not change much in the whole section; it ranged from 0.81 to 0.83 with an average of 0.82. The Fe2O3 and CIA of the weak paleosol layer (L1S1) were basically the same as those of the loess layer (L1L2), indicating that the Shengshan Island area was weakly pedogenic in the later stages and had underdeveloped paleosol horizons [35]. The formation of hematite (Hm) and goethite (Gt) indicated that some dry and wet climates prevailed at that time [36,37,38]. The Hm/Gt ratio in the CQS loess section was 0.37~0.47, with an average of 0.42 (Figure 4c). The Hm/(Hm + Gt) ratio in the CQS loess section was 0.27~0.34, with an average of 0.29 (Figure 4d). The curves for Hm/Gt and Hm/(Hm + Gt) of the L1S1 layer from the CQS loess section were higher than that of the L1L2 layer. The curves for Hm/Gt and Hm/(Hm + Gt) of the CQS loess section were similar to those for the δ13Corg composition, TOC concentration, C4 abundance and χfd (Figure 3a–d and Figure 4c,d).

4. Discussion

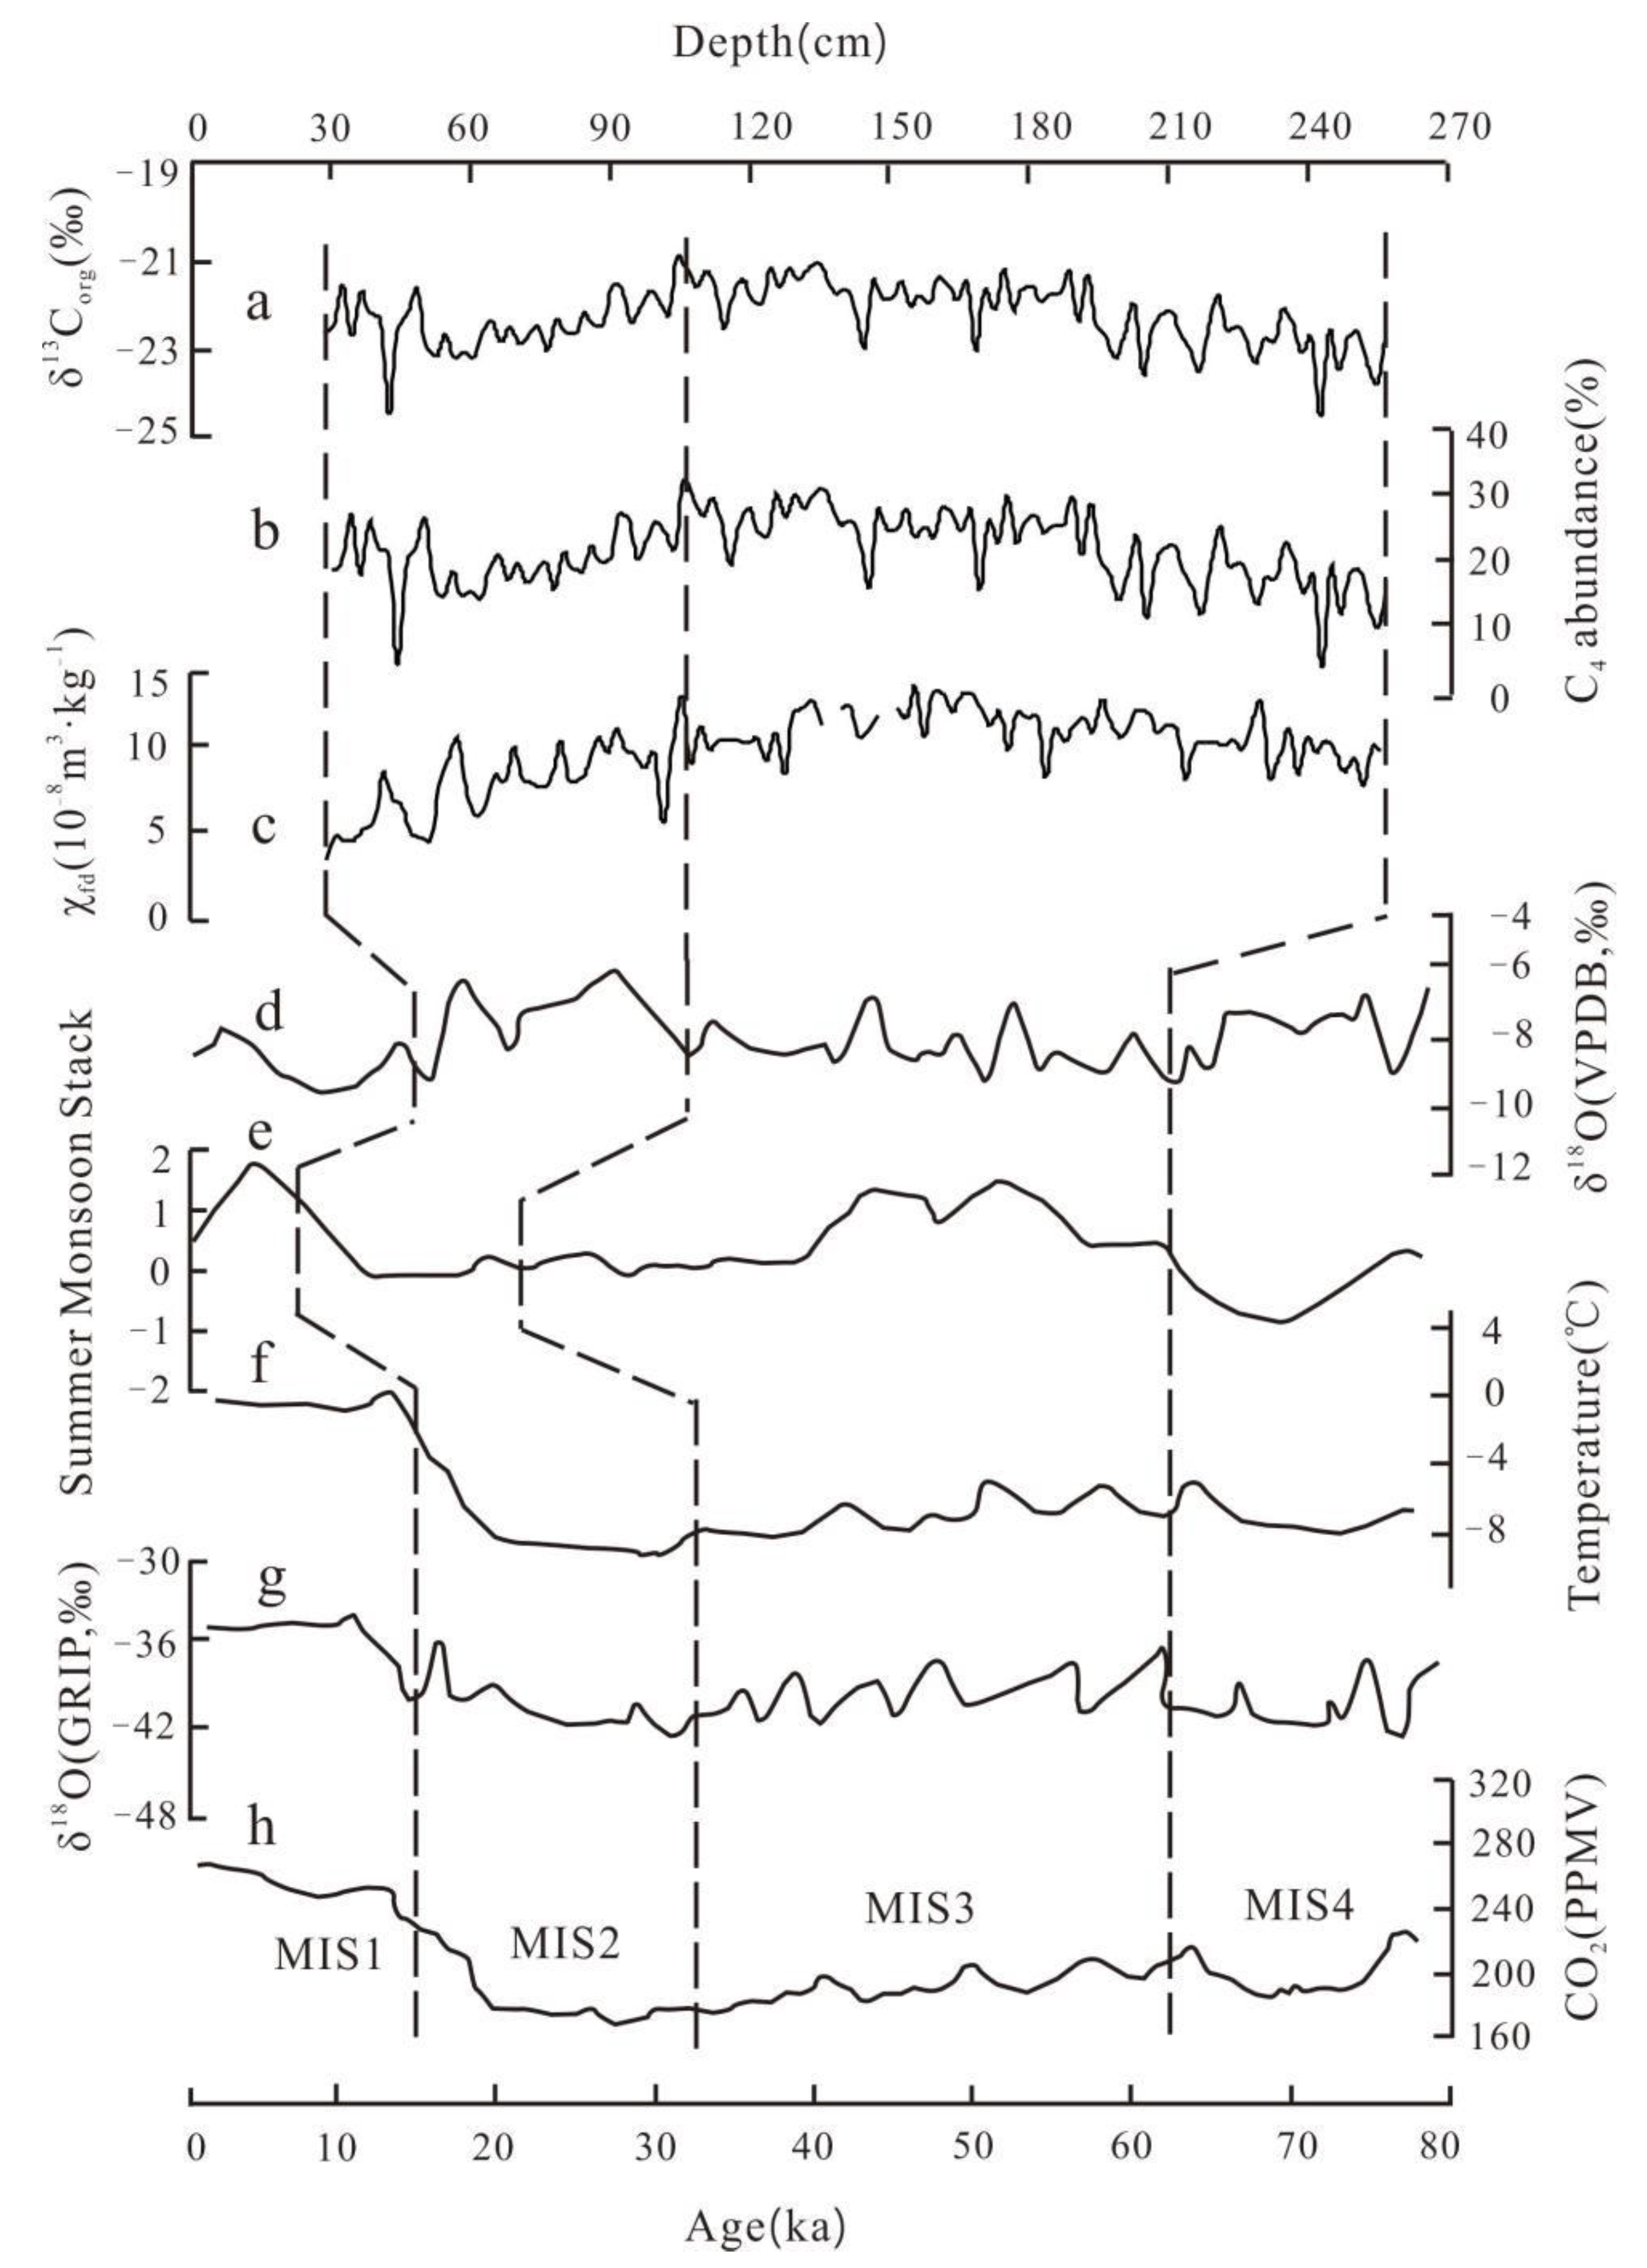
4.1. Glacial-Interglacial Variability in δ13Corg

As an index of vegetation coverage, TOC was often used to reflect the variation of vegetation biomass from the study area in loess studies [39]. The δ13Corg composition obtained from the loess-paleosol sequences derived from terrestrial higher plants has been used to reconstruct the variation in C3/C4 relative abundance in past geological history periods [4,5,6]. The values of δ13Corg composition and C4 abundance indicated that the climate was colder and drier during the L1L2 (MIS 4) stage than during the L1S1 (MIS 3) stage [19,20,21]. The growth tendency of C4 plants was more advantageous in the humid and warm climate and increased rainfall conditions [6,11,39,40,41]. Magnetic susceptibility was commonly used as the proxy index for precipitation [42,43]. Previous studies have confirmed that there was a positive correlation between rainfall and frequency-dependent susceptibility (χfd) through experiments on modern surface soil [44]. The χfd for the CQS loess section was taken as an indicator of the precipitation change over the past 76~39 ka (Figure 3d). Previous studies have shown that there was a positive correlation between the Hm/(Hm + Gt) ratio and temperature for soils in the study area [45]. The δ13Corg and C4 abundance in the CQS profile revealed similarities with changes of χfd and Hm/(Hm + Gt) (Figure 3b–d and Figure 4d). The change of δ13Corg composition recorded the regional differences of local plants and climate change.
Previous studies have shown that the distribution ranges of the δ13Corg of C3 plants and C4 plants were ~ 22‰ to −30‰ and ~ −9‰ to −19‰, respectively [1,2]. The average value of the δ13Corg in the CQS loess section was −22‰. This indicated that C3 plants were one of the vegetations in the CQS area. Rao et al. [12] studied the modern surface soil δ13CTOC data of eastern China, Australia and the Great Plains of North America around the North Pacific, and found that C4 plants could grow when the mean annual temperature was higher than 12 °C. The current mean annual temperature of CQS in Shengshan Island is 15~17 °C, which is significantly higher than 12 °C. This showed that the vegetation of CQS contained C4 vegetation. The average value of C4 relative abundance in the CQS area was only 21.31%, and it indicated that C4 plants were not the main vegetation in this area. To sum up, the δ13Corg composition for the CQS loess section revealed that C3/C4 mixed vegetation was the main vegetation in this study area, among which C3 plants were the dominant vegetation during the LG.

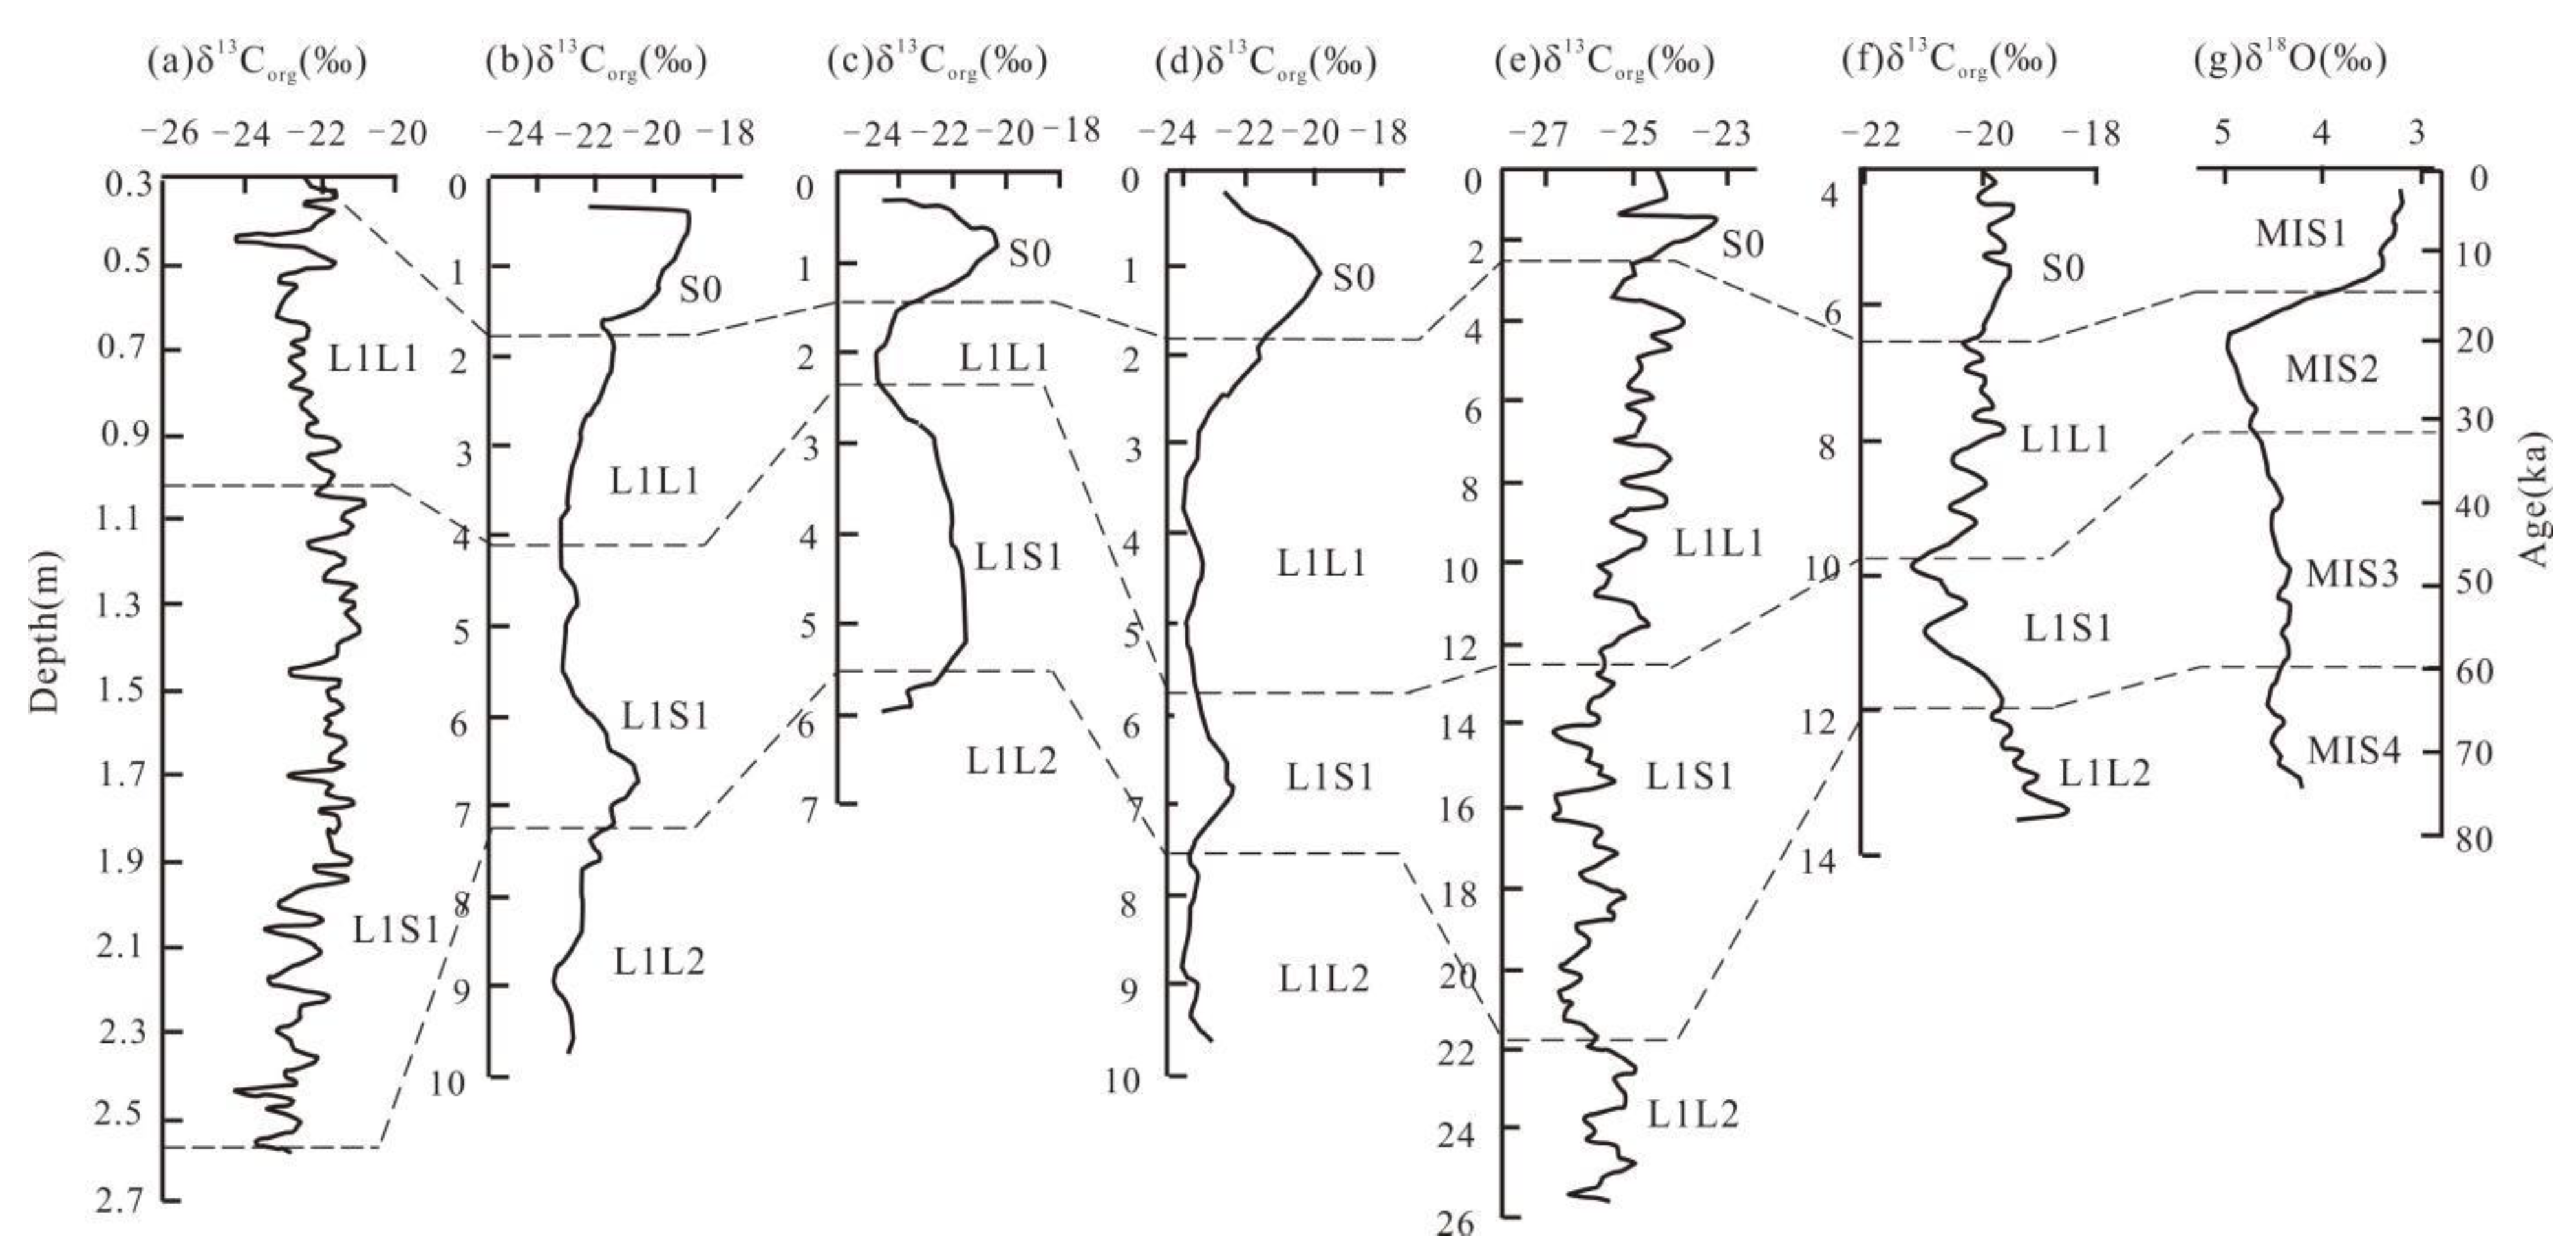
4.2. Comparison between δ13Corg Record of the CQS Loess Section and Other Existing δ13Corg Records from Central and Northern China

Figure 5 presents the comparisons of the δ13Corg records for the CQS loess section with other existing δ13Corg records for the China Loess Plateau (CLP) [7,37,46] and Tianshan Mountains [16] and also displays the marine oxygen isotope stages record [47]. Except for the Yuanbao loess section west of the CLP and the Axike loess section north of the Tianshan Mountains, the curves of δ13Corg composition for the CQS, Luochuan, Lantian and Xunyi loess sections showed a similar trend (Figure 5a–d). These results indicated that central and eastern China have been equally affected by the cyclic changes during the LG. Notably, during the MIS 4 stage, the values of δ13Corg composition for the CQS, Luochuan, Lantian and Xunyi loess sections were more negative than those for the MIS 3 stage (Figure 5a–d). The values of δ13Corg composition for the Yuanbao loess section west of the CLP and the Axike loess section north of the Tianshan Mountains in the L1S1 (MIS 3) stage were more negative than those in the L1L2 (MIS 4) stage (Figure 5e,f). The values of δ13Corg composition of the CQS, Luochuan, Lantian and Xunyi loess sections were different, however, the δ13Corg curves in the four loess sections are similar during the LG (Figure 5a–d,g). This indicated that the vegetation succession in the Shengshan Island area, under the impact of climatic change during the LG, was synchronized with the existing records previously reported from central China [40,46].
Generally, the variations of the δ13Corg records in six loess profiles also reflected the cycle changes of the climate during the LG. At the same time, when discussing the variations of the δ13Corg composition in different areas during the LG, the differences in regional climate in different regions should be considered, such as elevation, seasonal precipitation and temperature [48,49]. Climatic change has a significant impact on regional vegetation and the relative biomass of C3 and C4 plants.

4.3. Environmental Factors Driving δ13Corg Changes during the Last Glacial Period

As is known to all, the most important external factors, such as precipitation, temperature and atmospheric CO2, affect changes in the δ13Corg composition of loess [50,51,52]. As shown in Figure 6, in order to discuss the environmental mechanism driving the variations of δ13Corg composition for the CQS loess section from the perspective of external environmental factors, we compared the δ13Corg records of the CQS section, C4 abundance in the CQS section, the χfd in the CQS section, the oxygen isotope record from Chinese stalagmite [53], the East Asian Summer Monsoon record [54], ocean temperature records from Antarctica Dome C ice cores [6,55], the Greenland Ice-core Project (GRIP) marine oxygen isotope records [56] and the atmospheric CO2 concentration recorded in the Antarctic ice cores [57].
Precipitation played an important role in the paleovegetation of the East China Sea islands. The χfd of the CQS loess section was higher in the MIS 3 stage than in the MIS 4 stage (Figure 6c,e), suggesting that precipitation was significantly strengthened in the MIS 3 stage. The high precipitation level inferred from χfd was positively correlated with the δ13Corg composition of the CQS loess section during the warm-humid stage (MIS 3) (Figure 3). The χfd was mainly affected by iron oxide minerals, which were usually generated in the warm, humid with strong pedogenesis and weathering environment. The precipitation in the CQS study area could increase with the strengthening of the East Asian summer monsoon during the L1S1 (MIS 3) stage. Some researchers considered that the δ18O values of Chinese stalagmites could indicate the summer monsoon precipitation and monsoon intensity [58,59,60]. The more negative δ18O values for stalagmites indicated stronger Asian monsoons and more rainfall [53]. The δ18O record of the stalagmites was basically consistent with the δ13Corg composition of the CQS loess section (Figure 6a,d). Thus, precipitation was one of the main driving factors of variations of δ13Corg composition in the CQS loess section.
The effect of temperature on the δ13Corg composition was also very complex. High temperature could advance the activity of plant enzymes, enhance the photosynthetic efficiency of plants, and thus promote the growth of plants [1]. C4 plants generally had a relatively competitive growth advantage in high-temperature environments [3]. The curve changes of the Hm/(Hm + Gt) ratio, the δ13Corg composition and C4 abundance from the CQS loess profile were similar, and it indicated that temperature had a significant impact on the change of relative abundance of C4 plants on the East China Sea Island (Figure 6a–c). Moreover, the positive similarity among C4 abundance of the CQS loess section, the ocean temperature records of the Antarctica Dome C ice cores and the GRIP marine oxygen isotope records, indicated that the change of C4 abundance was closely related to temperature (Figure 6b,f,g). Zhang et al. [61] considered that a low temperature was beneficial to the growth of C3 plants by studying the δ13C composition of n-alkanes of CLP. Rao et al. [62] studied the differences in the soil organic carbon isotope records of three typical regions in the middle latitudes of the northern hemisphere during the LG and considered that the high temperature in the growing season had an obvious effect on the growth of C4 plants, and at the same time, the temperature range had a certain threshold. To sum up, the temperature was also one of the important factors to control the δ13Corg composition and C4 abundance of the CQS loess deposition.
Carbon isotope composition was the result of C3 and C4 photosynthesis of atmospheric CO2 by plants [7]. Previous studies indicated that a higher atmospheric CO2 concentration was more beneficial to the growth of C3 plants, while a lower atmospheric CO2 concentration was more beneficial to the growth of C4 plants [6,7,63]. Feng and Epstein [64] quantitatively reconstructed the atmospheric CO2 concentration by using the δ13C composition of tree rings; the δ13C composition of tree rings decreased by 2.0‰ ± 0.1‰ for every 100 ppm increase in atmospheric CO2 concentration. It indicated that the δ13C composition decreased with an increase in atmospheric CO2 concentration. Figure 6a,h shows that there was no negative correlation between atmospheric CO2 concentrations and the δ13Corg record of the CQS loess profile. In general, the change of atmospheric CO2 concentration was unlikely to drive the change of δ13Corg composition in the CQS loess deposition during the LG.

5. Conclusions

In this paper, we investigated the optically stimulated luminescence (OSL) ages and the variations in the frequency-dependent susceptibility, diffuse reflectance spectra, TOC concentration and δ13Corg composition of the Chenqianshan loess section on Shengshan Island, East China Sea, and discussed the paleoenvironmental significance of these indices and environmental influencing factors. The results of TOC, δ13Corg, χfd, and Hm/(Hm + Gt) for the CQS profile displayed a similar pattern. The TOC concentration for the CQS section varied between 0.11% and 0.47%, and the δ13Corg composition of the CQS loess section varied between −20.80‰ and −24.56‰ during the last glacial period. The δ13Corg composition of the loess layer during the L1L2 (MIS 4) stage was lower than those of the weak paleosol layer during the L1S1 (MIS 3) stage, showing the transition of climate from dry-cold to warm-humid. The average value of C4 abundance was 21.31%. It indicated that the vegetation of CQS loess deposits was mainly C3/C4 mixed vegetation, and C3 vegetation was the primary vegetation. The δ13Corg composition of the CQS loess section could more likely indicate the evolution of vegetation and climate change than other proxy indicators. The comparison between the δ13Corg curve of the CQS section and other existing δ13Corg records of the loess sections from central and northern China showed similar trends, and their vegetation successions exhibit synchronous changes during the LG. Based on a comparison of the δ13Corg record, C4 abundance and χfd of the CQS section and other geological records, it was concluded that the mutual effects of precipitation and temperature caused the change of paleovegetation in loess deposits on islands in the East China Sea during the LG.

Author Contributions

Conceptualization, S.R., L.Z. and X.Z.; methodology, S.R. and Y.S.; software, H.W.; validation, S.R. and Z.W.; formal analysis, S.R.; investigation, S.R. and C.Y.; resources, H.L.; data curation, S.R. and C.W.; writing—original draft preparation, S.R.; writing—review and editing, S.R., L.Z. and X.Z.; visualization, S.R.; supervision, X.Z.; project administration, X.Z.; funding acquisition, X.Z. All authors have read and agreed to the published version of the manuscript.

Funding

This research was funded by the National Natural Science Foundation of China (Grant Nos. 41371032 and 41871015).

Institutional Review Board Statement

Not applicable.

Informed Consent Statement

Not applicable.

Data Availability Statement

Some or all data, or models generated or used during the study, are available from the corresponding author by request.

Acknowledgments

We are very grateful to Weiguo Zhang for their support of environmental magnetism, and Xia Liu for analyzing the organic carbon isotopes data. We would also like to thank Fengyue Qiu for his help in the luminescence experiments. We are also appreciative of Yongjie Wang for the beneficial discussions.

Conflicts of Interest

The authors declare no conflict of interest.

References

  1. Farquhar, G.D.; Ehleringer, J.R.; Hubick, K.T. Carbon isotope discrimination and photosynthesis. Ann. Rev. Plant Physiol. Mol. Biol. 1989, 40, 503–537. [Google Scholar] [CrossRef]
  2. Rao, Z.G.; Chen, F.H.; Zhang, X.; Xu, Y.; Xue, Q.; Zhang, P. Spatial and temporal variations of C3/C4 relative abundance in global terrestrial ecosystem since the Last Glacial and its possible driving mechanisms. Chin. Sci. Bull. 2012, 57, 4024–4035. [Google Scholar] [CrossRef] [Green Version]
  3. Sage, R.F.; Wedin, D.A.; Li, M. The Biogeography of C4 Photosynthesis: Patterns and Controlling Factors; Academic Press: Cambridge, MA, USA, 1999; pp. 313–373. [Google Scholar] [CrossRef]
  4. Bird, M.I.; Pousai, P. Variations of δ13C in the surface soil organic carbon pool. Glob. Biogeochem. Cycles 1997, 11, 313–322. [Google Scholar] [CrossRef]
  5. Wu, F.; Zhao, Y.; Fang, X.; Meng, Q. An ecological response to the Eocene/Oligocene transition revealed by the δ13CTOC record, Lanzhou Basin, NE Tibetan Plateau. Asian Earth Sci. 2018, 159, 74–80. [Google Scholar] [CrossRef]
  6. Yang, S.; Liu, L.; Chen, H.; Tang, G.; Luo, Y.; Liu, N.; Cheng, T.; Li, D. Variability and environmental significance of organic carbon isotopes in Ganzi loess since the last interglacial on the eastern Tibetan Plateau. CATENA 2020, 196, 104866. [Google Scholar] [CrossRef]
  7. Chen, F.; Rao, Z.; Jiawu, Z.; Ming, J.; Jianying, M. Variations of organic carbon isotopic composition and its environmental significance during the last glacial on western Chinese Loess Plateau. Chin. Sci. Bull. 2006, 51, 1593–1602. [Google Scholar] [CrossRef]
  8. Sun, J.; Lü, T.; Zhang, Z.; Wang, X.; Liu, W. Stepwise expansions of C4 biomass and enhanced seasonal precipitation and regional aridity during the Quaternary on the southern Chinese Loess Plateau. Quat. Sci. Rev. 2012, 34, 57–65. [Google Scholar] [CrossRef]
  9. Obreht, I.; Buggle, B.; Catto, N.; Markovič, S.B.; Bösel, S.; Vandenberghe, D.A.; Hambach, U.; Svirčev, Z.; Lehmkuhl, F.; Basarin, B.; et al. The Late Pleistocene Belotinac section (southern Serbia) at the southern limit of the European loess belt: Environmental and climate reconstruction using grain size and stable C and N isotopes. Quat. Int. 2014, 334–335, 10–19. [Google Scholar] [CrossRef]
  10. Liu, W.; Feng, X.; Ning, Y.; Zhang, Q.; Cao, Y. δ13C variation of C3 and C4 plants across an Asian monsoon rainfall gradient in arid northwestern China. Glob. Chang. Biol. 2005, 11, 1094–1100. [Google Scholar]
  11. Liu, W.G.; Huang, Y.S.; An, Z.S.; Clemens, S.C.; Li, L.; Prell, W.L.; Ning, Y. Summer monsoon intensity controls C4/C3 plant abundance during the last 35 ka in the Chinese Loess Plateau: Carbon isotope evidence from bulk organic matter and individual leaf waxes. Palaeogeogr. Palaeoclimatol. Palaeoecol. 2005, 220, 243–254. [Google Scholar] [CrossRef]
  12. Rao, Z.G.; Zhu, Z.Y.; Jia, G.D.; Chen, F.; Barton, L.; Zhang, J.; Qiang, M. Relationship between climatic conditions and the relative abundance of modern C3 and C4 plants in three regions around the North Pacific. Chin. Sci. Bull. 2010, 55, 1931–1936. [Google Scholar] [CrossRef] [Green Version]
  13. Rao, Z.G.; Chen, F.H.; Cheng, H.; Liu, W.; Wang, G.A.; Lai, Z.; Bloemendal, J. High-resolution summer precipitation variations in the western Chinese Loess Plateau during the last glacial. Sci. Rep. 2013, 3, 2785. [Google Scholar] [CrossRef] [PubMed]
  14. Obreht, I.; Zeeden, C.; Hambach, U.; Veres, D.; Marković, S.B.; Lehmkuhl, F. A critical reevaluation of palaeoclimate proxy records from loess in the Carpathian Basin. Earth Sci. Rev. 2019, 190, 498–520. [Google Scholar] [CrossRef]
  15. Yang, S.L.; Ding, Z.L. Winter-spring precipitation as the principal control on predominance of C3 plants in Central Asia over the past 1.77 Myr: Evidence from δ13C of loess organic matter in Tajikistan. Palaeogeogr. Palaeoclimatol. Palaeoecol. 2006, 235, 330–339. [Google Scholar] [CrossRef]
  16. Rao, Z.G.; Xu, Y.; Xia, D.; Xie, L.; Chen, F.H. Variation and paleoclimatic significance of organic carbon isotopes of Ili loess in arid Central Asia. Org. Geochem. 2013, 63, 56–63. [Google Scholar] [CrossRef]
  17. Liu, T.S. Quaternary Environments; Science Press: Shanghai, China, 1997. [Google Scholar]
  18. Liu, T.S.; An, Z.S.; Yuan, B.Y. Eolian process and dust mantle (loess) in China. Quat. Sci. 1985, 1, 113–125. [Google Scholar]
  19. An, Z.S.; Lu, C.Y. Climatic stratigraphic division of Malan period in late Pleistocene in North China. Chin. Sci. Bull. 1984, 29, 228–231. [Google Scholar]
  20. Kukla, G.; Heller, F.; Liu, X.M.; Chun, X.T.; Sheng, L.T.; Sheng, A.Z. Pleistoce climates in China dated by magnetic susceptibility. Geology 1988, 16, 811–814. [Google Scholar] [CrossRef]
  21. Chen, F.H.; Ma, Y.Z.; Li, J.J. High Resolution Record of Malan Loess in the Longxi Loess Plateau and Rapid Climate Changes during the Last Glaciation. J. Glaciol. Geocryol. 1996, 18, 111–118. [Google Scholar]
  22. Zheng, X.M. Aeolian Deposition and Environment in Changjiang Delta and Extending Sea Areas; East China Normal University Press: Shanghai, China, 1999. [Google Scholar]
  23. Zheng, X.M.; Yan, Q.S. Aeolian Loess Deposition During the last glacial period in the northern Jiangsu Plain of the Yangtze Delta and Western Areas of the Yellow Sea and the EAST China Sea. Quat. Sci. 1995, 3, 258–266. [Google Scholar]
  24. Liu, F. Paleo-Environmental Information Study of Loess on Islands in East China Sea and Xiashu Loess. Doctoral Dissertation, East China Normal University, Shanghai, China, 2006. [Google Scholar]
  25. Zhao, Q. The Physical and Chemical Characteristics of the Late Quaternary Loess in Two Climatic Zones in China and Its Environmental Significance. Doctoral Dissertation, East China Normal University, Shanghai, China, 2017. [Google Scholar]
  26. Ren, S.F.; Zheng, X.M.; Zhou, L.M.; Lv, H.; Ai, D.; Xuan, X.; Cao, H.; Wu, C.; Zhao, Q. Analysis of environmentally sensitive grain-size component of loess on the Shengshan Island in East China Sea Based on Optically Stimulated Luminescence Dating. Quat. Sci. 2018, 38, 646–658. [Google Scholar]
  27. Cheng, T. Content of Hematite and Goethite in Loess of Shengshan Island, Eastern China and Evolution of East Asian Monsoon. Master Dissertation, East China Normal University, Shanghai, China, 2021. [Google Scholar]
  28. Nian, X.M.; Zhang, W.G.; Wang, Z.H.; Sun, Q.; Chen, Z. Inter-comparison of optically stimulated luminescence (OSL) ages between different fractions of Holocene deposits from the Yangtze delta and its environmental implications. Mar. Geol. 2021, 432, 106401. [Google Scholar] [CrossRef]
  29. Murray, A.S.; Wintl, A.G. Luminescence dating of quartz using an improved single-aliquot regenerative-dose protocol. Radiat. Meas. 2000, 32, 57–73. [Google Scholar] [CrossRef]
  30. Yang, S.L.; Ding, Z.L.; Li, Y.Y.; Wang, X.; Jiang, W.; Huang, X. Warming-induced northwestward migration of the East Asian monsoon rain belt from the Last Glacial Maximum to the mid-Holocene. Proc. Natl. Acad. Sci. USA 2015, 112, 13178–13183. [Google Scholar] [CrossRef] [Green Version]
  31. Lv, H.H.; Zhang, W.G.; Li, Y.L.; Dong, C.; Zhang, T.; Zhou, Z.; Zheng, X. Rock magnetic properties and paleoenvironmental implications of an 8-Ma Late Cenozoic terrigenous succession from the northern Tian Shan foreland basin, northwestern China. Glob. Planet. Chang. 2013, 111, 43–56. [Google Scholar]
  32. Torrent, J.; Schwertmann, U.; Schulze, D.G. Iron oxide mineralogy of some soils of two river terrace sequences in Spain. Geoderma 1980, 23, 191–208. [Google Scholar] [CrossRef]
  33. Nesbitt, H.W.; Young, G.M. Early Proterozoic climate and plate motions inferred from major element chemistry of lutites. Nature 1982, 299, 715–717. [Google Scholar] [CrossRef]
  34. Zhang, W.G.; Yu, L.Z.; Lu, M.; Zheng, X.; Shi, Y. Magnetic properties and geochemistry of the Xiashu Loess in the present subtropical area of China, and their implications for pedogenic intensity. Earth Planet. Sci. Lett. 2007, 260, 86–97. [Google Scholar] [CrossRef]
  35. Zhang, M.; Xie, Y.Y.; Kang, C.G. Chemical Weathering Characteristics of the Loess-Paleosol Sequences in Harbin Huangshan Rock Core-Implication for Formation Environment of the Paleosol. Acta Pedol. Sin. 2021, 58, 673–684. [Google Scholar]
  36. Balsam, W.; Ji, J.; Chen, J. Climatic interpretation of the Luochuan and Lingtai loess sections, China, based on changing iron oxide mineralogy and magnetic susceptibility. Earth Planet. Sci. Lett. 2004, 223, 335–348. [Google Scholar] [CrossRef]
  37. Ji, J.F.; Balsam, W.; Chen, J.; Liu, L. Rapid and quantitative measurement of hematite and goethite in the Chinese loess-paleosol sequence by diffuse reflectance spectroscopy. Clays Clay Miner. 2002, 50, 208–216. [Google Scholar] [CrossRef]
  38. Ji, J.F.; Chen, J.; Balsam, W.; Lu, H.; Sun, Y.; Xu, H. High resolution hematite/goethite records from Chinese loess sequences for the last glacial-interglacial cycle: Rapid climatic response of the East Asian Monsoon to the tropical Pacific. Geophys. Res. Lett. 2004, 31, 3207. [Google Scholar] [CrossRef]
  39. Lu, H.X.; Liu, W.G.; Yang, H.; Wang, H.; Liu, Z.; Leng, Q.; Sun, Y.; Zhou, W.; An, Z. 800-kyr land temperature variations modulated by vegetation changes on Chinese Loess Plateau. Nat. Commun. 2019, 10, 1958. [Google Scholar] [CrossRef] [PubMed] [Green Version]
  40. Liu, W.G.; Yang, H.; Cao, Y.N.; Ning, Y.; Li, L.; Zhou, J.; An, Z. Did an extensive forest ever develop on the Chinese Loess Plateau during the past 130 ka?: A test using soil carbon isotopic signatures. Appl. Geochem. 2005, 20, 519–527. [Google Scholar] [CrossRef]
  41. Lu, H.Y.; Yi, S.W.; Liu, Z.Y.; Mason, J.A.; Jiang, D.; Cheng, J.; Stevens, T.; Xu, Z.; Zhang, E.; Jin, L.; et al. Variation of East Asian monsoon precipitation during the past 21 k.y. and potential CO2 forcing. Geology 2013, 41, 1023–1026. [Google Scholar] [CrossRef] [Green Version]
  42. An, Z.S.; Liu, T.S.; Lu, Y.C.; Porter, S.C.; Kukla, G.; Wu, X.; Hua, Y. The long-term Paleomonsoon variation recorded by the loess-paleosol sequence in central China. Quat. Int. 1990, 7, 91–95. [Google Scholar]
  43. An, Z.S.; Kukla, G.; Porter, S.C.; Xiao, J.L. Magnetic susceptibility evidence of monsoon variation on the Loess Plateau of Central China during the last 130,000 years. Quat. Res. 1991, 36, 29–36. [Google Scholar] [CrossRef]
  44. Lu, H.Y.; Han, J.M.; Wu, N.Q.; Guo, Z.T. Determination of modern soil in China and its paleoclimatic signification. Science in China. Ser. B Chem. Life Sci. Earth Sci. 1994, 24, 1290–1297. [Google Scholar]
  45. Jia, J.; Lu, H.; Wang, Y.; Xia, D. Variations in the Iron Mineralogy of a Loess Section in Tajikistan during the Mid-Pleistocene and Late Pleistocene: Implications for the Climatic Evolution in Central Asia. Geochem. Geophys. Geosyst. 2018, 19, 1244–1258. [Google Scholar] [CrossRef]
  46. Liu, W.G.; Ning, Y.; An, Z.; Wu, Z.; Lu, H.; Cao, Y. Carbon isotopic composition of modern soil and paleosol as a response to vegetation change on the Chinese Loess Plateau. Sci. China, Ser. D Earth Sci. 2005, 48, 93–99. [Google Scholar] [CrossRef]
  47. Lisiecki, L.; Raymo, M. A Pliocene-Pleistocene stack of 57 globally distributed benthic δ18O records. Paleoceanography 2005, 20, PA1003. [Google Scholar] [CrossRef] [Green Version]
  48. Huang, Y.; Street-Perrott, F.A.; Metcalfe, S.E.; Brenner, M.; Moreland, M.; Freeman, K.H. Climate change as the dominant control on glacial-interglacial variations in C3 and C4 plant abundance. Science 2001, 293, 1647–1651. [Google Scholar] [CrossRef] [PubMed]
  49. Rao, Z.G.; Guo, W.; Xie, L.; Liu, X.; Hua, H.; Chen, F. High resolution δ13CTOC and magnetic susceptibility data from the late Early Pleistocene southern margins of the Chinese Loess Plateau. Org. Geochem. 2015, 87, 78–85. [Google Scholar] [CrossRef]
  50. Ehleringer, J.R.; Buchmann, N.; Flanagan, L.B. Carbon isotope ratios in belowground carbon cycle processes. Ecol. Appl. 2000, 10, 412–422. [Google Scholar] [CrossRef]
  51. Hatté, C.; Antoine, P.; Fontugne, M.; Rousseau, D.-D.; Tisnérat-Laborde, N.; Zöller, L. New chronology and organic matter [formula omitted] paleoclimatic significance of Nußloch loess sequence (Rhine Valley, Germany). Quat. Int. 1999, 62, 85–91. [Google Scholar] [CrossRef]
  52. Wynn, J.G.; Harden, J.W.; Fries, T.L. Stable carbon isotope depth profiles and soil organic carbon dynamics in the lower Mississippi Basin. Geoderma 2006, 131, 89–109. [Google Scholar] [CrossRef]
  53. Cheng, H.; Edwards, R.L.; Sinha, A.; Spötl, C.; Yi, L.; Chen, S.; Kelly, M.; Kathayat, G.; Wang, X.; Li, X.; et al. The Asian monsoon over the past 640,000 years and ice age terminations. Nature 2016, 534, 640. [Google Scholar] [CrossRef]
  54. Clemens, S.C.; Prell, W.L. A 350,000 year summer-monsoon multi-proxy stack from the Owen Ridge, Northern Arabian Sea. Mar. Geol. 2003, 201, 35–51. [Google Scholar] [CrossRef]
  55. Jouzel, J.; Masson-Delmotte, V.; Cattani, O.; Dreyfus, G.; Falourd, S.; Hoffmann, G.; Minster, B.; Nouet, J.; Barnola, J.M.; Chappellaz, J.; et al. Orbital and Millennial Antarctic Climate Variability over the Past 800,000 Years. Science 2007, 317, 793. [Google Scholar] [CrossRef] [Green Version]
  56. Johnsen, S.J.; Clausen, H.B.; Dansgaard, W.; Gundestrup, N.S.; Hammer, C.U.; Andersen, U.; Andersen, K.K.; Hvidberg, C.S.; Dahl-Jensen, D.; Steffensen, J.P.; et al. The δ18O record along the Greenland Ice Core Project deep ice core and the problem of possible Eemian climatic instability. Geophys. Res. Ocean. 1997, 102, 26397–26410. [Google Scholar] [CrossRef]
  57. Bereiter, B.; Eggleston, S.; Schmitt, J.; Nehrbass-Ahles, C.; Stocker, T.F.; Fischer, H.; Kipfstuhl, S.; Chappellaz, J. Revision of the EPICA Dome C CO2 record from 800 to 600 kyr before present. Geophys. Res. Lett. 2015, 42, 542–549. [Google Scholar] [CrossRef]
  58. Wang, Y.J.; Cheng, H.; Edwards, R.L.; An, Z.S.; Wu, J.Y.; Shen, C.C.; Dorale, J.A. A high-resolution absolute-dated late Pleistocene monsoon record from Hulu cave, China. Science 2001, 294, 2345–2348. [Google Scholar] [CrossRef] [PubMed] [Green Version]
  59. Wang, Y.; Cheng, H.; Edwards, R.L.; Kong, X.; Shao, X.; Chen, S.; Wu, J.; Jiang, X.; Wang, X.; An, Z. Millennial- and orbital-scale changes in the East Asian monsoon over the past 224,000 years. Nature 2008, 451, 1090–1093. [Google Scholar] [CrossRef] [PubMed] [Green Version]
  60. Yuan, D.X.; Cheng, H.; Edwards, R.L.; Dykoski, C.A.; Kelly, M.J.; Zhang, M.; Qing, J.; Lin, Y.; Wang, Y.; Wu, J.; et al. Timing, Duration and transitions of the last interglacial Asian Monsoon. Science 2004, 304, 575–578. [Google Scholar] [CrossRef] [PubMed] [Green Version]
  61. Zhang, Z.; Zhao, M.; Lu, H.; Faiia, A.M. Lower temperature as the main cause of C4 plant declines during the glacial periods on the Chinese Loess Plateau. Earth Planet. Sci. Lett. 2003, 214, 467–481. [Google Scholar]
  62. Rao, Z.G.; Zhu, Z.Y.; Zhang, J.W. Differences of stable carbon isotope changes of soil organic matter in three typical regions in the middle latitude of the northern hemisphere since the last glacial period and their causes. Chin. Sci. Bull. 2006, 51, 2548–2554. [Google Scholar]
  63. Lyu, A.Q.; Lu, H.Y.; Zeng, L.; Zhang, H.; Zhang, E.; Yi, S. Vegetation variation of loess deposits in the southeastern Inner Mongolia, NE China over the past ~1.08 million years. J. Asian Earth Sci. 2018, 155, 174–179. [Google Scholar] [CrossRef]
  64. Feng, X.; Epstein, S. Carbon isotopes of trees from arid environments and implications for reconstructing atmospheric CO2 concentration. Geochim. Cosmochim. Acta 1995, 59, 2599–2608. [Google Scholar] [CrossRef]
Figure 1. (a) Location of the Chenqianshan loess section at Shengshan Island in the East China Sea (modified from Cheng [22]) and (b) the alternation of loess and weak paleosol units in the Chenqianshan section.
Applsci 12 05724 g001
Figure 2. Age distribution of the CQS loess section.
Applsci 12 05724 g002
Figure 3. Variations in (a) TOC, (b) δ13Corg composition, (c) C4 abundance and (d) χfd of the CQS section.
Applsci 12 05724 g003
Figure 4. Vertical distribution characteristics of (a) Fe2O3 concentration, (b) CIA, (c) Hm/Gt ratio and (d) Hm/(Hm + Gt) ratio for the CQS section.
Applsci 12 05724 g004
Figure 5. Vertical distribution characteristics of (a) δ13Corg records of CQS section; (b) Luochuan loess section [40]; (c) Lantian loess section [40]; (d) Xunyi loess section [46]; (e) Yuanbao loess section [7]; (f) Axike loess section [16]; (g) Marine oxygen isotope records [47].
Applsci 12 05724 g005
Figure 6. (a) The δ13Corg record of the CQS section; (b) C4 abundance in the CQS section; (c) χfd of the CQS section; (d) oxygen isotope records from Chinese stalagmite [53]; (e) the East Asian summer monsoon records [54]; (f) ocean temperature records from Antarctica Dome C ice cores [6,55]; (g) GRIP marine oxygen isotope records [56]; (h) atmospheric CO2 concentration recorded by Antarctic ice cores [57].
Applsci 12 05724 g006
Table 1. Results for OSL ages.
SampleDepth
(cm)
K
(%)
Th
(ppm)
U
(ppm)
DOS (Gy/Ka)De
(Gy)
OSL Age
(ka)
CQS-1501.69 ± 0.0414.44 ± 0.802.71 ± 0.403.29 ± 0.25130.5 ± 5.139.66 ± 3.4
CQS-2801.68 ± 0.0414.43 ± 0.802.38 ± 0.303.16 ± 0.23154.4 ± 9.048.9 ± 4.6
CQS-31301.69 ± 0.0413.65 ± 0.802.31 ± 0.303.05 ± 0.23177.3 ± 9.458.0 ± 5.3
CQS-41601.72 ± 0.0414.14 ± 0.802.62 ± 0.403.17 ± 0.24202.5 ± 9.963.9 ± 5.8
CQS-52001.80 ± 0.0414.14 ± 0.802.67 ± 0.403.19 ± 0.24216.4 ± 11.067.8 ± 6.2
CQS-62301.82 ± 0.0415.46 ± 0.802.77 ± 0.403.22 ± 0.24244.3 ± 15.875.9 ± 7.5
Publisher’s Note: MDPI stays neutral with regard to jurisdictional claims in published maps and institutional affiliations.

