Abstract
This study focused on the possibility of implementing a vision-based architecture to monitor and detect the presence of trash or valuables in shared cars. The system was introduced to take pictures of the rear seating area of a four-door passenger car. Image capture was performed with a stationary wide-angled camera unit, and image classification was conducted with a prediction model in a remote server. For classification, a convolutional neural network (CNN) in the form of a fine-tuned VGG16 model was developed. The CNN yielded an accuracy of 91.43% on a batch of 140 test images. To determine the correlation among the predictions, a confusion matrix was used, and in addition, for each predicted image, the certainty of the distinct output classes was examined. The execution time of the system, from capturing an image to displaying the results, ranged from 5.7 to 17.2 s. Misclassifications from the prediction model were observed in the results primarily due to the variation in ambient light levels and shadows within the images, which resulted in the target items lacking contrast with their neighbouring background. Developments pertaining to the modularity of the camera unit and expanding the dataset of training images are suggested for potential future research.
1. Introduction
The growth of public transportation along with shared vehicles and driverless taxis has attracted significant attention in modern times in an effort to reduce traffic on roads and vehicle emissions [1]. Thereby, to encourage passengers to use these means of transport over private vehicles, it is pivotal to maintain and ensure elevated levels of cleanliness especially with respect to the interior condition of vehicles subjected to public use on a regular basis.
Hence, the project conducted here was focused on detecting distinct types of trash items as well as valuables that would be left behind by users across the seating area of shared passenger vehicles. In the context of the current research, valuables include different types of personal belongings that are common and must be returned to a passenger, while trash corresponds to leftover items that can be directly discarded from the vehicle. The detection was based on the use of machine vision.
Upon prompt identification of any such undesirable sources inside the vehicle, the maintenance personnel would be able to take immediate action to eliminate the exposure of the leftover items to the next passengers of the vehicle. Additionally, it would also be possible to produce the identity of passengers who have left their personal belongings in order to return them. Through the timely detection of leftover items, customer confidence in using public transport modes will ultimately be enhanced.
Furthermore, in the current research, the possibility of using such a detection system embedded in a shared vehicle was studied by creating a prediction model based on computer vision and analysing its outcomes to prove the viability of the implementation in real-world use-cases. Subsequently, in the current research, the proposed method is to capture images at scheduled time intervals using an in-car camera unit.
The images would correspond to the interior seating area and would be processed autonomously in order to determine the state of cleanliness within the cabin of the vehicle. While this article is concerned with detecting leftover items in the cabin, it should be noted that cleanliness contains other factors too, such as stains in the cabin, the cabin odour and gravel or mud in the cabin (which are not addressed in the scope of the current research).
The specific form of detection in the current research corresponds to classification. The prediction model we propose to implement will classify a given image to one out of three possible output classes: Empty (clean), Trash (containing items of trash, such as cans and bottles) and Valuable (containing customer belongings, such as mobiles, wallets, backpacks and key sets). Therefore, in our project scope, the model was not developed to perform object recognition but categorization within three distinct classes. The proposed camera system will be limited to the rear seating area of the vehicle only.
The prediction model was expected to produce a minimum classification accuracy of 85% with varying lighting considered (as the illumination levels within the vehicle will be dependent on the time of day and weather conditions). Additionally, a custom annotated dataset will be constructed and put together for the purposes of reuse or optimization in future development work based on similar research scopes. Consequently, the novelty of the current research is achieved through a custom dataset creation and an application-specific algorithmic architecture for prediction using computer vision.
Moving on to the state-of-the-art, the image database compiled by Thung & Yang [2], which included up to 500 images across six different litter classes, was found to be the most widely used choice for creating trash classification models based on neural networks [2,3]. Another choice was the VN-trash dataset, which was substantially bigger, with up to 5900 images but across merely three classes of waste categories [4]. For the classification of litter in non-typical environments, such as underwater, specialized image datasets have been compiled [5,6].
Convolutional neural network (CNN) models have been recognized to be a popular choice among researchers to create garbage detection and classification models that is evident in [2,3,7,8,9]. A frequent approach was to import a predefined neural network model, examples of which include AlexNet and ResNet, followed by the step of training the network’s hyperparameters (which include techniques of transfer learning and fine tuning) to ultimately create an application specific prediction model. The CNN trained by Thung & Yang [2] produced an accuracy of 22% that, as the research presented, was due to the insufficient requirements of the dataset and lack of model training.
However, precise tuning of the hyper-parameters in prediction models, yielded accuracies of up to 87% using a ResNet-34 model [8] and 84% using a max pooling CNN [9]. The classification of waste among the six distinct categories given in [2] was also performed in a recent study using a functional link neural network and yielded an accuracy of 98.61% in a custom dataset created in the study [10]. Furthermore, Fulton et al. [5] presented, in their research, the applicability of commonly used existing object detection models, such as YOLO [11], to classify garbage, highlighting their execution speeds using different processors.
Vision-based prediction models created with conventional algorithmic approaches for trash detection outdoors were observed as follows: scale-invariant feature transform (SIFT) [2] yielded an accuracy of 63% in its custom image dataset, Viola–Jones detection [12] yielded an accuracy of 82.7% over a total of 1000 images and Karhunen–Loeve (KL) expansion [13] with an unspecified accuracy due to not being implemented in a real time application. Yet, image classification was performed using support vector machine (SVM) across all three applications listed above, despite the difference in the choices of detection techniques.
Another observation made in former studies was the development of special purpose interior sensors to perform the task of monitoring the cleanliness status in vehicle cabins. Such installations were evident in [14], in which a camera was used for cabin surveillance and safety mechanism activation, and in [15], in which the basic viability of identifying objects on the seating area of vehicles was experimented with the use of a transducer and electric field sensor combination.
Henceforth, it is discernible that the state-of-the-art in algorithmic techniques based on computer vision is well set up. Therefore, it is evident that the core requirement is to not develop the code from scratch but to import the base concepts of a suitable vision-based model that currently exists and alter their framework (as well as the relevant variable combinations) alongside applicable code level expansions that would complement the application of identifying trash and valuables inside shared vehicles. Moreover, the integration of suitable automation to monitor internal cleanliness is still in precursory stages of development.
Thus, the research gap was identified to be in the use of a suitable algorithmic technique, based on machine vision, to monitor the interior cleanliness as well as seat occupancy (with respect to leftover items) in shared vehicles when there are no passengers inside. The goal would then essentially be to classify images with trash and valuables in the rear seating area of the vehicle using a suitable vision-based architecture and compare the results with known tagged data to prove the accuracy of the system. We believe our work will ultimately contribute towards the future management and growth of shared vehicle usage, thus, contributing towards the mitigation of energy consumption in transportation.
2. Materials and Methods
A Ford Focus (2017 model), allocated for research and development purposes at the Aalto University, was used to install the camera unit for feeding images to the prediction model. The approach was based on the intuition that all shared vehicles from one organization would be of the same model, and hence, the prediction model can later be fine-tuned to other vehicles using the architecture developed in the current research.
It is important to highlight that the camera module configuration in the vehicle was developed with the focus of system demonstration and therefore not essentially as a final solution of implementation. The setup consisted of an ELP 170° fisheye camera unit to obtain images of the rear seating area. The camera was located next to the left roof handle in place of an internal light because of the practical impossibility of placing it above the middle of the rear seat (as the car had a sunroof). Additionally, to ensure that clear images could be obtained under varying levels of internal illumination (especially when it is dark outside), an LED light strip was installed to run across the entire width of the car over the rear seat and was fixed at both ends to the roof handles.
The camera unit was joined to a Raspberry Pi 3 Model B processor via USB. For controlling both the state (ON/OFF) and brightness of the light module, an N-channel MOSFET was employed. The power for the in-car unit was provided by A 12 V rechargeable battery source. The schematic of the integrated circuit is shown in Figure 1 while Figure 2 shows the implemented layout. It should be highlighted that that all the components of the camera unit, with exceptions of the light module and the camera itself, were positioned within the trunk of the car as shown in Figure 2. Furthermore, the battery pack was already installed in the vehicle, prior to the commencement of the current research and was intended for shared use among all research work conducted with this vehicle.
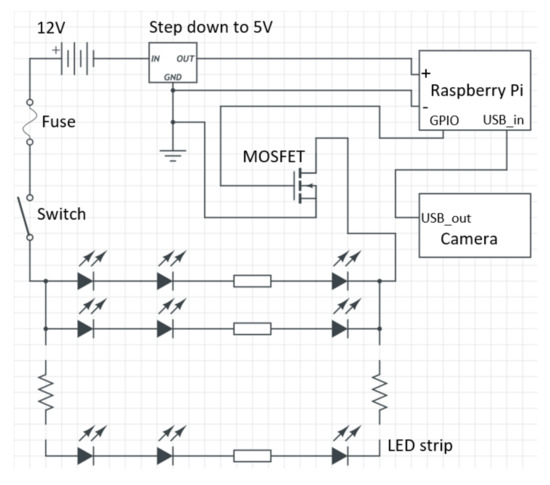
Figure 1.
Schematic of the in-car camera unit.
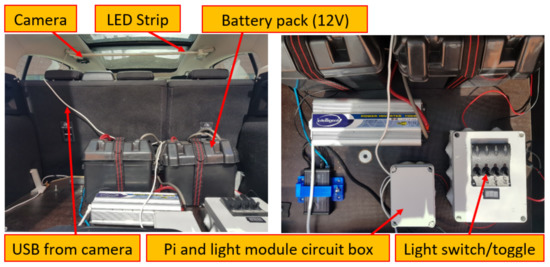
Figure 2.
Final configuration within the research vehicle.
Figure 3 illustrates how the sequence of events occur during the process, which commences from capturing an image and terminates when the predicted results are displayed. The original resolution of each captured image was 1920 by 1080 pixels (however, each image had to be preprocessed to scale it down to a size of 224 by 224 pixels prior to being input to the CNN).
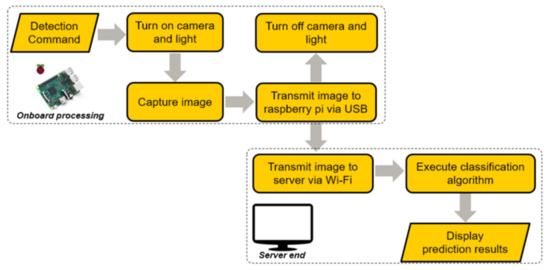
Figure 3.
Process flow of the implemented detection system.
After receiving the detection command, the camera and light module would be activated until the image is taken. Figure 4 presents the comparison of capturing an image with and without the installed LED light. The Raspberry Pi, connected to Wi-Fi, will then receive and transmit the image to a server located remotely. Then, in the server, the prediction model, in the form of a classification algorithm, will be executed, and the results displayed subsequently. Elaborating on the communication protocols, the Raspberry Pi supports remote access, which enables program modification and execution via Secure Shell (SSH). Secure Copy Protocol (SCP) was used to transfer captured images to the remote server.
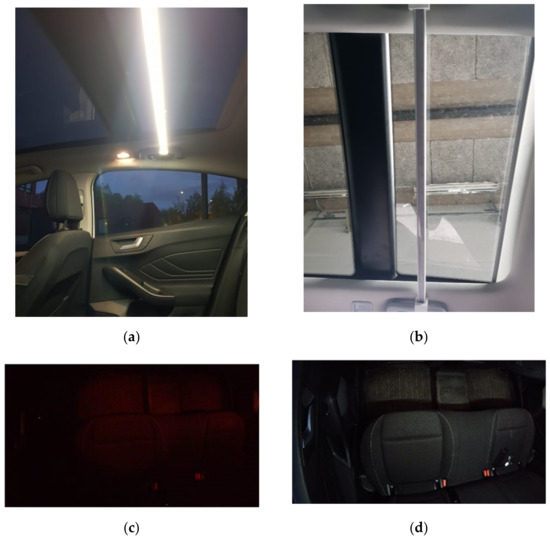
Figure 4.
Comparison of using the LED strip to obtain images of clarity. (a) LED strip when illuminated. (b) LED strip when non-illuminated. (c) Image captured without illuminating the LED strip when it is dark outside. (d) Image captured while illuminating the LED strip when it is dark outside.
Before training the prediction model, a database of images was created for the purpose of training and testing the prediction model. It contained images for the three output categories listed in the introductory section, with the inclusion of applicable exterior variations in the images, primarily with regard to different forms of shadows and levels of lighting. To collect images of empty seating areas, the approach was to execute a script, which captures an image, representing the condition of the rear seating area, on every periodic interval (ranging from 30 to 60-min time gaps) throughout the day in order to have different lighting levels and shadows across the captured frames.
The approach here offers a benefit of not requiring human intervention or supervision as the program for capturing images periodically can be run continuously when the car is left parked in a location outdoors. Additionally, the parking spot was different for each day as a measure taken to increase the variation of lighting and shadows across the images. Yet, capturing images with the inclusion of objects in the car is relatively tedious as it requires manually placing different types of items in the vehicle for each image. Doing this for different lighting conditions was further challenging. Images comprising valuables were obtained by placing different amounts and types of valuables in randomized places of the rear seating area.
The proposed algorithm to generate the prediction model was a CNN due to the highly specific nature of the current image-processing application. Specifically, the VGG16 model architecture [16] was imported and fine-tuned using software libraries and modules, including Python, Keras, Tensorflow, OpenCV and Scikit-learn. The VGG16 model architecture was adopted instead of a more advanced and more recently developed deep-learning model due to multiple reasons. First, VGG16 is a lightweight model with a smaller depth, which is capable of providing baselines to prediction-based systems.
This was a suitable choice in the current scope of the research whose primary aim is to prove the viability of the proposed vision-based detection system with limited data. The ideal model for training will be explored in future work with higher combinations of natural data (more types of trash and valuable item classes) from real and multiple shared vehicles in operation. Furthermore, VGG16 has approved availability of pre-trained models, which can be adapted and trained with specific optimization to achieve the detection requirements of the current research. Hence, the focus leans more towards fine-tuning and optimization rather than model creation or modification from the structural level.
The image data was divided into training, validation and testing batches in developing the prediction model. The tools of analysis used in the current research to evaluate the performance of the model and govern its generalizability and accuracy included confusion matrices, model training plots and trial comparison tables (a table presenting the outcome of the model’s accuracy based on various hyperparameter combinations).
Additionally, a comparative method was also proposed with the creation of a background subtraction model. The goal in this algorithm was to, first, form a static (background) model of a back seat area under ordinary circumstances (without any external items). Subsequently, the algorithm was expected to detect the foreground of captured images, in which the foreground would essentially correspond to leftover items of passengers (trash and valuables).
Lastly, by deducting the estimate corresponding to the mask (which is the background) and comparing the result with a pre-set threshold, the presence of items can be verified. The OpenCV library was used to implement the background subtraction algorithm. Figure 5 corresponds to the manner by which this algorithm was employed.
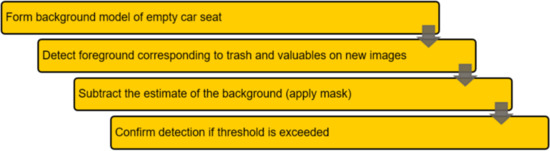
Figure 5.
Steps undertaken in developing the background subtraction model.
3. Results
3.1. Dataset
The final quantity splits of the obtained images are shown in Table 1. Note that in the final row of the table that the total number of images for the prediction model corresponds to the addition of the previous rows, except for the original training images (fourth row), because the augmented images have been accounted for.

Table 1.
Categories of the images within the compiled dataset and their respective quantitative compositions.
The augmented images are used in the training process of the CNN with parameters of augmentation, including brightness, position, orientation, scale and flip. Additionally, the trash category included various types and sizes of bottles and cans only, while the valuables category primarily contained cell phones, wallets, backpacks and keys. The limitations from a quantitative perspective of the images was primarily due to the practical difficulties in obtaining image data (as explained in page 5) and due to the pandemic situation.
The specifics of the practicalities of data collection are highlighted in pages 21 and 29 of the thesis report, which is linked under the data availability statement of this paper. The manner of ensuring higher scale data acquisition in future research (to obtain more variety of natural data with respect to trash and valuable items) for better adaptability and generalization is presented in the discussion and conclusion chapters of this paper.
The boundaries of the images obtained from the research vehicle is evident in Figure 6. Note that in the images presented that the camera covered the proposed detection area within the scope of the project but contains two other sources of variation, including the status of the rear doors (which could be opened, closed or ajar) and the back portion of the front seats (which are sometimes present based on the position of retraction of the seat).
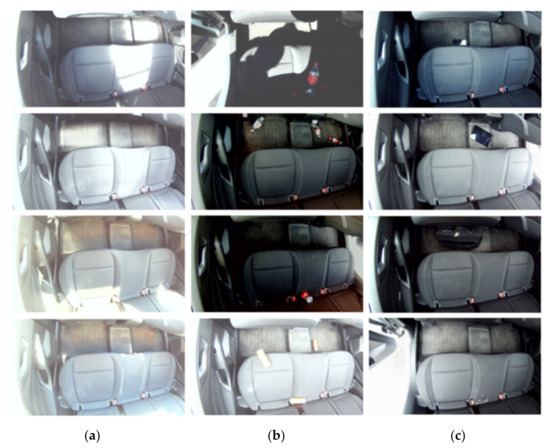
Figure 6.
A series of captured images belonging to the three distinct classes (a) empty, (b) trash and (c) valuable, respectively.
3.2. Fine-Tuned VGG16 Prediction Model
In the final architecture of the VGG16 model, SoftMax activation was used. The conversion of the vector values, by the SoftMax function, to corresponding probabilities of the three output classes can be described by
where is the input value of the vector from the previous layer and is the probability of this input value. The variables and are the indices of the vector and sum, respectively.
Furthermore, Rectified Linear Unit (ReLu) activation was associated with each activation compatible hidden layer of the CNN. Stochastic Gradient Descent (SGD) with a momentum of 0.9 was chosen as the optimizer of the network due to its observed capability of producing better results when updating the weights of the CNN throughout the training epochs. The loss function for the CNN was categorical cross-entropy since the model corresponded to a classification problem with three possible output classes.
Since it was important to ensure that the loss magnitude did not exponentially increase over specific bounds during training, L2 regularization (adding squared coefficients to the loss function) was also integrated into the architecture of the model. Regularization was used for all regularization compatible hidden layers with a constant value of 0.001. Additionally, a learning-rate scheduler was utilized in the form of a step decay function as a measure to control the learning rate during the training of the model. The equation of the learning rate used yields to:
where is the learning rate, is the initial learning rate (0.001), is the fraction by which the learning rate reduces (0.1), is the current epoch, and is the number of epochs, which should be completed before changing the value of the learning rate (40).
The model was trained using a range of hyperparameter combinations, with observations on the variation in the training and testing plots with respect to the loss and accuracy. The total number of training epochs was set to 120 (without early stopping) and batch sizes of 300, 108 and 140 were used for the training, validation and testing sets, respectively. Figure 7 illustrates the final plot once the desired accuracy of the model was reached. Note that the validation error fluctuates during training. Specifically, this fluctuation is primarily due to the validation set not being an ideal representation of the whole dataset used for training.
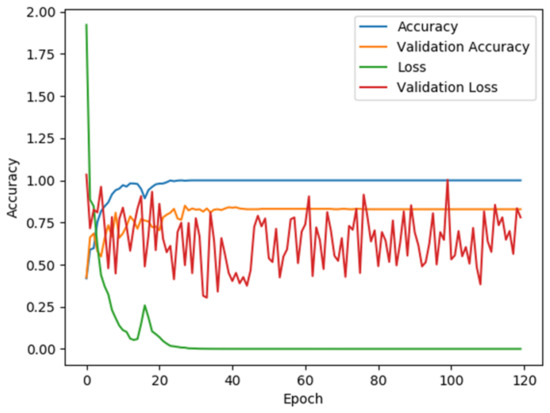
Figure 7.
Variation of the accuracy and well as the loss during the training of the vision-based prediction model. Notice how the validation loss, in comparison to the other plots, was inconsistent with heavy fluctuation.
The validation accuracy on the other hand increases and eventually saturates at the point where the training accuracy and the training loss become stable (which is the behaviour we intended to see). The contrast between the validation loss and the validation accuracy in our results was a unique case. The difference can be related to the manner by which the values are calculated for each epoch in which the validation loss corresponds to a loss function while the validation accuracy corresponds to an accuracy metric during the compilation of the model in Tensorflow.
The limitation of the dataset requirements here is therefore evident from the validation plots, which indicate slight overfitting due to a quantitative bias among certain item categories used in the current research. Thus, we are able to confirm the requirement for expanding the dataset for attaining a better ability of the model to generalize for a larger variety of potential leftover items (specifics of the future research is addressed in the conclusion).
Figure 8 shows the final confusion matrix, and this corresponded to the correlation between the predicted classes and the ground truth for the test batch of images. The final accuracy of the batch of 140 test images was observed to be 91.43%. Two files were generated as outputs to further examine the test results. One file listed the correct classifications, while the other listed the incorrect ones. Each image was presented with an index in their file along with their corresponding probabilities of certainty. In doing so, it was possible to identify patterns of false predictions and address them during the training phase of the prediction model.
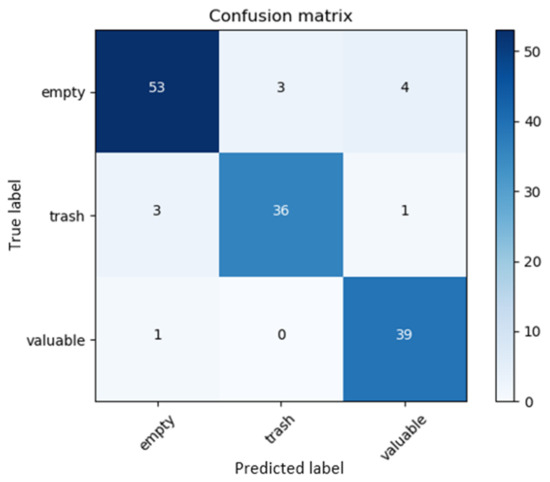
Figure 8.
Confusion matrix for the test batch.
To visualize the results conveniently, a web page was linked to the server. The web page displayed each classified image with the annotations corresponding to the predicted class as well as the probability of uncertainty. Figure 9 shows the output corresponding to a series of these images, shown earlier in Figure 6, from each of the three classes.
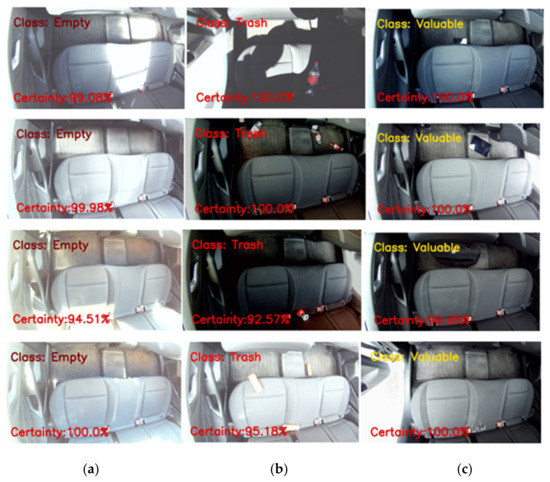
Figure 9.
Images from Figure 6 annotated with the classification and probability of certainty for the distinct classes (a) empty, (b) trash and (c) valuable.
3.3. MOG2 Background Subtraction Model (OpenCV)
Figure 10 shows the output yielded in two test images when the developed substandard background mask was applied, indicating areas of redundant foreground. To form the background model, 117 images of empty seating areas were used, with combinations of different parameters corresponding to the ratio of the image background, amount of Gaussian mixtures, variance threshold and shadow detection (true or false).
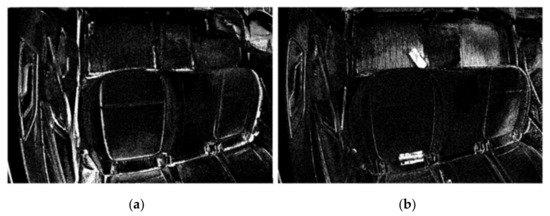
Figure 10.
Outcome of imposing background subtraction for an (a) empty seating area and (b) seating area consisting of trash.
However, we were not able to produce an acceptable approximation for the background, mainly due to the positional changes of the front seats and the existence of shadows. Therefore, the model was not able to generalize once it received new data. Due to the poor formation of the background model, a meaningful threshold could not be set to distinguish clean seating areas from those consisting of unknown entities. Therefore, we discontinued the implementation of background subtraction at the preliminary stage of binary classification (image with no leftover items and image containing leftover items).
4. Discussion
4.1. Evaluation of the Prediction Model
The algorithmic approaches used in the study yielded opposing findings, with the CNN showing potential and the background subtraction method failing. Consequently, the fine-tuned VGG16 model was in focus when evaluating the results. The outcomes from the CNN revealed that the images responded positively to changes in the rear door states (opened, closed or ajar) across all three classes. This observation is evident in the images in Figure 9, in which there are no trends in certainty based on whether the rear doors are closed, opened or in the ajar state. As a result, this external form of variation in the images had no substantial impact on the certainties.
When the seat of the driver was moved its rearmost position with respect to how much it can be retracted, as shown in Figure 11a, the prediction model was observed to produce anomalous classifications. Note the area circled in red, corresponding to the base of the headrest of the seat of the driver, which is only visible when the seat is retracted all the way back to the position shown in the image. The problem was that there was a lack of training images of the seat of the driver in this position.
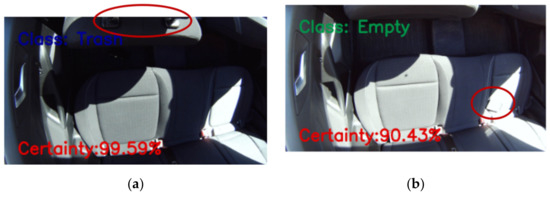
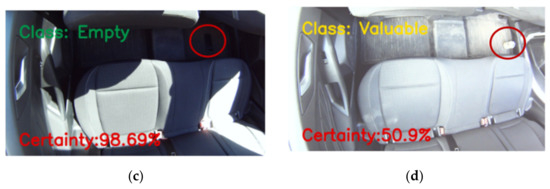
Figure 11.
Samples of misclassified images with red circles corresponding to (a) base of the driver’s head rest, (b) item subjected to glare, (c) item lacking contrast with the neighbourhood and (d) item with lack of contrast at one of the furthest points from the camera.
Limited contrast and excessive shadows, both of which hamper the potential of the camera to capture the item in a clear and visible manner, were also found to be significant sources of error in the final classification. Figure 11b shows how an instance of an incorrect classification, which can potentially occur in a predicted image when an item having a noticeable amount of glare (in this case, a mobile phone with the display face up) is positioned in an exceptionally bright location of the seat. Figure 11c presents a misclassification of an object that is positioned in a dark area and hence lacks contrast with its neighbouring pixels.
The use of a camera with higher quality and the use of contrast enhancement filters are two possible remedies for this problem that will additionally be tested in future development work. When objects with a limited contrast are positioned at one of the distant positions with respect to the camera, minor misclassifications between the trash and valuable classes were observed as evident in Figure 11d. Expanding the image dataset, used for training the model, with more quantities of similar cases is one method of correction to address this shortcoming.
Table 2 presents the cycle times of the distinct sequences of processing within the developed architecture, ranging from capturing an image with the in-car camera unit to classifying the image by the prediction model located in the remote server after successful image transmission. The figures in the table were gathered during the testing phase, and the total cycle time per image was influenced by the network connection strength in most cases. Therefore, if the data were acquired for distinct network connections at various locations, the overall time range for the cycle was expected to be greater than depicted here.
Table 2.
Cycle times corresponding to the primary process blocks with respect to the detection system.
4.2. Comparison to Previous Studies
While most of the research work covered in the state-of-the-art chapter focused on the identification and classification of various types of trash, the study presented here emphasized the classification of an image based on unknown objects under the categories of trash as well as valuables in an application specific environment. In this approach, knowing the exact type of trash or valuable is not very useful since the intended response upon classification could be developed with the three classes considered (removal of any identified sources of trash or valuables would always require human intervention as automating this process is not practical). However, we determined that it was useful to know if the image contains valuables or trash (as opposed to binary classification between an empty image and an image containing leftover items) as the maintenance personnel could use the input to determine if the items have to be returned to the passenger.
In contrast to most previous neural network-based prediction models [3,8,9], the fine-tuned VGG16 used in this study had a simpler architecture and a fewer number of layers (depth). As a result, tuning the model until it reached an acceptable prediction accuracy was made possible. This can be seen in the comparison of the accuracy of our study, which was 91.43%, to earlier models, which had lowest and highest accuracies of 22% and 98%, respectively. The comparison of the accuracies for related classification models is summarized in Table 3.
Table 3.
Comparison of the classification accuracies of the trash classification models from the previous studies. Note however that each research utilized its own dataset, which adds an element of bias to the comparison.
In comparing the classification accuracies given above in Table 3, we were able to determine that the performance primarily depended upon three factors: the network architecture of the prediction model, the extent of hyperparameter tuning and the quantity and variance of the dataset. The functional link neural network [10] is comparatively the most recent research conducted in 2022. It was focused explicitly on garbage management to identify different classes of waste (which was the main focus of other previous work as well except ours).
The authors here had built upon the VGG16 architecture with the inclusion of multiple sub modules specifically formulated for the application of garbage classification. They had used a comparatively larger dataset for training (up to 2500 raw images) and were highly precise and elaborate during the hyperparameter tuning and validation phases. Consequently, we are able to observe the highest comparative accuracy of classification for the research in [10] as presented in Table 3. On the other hand, the research in [2] had the lowest classification accuracy. Their training dataset was much smaller (approximately 500 raw images), and the authors of the paper clearly mentioned the lack of training in their CNN classification model.
Their second approach was based on traditional computer vision approaches, which seemed insufficient with respect to the algorithmic capability in achieving the goal of waste classification (the same can be deduced about the results from the research in [12] but with a higher classification accuracy as a result of better algorithm tuning). Moreover, former neural network-based prediction models relied on stable backgrounds with minimum variation of lighting and shadows.
Unlike existing image datasets, such as [2,4], which were primarily made up of various types of trash, the dataset generated in our study emphasized on a specific use case with the inclusion of valuables that were not addressed in previous studies. Thereby, it is clear that the focus with respect to the outcome of our research was slightly different from the other models presented in Table 3 as we were not interested in the explicit categories of trash but to determine if the image consisted of trash or valuable items.
In contrast to current datasets that are more generalized, the nature of the dataset in our research was biased and had a higher variance of high-level object classes (both trash and valuables and not only different types of trash) since it featured images containing items that were handpicked and placed in the car at randomized positions. The process of manual placement will be eliminated during the future development of the model since the camera unit will be installed in real shared vehicles, in which case, we can expand the dataset by obtaining images of actual leftover items from the passengers.
Doing so will allow us to expand the current dataset to better exert the benefits of our prediction model with respect to its ability of generalization for a larger variety of item classes that would be applicable in real use-case scenarios. Subsequently, the architecture of the model will also be improved to achieve high-quality feature recognition for increased reliability across multiple applicable item categories, such as food wrappers, plastic bags and cigarette butts (in addition to more variance of the current item classes).
Specifically, we aim to advance the prediction model from classification to detection in order to convert our research aim, from proving the viability of the system to generating its optimal state in effectively accomplishing the concrete requirements of detection with respect to the real-world scenario of cleanliness determination in shared vehicles. A proposed approach to achieve this goal is to build upon the EfficientDet architecture proposed in [17]. In the process, we can overcome the limitations of the current research with respect to previously highlighted factors mainly with respect to the generalization and adaptability of the system for a wider scope of leftover items.
5. Conclusions
Our research commenced with the goal of establishing the viability of utilizing an autonomous monitoring and classification system based on computer vision for detecting various types of trash as well as valuables (both categories of which correspond to items left behind by passengers) in the rear seating area of a shared car. Subsequently, a suitable in-car camera unit was implemented and integrated to an existing power configuration (of the research vehicle used in the current study) to capture the state of the seating area.
Although the implemented configuration did not correspond to a final solution, the installation was recognized to be compact, affordable and effective for the purpose of capturing an image efficiently upon receiving the command. The communication setup proved successful in transferring a captured image to a remote server in which the prediction model was executed for classification. Future work will focus on a more modular camera unit that will draw power from the 12 V line of the vehicle itself. The use of an infrared (IR) camera will also be experimented to perform detections when there is a lack of daylight and illumination, thereby, eliminating the use of an extra LED light.
To classify an image into one of the three distinct classes in the scope of the current study, two algorithmic models were investigated. The primary algorithm was a fine-tuned VGG16 CNN model, which achieved an accuracy of 91.43% on a pre-compiled batch of test images. A set of distinct error sources in the classification outcomes were observed and elaborated. These included errors due to certain forms of shadows, unsuitable levels of ambient light, a lack of item contrast with the neighbouring background and the position of the driver seat.
Background subtraction was used as a comparative algorithmic approach; however, in the current study, the application of this method failed as a result of not being able to form a background model. The cause for not being able to generate an applicable estimate of the background was identified to be the presence of high nominal variation (as a result of the varying front seat positions and shadows) present in the empty images.
The applicability of using computer vision to classify trash as well as valuables within the cabin of a shared vehicle was observed to function successfully for a single model of a vehicle. Specifics with respect to the distinct patterns of incorrect classifications, the reasoning behind the reduction in accuracy for the classified images and potential methods by which optimization could be performed to address the misclassifications in future studies were provided. To address the current difficulties and prepare the system for real-world use, advanced algorithm development will be conducted with respect to the prediction model. The final aim is to develop a system capable of providing a cleanliness level for different types of vehicle models on a predetermined scale with suitable alerts.
Moreover, we aim to expand the dataset of images by obtaining images from actual shared vehicles in operation in order to improve the generalizability of the model (as this was not possible in the current research due to practical difficulties pertaining to the pandemic situation). The current definition of interior cleanliness will also be expanded by integrating other detection criteria, such as dirt, spills, stains and odour, using suitable sensor fusion techniques. Furthermore, a modular camera unit with an inbuilt flash feature, which could be effortlessly installed, will be developed to enable the capability of capturing a larger area of the car interior (including the front seats) as well as to obtain images from a shared vehicle in real-time operation.
Author Contributions
Conceptualization, N.J., K.K., R.O. and K.T.; methodology, N.J., K.K. and J.P.; software, N.J.; validation, N.J. and K.K.; formal analysis, N.J., K.K. and K.T.; investigation, N.J. and K.K.; resources, N.J., R.O. and J.P.; data curation, N.J.; writing—original draft preparation, N.J.; writing—review and editing, N.J., K.K. and K.T.; visualization, N.J.; supervision, K.K. and K.T.; project administration, K.K. and K.T.; and funding acquisition, EIT Urban Mobility—Smart Trash Detection and Damage Prevention for Shared Mobility. All authors have read and agreed to the published version of the manuscript.
Funding
This work was supported in part by the Henry Ford Foundation Finland, in part by the Academy of Finland under Grant 326346, in part by Aalto University and in part by EIT Urban Mobility (Smart Trash Detection and Damage Prevention for Shared Mobility) under Grants 20007 and 21010.
Institutional Review Board Statement
Not applicable.
Informed Consent Statement
Not applicable.
Data Availability Statement
Custom dataset: https://drive.google.com/drive/folders/1OXJ2LctlFAfacscMLwys83fNSizP6JdR?usp=sharing; Data visualization tool: https://www.tensorflow.org/tensorboard; Prediction model (source code): https://drive.google.com/drive/folders/1fiB2ck_YyJcm8zi8Op-TqWOVfy0lfrdc?usp=sharing; Demonstration video: https://www.youtube.com/watch?v=DtRE1E2s-DE&t=2922s&ab_channel=AutonomousWaveChannel (beginning from the 31st minute); Associated thesis report: https://aaltodoc.aalto.fi/handle/123456789/46148 [18]. (accessed on 29 May 2022).
Conflicts of Interest
The authors declare no conflict of interest.
References
- Car Sharing and Transportation Trends|Future Mind 2020. Available online: https://www.futuremind.com/blog/car-sharing-and-transportation-trends (accessed on 11 April 2022).
- Yang, M.; Thung, G. Classification of trash for recyclability status. CS229 Proj. Rep. 2016, 2016, 3. [Google Scholar]
- Adedeji, O.; Wang, Z. Intelligent waste classification system using deep learning convolutional neural network. Procedia Manuf. 2019, 35, 607–612. [Google Scholar] [CrossRef]
- Vo, A.H.; Vo, M.T.; Le, T. A novel framework for trash classification using deep transfer learning. IEEE Access 2019, 7, 178631–178639. [Google Scholar] [CrossRef]
- Fulton, M.; Hong, J.; Islam, M.J.; Sattar, J. Robotic detection of marine litter using deep visual detection models. In Proceedings of the 2019 International Conference on Robotics and Automation (ICRA), Montreal, QC, Canada, 20–24 May 2019; pp. 5752–5758. [Google Scholar]
- Xue, B.; Huang, B.; Chen, G.; Li, H.; Wei, W. Deep-sea debris identification using deep convolutional neural networks. IEEE J. Sel. Top. Appl. Earth Obs. Remote Sens. 2021, 14, 8909–8921. [Google Scholar] [CrossRef]
- Batinić, B.; Vukmirović, S.; Vujić, G.; Stanisavljević, N.; Ubavin, D.; Vukmirović, G. Using ANN Model to Determine Future Waste Characteristics in Order to Achieve Specific Waste Management Targets-Case Study of Serbia. J. Sci. Ind. Res. 2011, 70, 513–518. [Google Scholar]
- Bai, J.; Lian, S.; Liu, Z.; Wang, K.; Liu, D. Deep learning based robot for automatically picking up garbage on the grass. IEEE Trans. Consum. Electron. 2018, 64, 382–389. [Google Scholar] [CrossRef] [Green Version]
- Zhihong, C.; Hebin, Z.; Yanbo, W.; Binyan, L.; Yu, L. A vision-based robotic grasping system using deep learning for garbage sorting. In Proceedings of the 2017 36th Chinese Control Conference (CCC), Dalian, China, 26–28 July 2017; pp. 11223–11226. [Google Scholar]
- Alsubaei, F.S.; Al-Wesabi, F.N.; Hilal, A.M. Deep Learning-Based Small Object Detection and Classification Model for Garbage Waste Management in Smart Cities and IoT Environment. Appl. Sci. 2022, 12, 2281. [Google Scholar] [CrossRef]
- Redmon, J.; Divvala, S.; Girshick, R.; Farhadi, A. You only look once: Unified, real-time object detection. In Proceedings of the IEEE Conference on Computer Vision and Pattern Recognition, Las Vegas, NV, USA, 27–30 June 2016; pp. 779–788. [Google Scholar]
- Salimi, I.; Dewantara, B.S.B.; Wibowo, I.K. Visual-based trash detection and classification system for smart trash bin robot. In Proceedings of the 2018 International Electronics Symposium on Knowledge Creation and Intelligent Computing (IES-KCIC), Surabaya, Indonesia, 29–30 October 2018; pp. 378–383. [Google Scholar]
- Fuchikawa, Y.; Nishida, T.; Kurogi, S.; Kondo, T.; Ohkawa, F.; Suehiro, T.; Watanabe, Y.; Kawamura, Y.; Obata, M.; Miyagawa, H.; et al. Development of a Vision System for an Outdoor Service Robot to Collect Trash on Streets. In Proceedings of the Eighth IASTED International Conference on Computer Graphics and Imaging, Honolulu, HI, USA, 15–17 August 2005; pp. 100–105. [Google Scholar]
- Fritzsche, M.; Lohlein, O.; Stein, F.; Wurz-Wessel, A. Process for Monitoring the Internal Space of a Vehicle, as Well as a Vehicle with at Least one Camera within the Vehicle Cabin. U.S. Patent Application No. 10/307,171, 29 May 2003. [Google Scholar]
- Hyundai Motor to Present Results of in-Car Cleanliness Study. Available online: https://www.hyundai.news/eu/articles/press-releases/hyundai-motor-to-present-results-of-in-car-cleanliness-study.html (accessed on 11 April 2022).
- Simonyan, K.; Zisserman, A. Very Deep Convolutional Networks for Large-Scale Image Recognition. arXiv 2015, arXiv:1409.1556. [Google Scholar]
- Tan, M.; Pang, R.; Le, Q.V. EfficientDet: Scalable and Efficient Object Detection. In Proceedings of the 2020 IEEE/CVF Conference on Computer Vision and Pattern Recognition (CVPR), Seattle, WA, USA, 13–19 June 2020; pp. 10781–10790. [Google Scholar]
- Jayawickrama, N. Detecting Trash and Valuables with Machine Vision in Passenger Vehicles. Master’s Thesis, Aalto University, Espoo, Finland, 2020. [Google Scholar]
Publisher’s Note: MDPI stays neutral with regard to jurisdictional claims in published maps and institutional affiliations. |
© 2022 by the authors. Licensee MDPI, Basel, Switzerland. This article is an open access article distributed under the terms and conditions of the Creative Commons Attribution (CC BY) license (https://creativecommons.org/licenses/by/4.0/).