
Hybrid Quality Inspection for the Automotive Industry: Replacing the Paper-Based Conformity List through Semi-Supervised Object Detection and Simulated Data

 , ,
, ,  and
and
Abstract
:1. Introduction
- a hybrid end-to-end system for automatic quality control in the automotive industry;
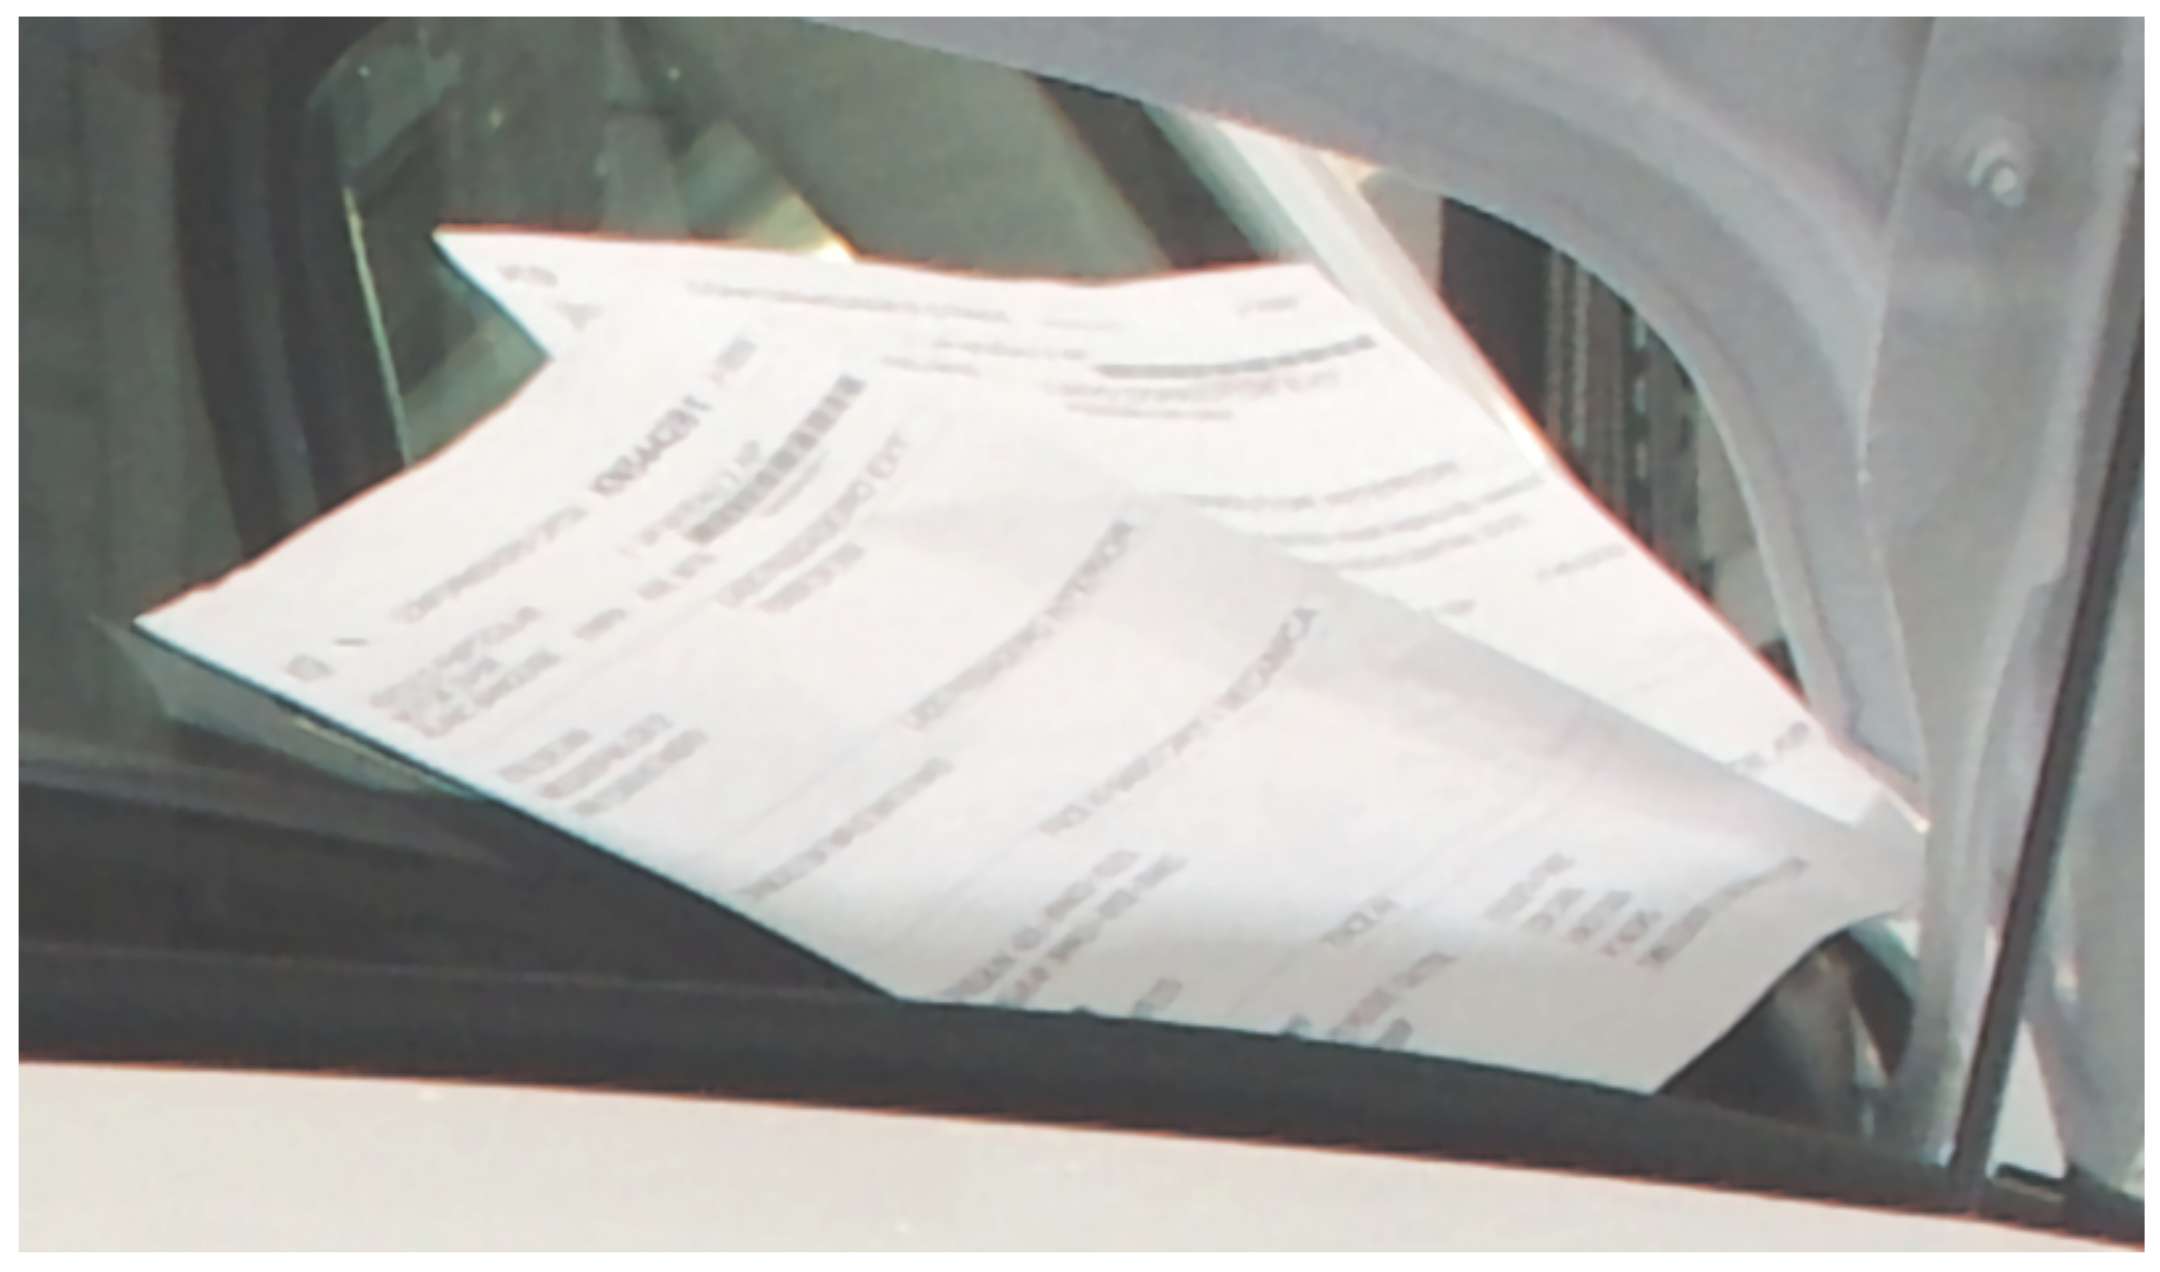
- replacement of the paper based conformity list by a digital alternative;
- application of state-of-the-art domain adaptation and pseudo labeling techniques in a novel joint approach to tackle semi-supervised cross domain object detection for quality control in the automotive industry;
- improvement of a previously proposed [10] multi-purpose 3D vehicle generator.
2. State-of-the-Art
3. Materials and Methods
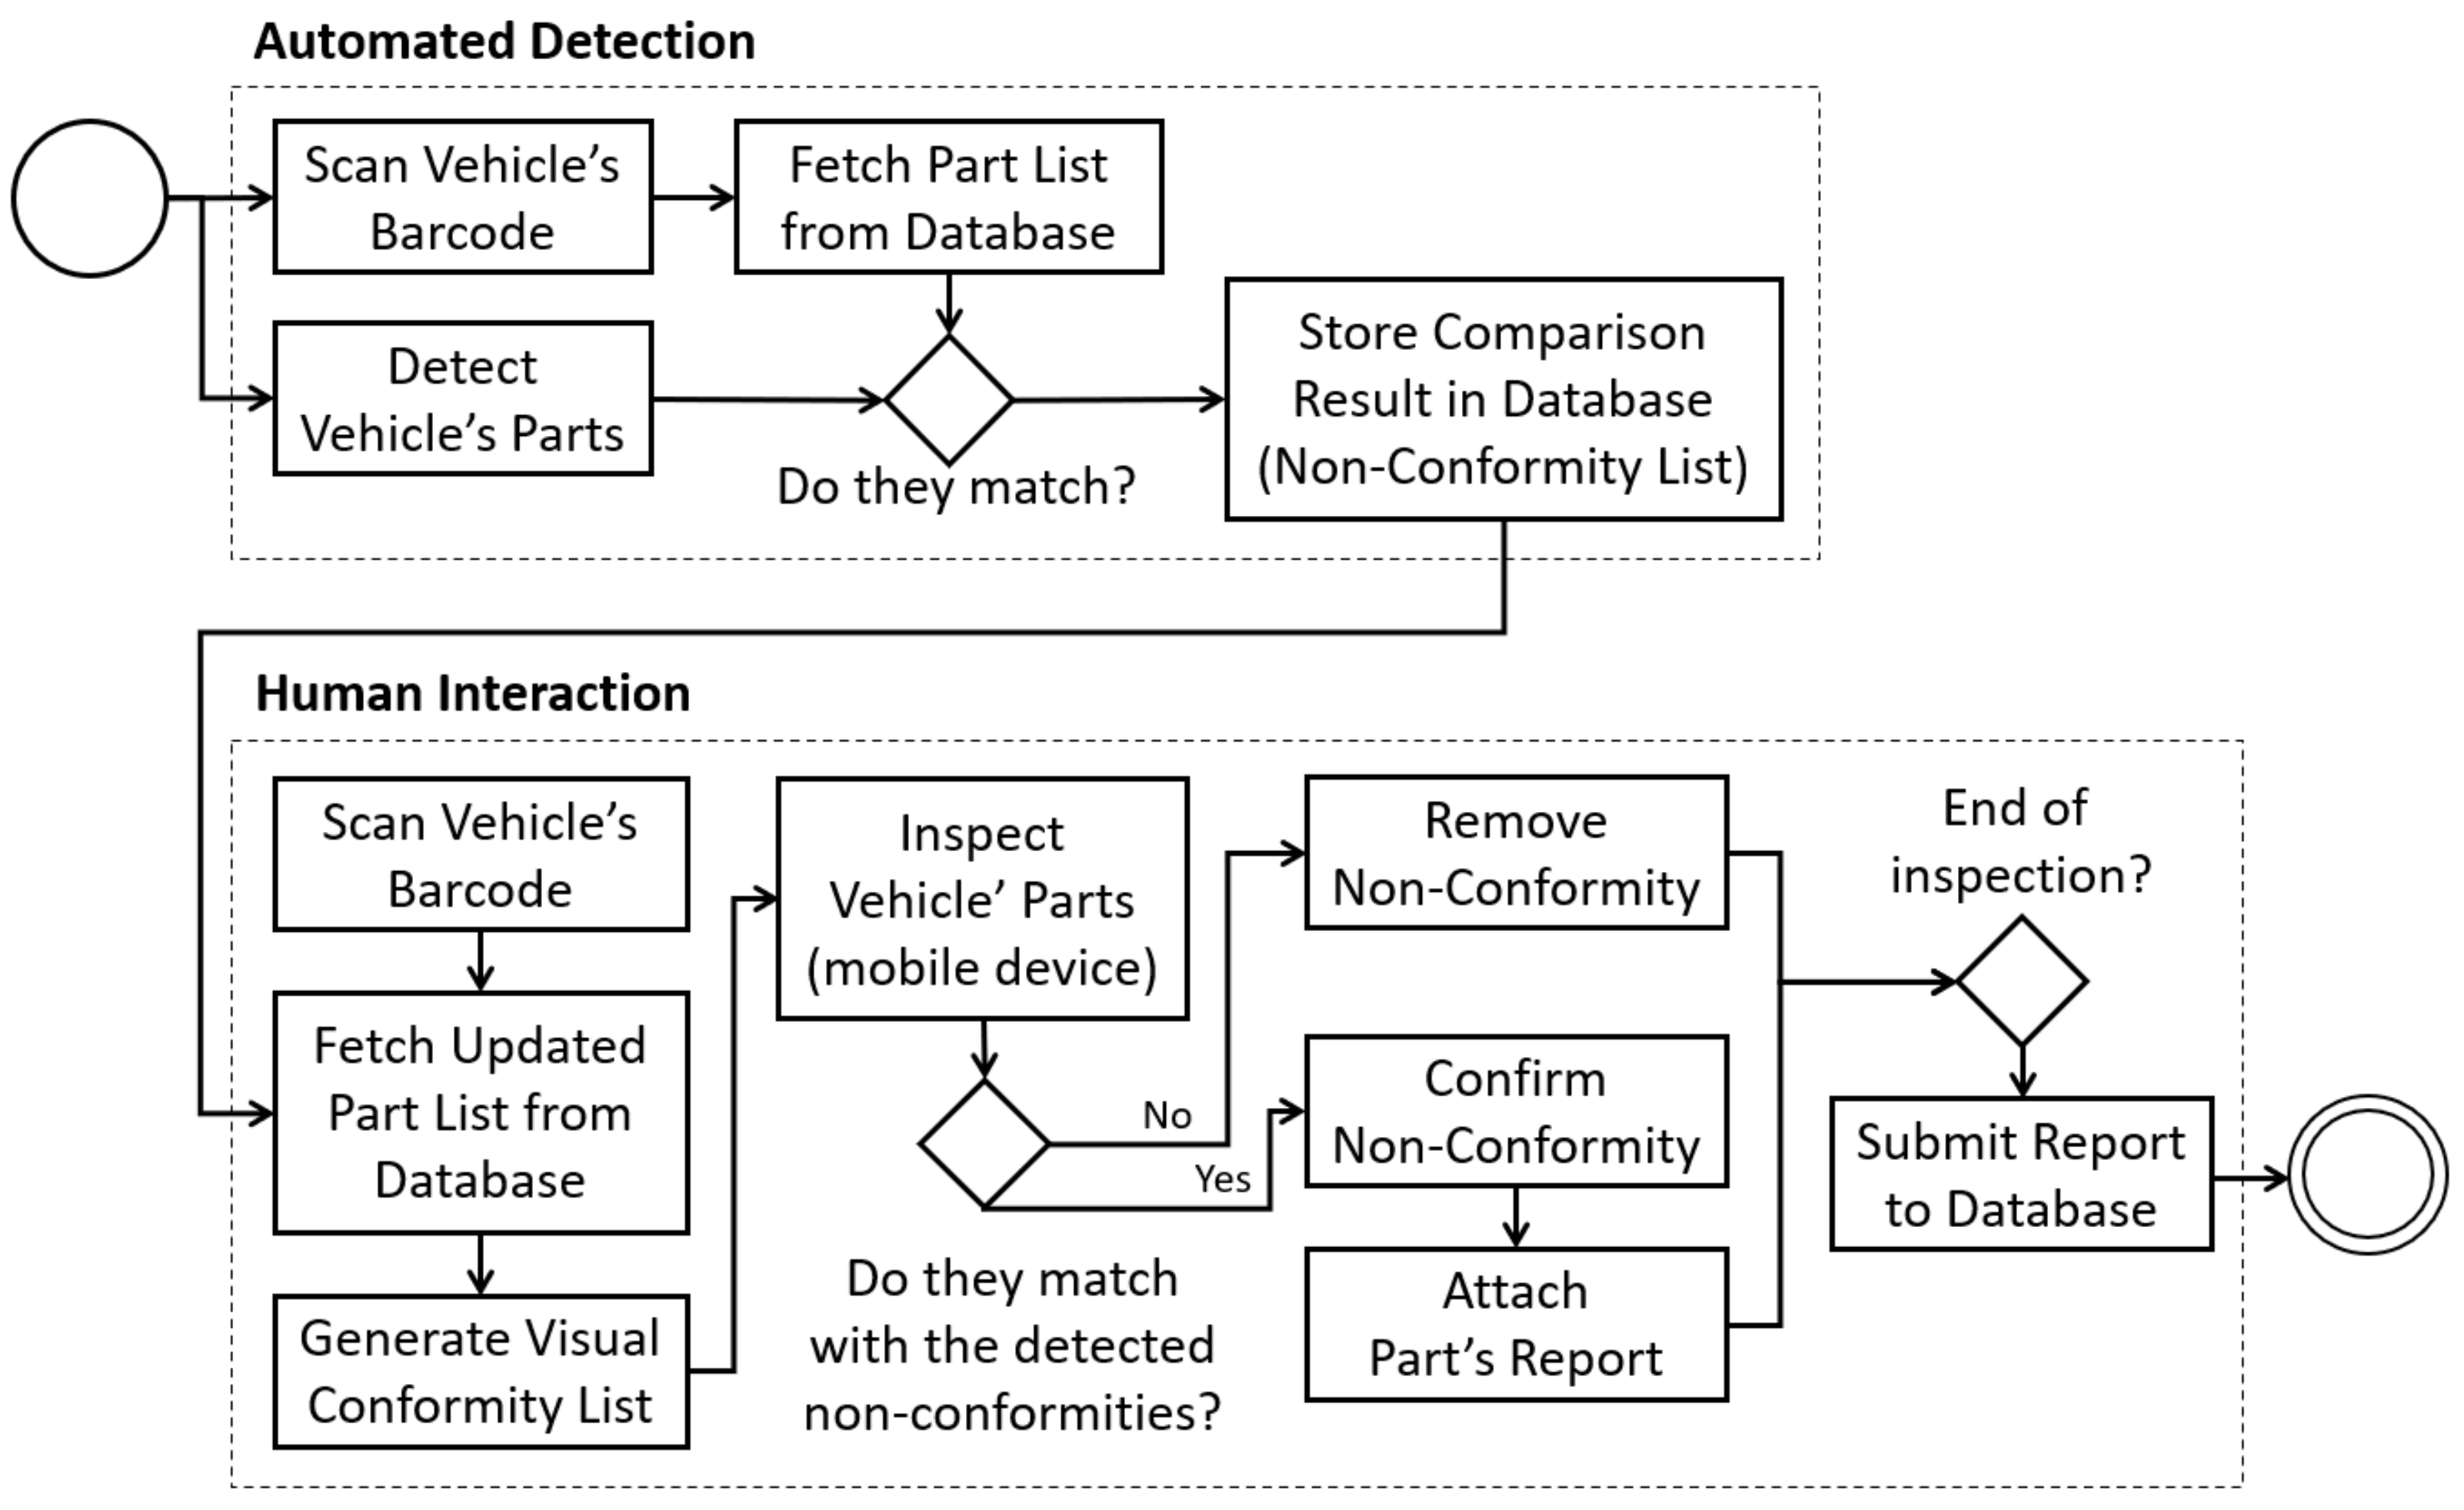
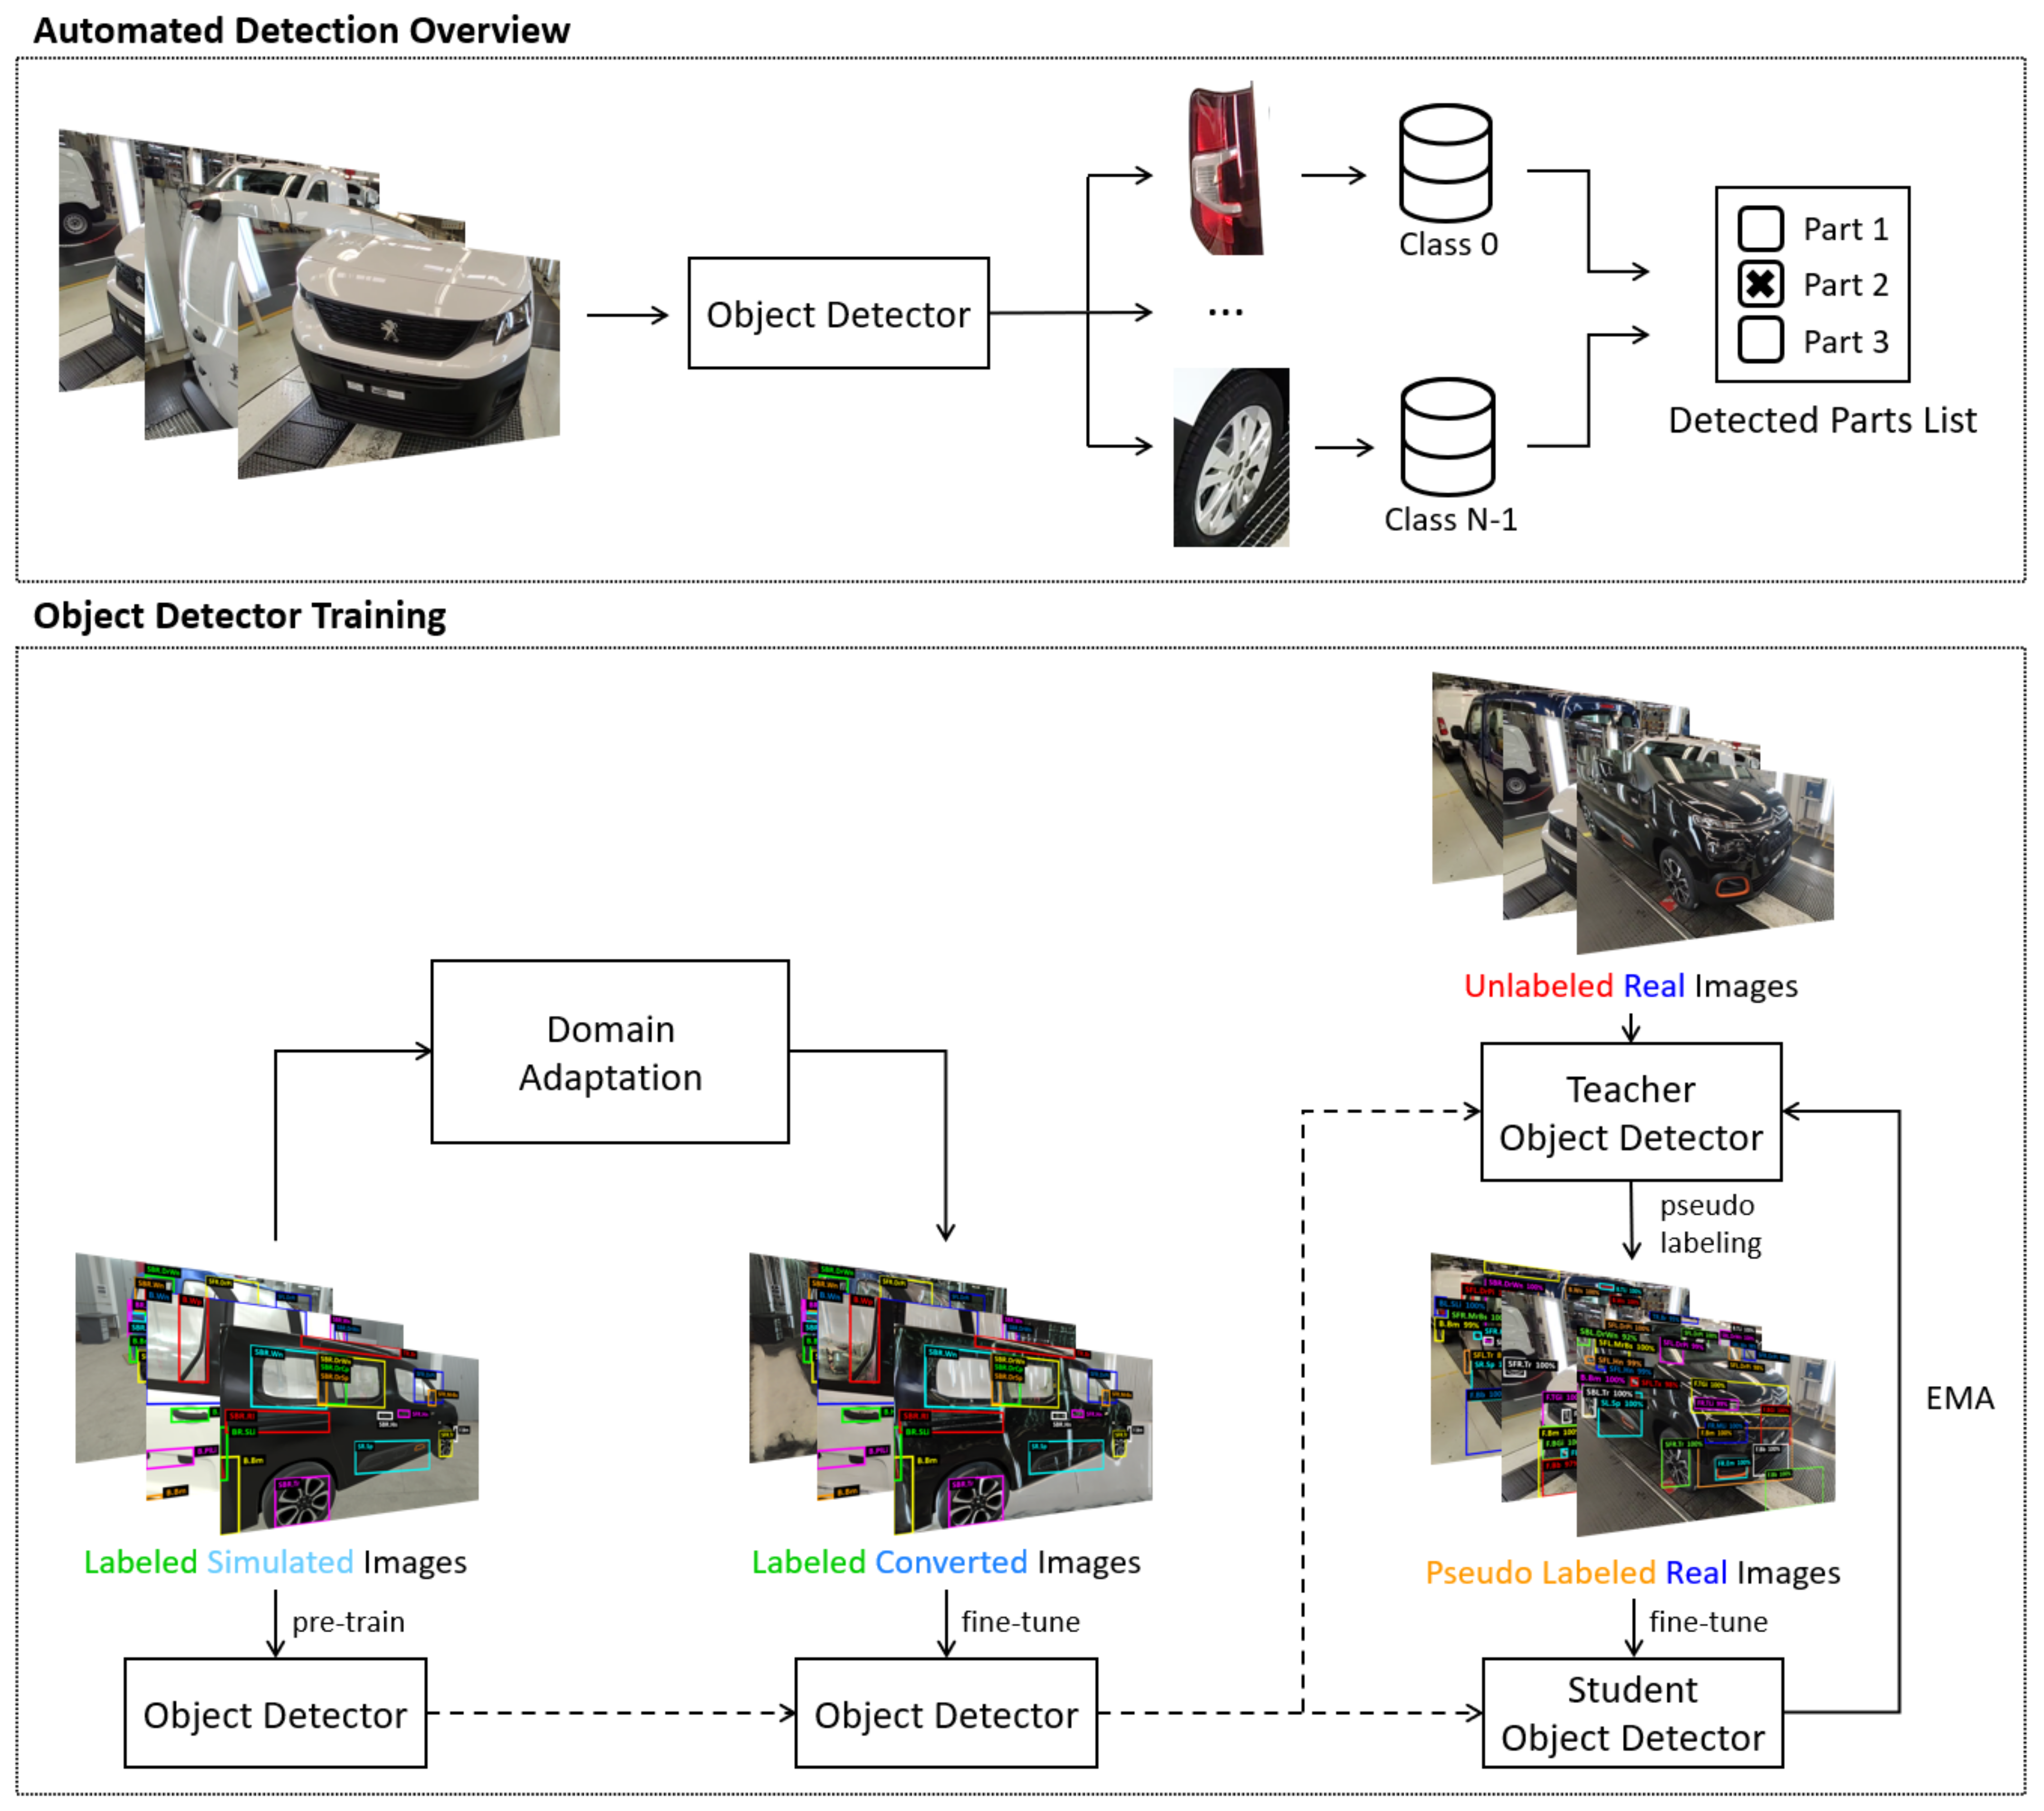
3.1. System Architecture
- Describe the conforming vehicle in the factory’s database, along with other relevant metrics;
- Access the information via scanning of the barcode placed on the assembled vehicle;
- Use an automated detection system to perform the initial quality inspection of the vehicle;
- Use a wearable device (e.g., Smartglasses) to display the vehicle’s conformity list alongside the results of the non-conformity detection, both in a visual format;
- Allow the worker to confirm or cancel each of the results, or submit undetected non-conformities to the final inspection report;
- Allow the worker to attach a photo and/or text report to each individual non-conformity;
- Update the database information with the results of the automated detection and the final inspection report submitted wirelessly by the worker;
- Use the submitted feedback to refine the automated detection system and improve its performance.
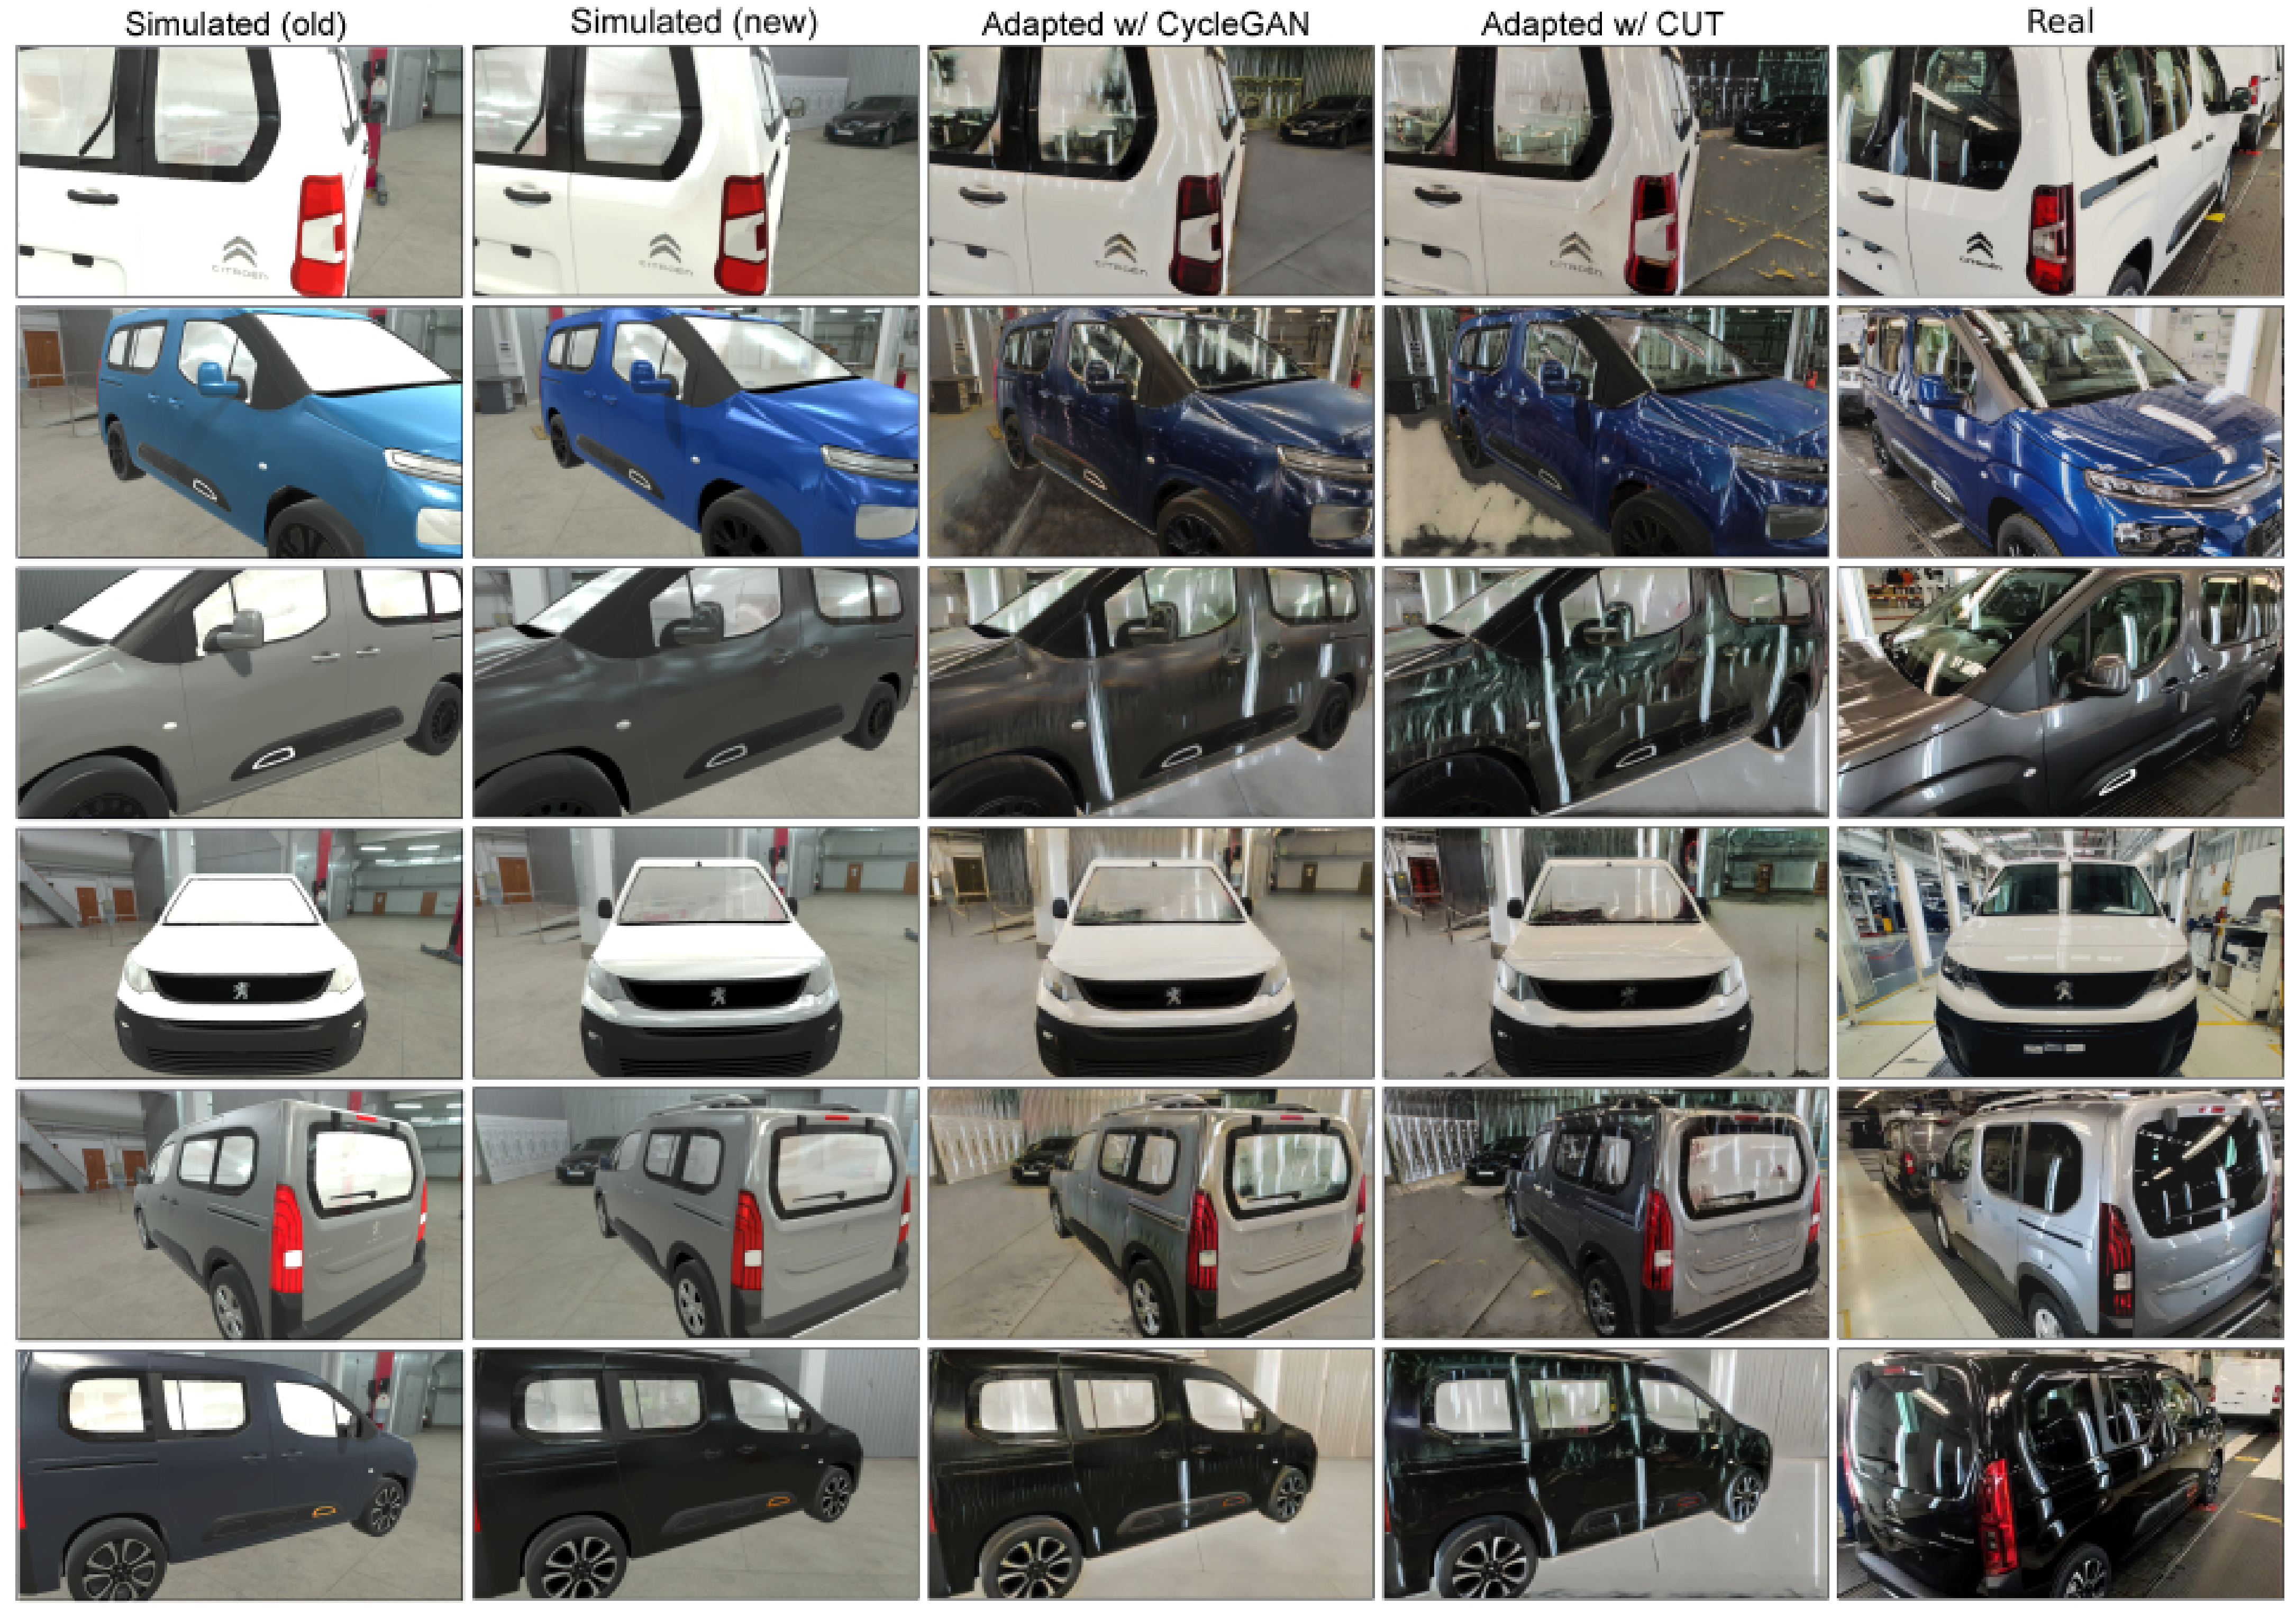
3.2. Vehicle Generator
3.3. Automated Detection
3.3.1. Related Work
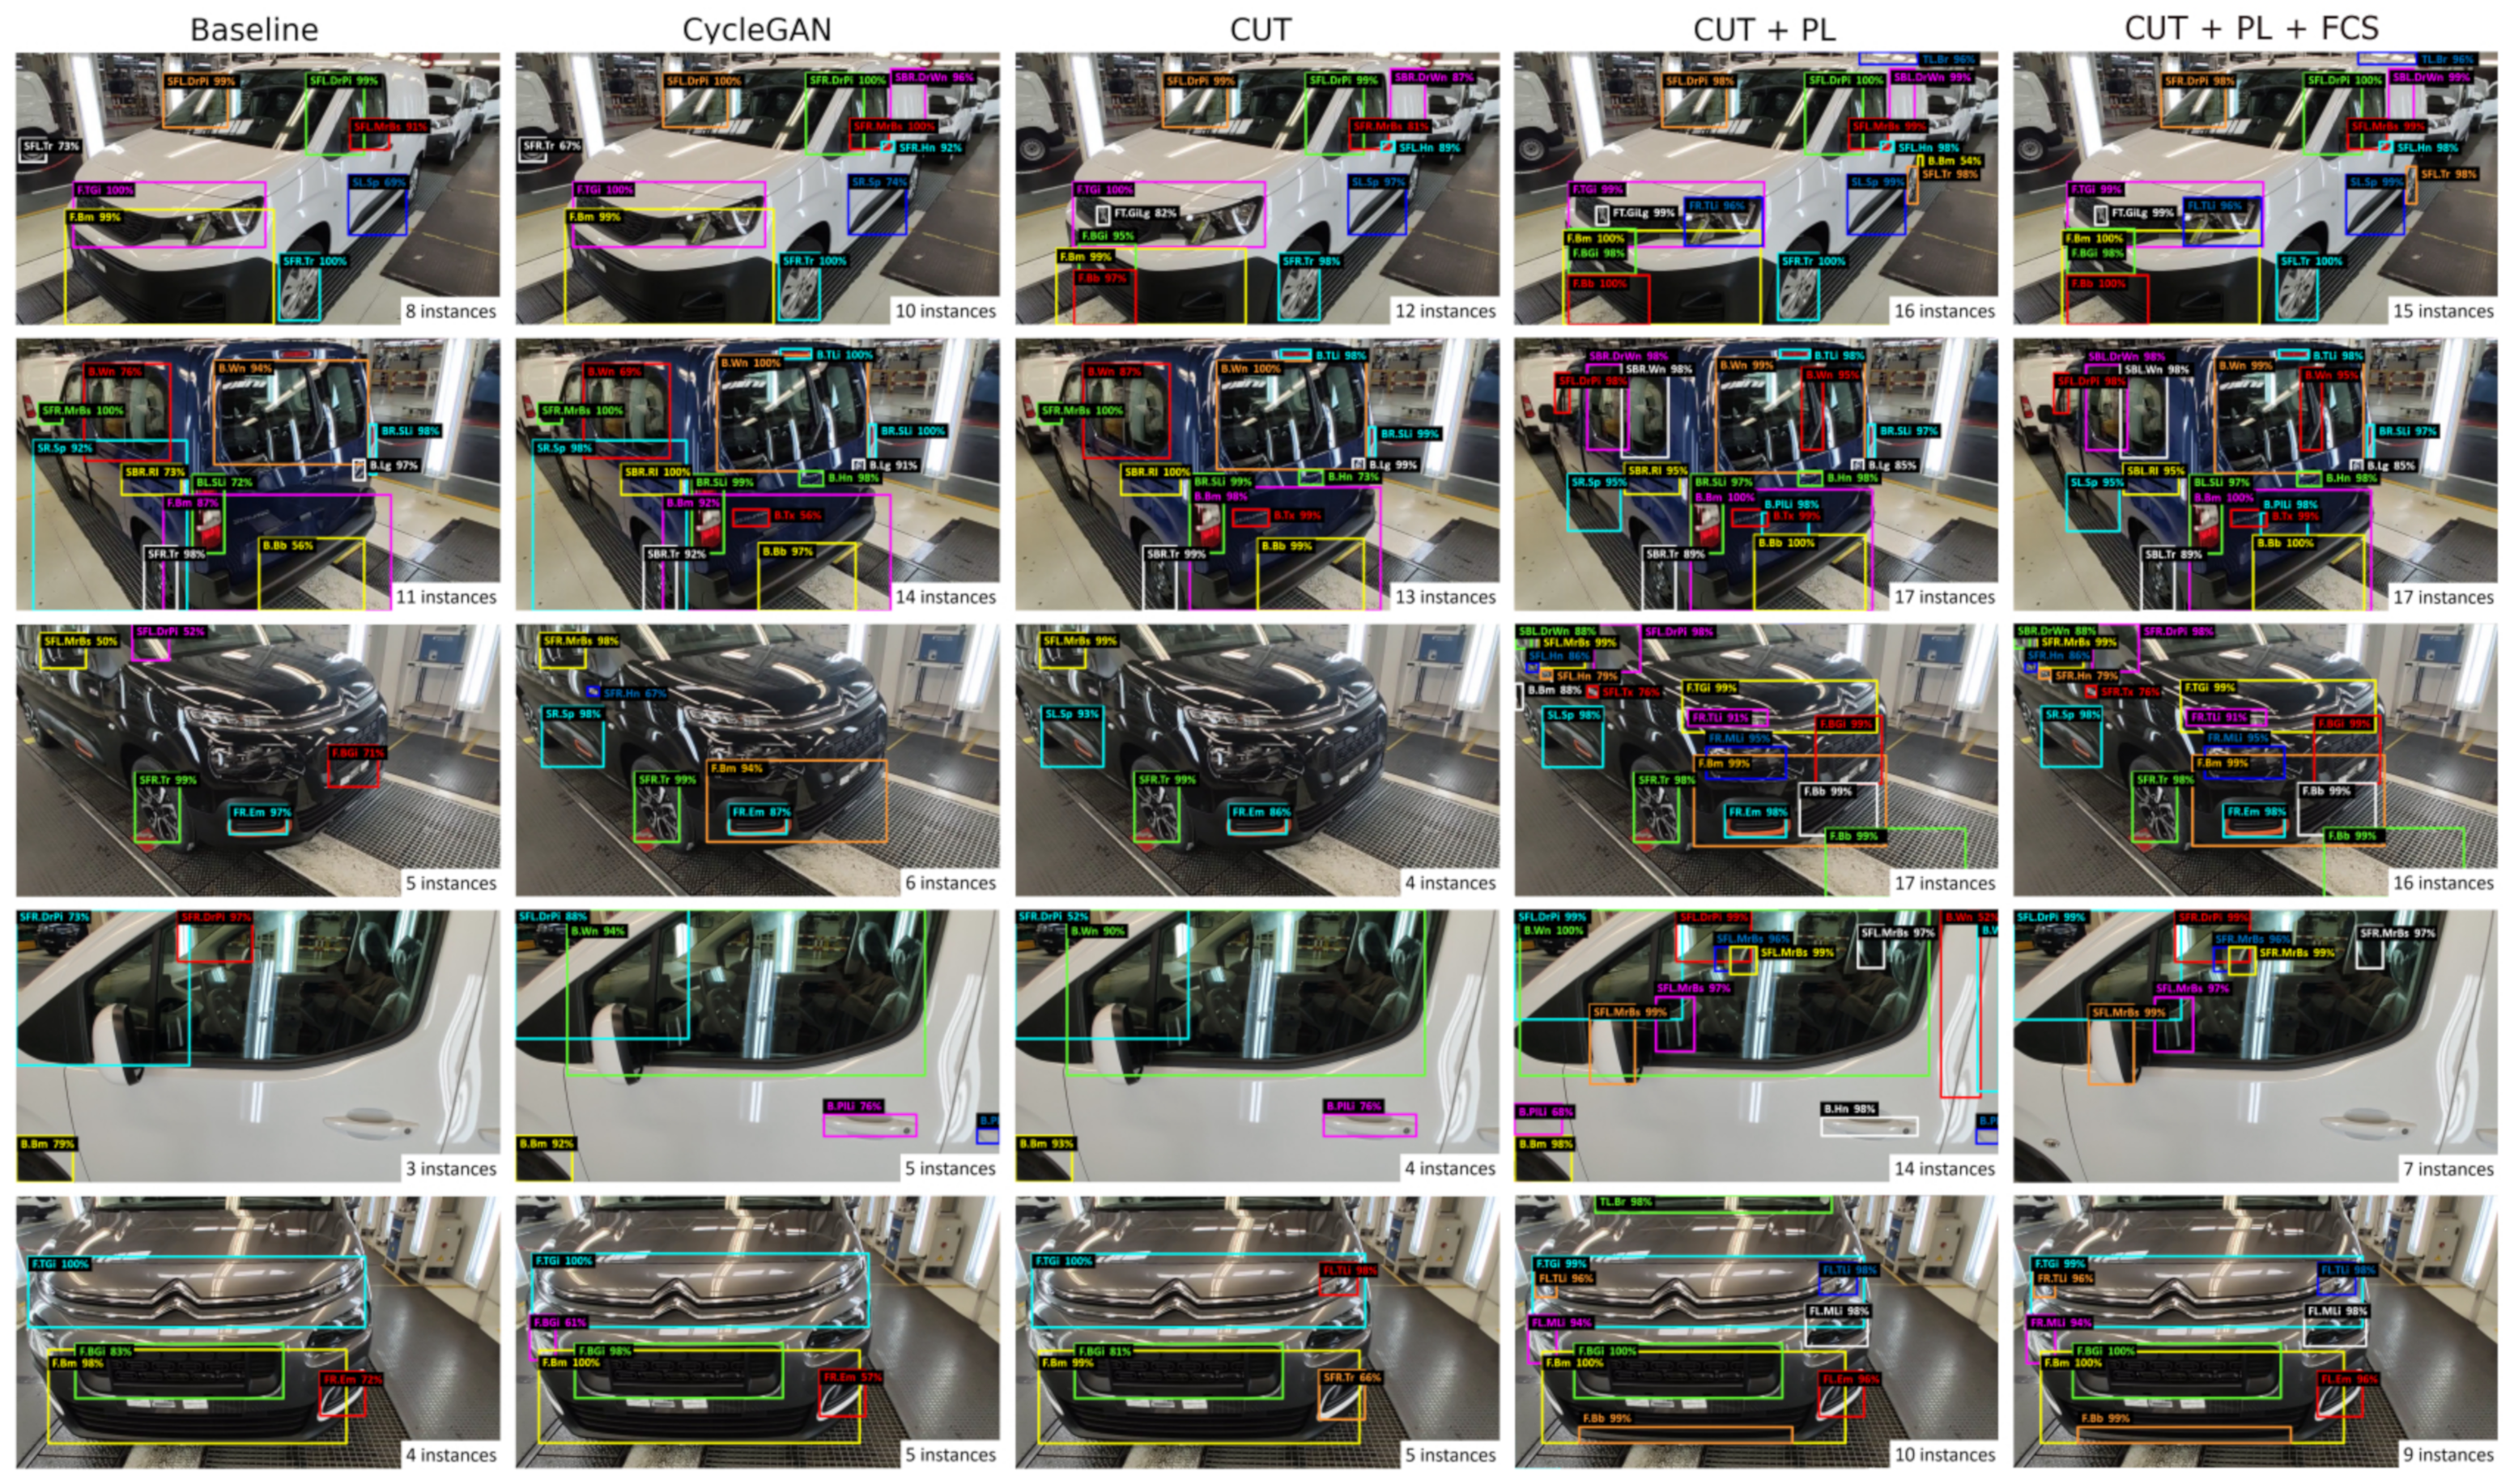
3.3.2. Baseline
3.3.3. Improvements
3.3.4. Fixed Camera Setup
- each image in the real test was labeled with its visible vehicle view(s) and their corresponding objects
- any left/right discrepancies were corrected, by switching the incorrectly detected sides to match the one present in the corresponding view(s) (this was only applied to images with one visible side of the vehicle, not to images where both left and right sides are visible)
- the detected objects that did not belong to the given view(s) were eliminated
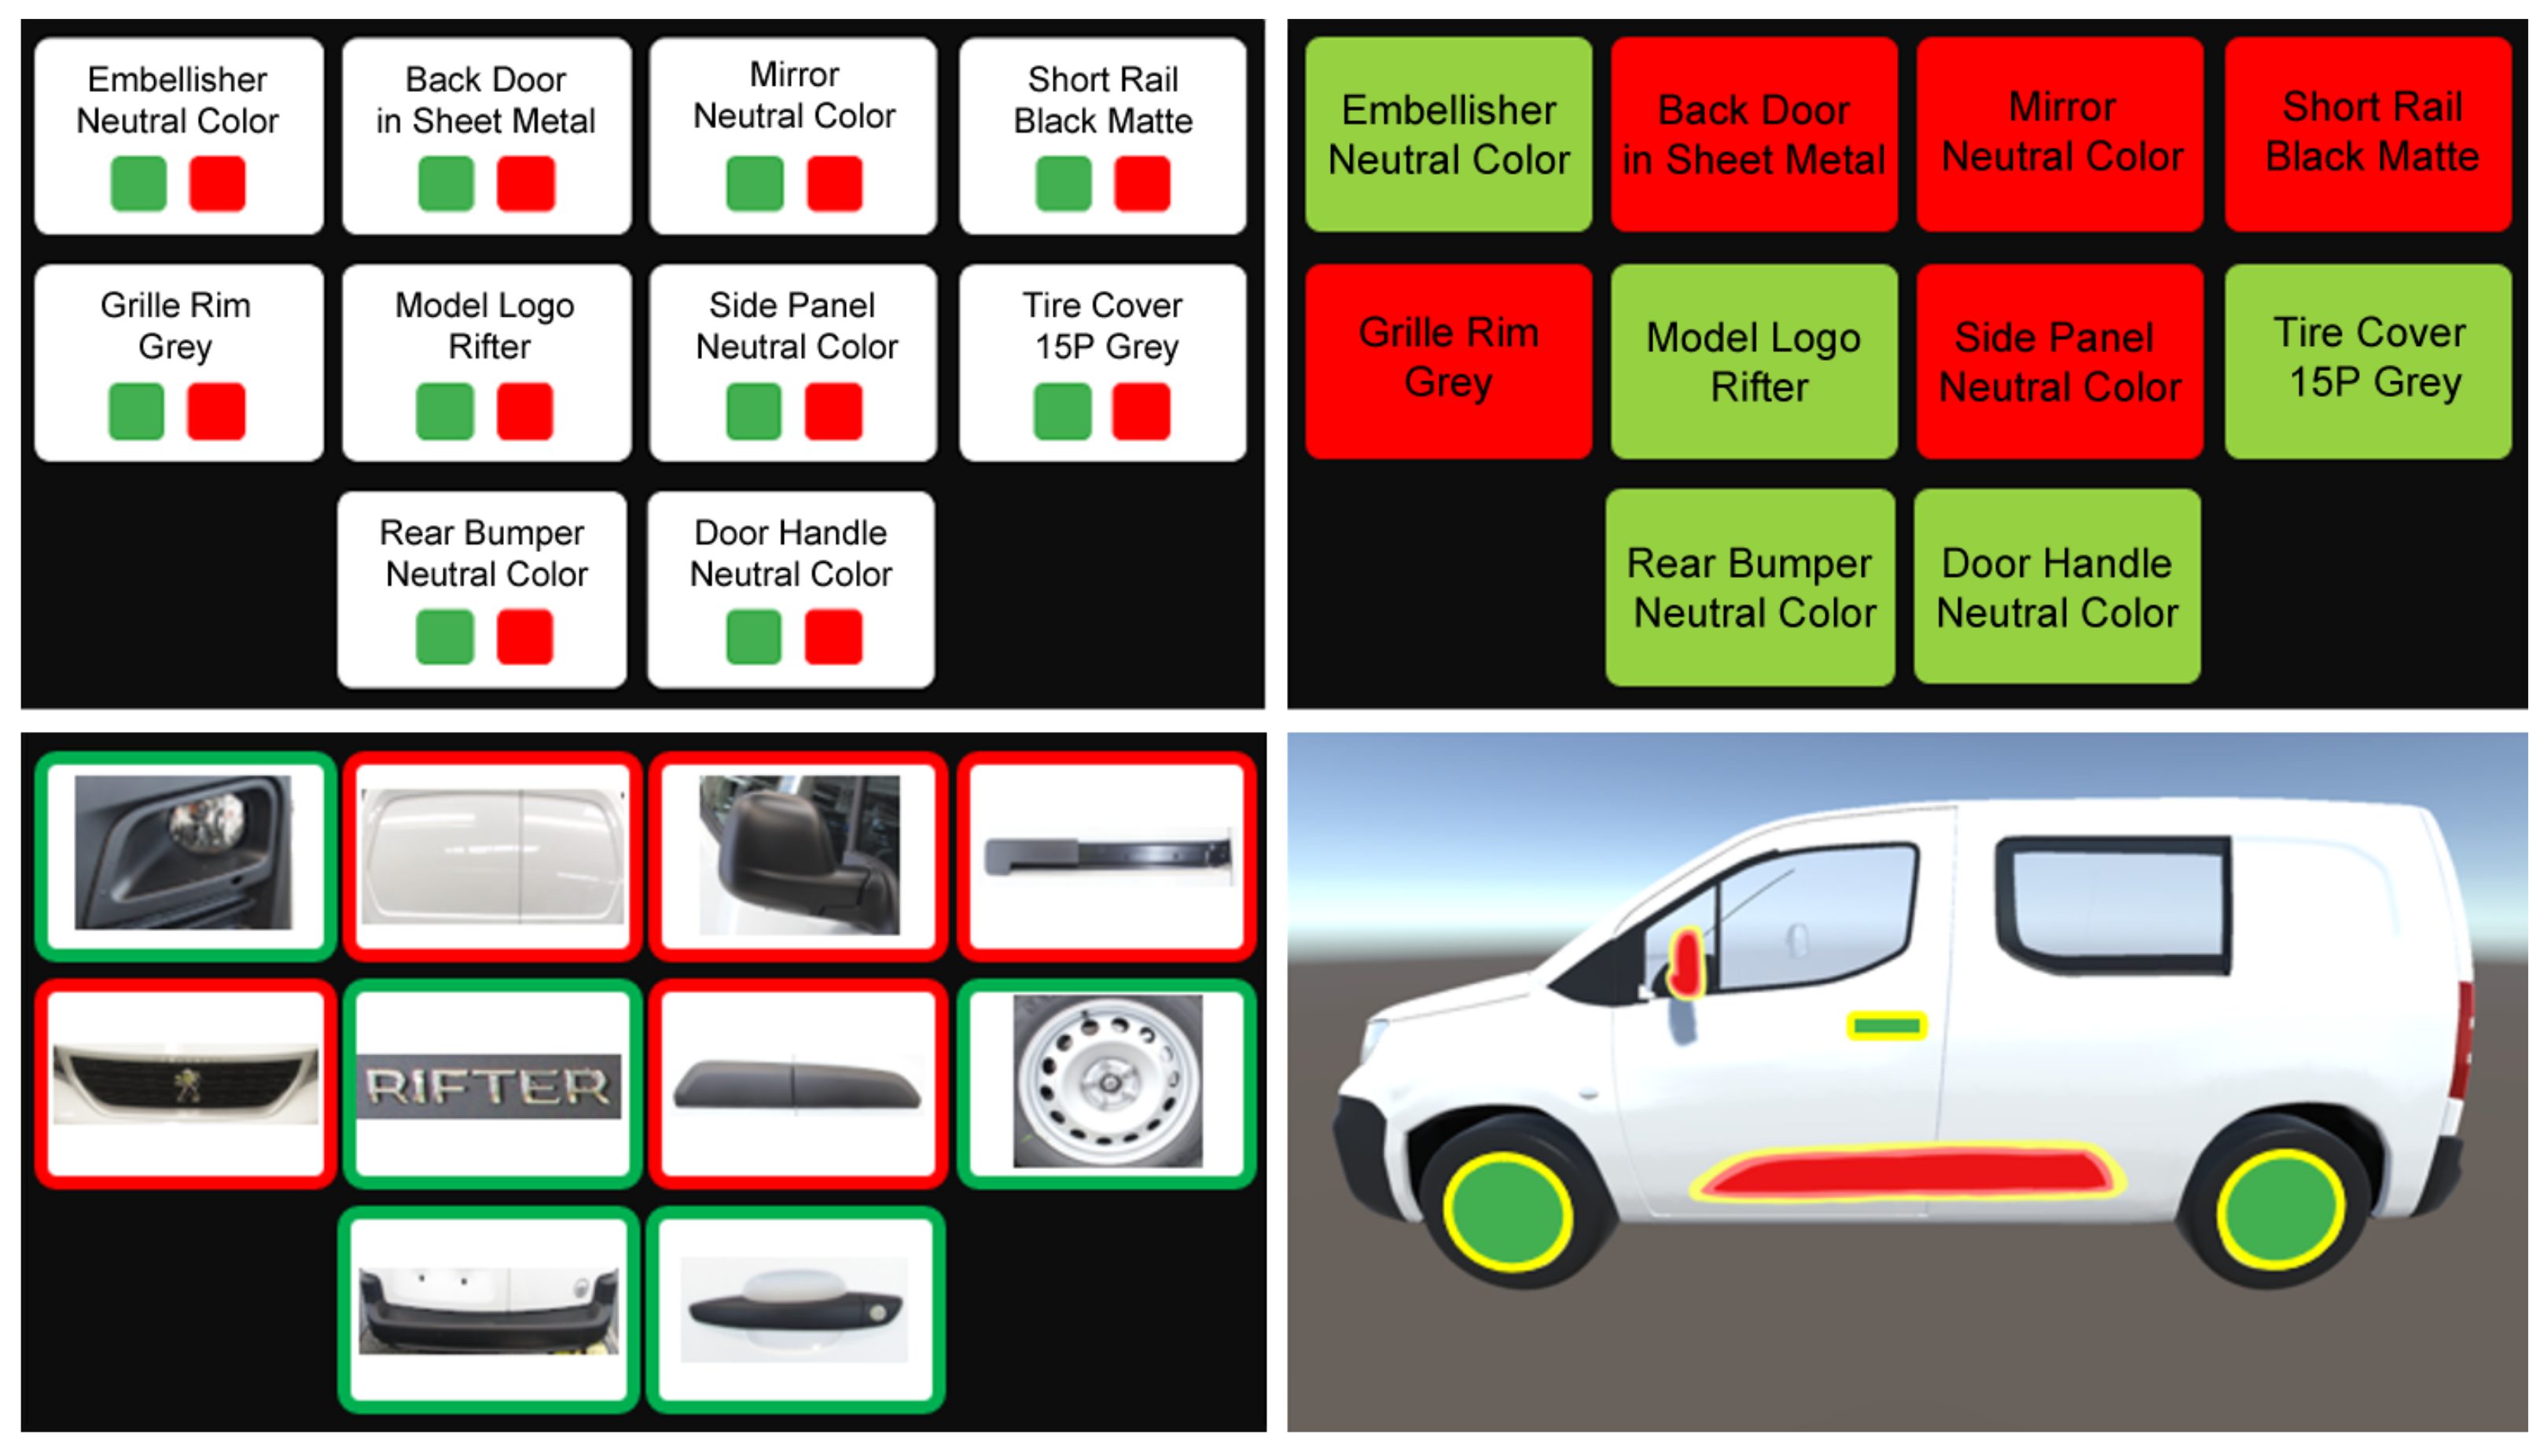
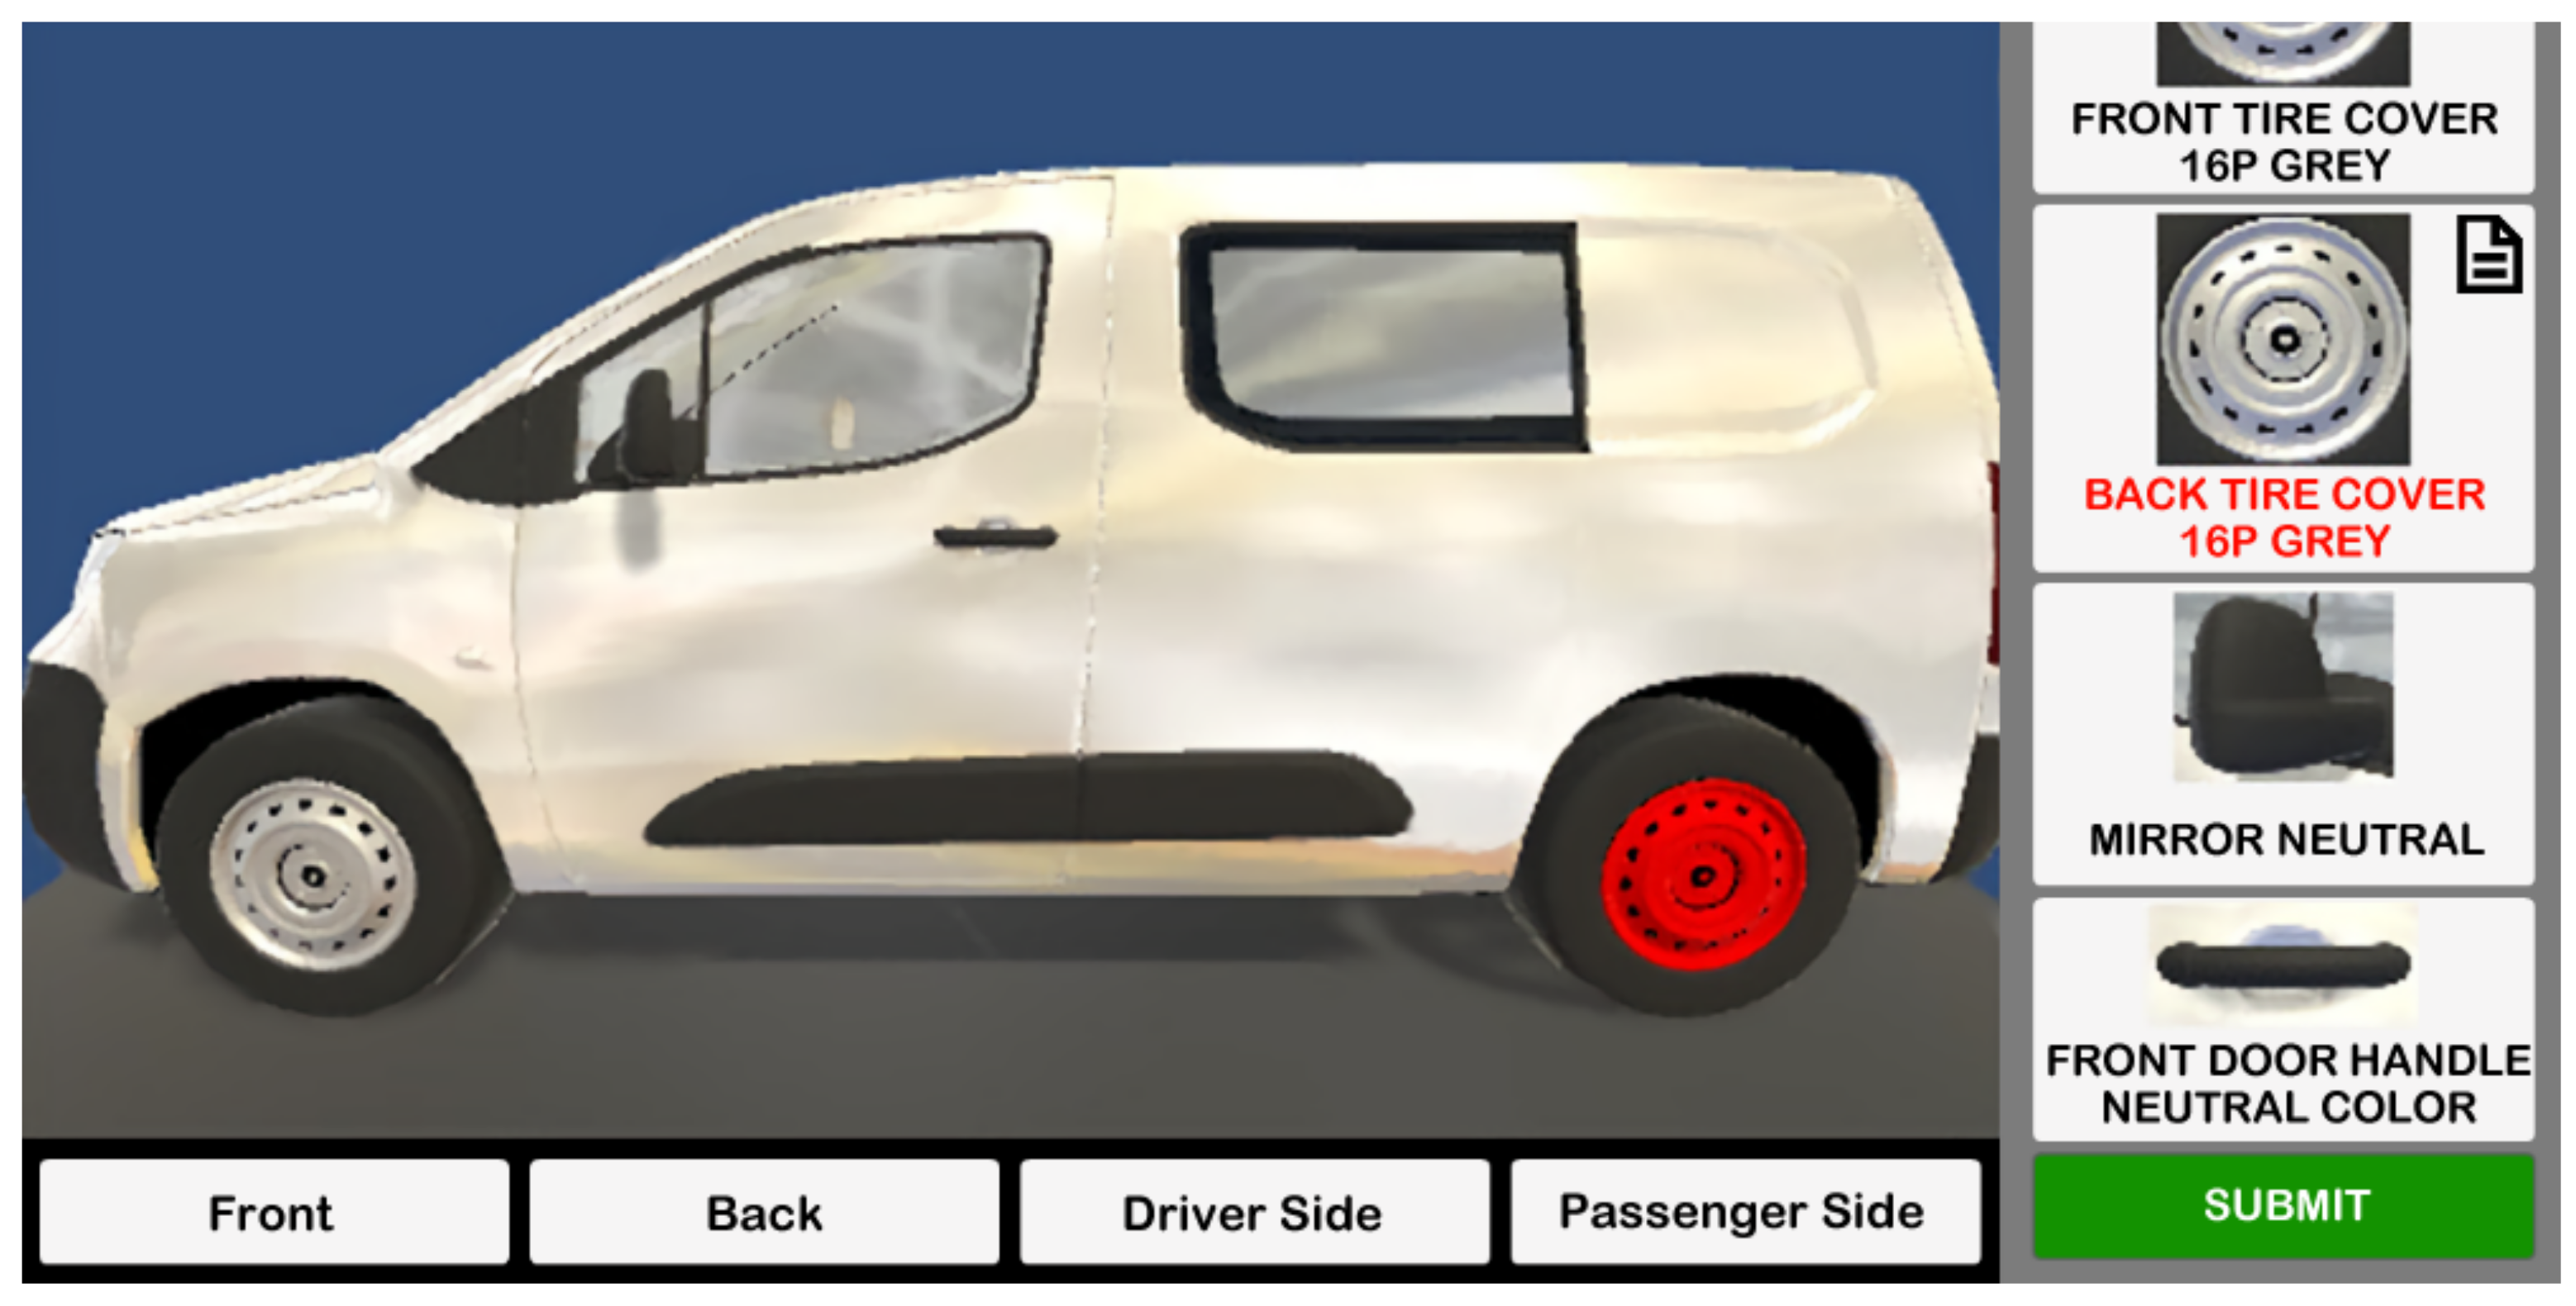
3.4. Information Visualization
- Part buttons with the visual example and name label;
- Part buttons show/hide according to the side of the vehicle being viewed;
- 3D visual representation of the fully conforming vehicle;
- Buttons’ font and 3D parts’ color changes to signal non-conformities;
- Text and photo icons on each part button to signal which individual report was attached to the non-conformity.
- Perceived Useful Scale (6 questions)—how much the individual perceives the use of the software can enhance their work performance;
- Perceived Ease of Use Scale (4 questions)—how much the individual perceives the software to make tasks be easy to perform;
- The Right Data and Right Level of Detail (5 questions)—how well the individual felt the software provided the correct amount of information in the right amount of detail;
- Ease of Software Use (2 questions)—how easy it felt to the individual to learn how to use the software without prior practice;
- Look and Feel (2 questions)—how intuitive and visually appealing the individual found the software to be.
4. Results and Discussion
4.1. Automated Detection
4.2. Information Visualization
- The 3D vehicle representation was considered unnecessary because of their level of expertise no longer requiring a visual aid to know where each part should be located in the vehicle. The label description suffices;
- In the paper version the reporting of a non-conformity requires a lengthy written description of the occurrence, which the support tool partially eliminates just from having each button associated with the respective part;
- In the paper version the photographic and additional written details of the non-conformity are optional, due to the additional hassle of uploading the information in the physical terminal under tight time constraints.
5. Conclusions and Future Research
Author Contributions
Funding
Institutional Review Board Statement
Informed Consent Statement
Data Availability Statement
Acknowledgments
Conflicts of Interest
Abbreviations
| AR | Augmented Reality |
| CAD | Computer Aided Design |
| CBIR | Content-Based Image Retrieval |
| CC | Converted CBIR |
| CNN | Convolutional Neural Network |
| CUT | Contrastive Unpaired Translation |
| DCNN | Deep Convolutional Neural Network |
| DiffAugment | Differentiable Augmentation |
| EMA | Exponential Moving Average |
| FCS | Fixed Camera Setup |
| FID | Fréchet Inception Distance |
| GAN | Generative Adversarial Network |
| HMD | Head-Mounted Display |
| IoU | Intersection over Union |
| k9 | Name of the multi-brand van model |
| kSim9 | Name of the 3D k9 Vehicle Generator |
| mAP | mean Average Precision |
| MCC | Matthews Correlation Coefficient |
| MLP | Multi Layer Perceptron |
| NMS | Non-Maximum Suppression |
| PL | Pseudo Labeling |
| PP | Post Processing |
| PSA | Peugeot Société Anonyme |
| R-CNN | Region Based Convolutional Neural Network |
| SGDM | Stochastic Gradient Descent with Momentum |
| SURF | Speeded Up Robust Features |
| TAM | Technology Acceptance Model (TAM) |
| TIF | Task-Technology Fit Model |
| YOLOv3 | 3rd version of the You Only Look Once algorithm |
Appendix A

| Location | Code | Object Description |
|---|---|---|
| Back | B.Bb | Bumper bar |
| B.Bm | Bumper | |
| B.Hn | Door handle | |
| B.Lg | Brand logo | |
| B.PlLi | Plate lights | |
| B.TLi | Top light | |
| B.Tx | Model logo/text | |
| B.Wn | Window | |
| B.WnHg | Window Hanger | |
| B.Wp | Wiper | |
| BL.SLi/BR.SLi | Side light | |
| Front | F.Bb | Bumper bar |
| F.BGi | Bottom grille | |
| F.Bm | Bumper | |
| F.TGi | Top grille | |
| FL.Em/FR.Em | Fog light embellisher | |
| FL.FLi/FR.FLi | Fog light | |
| FL.MLi/FR.MLi | Middle headlight | |
| FL.TLi/FR.TLi | Top headlight | |
| FT.GiLg | Grille logo | |
| Back Side | SBL.DrCp/SBR.DrCp | Door curved panel |
| SBL.DrSb/SBR.DrSb | Door side bar | |
| SBL.DrWn/SBR.DrWn | Door window | |
| SBL.Hn/SBR.Hn | Door handle | |
| SBL.Rl/SBR.Rl | Rail | |
| SBL.Tr/SBR.Tr | Tire rim | |
| SBL.Wn/SBR.Wn | Window | |
| Front Side | SFL.DrPi/SFR.DrPi | Door pillar |
| SFL.Hn/SFR.Hn | Door handle | |
| SFL.MrBs/SFR.MrBs | Rear view mirror | |
| SFL.Tr/SFR.Tr | Tire rim | |
| SFL.Tx/SFR.Tx | XTR logo | |
| Side | SL.Sp/SR.Sp | Side panel |
| Top | TL.Br/TR.Br | Roof bar |
| Criteria | Questions |
|---|---|
| Perceived Usefulness | The tool helps me do the inspections faster. |
| The tool helps me perform my work in a more systematic way. | |
| The tool allows me to report the non-conformities more quickly. | |
| The tool makes the inspection work easier. | |
| The tool helps me to identify the non-conformities more easily. | |
| I find the tool useful for the tasks performed during the inspection. | |
| Perceived Ease of Use | The use of the tool is easy to understand. |
| The use of the tool is flexible. | |
| It’s easy to perform the inspection tasks using the tool. | |
| The tool is easy to use. | |
| Right Data and Level of Detail | The information presented by the tool is the one I need to perform the inspections. |
| It’s more difficult for me to perform the inspections using the tool because the necessary information is lacking. | |
| The tool provides enough textual and visual information. | |
| In the case of non-conformities, the tool allows the recording of the necessary details. | |
| The tool allows me to read the information and to visualize the parts simply and quickly. | |
| Ease of Software Use | It’s easy to learn how to use the tool. |
| The inspection support tool is adequate and easy. | |
| Look and Feel | Using the tool is intuitive. |
| I like the look of the tool. | |
| Open Questions | What’s your general impression of the tool? |
| Are there any positive aspects that you want to highlight about the tool? | |
| Are there any negative aspects that you want to highlight about the tool? | |
| Would you like to use a tool like this to support you in the inspection tasks you perform? |
References
- Gewohn, M.; Beyerer, J.; Usländer, T.; Sutschet, G. Smart Information Visualization for First-Time Quality within the Automobile Production Assembly Line. IFAC-PapersOnLine 2018, 51, 423–428. [Google Scholar] [CrossRef]
- Kluge, A.; Termer, A. Human-centered design (HCD) of a fault-finding application for mobile devices and its impact on the reduction of time in fault diagnosis in the manufacturing industry. Appl. Ergon. 2017, 59, 170–181. [Google Scholar] [CrossRef] [PubMed]
- Pfeiffer, S. Robots, Industry 4.0 and humans, or why assembly work is more than routine work. Societies 2016, 6, 16. [Google Scholar] [CrossRef]
- Piero, N.; Schmitt, M. Virtual commissioning of camera-based quality assurance systems for mixed model assembly lines. Procedia Manuf. 2017, 11, 914–921. [Google Scholar] [CrossRef]
- Gewohn, M.; Beyerer, J.; Usländer, T.; Sutschet, G. A quality visualization model for the evaluation and control of quality in vehicle assembly. In Proceedings of the 2018 7th International Conference on Industrial Technology and Management (ICITM), Oxford, UK, 7–9 March 2018; pp. 1–10. [Google Scholar] [CrossRef]
- Lasi, H.; Fettke, P.; Kemper, H.G.; Feld, T.; Hoffmann, M. Industry 4.0. Bus. Inf. Syst. Eng. 2014, 6, 239–242. [Google Scholar] [CrossRef]
- Zhu, J.Y.; Park, T.; Isola, P.; Efros, A.A. Unpaired Image-to-Image Translation using Cycle-Consistent Adversarial Networks. In Proceedings of the 2017 IEEE International Conference on Computer Vision (ICCV), Venice, Italy, 22–29 October 2017. [Google Scholar]
- Park, T.; Efros, A.A.; Zhang, R.; Zhu, J.Y. Contrastive Learning for Unpaired Image-to-Image Translation. In Proceedings of the European Conference on Computer Vision, Virtual, 23–28 August 2020. [Google Scholar]
- Liu, Y.C.; Ma, C.Y.; He, Z.; Kuo, C.W.; Chen, K.; Zhang, P.; Wu, B.; Kira, Z.; Vajda, P. Unbiased Teacher for Semi-Supervised Object Detection. In Proceedings of the International Conference on Learning Representations (ICLR), Virtual, 3–7 May 2021. [Google Scholar]
- Rio-Torto, I.; Campaniço, A.T.; Pereira, A.; Teixeira, L.F.; Filipe, V. Automatic quality inspection in the automotive industry: A hierarchical approach using simulated data. In Proceedings of the 2021 IEEE 8th International Conference on Industrial Engineering and Applications (ICIEA), Virtual, 23–26 April 2021; pp. 342–347. [Google Scholar] [CrossRef]
- Luckow, A.; Cook, M.; Ashcraft, N.; Weill, E.; Djerekarov, E.; Vorster, B. Deep learning in the automotive industry: Applications and tools. In Proceedings of the 2016 IEEE International Conference on Big Data (Big Data), Washington, DC, USA, 5–8 December 2016; pp. 3759–3768. [Google Scholar] [CrossRef] [Green Version]
- Chauhan, V.; Surgenor, B. Fault detection and classification in automated assembly machines using machine vision. Int. J. Adv. Manuf. Technol. 2017, 90, 2491–2512. [Google Scholar] [CrossRef] [Green Version]
- Sun, S.; Huang, J.; Zhu, J.; Yu, Y.; Zheng, L. Research on Both the Classification and Quality Control Methods of the Car Seat Backrest Based on Machine Vision. Wirel. Commun. Mob. Comput. 2022, 2022, 3106313. [Google Scholar] [CrossRef]
- Kuric, I.; Klarák, J.; Bulej, V.; Sága, M.; Kandera, M.; Hajdučík, A.; Tucki, K. Approach to Automated Visual Inspection of Objects Based on Artificial Intelligence. Appl. Sci. 2022, 12, 864. [Google Scholar] [CrossRef]
- Pei, Z.; Chen, L. Welding component identification and solder joint inspection of automobile door panel based on machine vision. In Proceedings of the 2018 Chinese Control and Decision Conference (CCDC), Shenyang, China, 9–11 June 2018; pp. 6558–6563. [Google Scholar]
- Zhou, Q.; Chen, R.; Huang, B.; Liu, C.; Yu, J.; Yu, X. An automatic surface defect inspection system for automobiles using machine vision methods. Sensors 2019, 19, 644. [Google Scholar] [CrossRef] [Green Version]
- Chang, F.; Liu, M.; Dong, M.; Duan, Y. A mobile vision inspection system for tiny defect detection on smooth car-body surfaces based on deep ensemble learning. Meas. Sci. Technol. 2019, 30, 125905. [Google Scholar] [CrossRef]
- Sun, X.; Gu, J.; Huang, R.; Zou, R.; Giron Palomares, B. Surface defects recognition of wheel hub based on improved faster R-CNN. Electronics 2019, 8, 481. [Google Scholar] [CrossRef] [Green Version]
- Halim, A.A. Applications of augmented reality for inspection and maintenance process in automotive industry. J. Fundam. Appl. Sci. 2018, 10, 412–421. [Google Scholar]
- Chouchene, A.; Ventura Carvalho, A.; Charrua-Santos, F.; Barhoumi, W. Augmented Reality-Based Framework Supporting Visual Inspection for Automotive Industry. Appl. Syst. Innov. 2022, 5, 48. [Google Scholar] [CrossRef]
- Lima, J.P.; Roberto, R.; Sim oes, F.; Almeida, M.; Figueiredo, L.; Teixeira, J.M.; Teichrieb, V. Markerless tracking system for augmented reality in the automotive industry. Expert Syst. Appl. 2017, 82, 100–114. [Google Scholar] [CrossRef]
- Ford. 2016. Available online: https://media.ford.com/content/fordmedia/fna/us/en/news/2016/02/10/innovative-smartphone-app-saves-ford-factory-workers.html (accessed on 14 December 2021).
- Rega, A.; Di Marino, C.; Pasquariello, A.; Vitolo, F.; Patalano, S.; Zanella, A.; Lanzotti, A. Collaborative Workplace Design: A Knowledge-Based Approach to Promote Human–Robot Collaboration and Multi-Objective Layout Optimization. Appl. Sci. 2021, 11, 2147. [Google Scholar] [CrossRef]
- Borisov, N.; Weyers, B.; Kluge, A. Designing a human machine interface for quality assurance in car manufacturing: An attempt to address the “functionality versus user experience contradiction” in professional production environments. Adv. Hum.-Comput. Interact. 2018, 2018, 9502692. [Google Scholar] [CrossRef]
- Khamaisi, R.K.; Prati, E.; Peruzzini, M.; Raffaeli, R.; Pellicciari, M. UX in AR-Supported Industrial Human–Robot Collaborative Tasks: A Systematic Review. Appl. Sci. 2021, 11, 448. [Google Scholar] [CrossRef]
- Capela, S.; Silva, R.; Khanal, S.R.; Campaniço, A.T.; Barroso, J.; Filipe, V. Engine Labels Detection for Vehicle Quality Verification in the Assembly Line: A Machine Vision Approach. In CONTROLO 2020. Lecture Notes in Electrical Engineering; Gonçalves, J.A., Braz-César, M., Coelho, J.P., Eds.; Springer International Publishing: Cham, Switzerland, 2021; Volume 695, pp. 740–751. [Google Scholar] [CrossRef]
- Khanal, S.R.; Amorim, E.V.; Filipe, V. Classification of Car Parts Using Deep Neural Network. In CONTROLO 2020. Lecture Notes in Electrical Engineering; Gonçalves, J.A., Braz-César, M., Coelho, J.P., Eds.; Springer International Publishing: Cham, Switzerland, 2021; Volume 695, pp. 582–591. [Google Scholar] [CrossRef]
- Mete, S.; Çil, Z.A.; Özceylan, E.; Ağpak, K.; Battaïa, O. An optimisation support for the design of hybrid production lines including assembly and disassembly tasks. Int. J. Prod. Res. 2018, 56, 7375–7389. [Google Scholar] [CrossRef]
- Campaniço, A.T.; Khanal, S.; Paredes, H.; Filipe, V. Worker Support and Training Tools to Aid in Vehicle Quality Inspection for the Automotive Industry. In Technology and Innovation in Learning, Teaching and Education. TECH-EDU 2020; Reis, A., Barroso, J., Lopes, J.B., Mikropoulos, T., Fan, C.W., Eds.; Springer International Publishing: Cham, Switzerland, 2021; pp. 432–441. [Google Scholar] [CrossRef]
- Pinho, P.; Rio-Torto, I.; Teixeira, L.F. Improving Automatic Quality Inspection in the Automotive Industry by Combining Simulated and Real Data. Advances in Visual Computing. In ISVC 2021. Lecture Notes in Computer Science; Bebis, G., Athitsos, V., Yan, T., Lau, M., Li, F., Shi, C., Yuan, X., Mousas, C., Bruder, G., Eds.; Springer International Publishing: Cham, Switzerland, 2021; pp. 278–290. [Google Scholar] [CrossRef]
- Nikolenko, S.I. Introduction: The Data Problem. In Synthetic Data for Deep Learning; Springer International Publishing: Cham, Switzerland, 2021; pp. 1–17. [Google Scholar] [CrossRef]
- Oza, P.; Sindagi, V.A.; VS, V.; Patel, V.M. Unsupervised domain adaptation of object detectors: A survey. arXiv 2021, arXiv:2105.13502. [Google Scholar]
- Zhang, D.; Li, J.; Xiong, L.; Lin, L.; Ye, M.; Yang, S. Cycle-Consistent Domain Adaptive Faster RCNN. IEEE Access 2019, 7, 123903–123911. [Google Scholar] [CrossRef]
- Hsu, H.K.; Yao, C.H.; Tsai, Y.H.; Hung, W.C.; Tseng, H.Y.; Singh, M.; Yang, M.H. Progressive Domain Adaptation for Object Detection. In Proceedings of the 2020 IEEE Winter Conference on Applications of Computer Vision (WACV), Snowmass Village, CO, USA, 1–5 March 2020; pp. 738–746. [Google Scholar] [CrossRef]
- MacKay, C.T.; Moh, T.S. Learning for Free: Object Detectors Trained on Synthetic Data. In Proceedings of the 2021 15th International Conference on Ubiquitous Information Management and Communication (IMCOM), Seoul, Korea, 4–6 January 2021; pp. 1–8. [Google Scholar] [CrossRef]
- RoyChowdhury, A.; Chakrabarty, P.; Singh, A.; Jin, S.; Jiang, H.; Cao, L.; Learned-Miller, E. Automatic adaptation of object detectors to new domains using self-training. In Proceedings of the IEEE/CVF Conference on Computer Vision and Pattern Recognition, Long Beach, CA, USA, 16–20 June 2019; pp. 780–790. [Google Scholar]
- Inoue, N.; Furuta, R.; Yamasaki, T.; Aizawa, K. Cross-domain weakly-supervised object detection through progressive domain adaptation. In Proceedings of the IEEE Conference on Computer Vision and Pattern Recognition, Salt Lake City, UT, USA, 18–22 June 2018; pp. 5001–5009. [Google Scholar]
- Deng, J.; Li, W.; Chen, Y.; Duan, L. Unbiased mean teacher for cross-domain object detection. In Proceedings of the IEEE/CVF Conference on Computer Vision and Pattern Recognition, Nashville, TN, USA, 20–25 June 2021; pp. 4091–4101. [Google Scholar]
- Wu, Y.; Kirillov, A.; Massa, F.; Lo, W.Y.; Girshick, R. Detectron2. 2019. Available online: https://github.com/facebookresearch/detectron2 (accessed on 23 November 2021).
- Xie, S.; Girshick, R.; Dollár, P.; Tu, Z.; He, K. Aggregated Residual Transformations for Deep Neural Networks. arXiv 2016, arXiv:1611.05431. [Google Scholar]
- Zhao, S.; Liu, Z.; Lin, J.; Zhu, J.Y.; Han, S. Differentiable Augmentation for Data-Efficient GAN Training. In Proceedings of the Conference on Neural Information Processing Systems (NeurIPS), Online, 6–12 December 2020. [Google Scholar]
- Paszke, A.; Gross, S.; Massa, F.; Lerer, A.; Bradbury, J.; Chanan, G.; Killeen, T.; Lin, Z.; Gimelshein, N.; Antiga, L.; et al. PyTorch: An Imperative Style, High-Performance Deep Learning Library. In Advances in Neural Information Processing Systems 32; Wallach, H., Larochelle, H., Beygelzimer, A., d’Alché-Buc, F., Fox, E., Garnett, R., Eds.; Curran Associates, Inc.: Red Hook, NY, USA, 2019; pp. 8024–8035. [Google Scholar]
- ZXing. 2021. Available online: https://github.com/zxing/zxing (accessed on 15 November 2021).
- Heusel, M.; Ramsauer, H.; Unterthiner, T.; Nessler, B.; Hochreiter, S. GANs Trained by a Two Time-Scale Update Rule Converge to a Local Nash Equilibrium. In Proceedings of the 31st International Conference on Neural Information Processing Systems, Long Beach, CA, USA, 4–9 December 2017; Curran Associates Inc.: Red Hook, NY, USA, 2017. NIPS’17. pp. 6629–6640. [Google Scholar]


| Location | Front | Back | Sides | Top |
|---|---|---|---|---|
| Components | Fog lights Fog light embellishers Grille rim Bumper bar | Top light Window Window hinges Wiper Door handle Side lights Brand logo Model logo Bumper Bumper bar | Side panel Front door pillar Mirror XTR logo Door handles Back door Back door window Window panel Rear window Rail Tire covers | Roof bars |
| Training | Data | Detection | ||
|---|---|---|---|---|
| mAP | AP@50 | AP@75 | ||
| From scratch | simulated | 82.13 | 93.99 | 90.38 |
| CycleGAN | 69.23 | 83.91 | 78.66 | |
| CUT | 42.89 | 58.43 | 49.15 | |
| Fine-tuning w/CycleGAN | simulated | 77.41 | 90.80 | 86.71 |
| CycleGAN | 80.53 | 93.08 | 89.53 | |
| Fine-tuning w/CUT | simulated | 75.25 | 89.45 | 84.43 |
| CUT | 77.26 | 92.15 | 86.76 | |
| FID w/ CycleGAN | FID w/ CUT | |
|---|---|---|
| Simulated vs. Adapted | 35.40 | 58.17 |
| Real vs. Adapted | 60.04 | 56.87 |
| Method | Label-Based | Example-Based | ||||||||||||||
|---|---|---|---|---|---|---|---|---|---|---|---|---|---|---|---|---|
| Acc. | Prec. | Rec. | F1 | MCC | Acc. | Prec. | Rec. | Hamm. (↓) | F1 | F1 improv. % | F1 improv. pp | |||||
| Detectron2 Macro Categories | ||||||||||||||||
| Baseline [10] | 0.656 | 0.462 | 0.647 | 0.419 | 0.449 | 0.394 | 0.530 | 0.198 | 0.284 | 0.357 | 0.647 | 0.446 | 0.344 | 0.528 | - | - |
| CycleGAN [30] | 0.652 | 0.491 | 0.594 | 0.550 | 0.616 | 0.455 | 0.605 | 0.166 | 0.294 | 0.435 | 0.600 | 0.617 | 0.348 | 0.609 | 15.34 | 8.10 |
| New Baseline | 0.642 | 0.800 | 0.954 | 0.535 | 0.581 | 0.599 | 0.722 | 0.093 | 0.372 | 0.576 | 0.958 | 0.596 | 0.358 | 0.735 | - | - |
| CycleGAN | 0.692 | 0.730 | 0.965 | 0.585 | 0.640 | 0.623 | 0.769 | 0.107 | 0.435 | 0.635 | 0.964 | 0.653 | 0.308 | 0.778 | 5.850 | 4.30 |
| CUT | 0.753 | 0.898 | 0.951 | 0.683 | 0.729 | 0.734 | 0.826 | 0.134 | 0.473 | 0.706 | 0.950 | 0.738 | 0.247 | 0.830 | 12.93 | 9.50 |
| CUT + PL | 0.794 | 0.870 | 0.914 | 0.812 | 0.821 | 0.808 | 0.865 | 0.173 | 0.450 | 0.759 | 0.911 | 0.824 | 0.206 | 0.865 | 17.69 | 13.0 |
| CUT + PL + FCS | 0.857 | 0.874 | 0.923 | 0.889 | 0.896 | 0.868 | 0.909 | 0.218 | 0.569 | 0.830 | 0.919 | 0.899 | 0.143 | 0.909 | 23.70 | 17.4 |
| CBIR Final Codes | ||||||||||||||||
| Baseline [10] | 0.709 | 0.295 | 0.438 | 0.322 | 0.359 | 0.264 | 0.395 | 0.154 | 0.207 | 0.244 | 0.426 | 0.356 | 0.291 | 0.388 | - | - |
| CycleGAN [30] | 0.671 | 0.284 | 0.401 | 0.428 | 0.498 | 0.293 | 0.444 | 0.140 | 0.217 | 0.289 | 0.403 | 0.497 | 0.329 | 0.445 | 14.70 | 5.70 |
| New Baseline | 0.709 | 0.326 | 0.484 | 0.372 | 0.421 | 0.305 | 0.450 | 0.185 | 0.255 | 0.295 | 0.478 | 0.435 | 0.291 | 0.455 | - | - |
| CycleGAN | 0.703 | 0.305 | 0.476 | 0.400 | 0.468 | 0.311 | 0.472 | 0.176 | 0.266 | 0.326 | 0.479 | 0.487 | 0.297 | 0.483 | 6.150 | 2.80 |
| CUT | 0.707 | 0.394 | 0.484 | 0.458 | 0.529 | 0.371 | 0.506 | 0.224 | 0.298 | 0.347 | 0.484 | 0.545 | 0.293 | 0.513 | 12.75 | 5.80 |
| CUT + PL | 0.692 | 0.360 | 0.468 | 0.536 | 0.645 | 0.395 | 0.543 | 0.220 | 0.328 | 0.374 | 0.469 | 0.651 | 0.308 | 0.545 | 19.78 | 9.00 |
| CUT + PL + CC | 0.713 | 0.403 | 0.495 | 0.528 | 0.635 | 0.412 | 0.556 | 0.264 | 0.355 | 0.398 | 0.503 | 0.646 | 0.287 | 0.565 | 24.18 | 11.0 |
| CUT + PL + CC + FCS | 0.721 | 0.424 | 0.506 | 0.565 | 0.680 | 0.445 | 0.580 | 0.291 | 0.388 | 0.423 | 0.513 | 0.691 | 0.279 | 0.589 | 29.45 | 13.4 |
| CUT + PL + CC + FCS + PP | 0.773 | 0.440 | 0.603 | 0.482 | 0.586 | 0.425 | 0.594 | 0.326 | 0.437 | 0.440 | 0.605 | 0.598 | 0.227 | 0.601 | 32.09 | 14.6 |
| Criteria | Inspector 1 | Inspector 2 |
|---|---|---|
| Perceived Usefulness | 4.83 ± 0.37 | 4.50 ± 0.50 |
| Perceived Ease of Use | 4.50 ± 0.00 | 4.00 ± 0.00 |
| Right Data and Level of Detail | 5.00 ± 0.00 | 4.00 ± 0.00 |
| Ease of Software Use | 5.00 ± 0.00 | 4.50 ± 0.50 |
| Look and Feel | 5.00 ± 0.00 | 3.50 ± 0.50 |
Publisher’s Note: MDPI stays neutral with regard to jurisdictional claims in published maps and institutional affiliations. |
© 2022 by the authors. Licensee MDPI, Basel, Switzerland. This article is an open access article distributed under the terms and conditions of the Creative Commons Attribution (CC BY) license (https://creativecommons.org/licenses/by/4.0/).
Share and Cite
Rio-Torto, I.; Campaniço, A.T.; Pinho, P.; Filipe, V.; Teixeira, L.F. Hybrid Quality Inspection for the Automotive Industry: Replacing the Paper-Based Conformity List through Semi-Supervised Object Detection and Simulated Data. Appl. Sci. 2022, 12, 5687. https://doi.org/10.3390/app12115687
Rio-Torto I, Campaniço AT, Pinho P, Filipe V, Teixeira LF. Hybrid Quality Inspection for the Automotive Industry: Replacing the Paper-Based Conformity List through Semi-Supervised Object Detection and Simulated Data. Applied Sciences. 2022; 12(11):5687. https://doi.org/10.3390/app12115687
Chicago/Turabian StyleRio-Torto, Isabel, Ana Teresa Campaniço, Pedro Pinho, Vitor Filipe, and Luís F. Teixeira. 2022. "Hybrid Quality Inspection for the Automotive Industry: Replacing the Paper-Based Conformity List through Semi-Supervised Object Detection and Simulated Data" Applied Sciences 12, no. 11: 5687. https://doi.org/10.3390/app12115687
APA StyleRio-Torto, I., Campaniço, A. T., Pinho, P., Filipe, V., & Teixeira, L. F. (2022). Hybrid Quality Inspection for the Automotive Industry: Replacing the Paper-Based Conformity List through Semi-Supervised Object Detection and Simulated Data. Applied Sciences, 12(11), 5687. https://doi.org/10.3390/app12115687