
Visual Management and Gamification: An Innovation for Disseminating Information about Production to Construction Professionals


Abstract
:1. Introduction
2. Materials and Methods
3. Results and Discussion
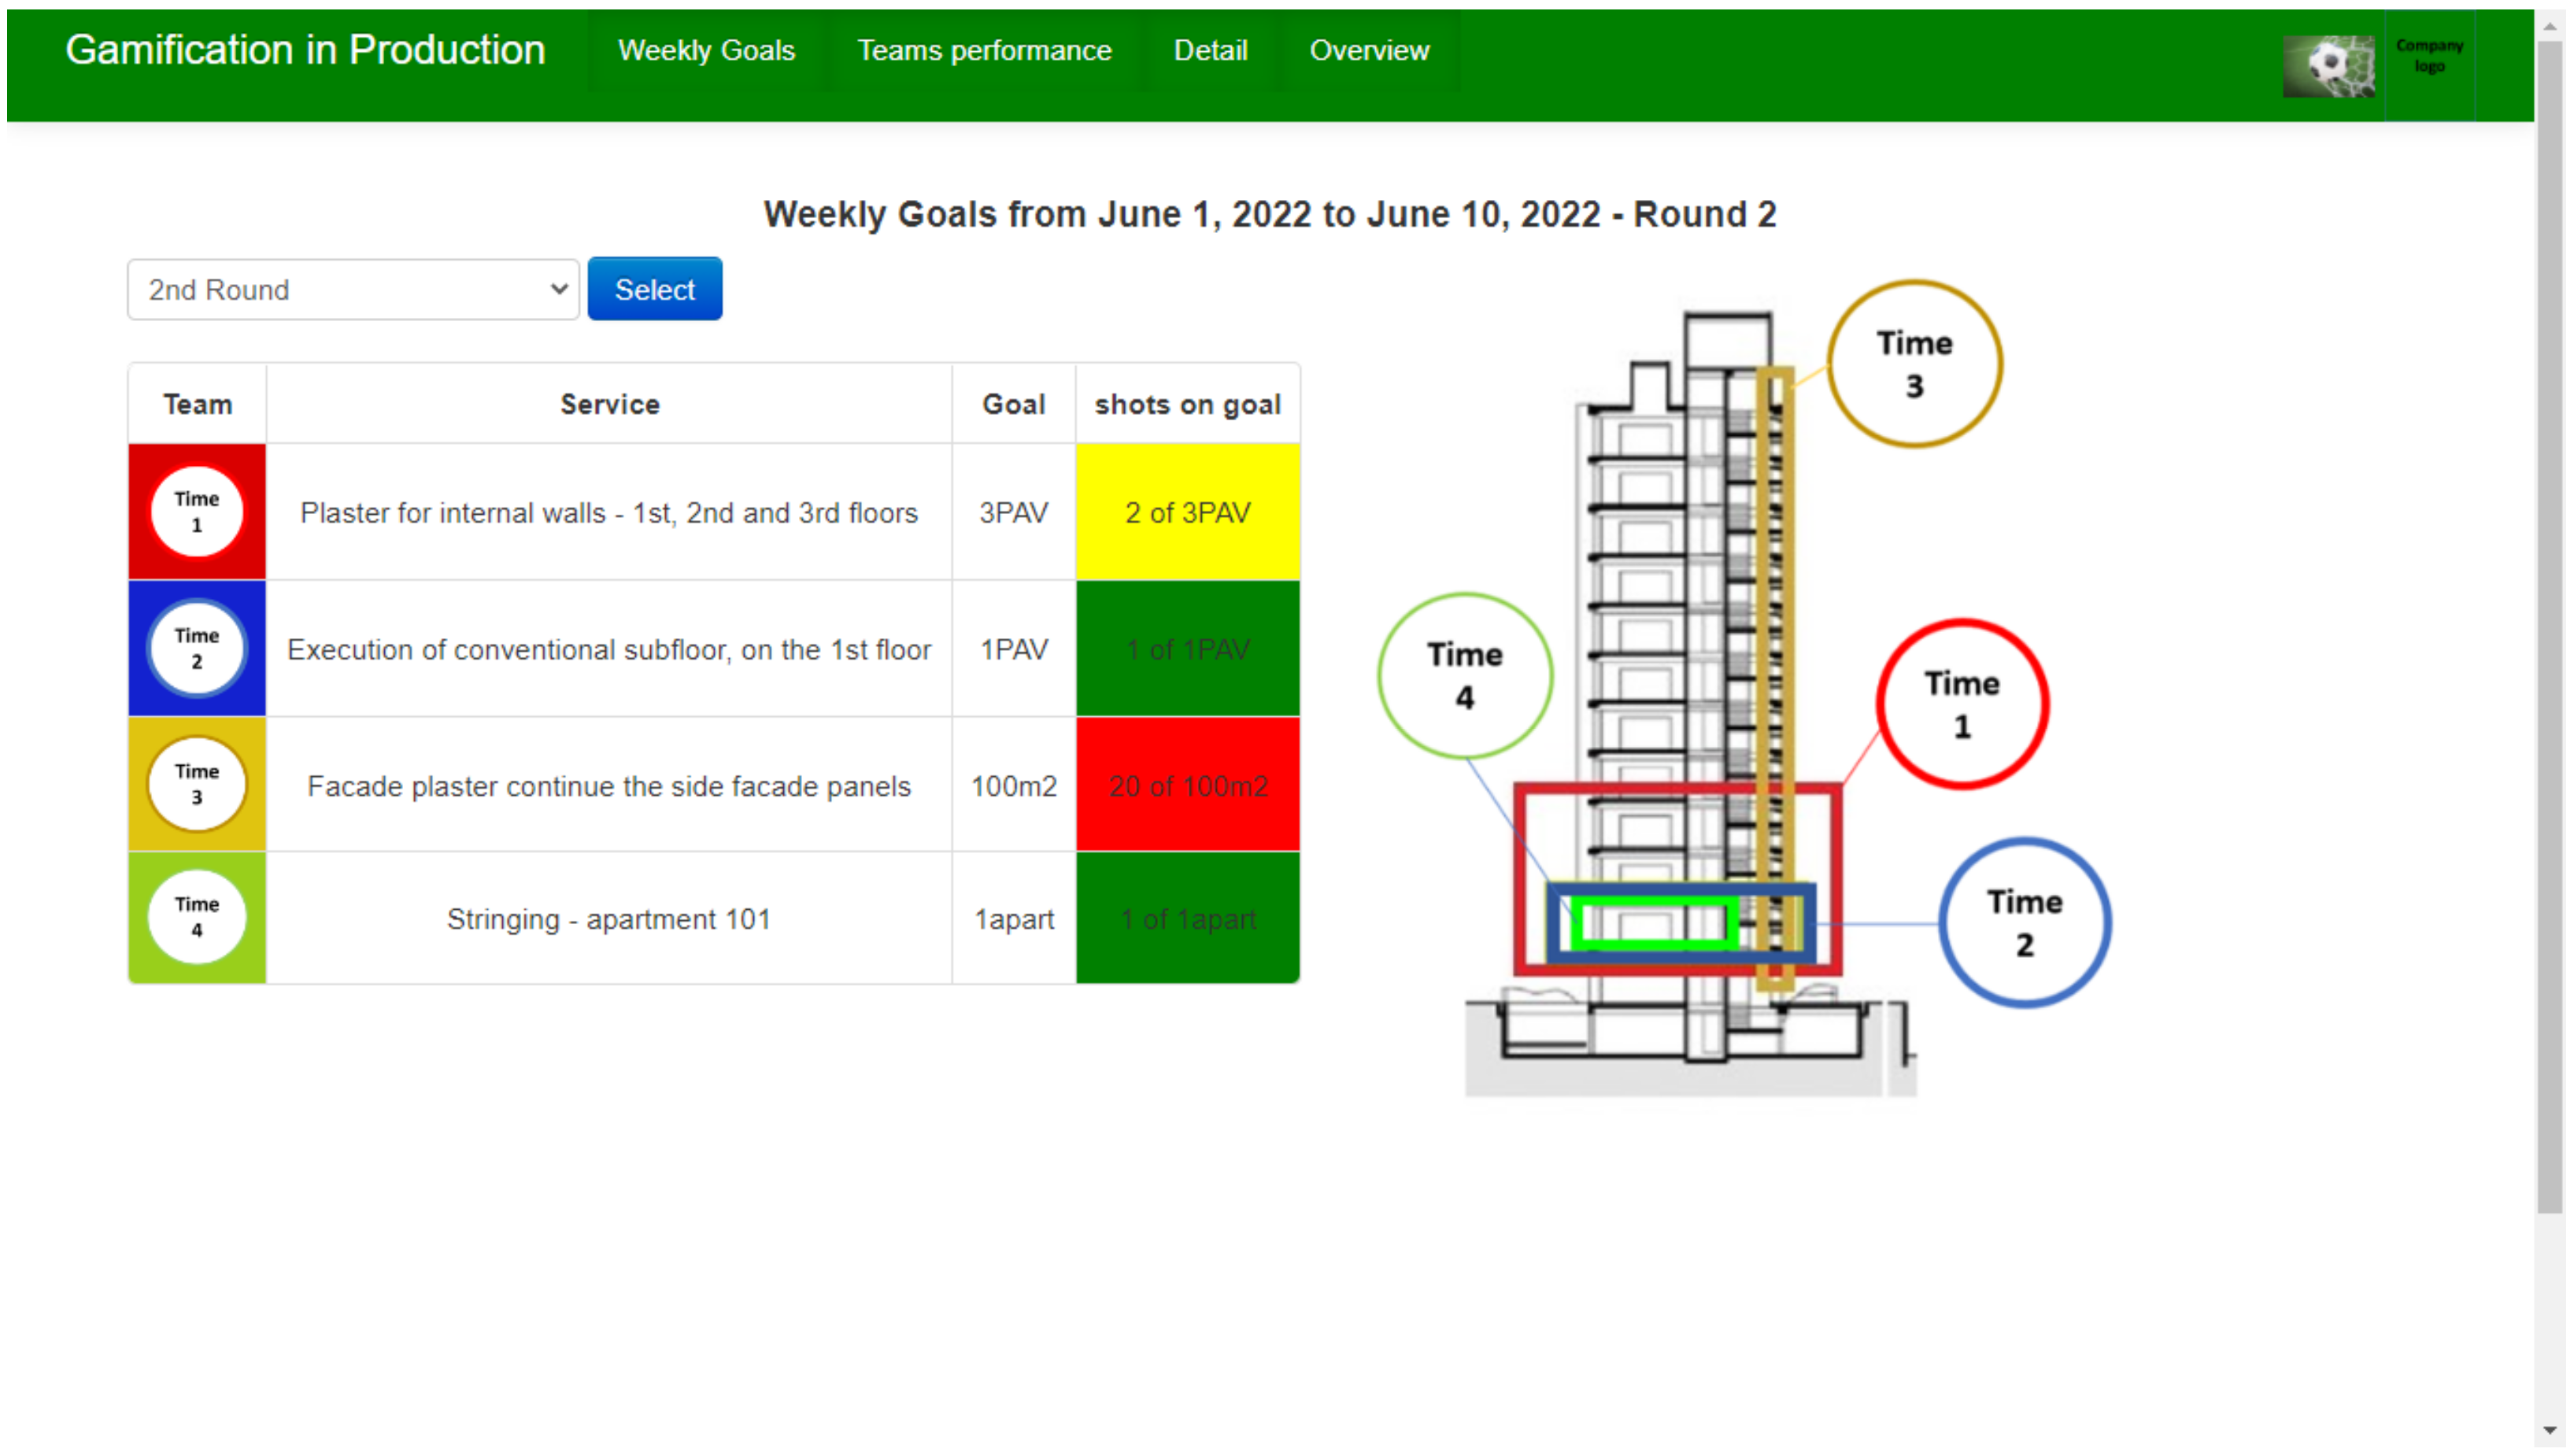
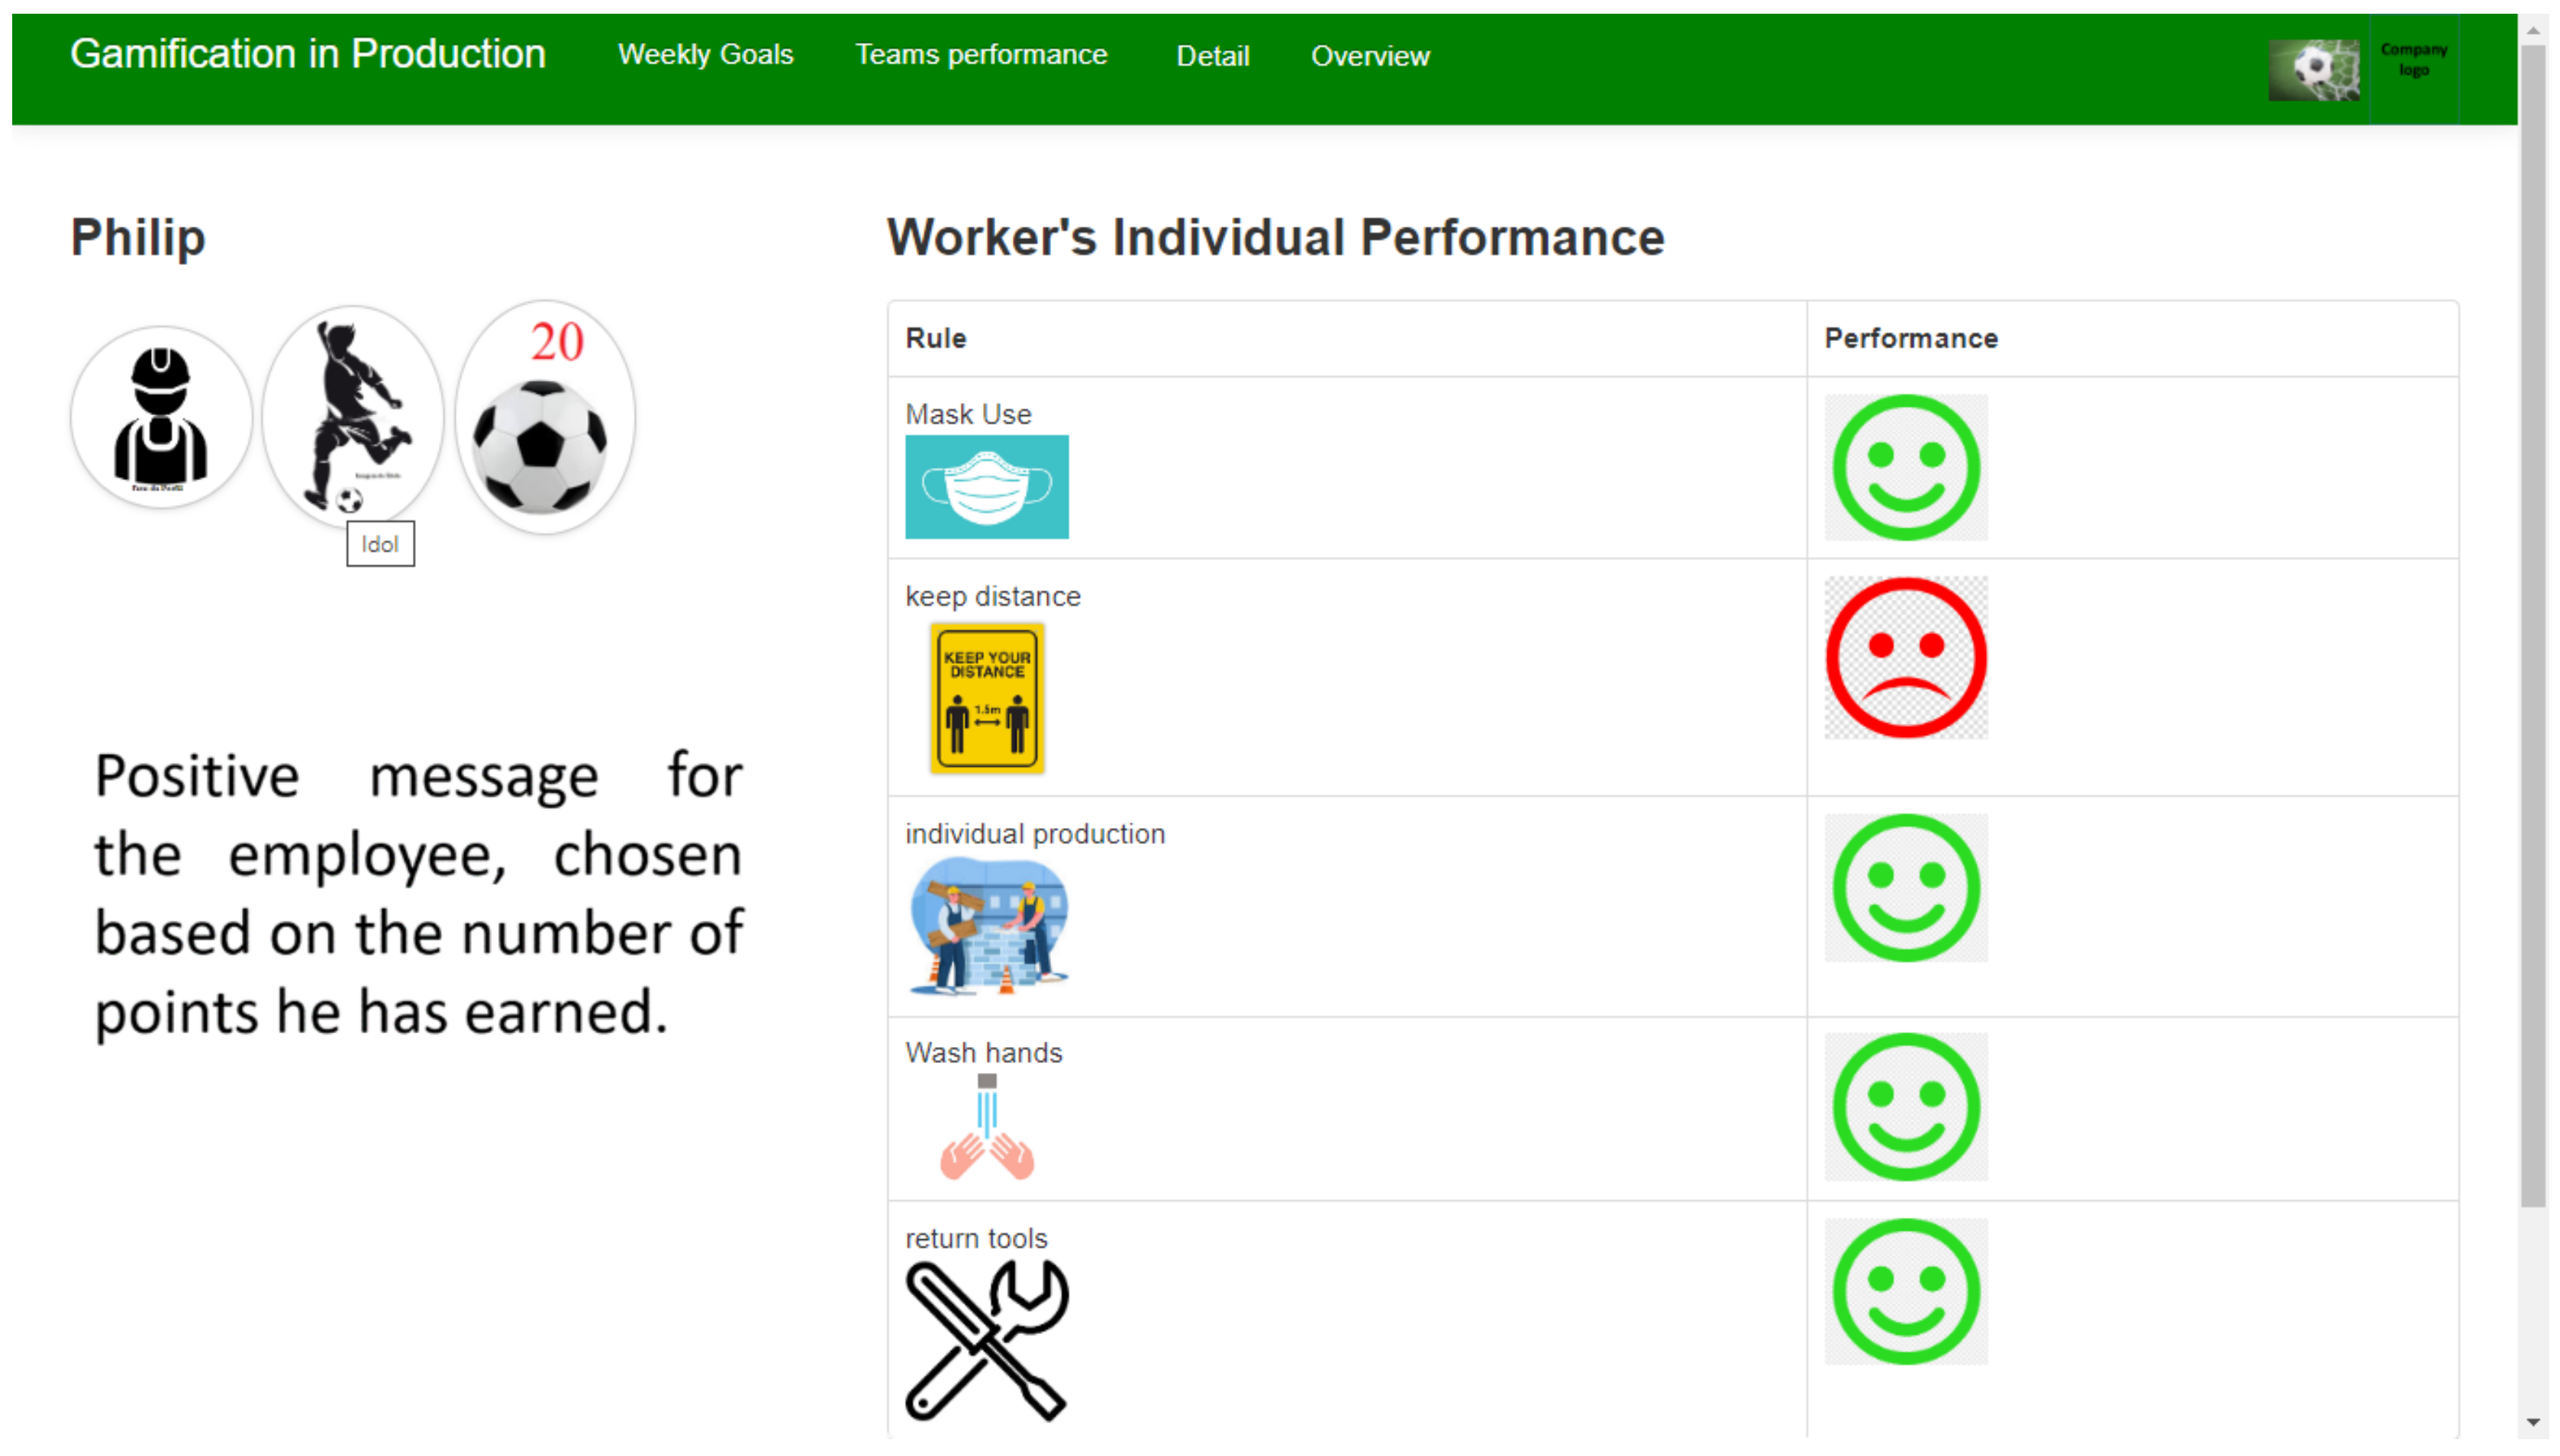
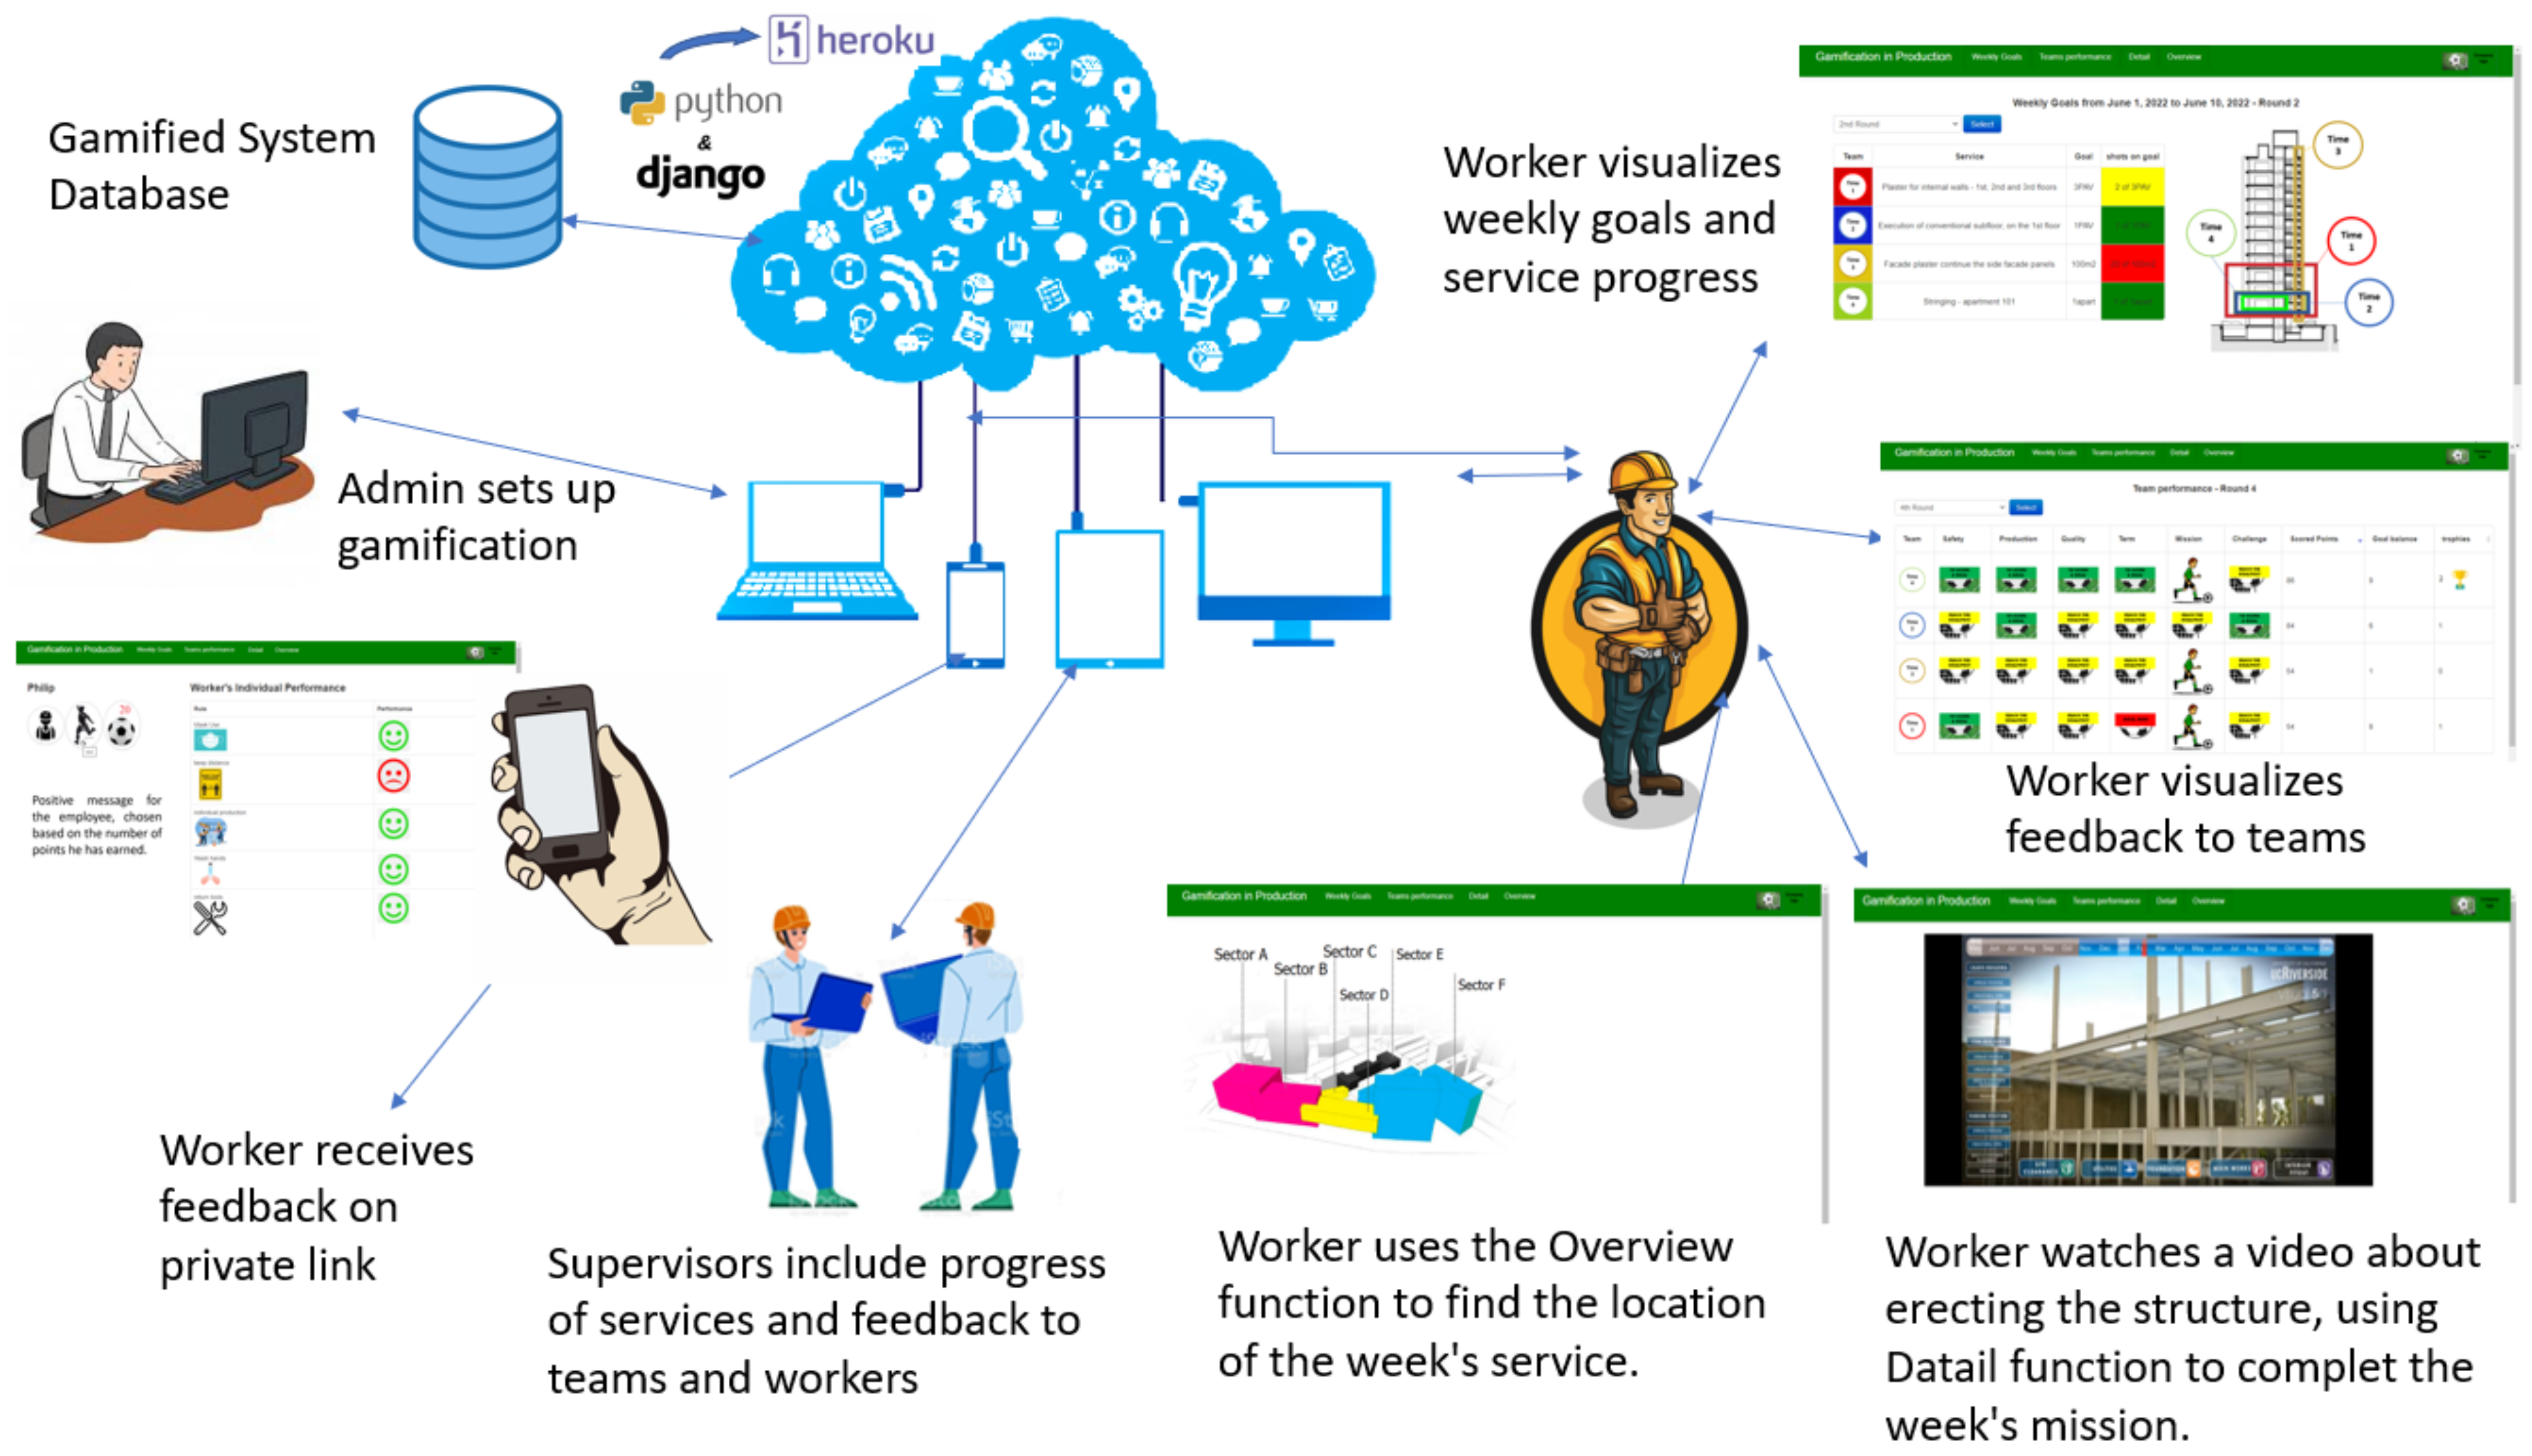
3.1. The Gamification Model in Production
3.2. Evaluation of the Gamification Model in Production
- The company must have a well-structured weekly planning process in place, as well as daily production information for its services.
- Install a 32-inch monitor in a strategic location on the job site to display system information.
- Have a computer connected to a monitor from which the web system will be accessed.
- Having enough capacity for Wi-Fi that can be accessed from anywhere on site.
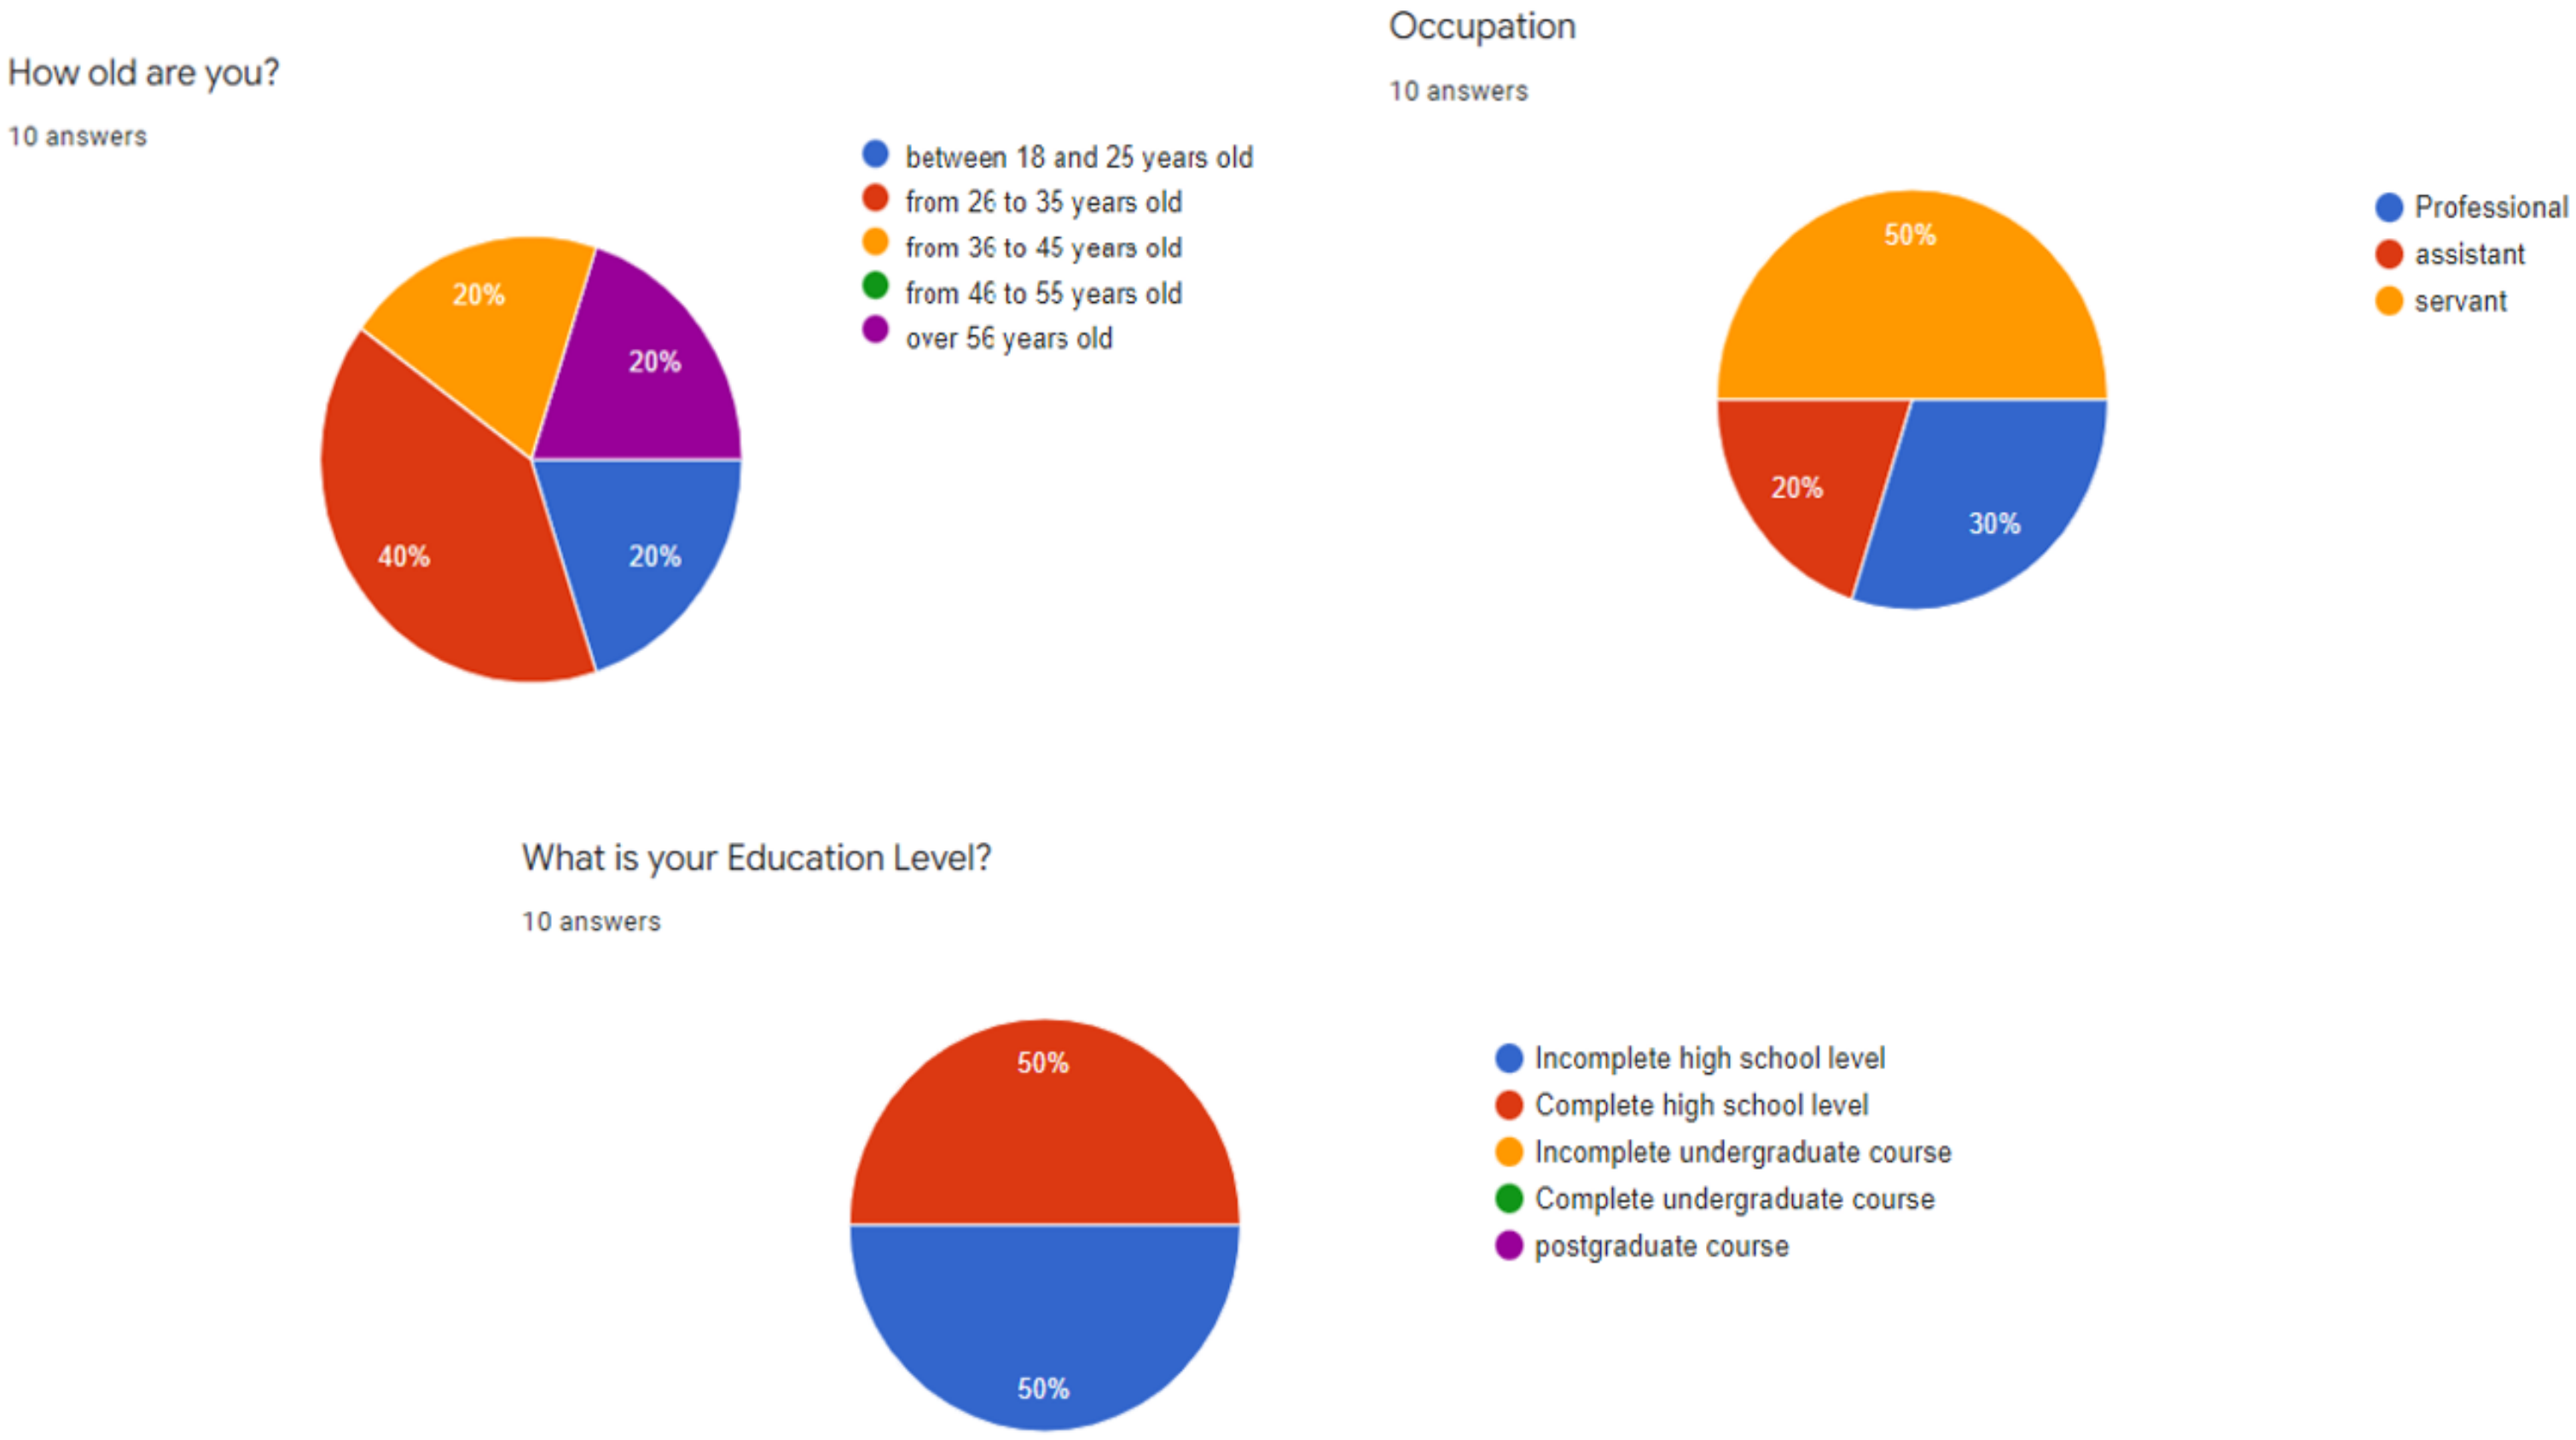
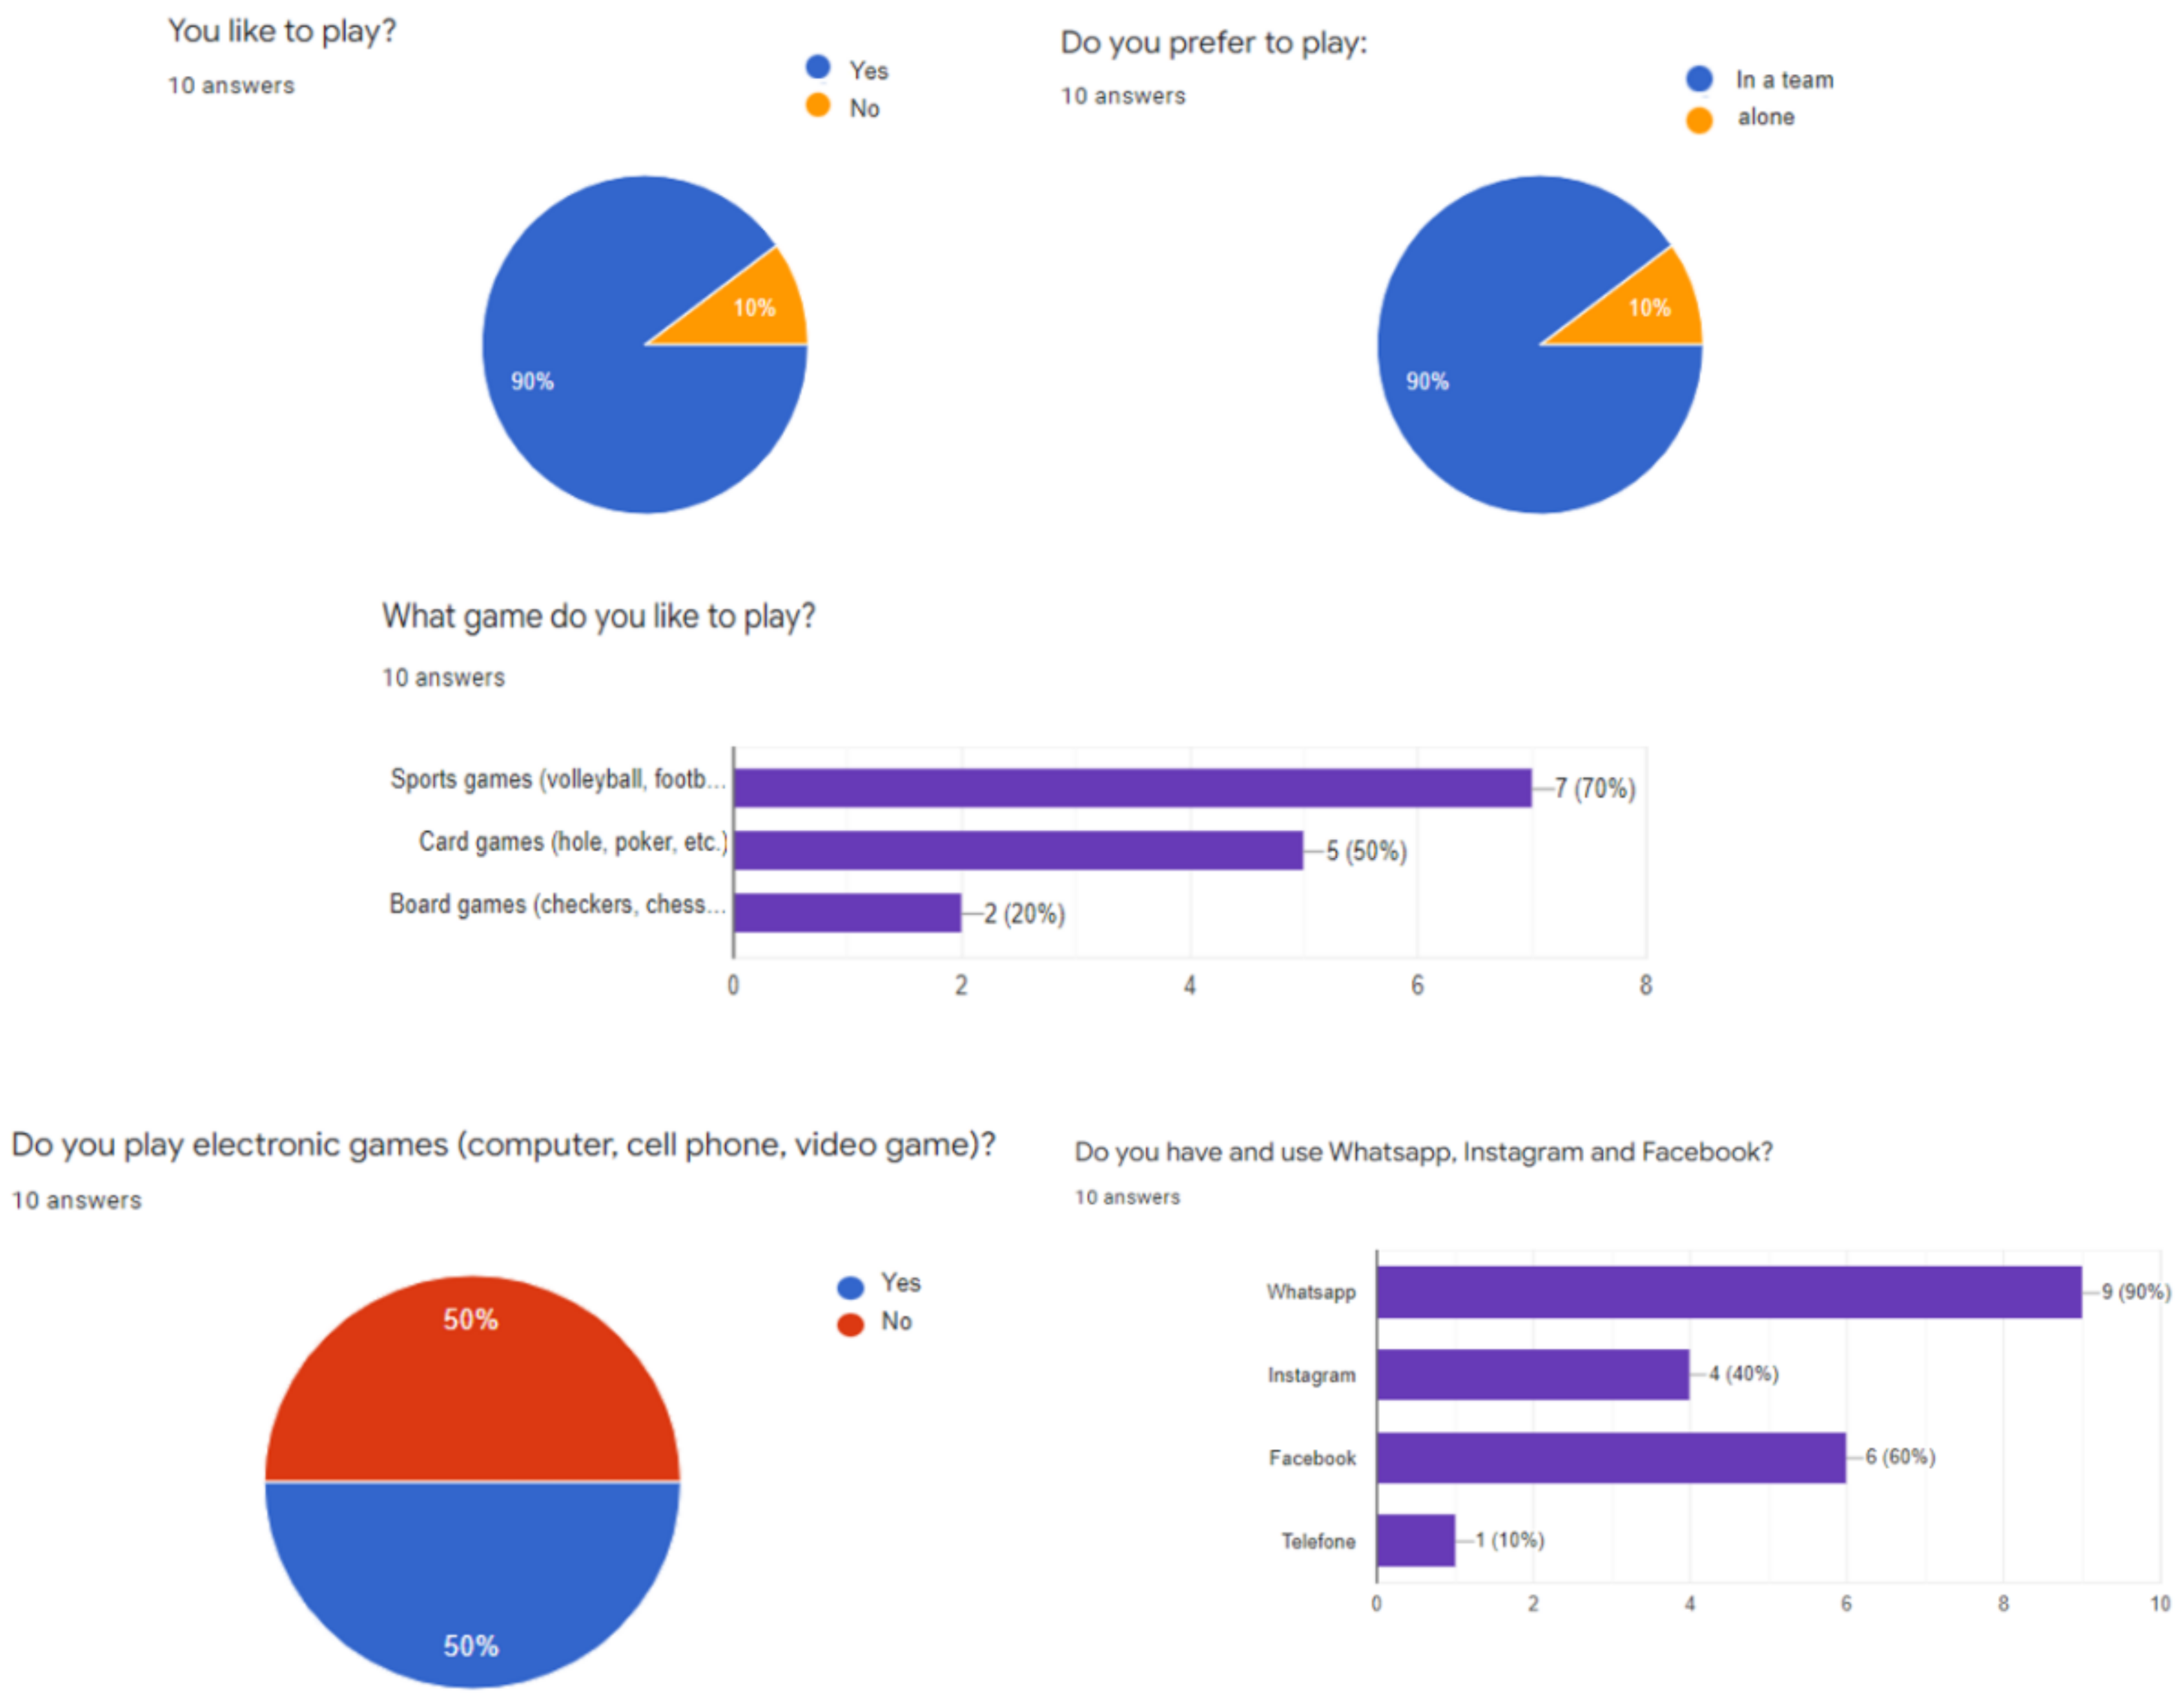
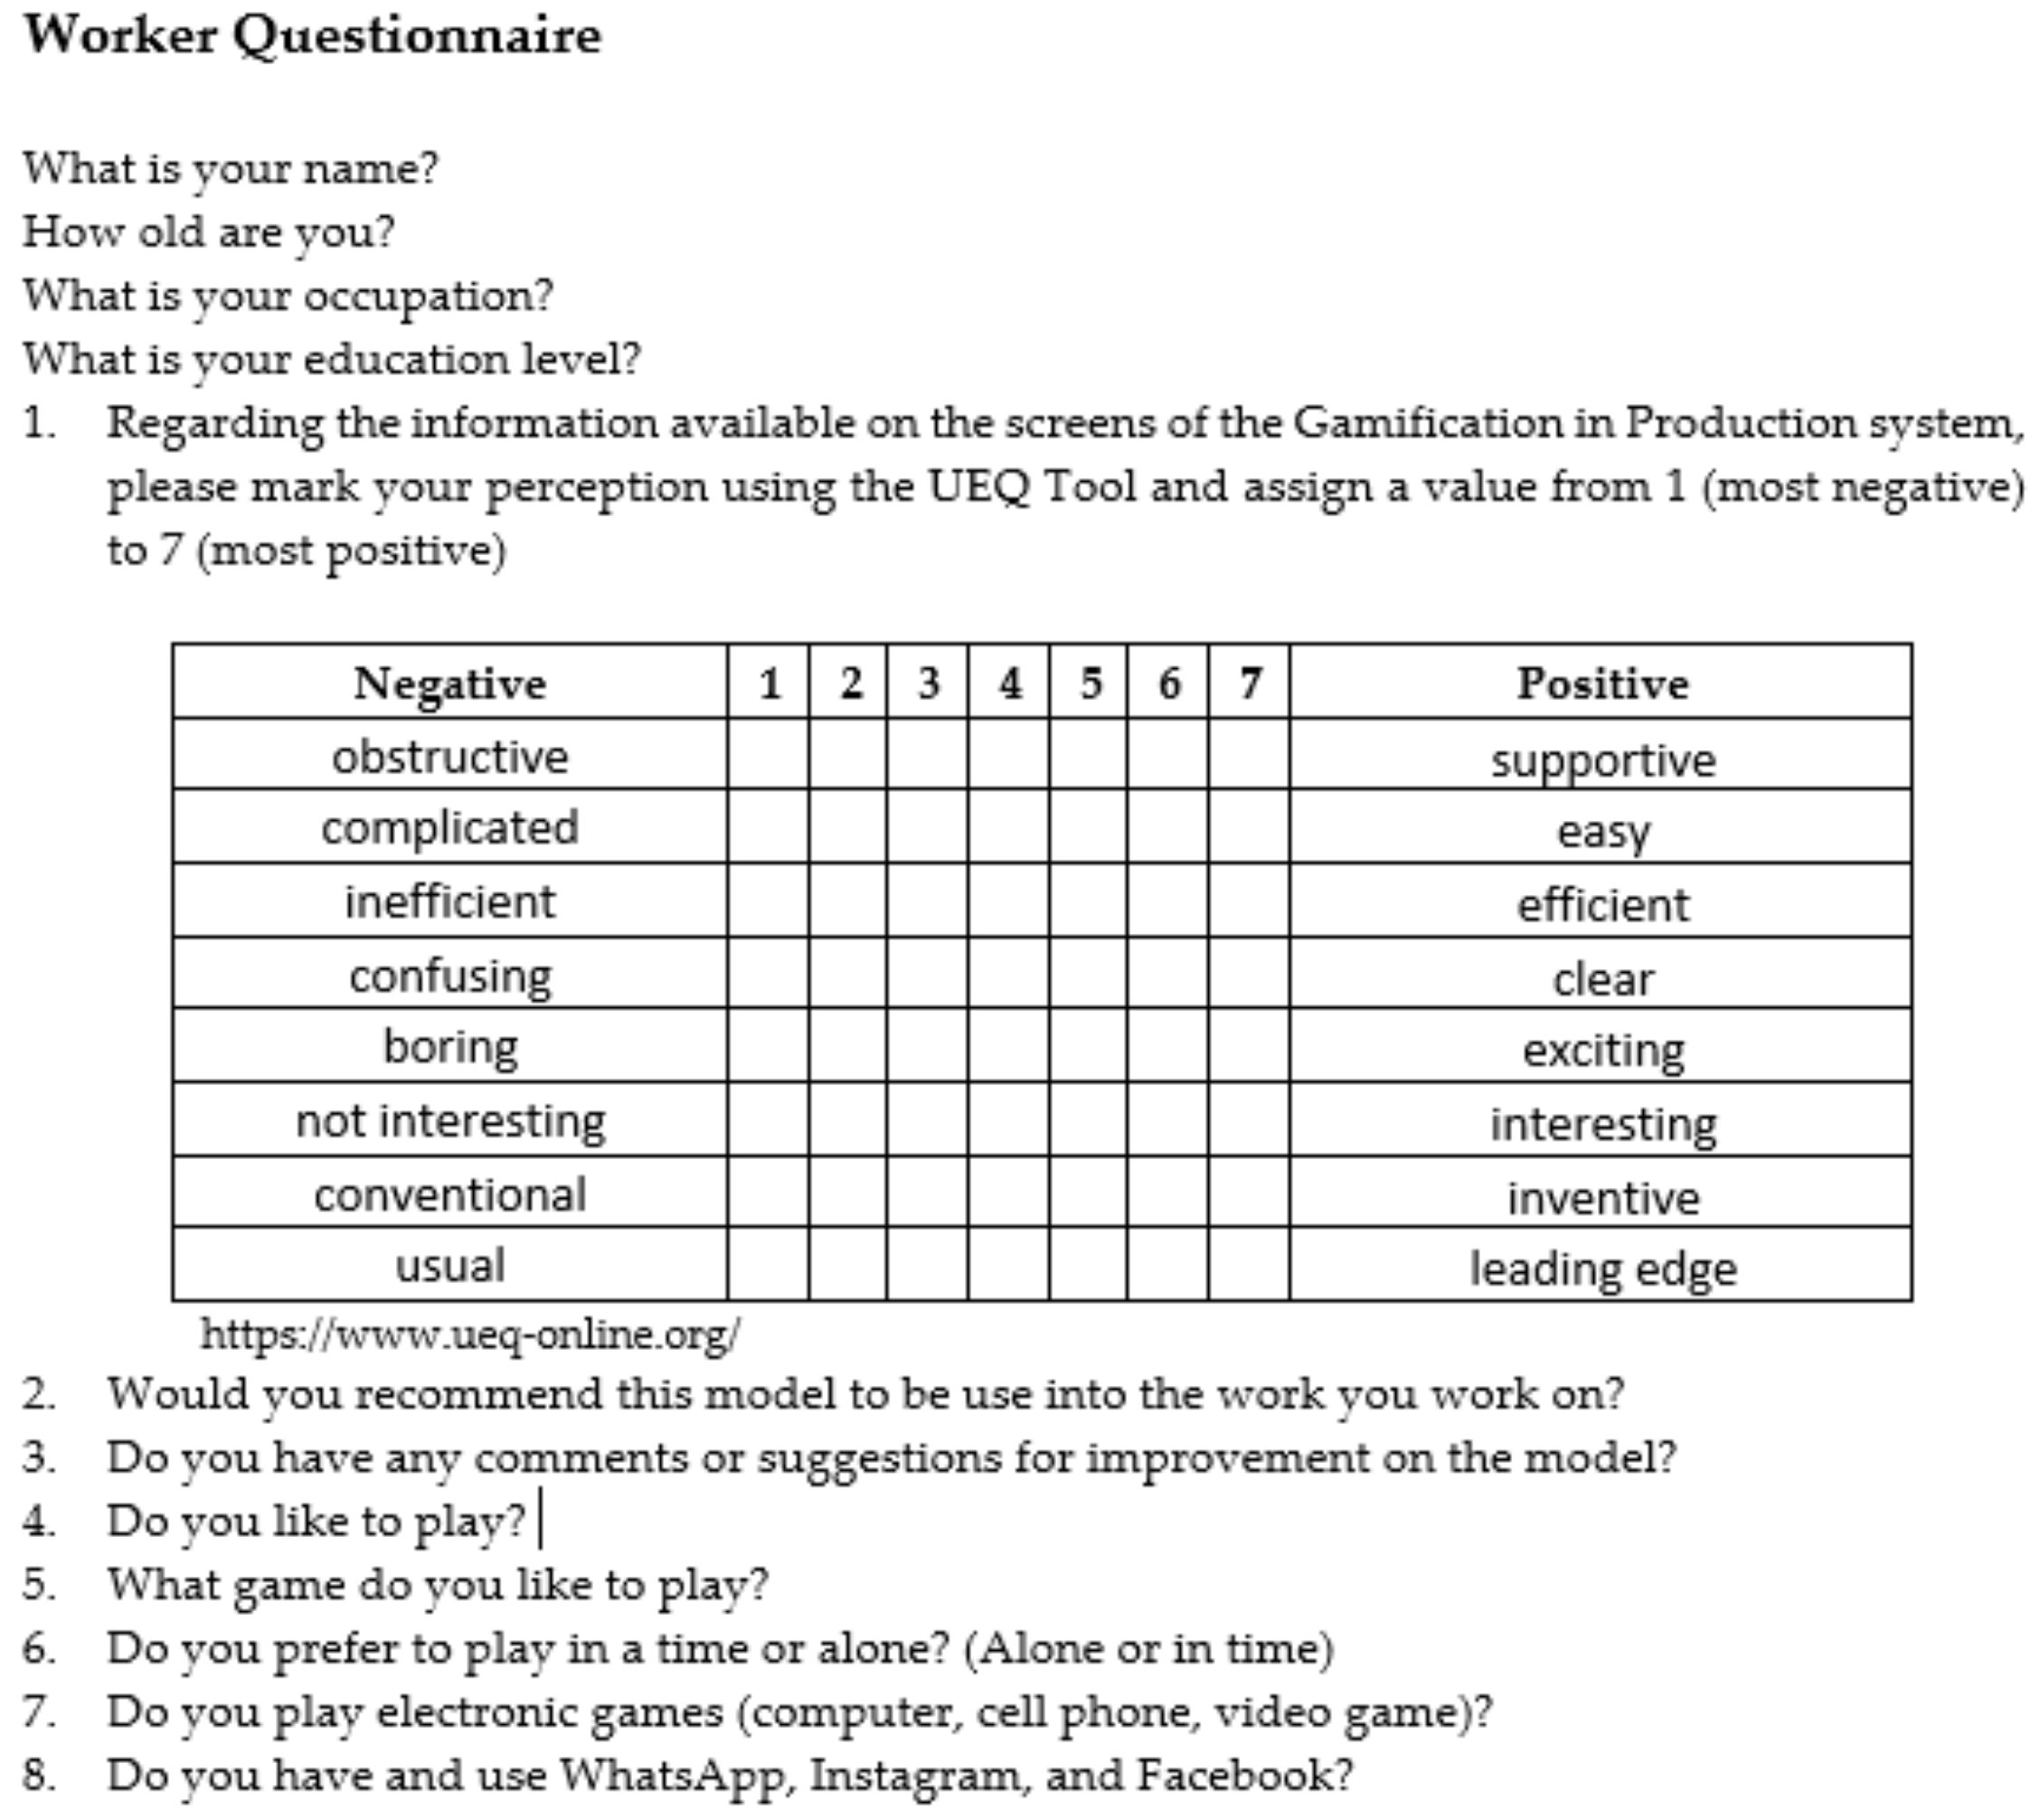
3.2.1. Analysis of the Gamified Model from the Workers’ Answers
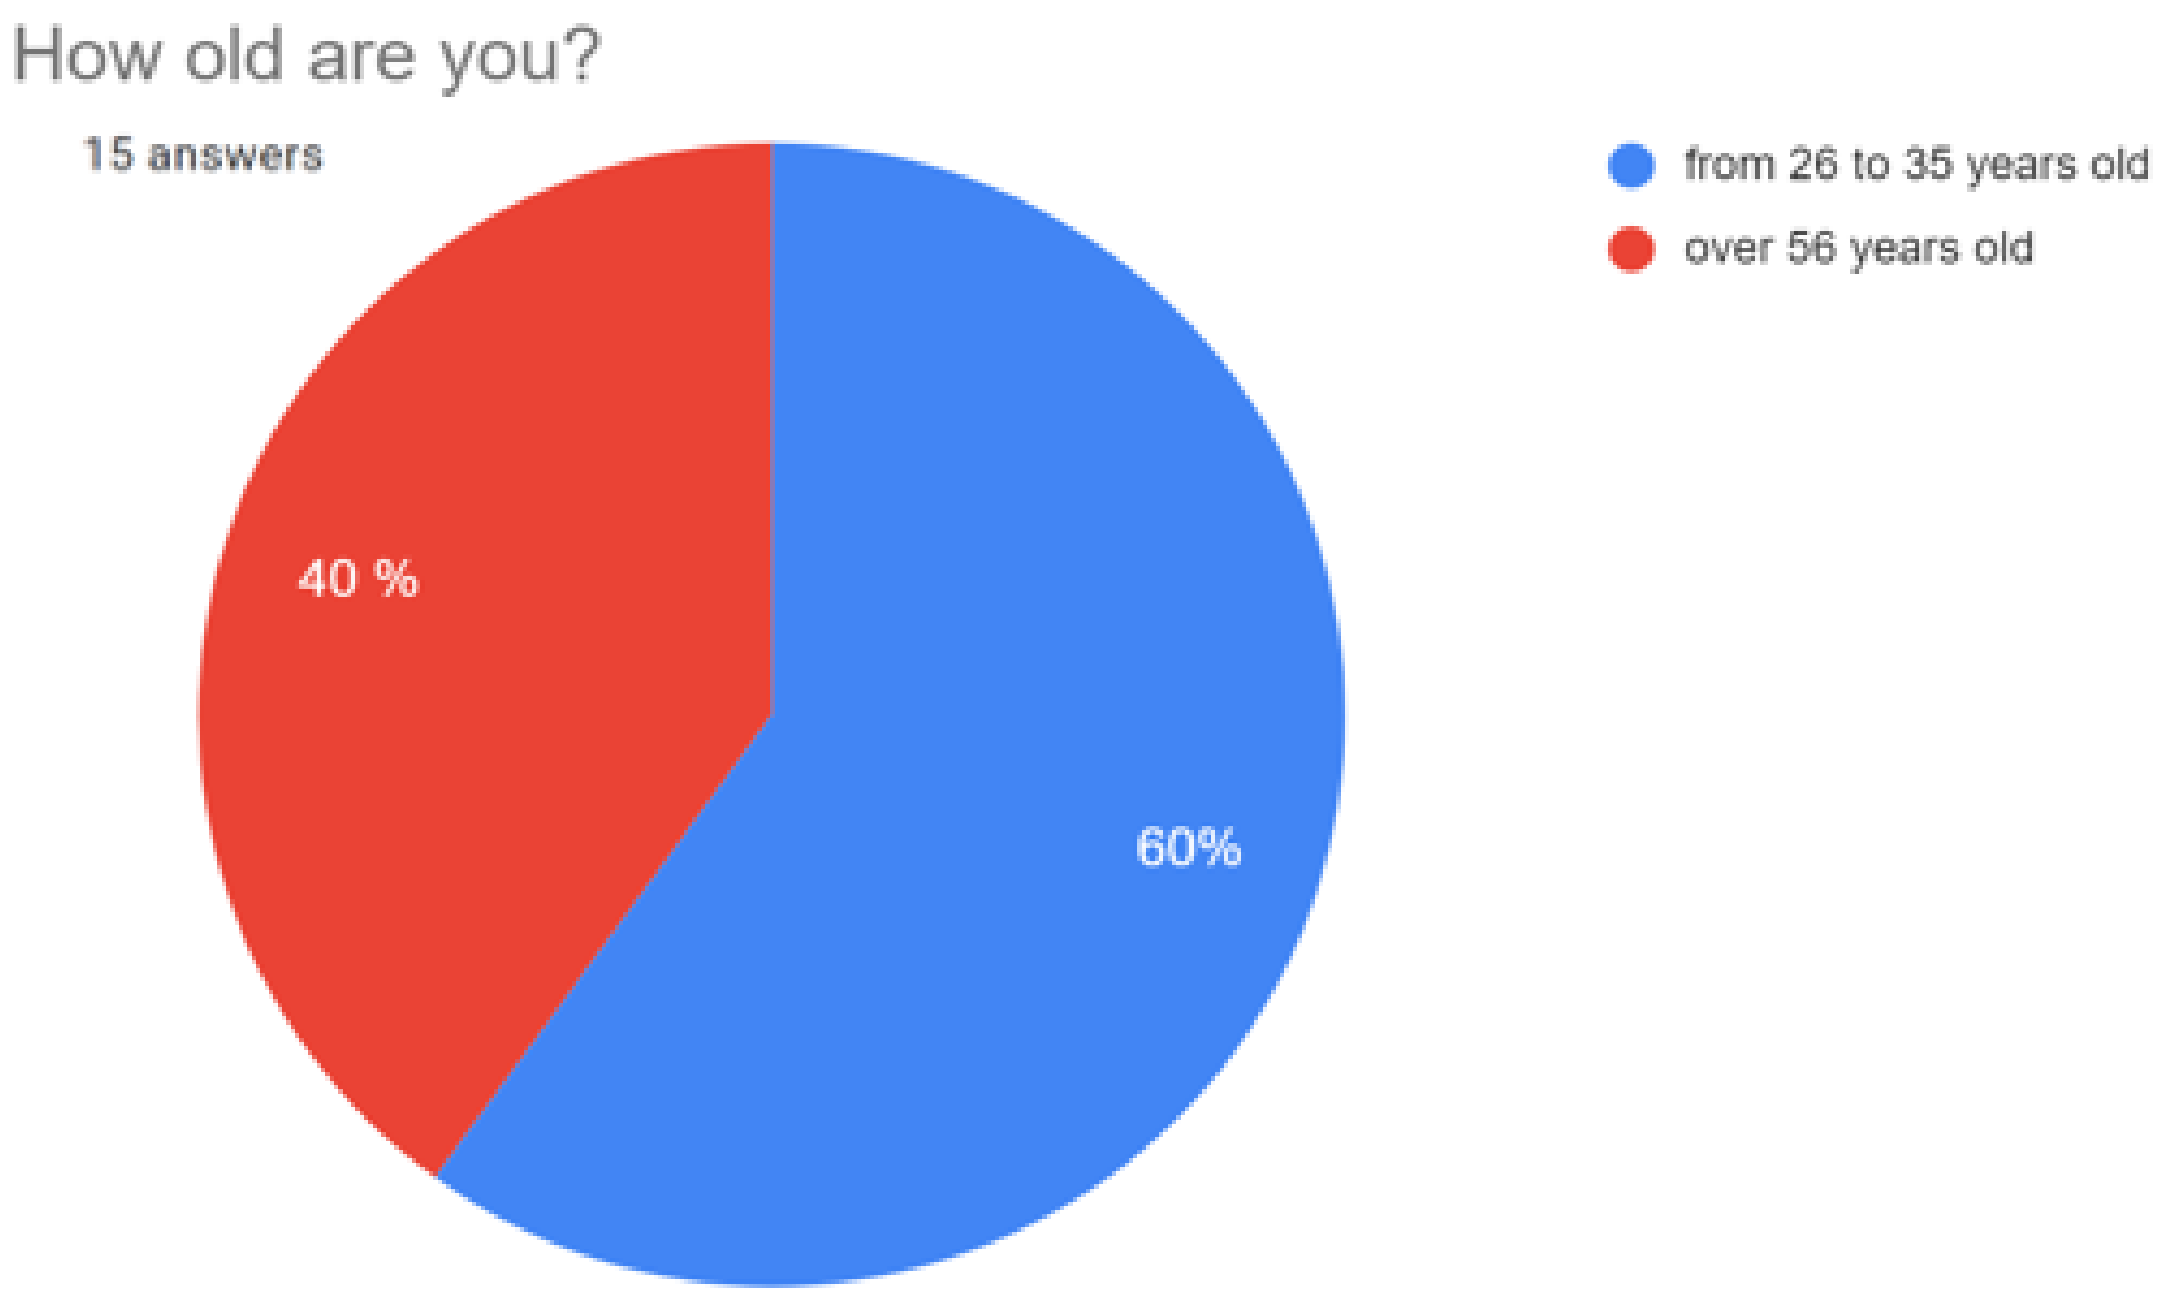
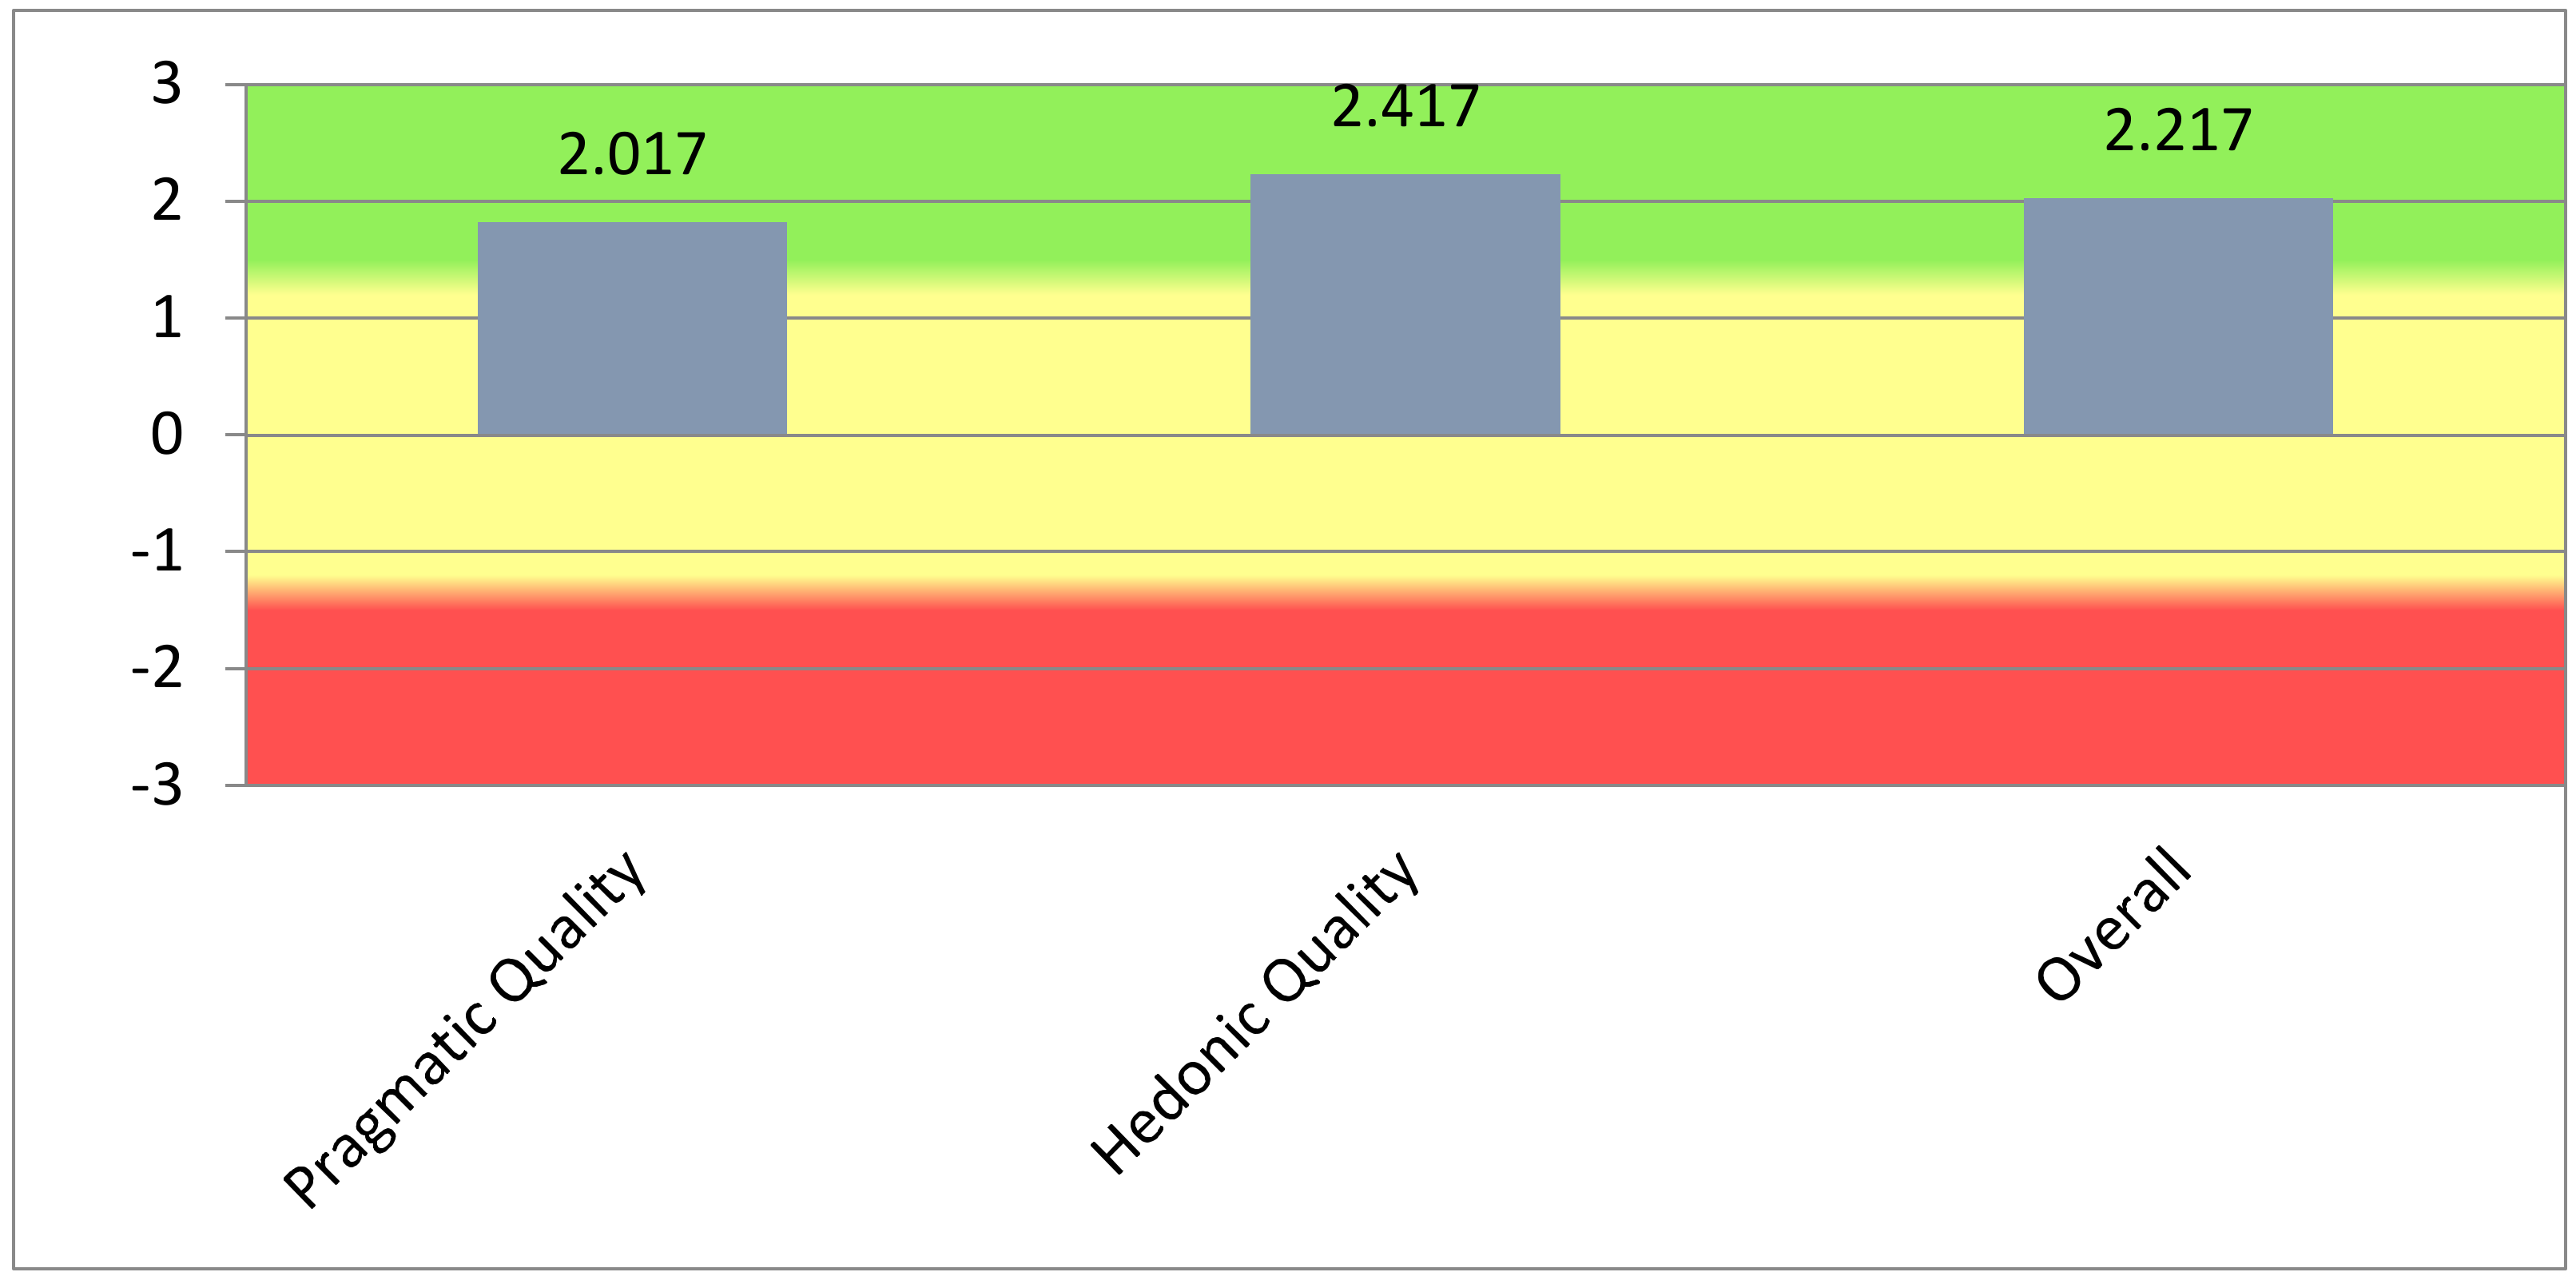
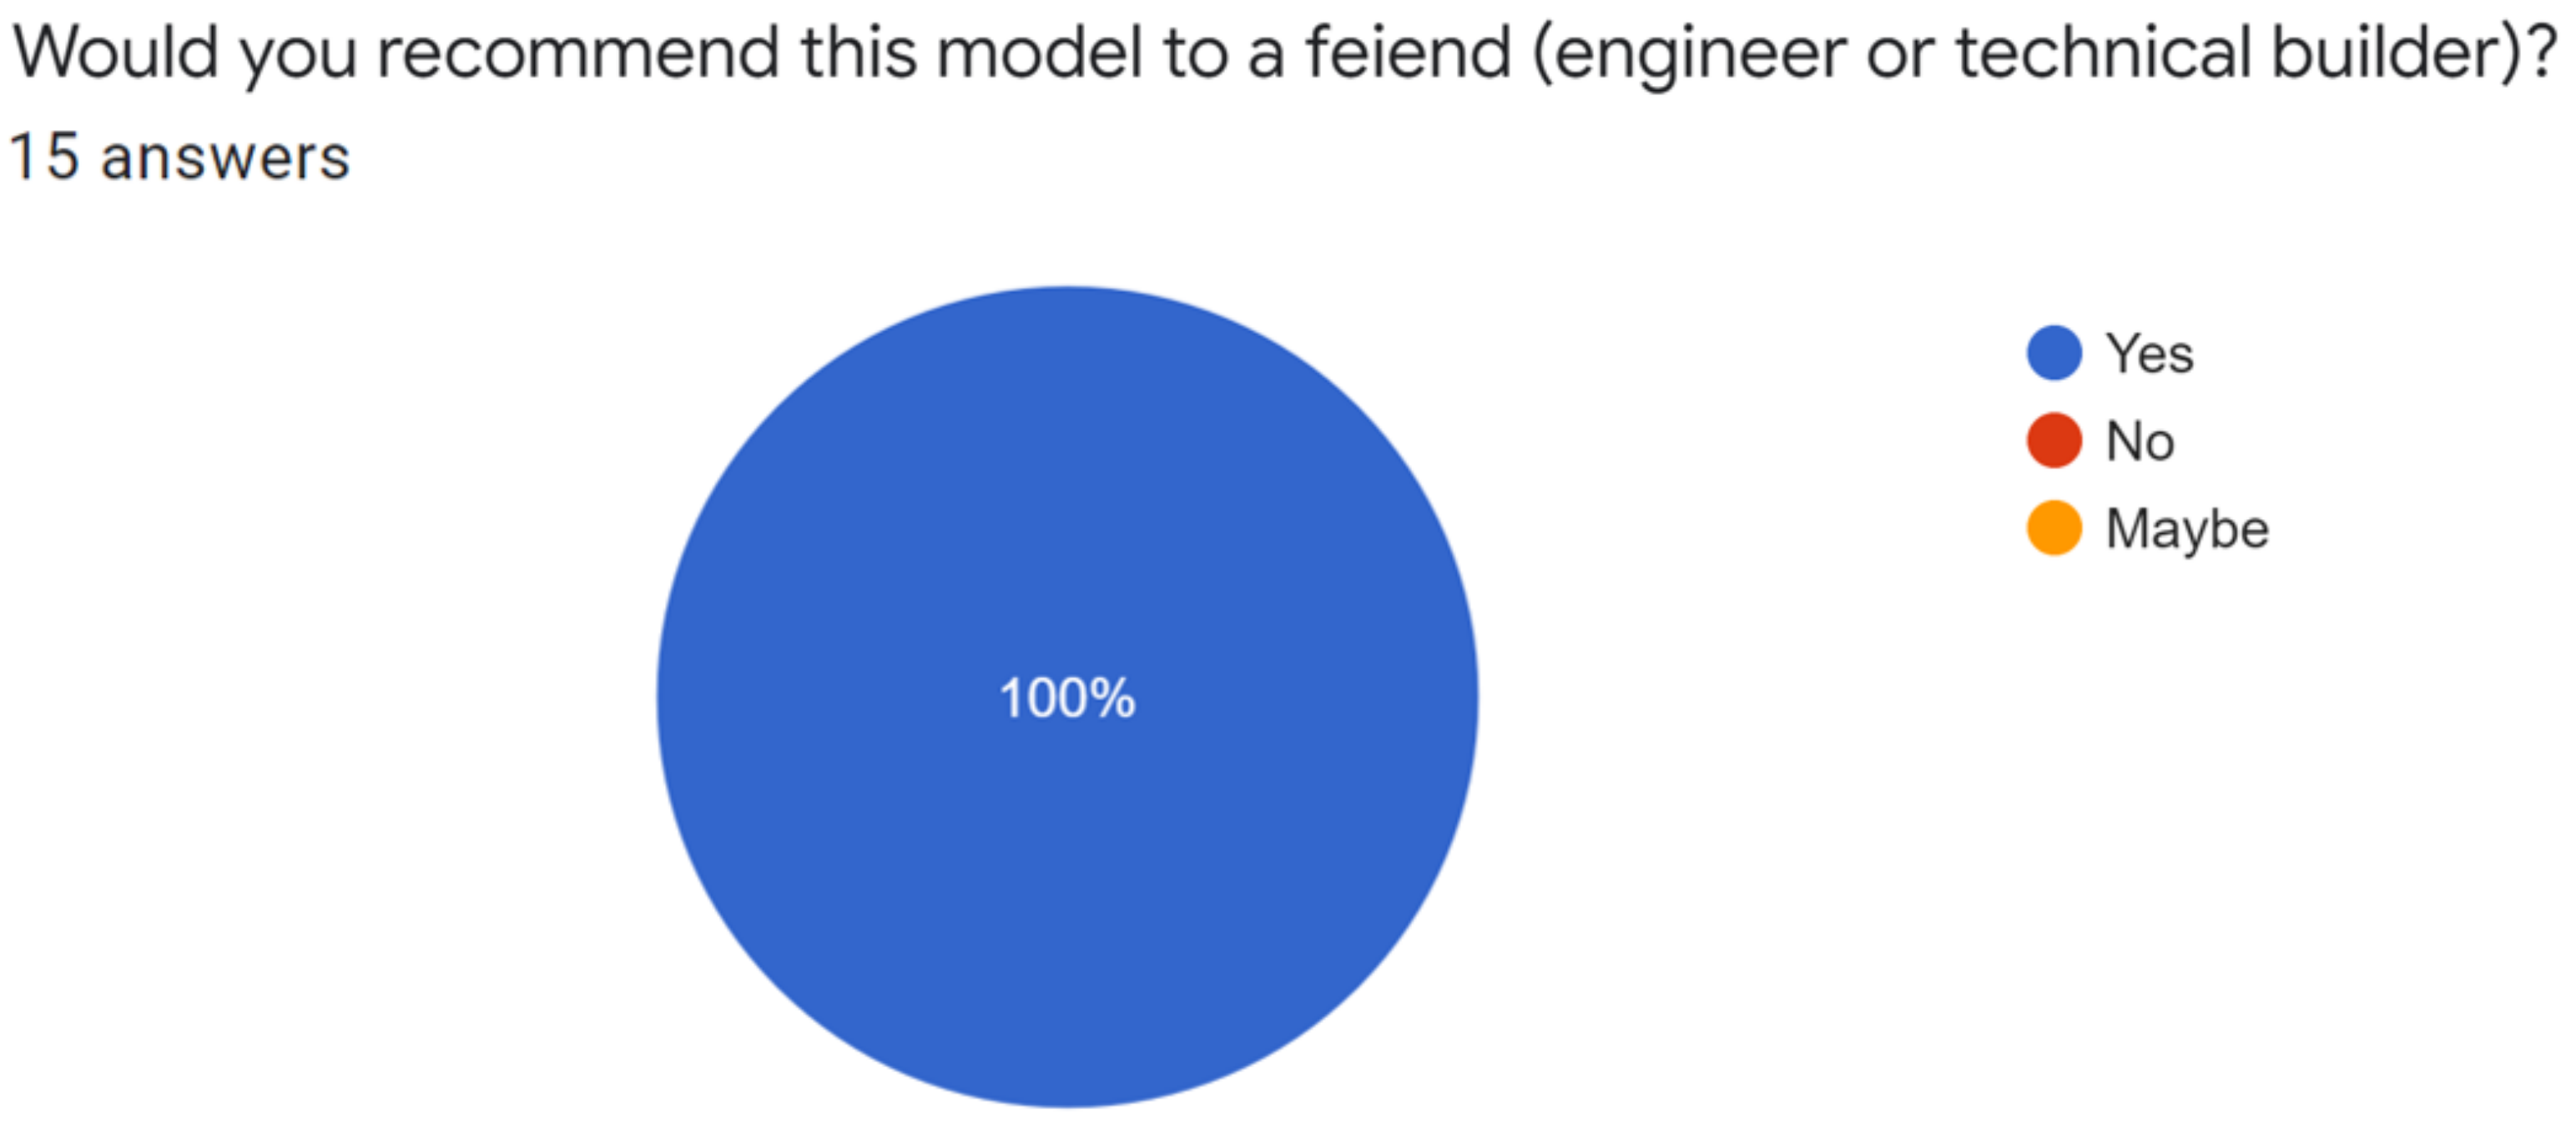
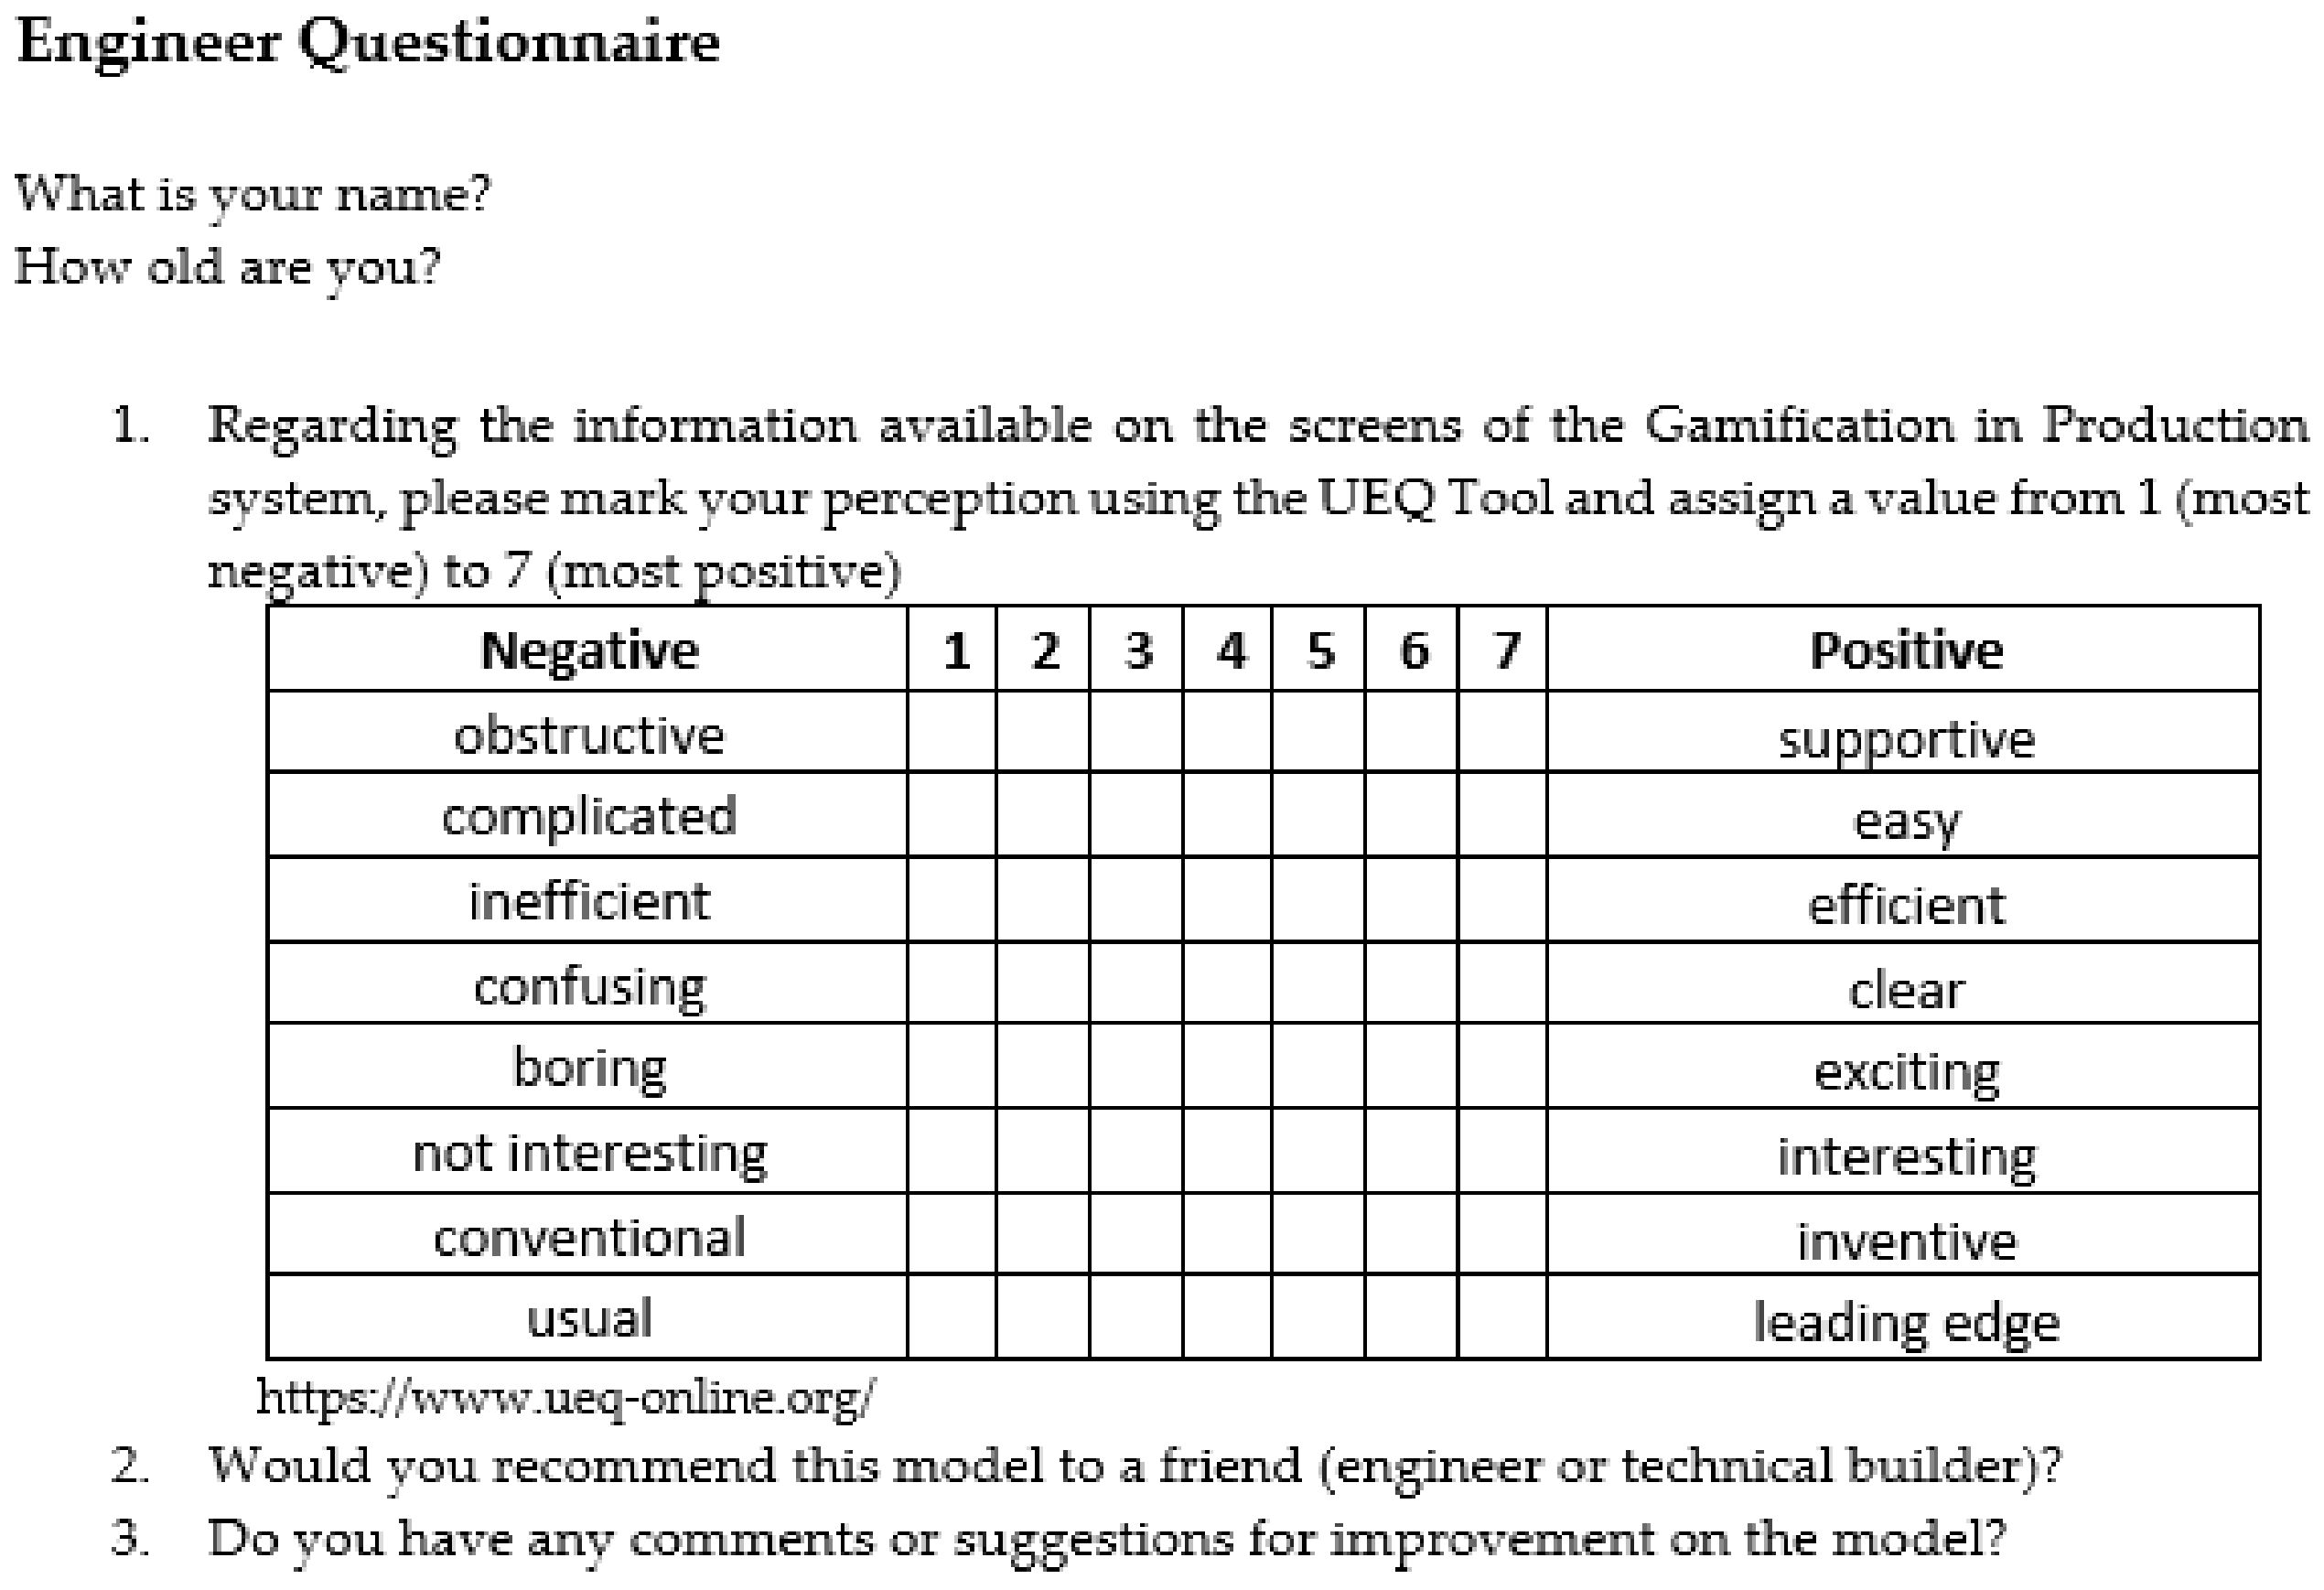
3.2.2. Analysis of the Gamified Model Based on the Engineers’ Answers
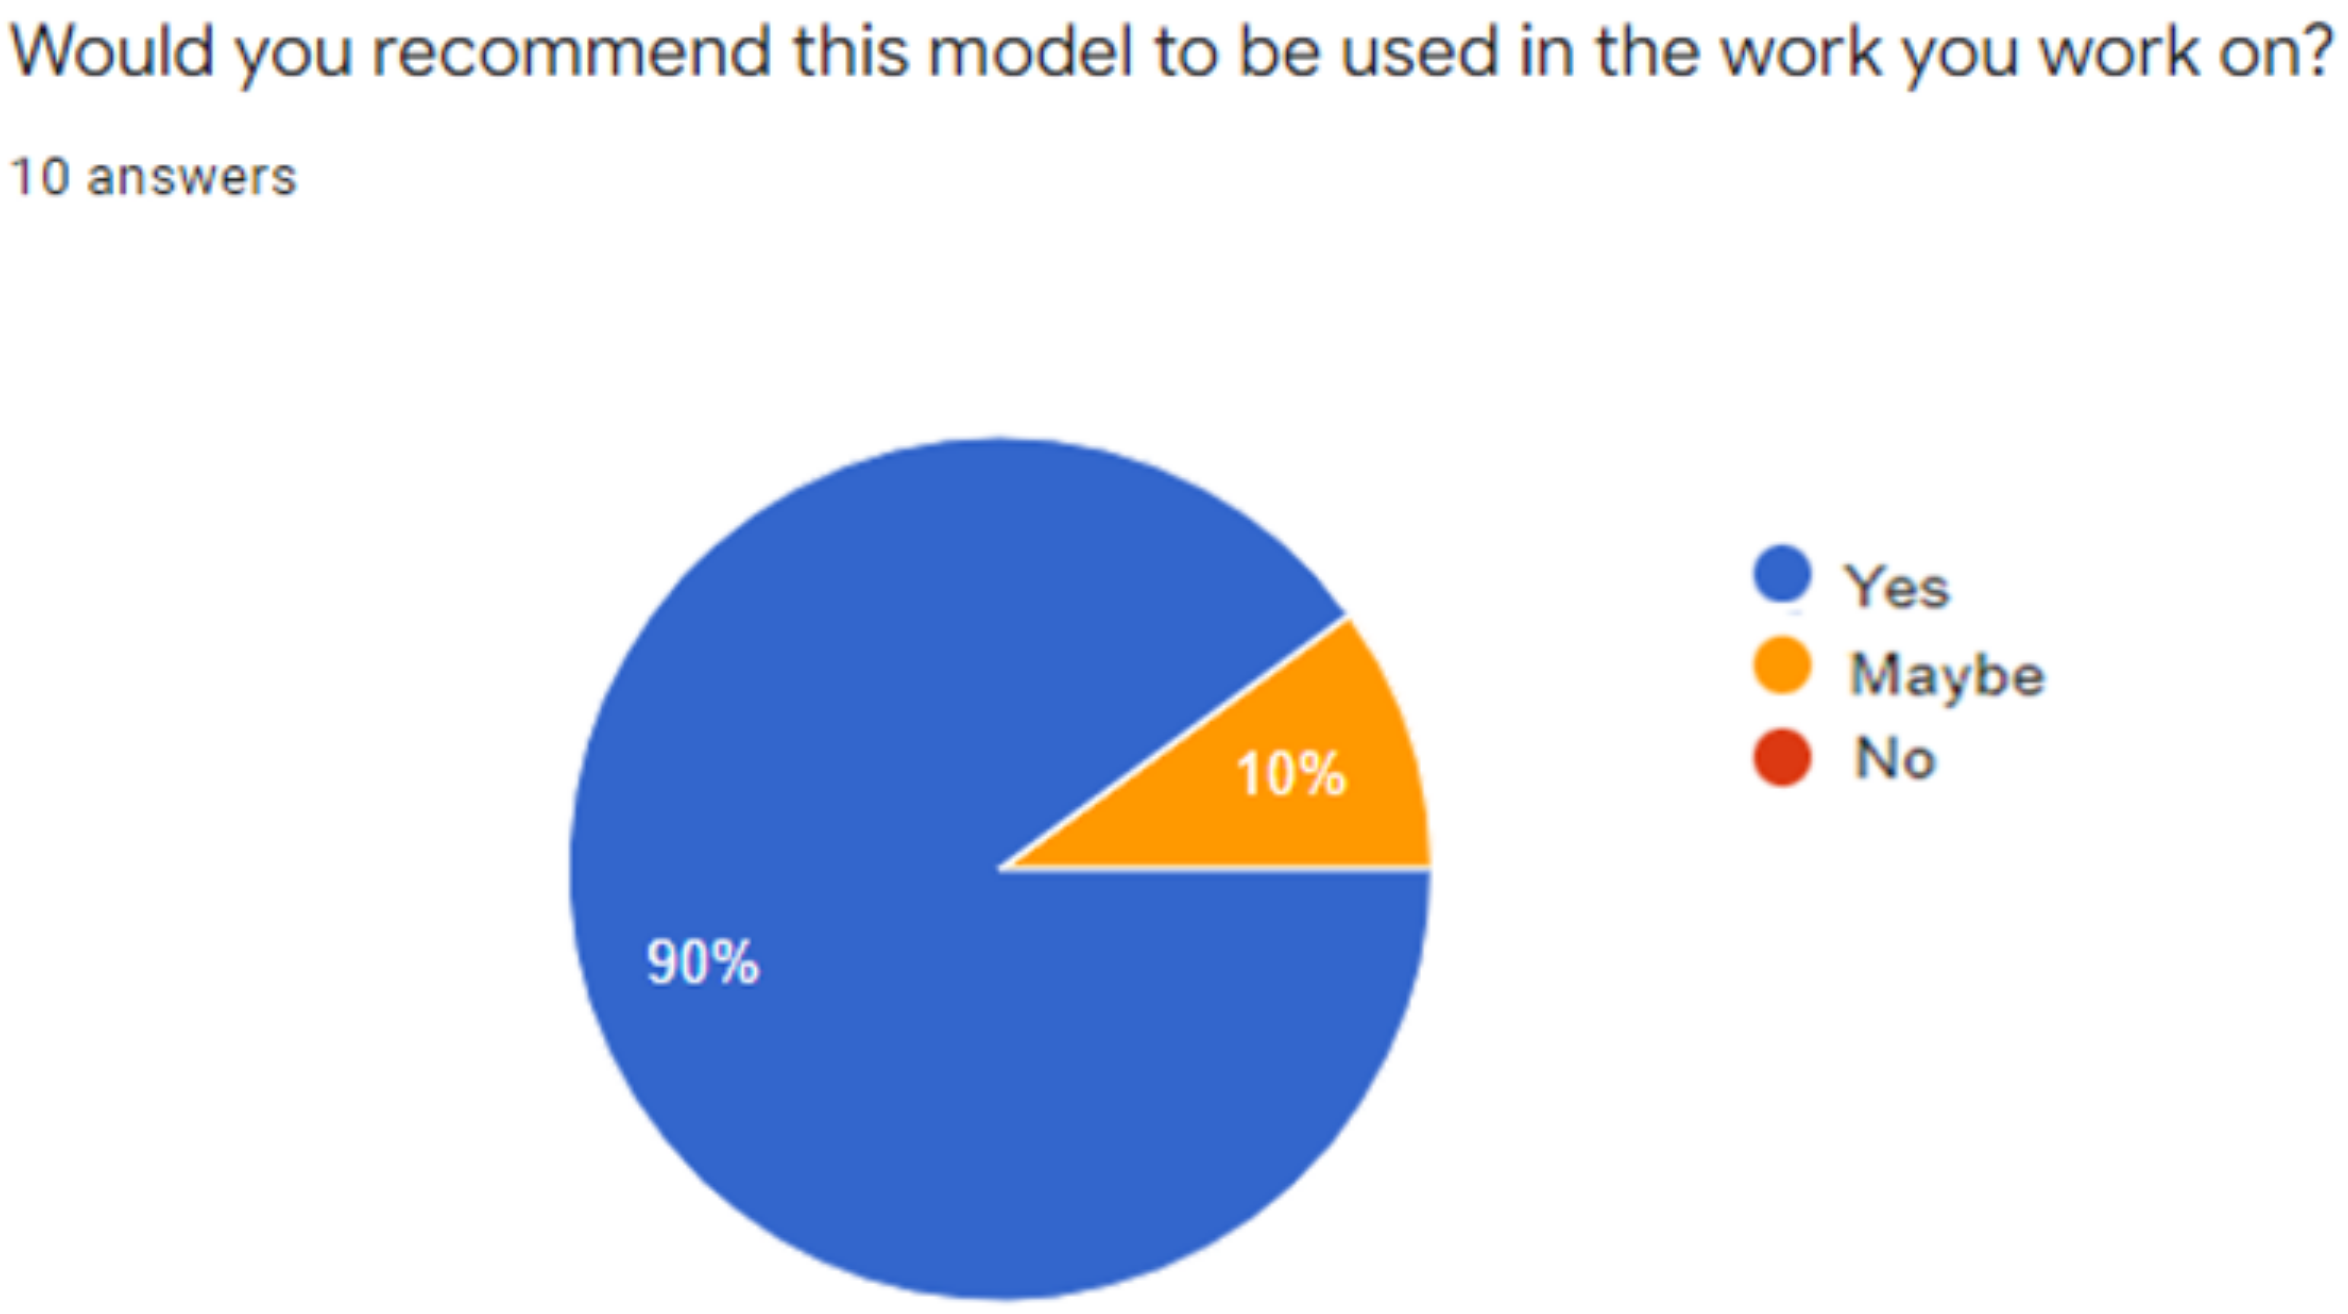
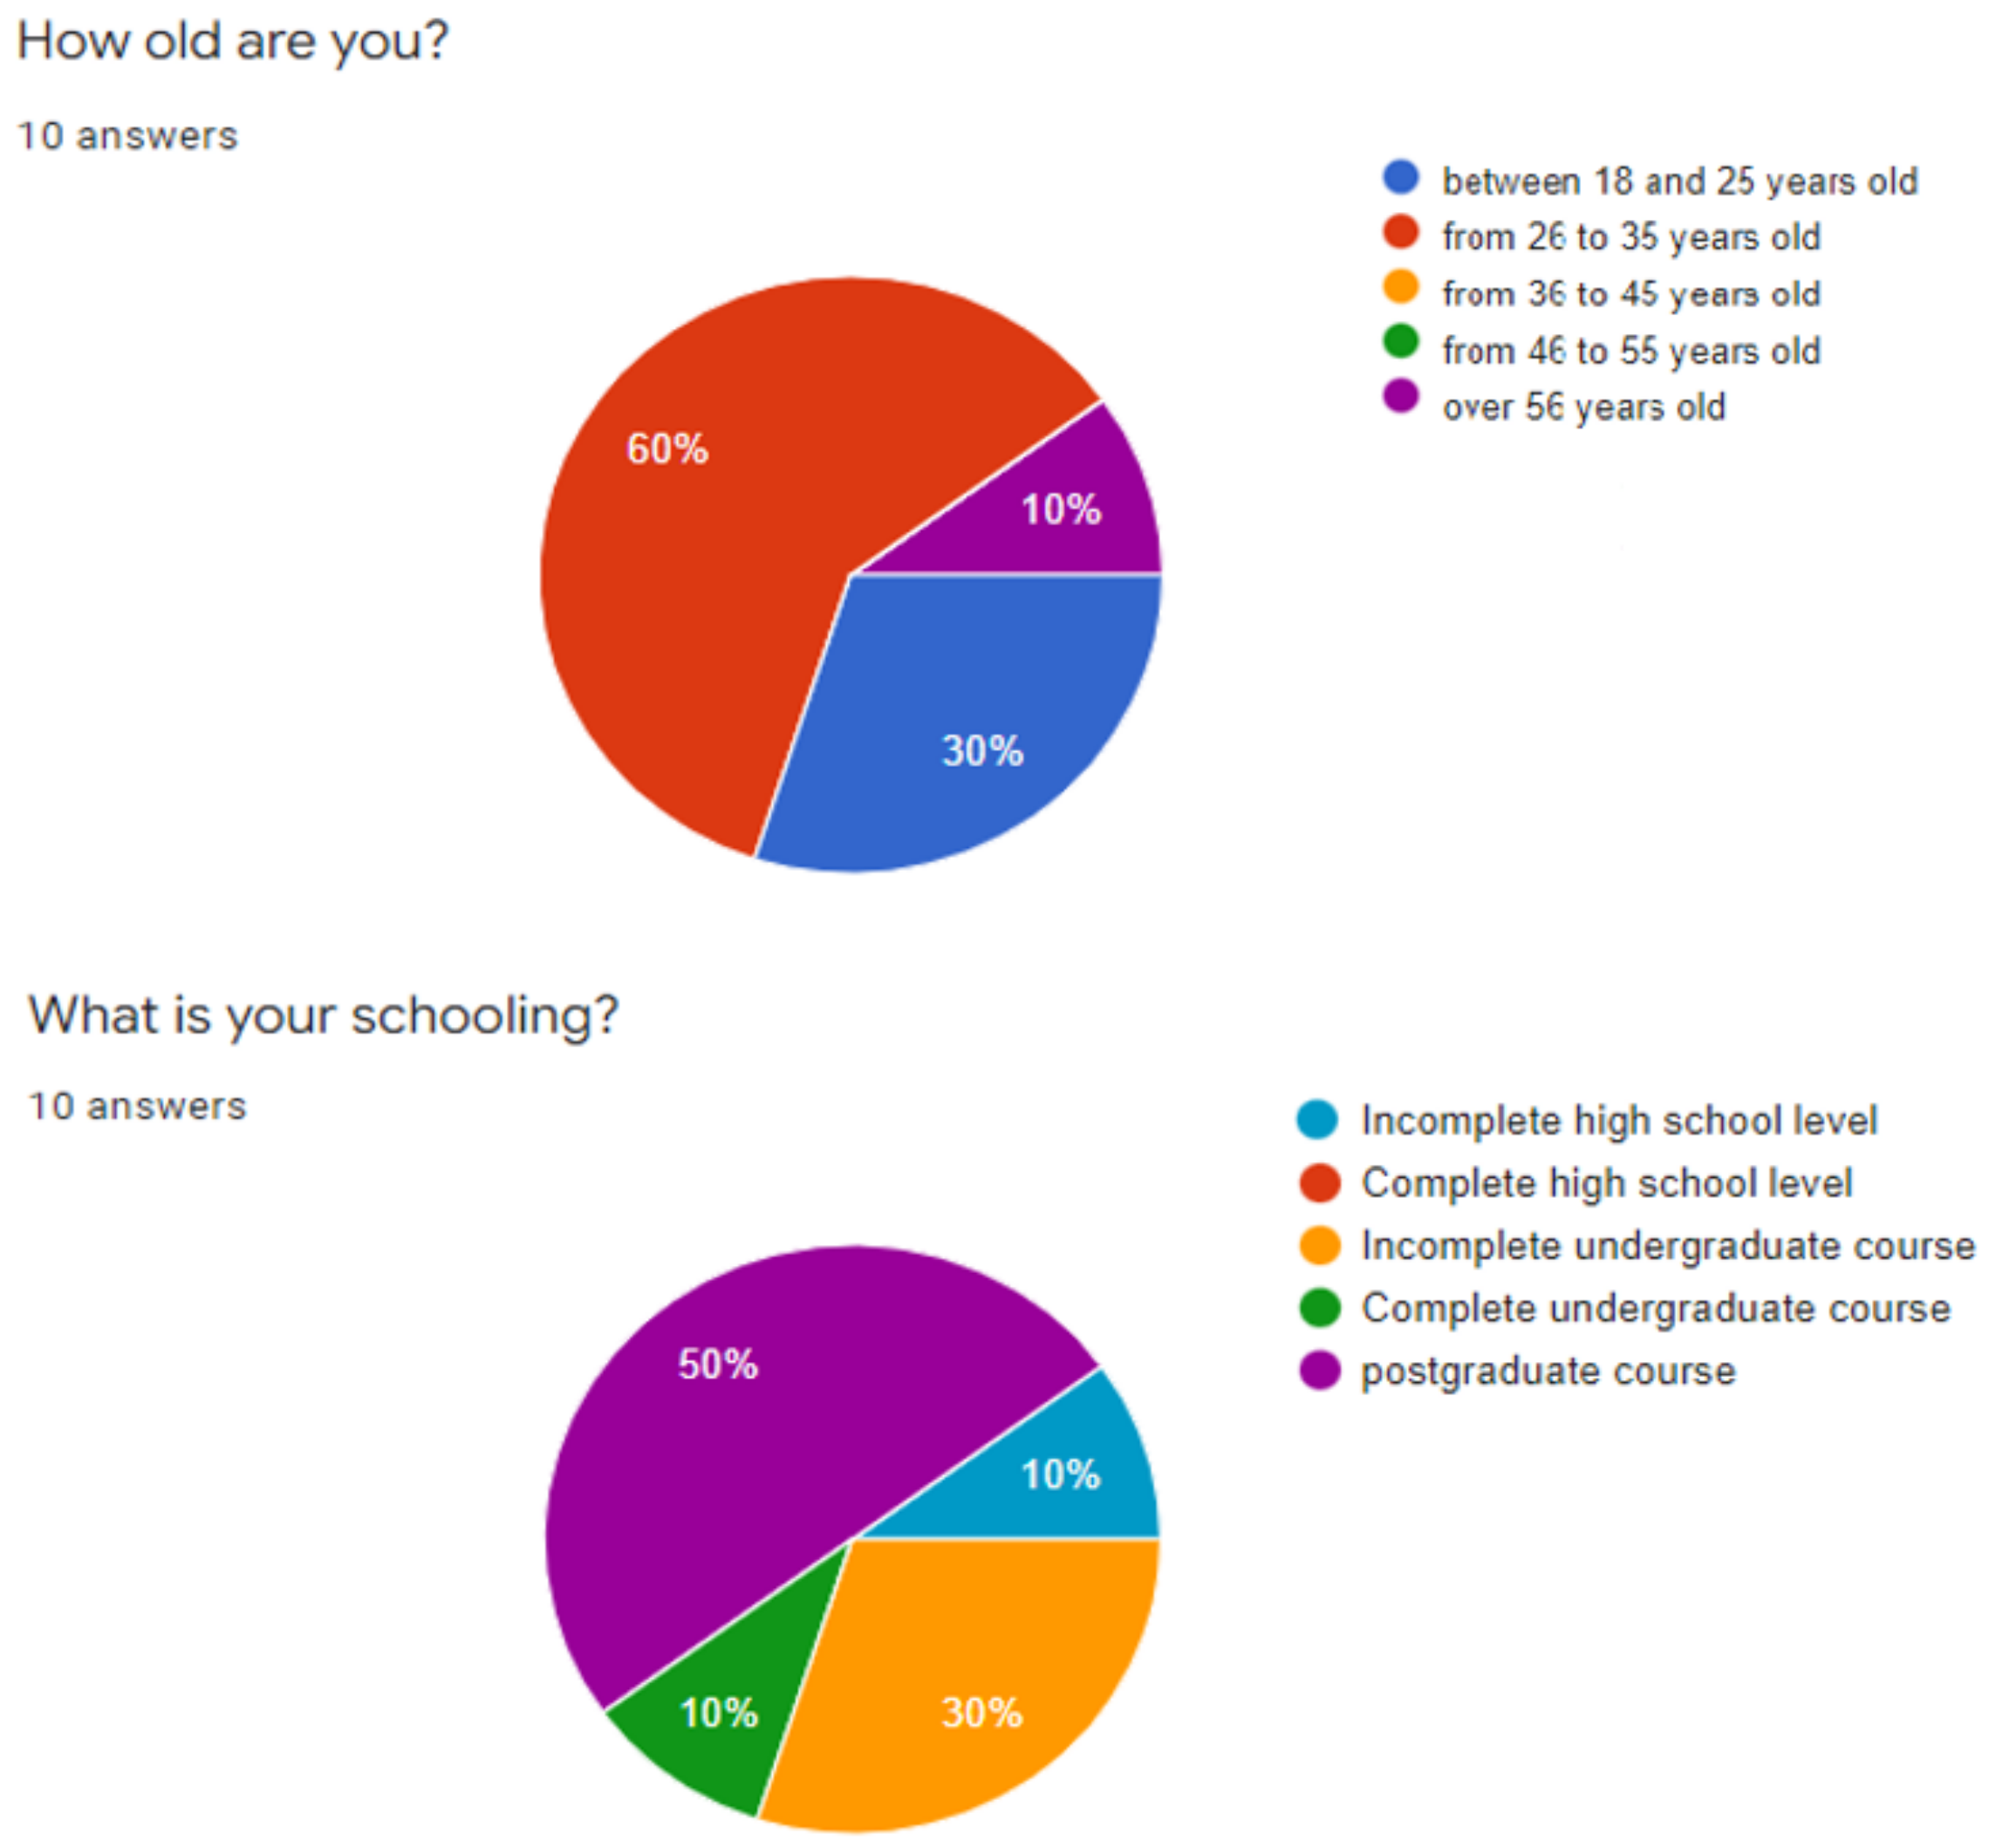
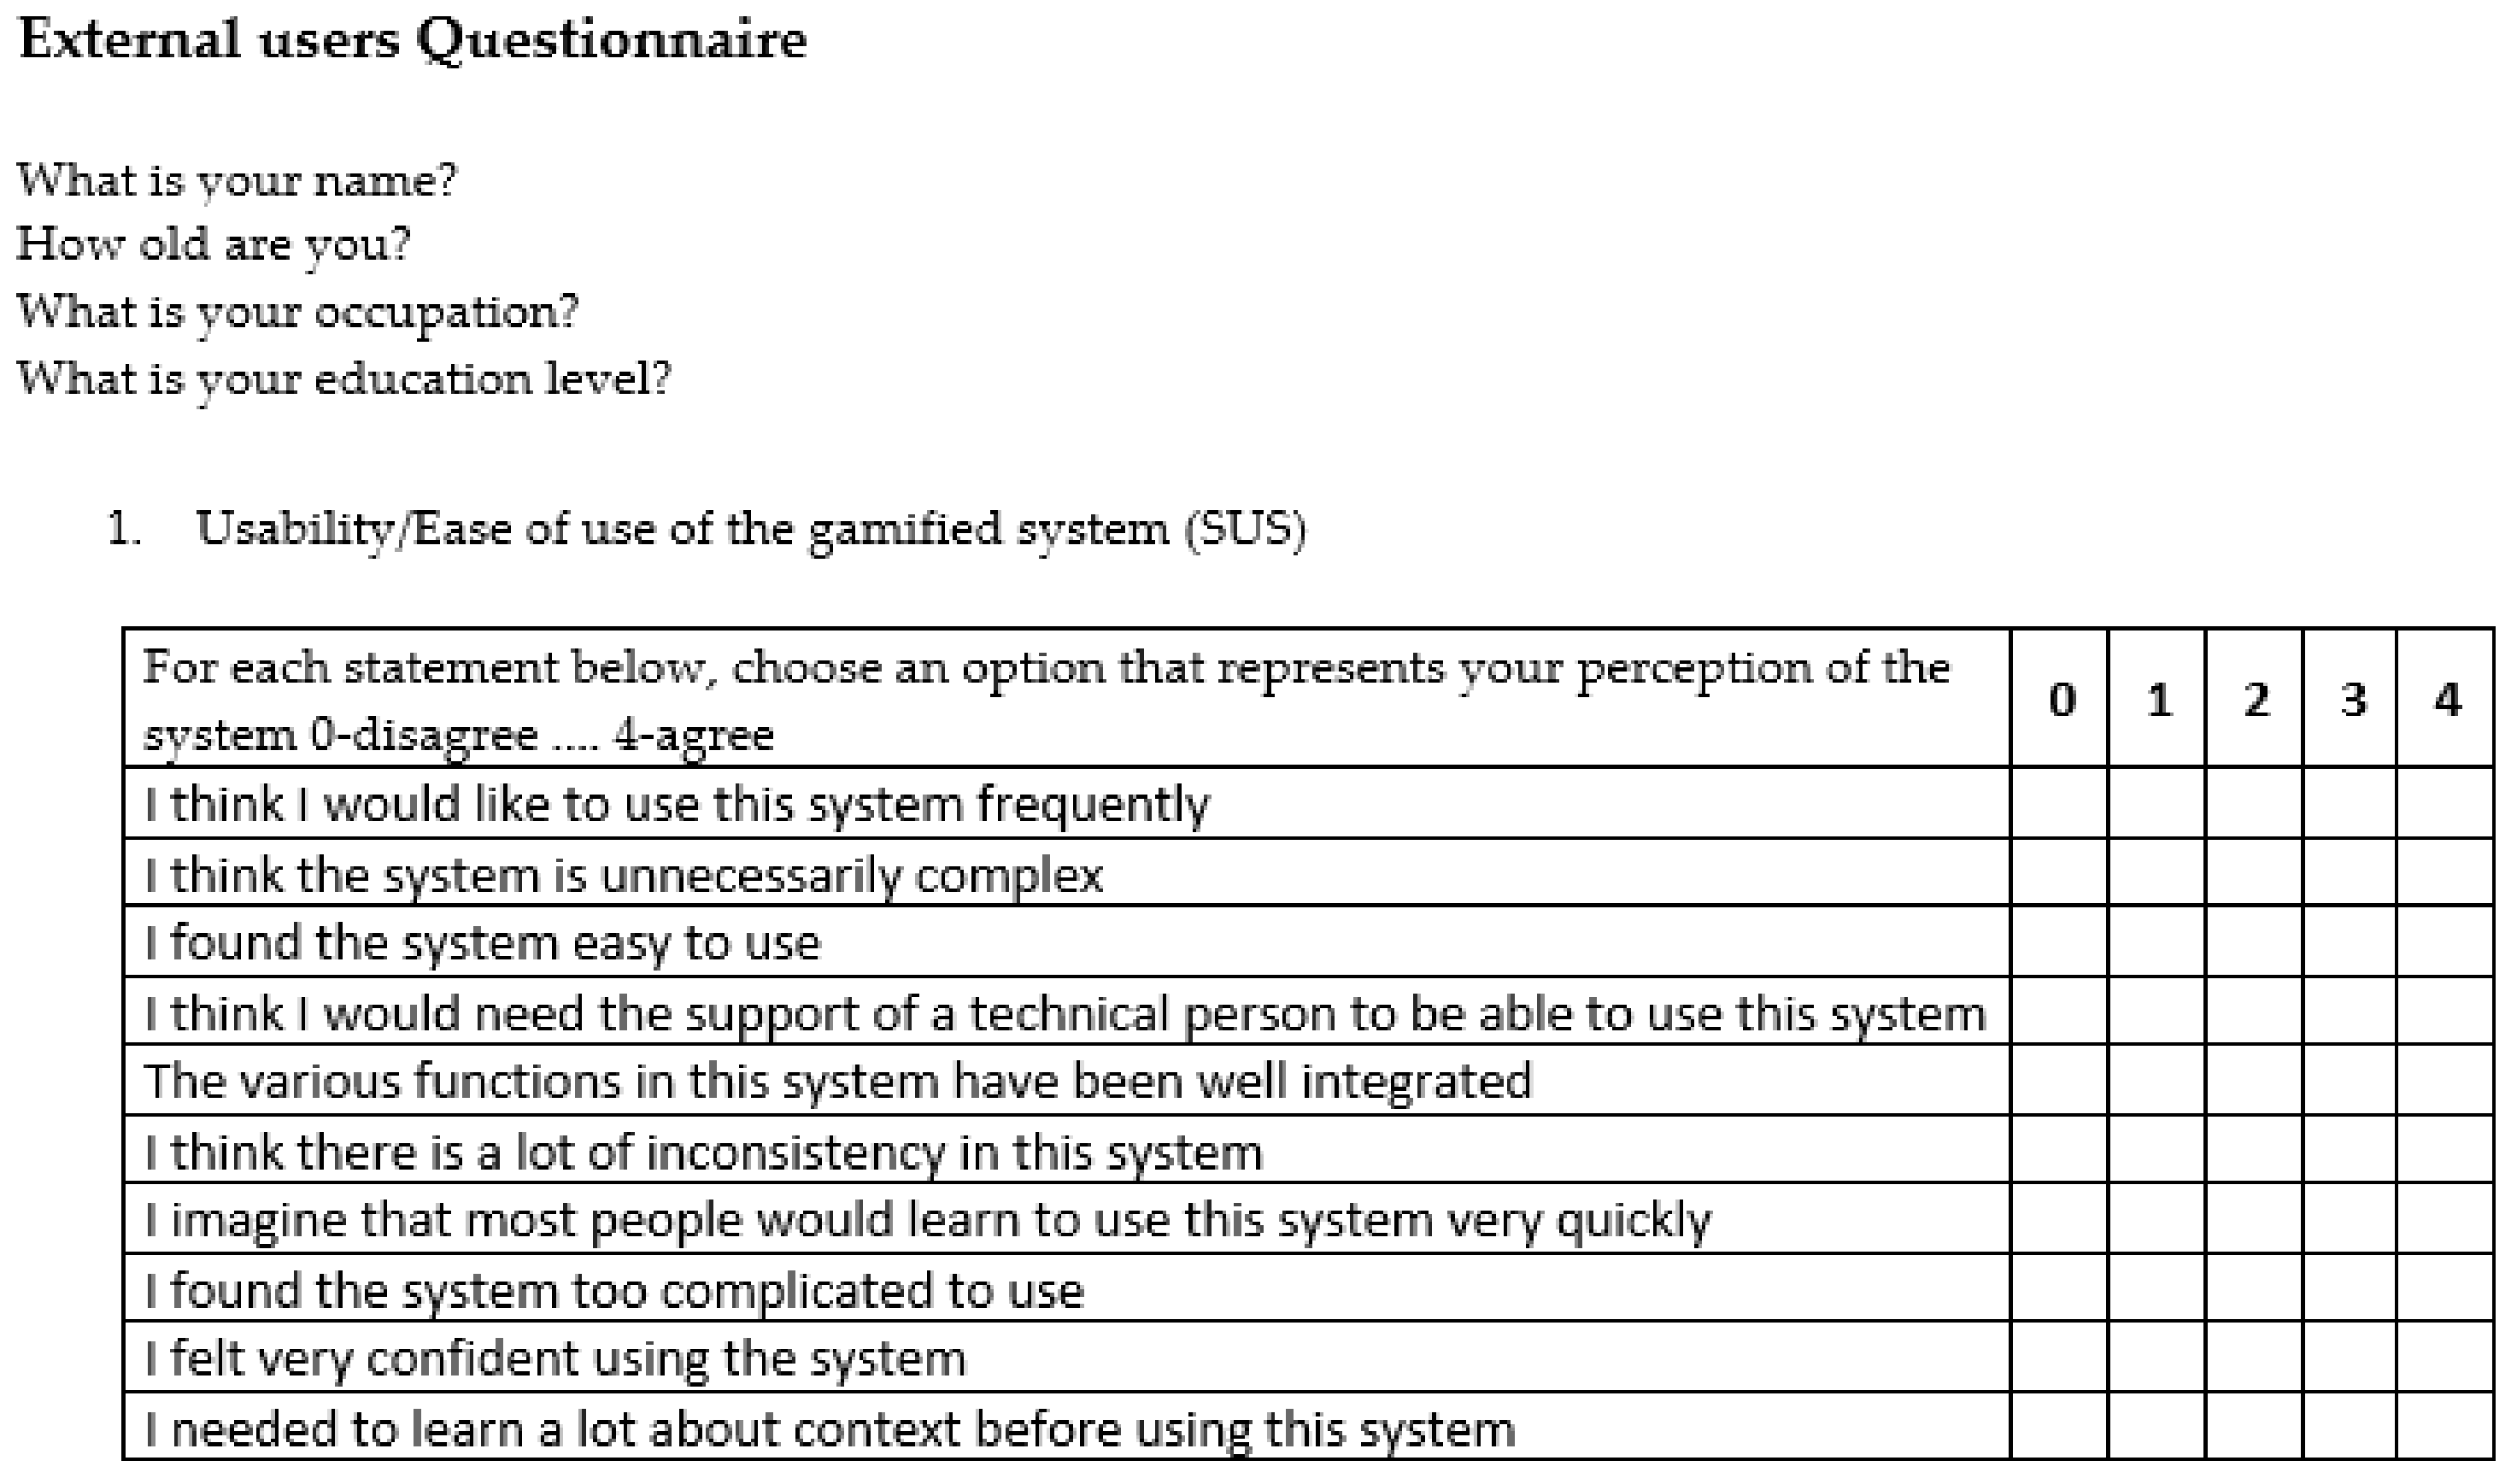
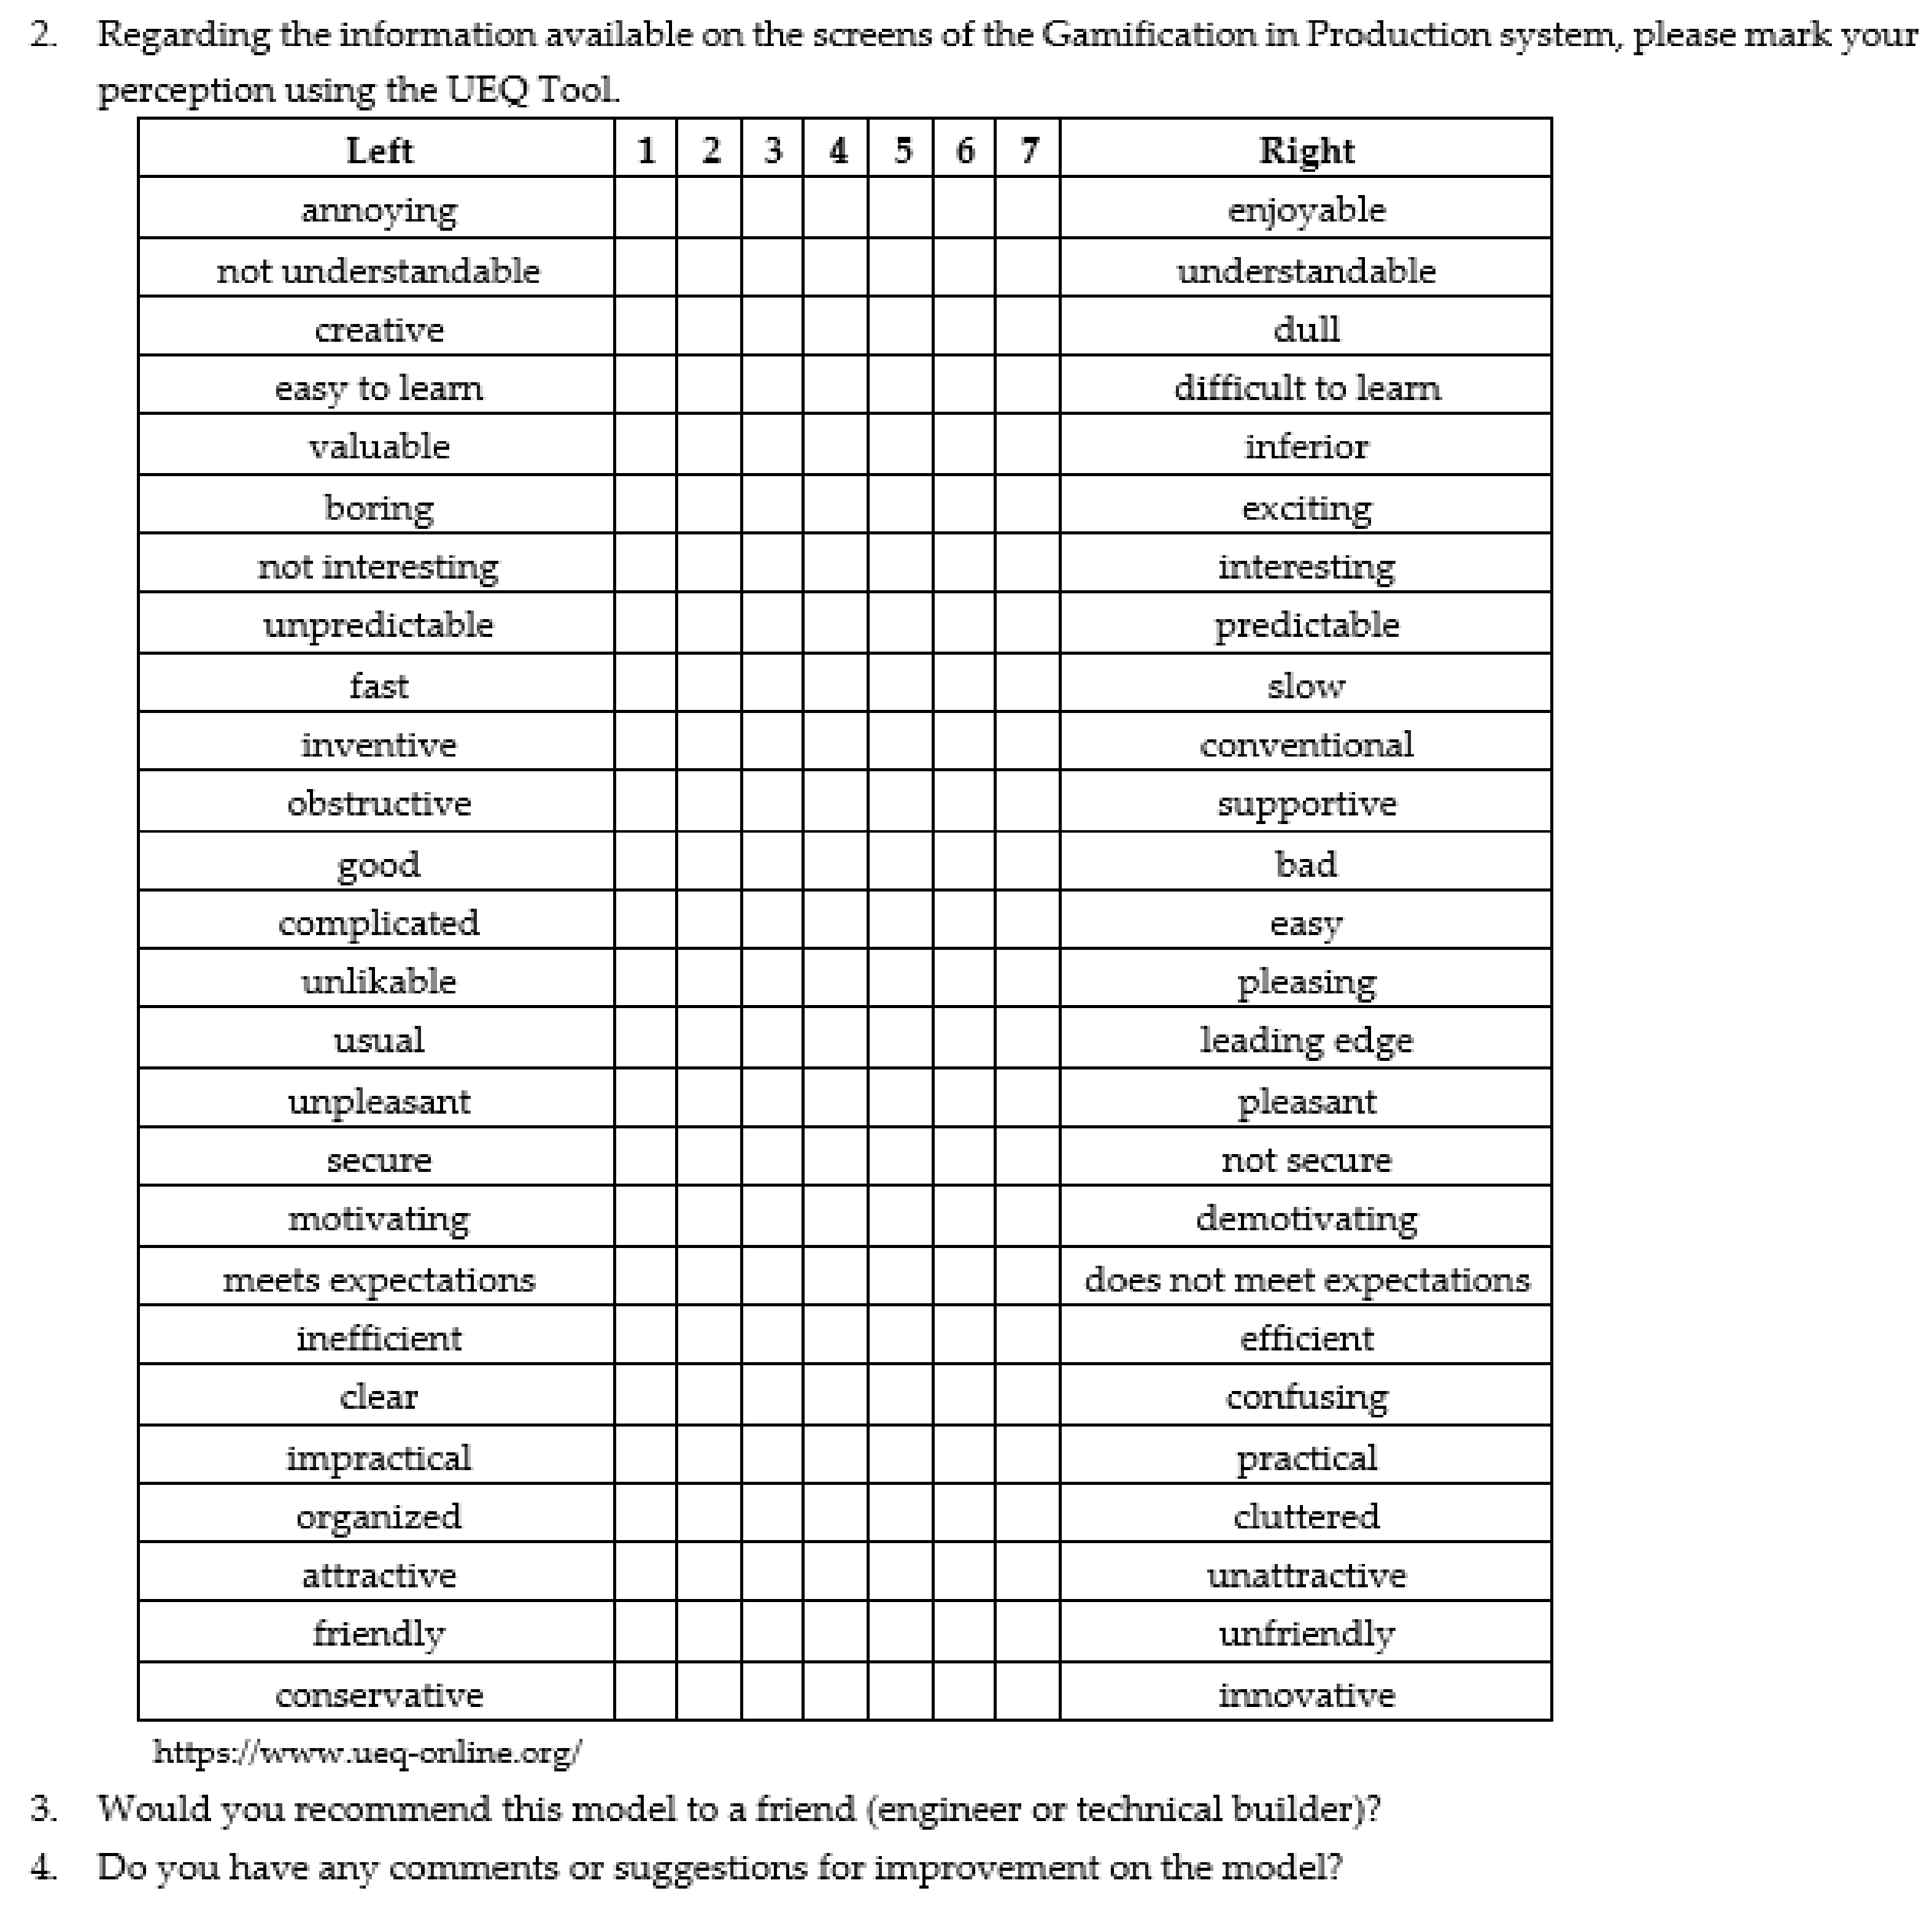
3.2.3. Analysis of the Gamified Model from the Responses of Off-Site Users
4. Final Considerations
Supplementary Materials
Author Contributions
Funding
Institutional Review Board Statement
Informed Consent Statement
Data Availability Statement
Acknowledgments
Conflicts of Interest
Appendix A

Appendix B

Appendix C


References
- Sawhney, A.; Riley, M.; Irizarry, J. Construction 4.0: An Innovation Platform for the Built Environment, 1st ed.; Routledge: London, UK, 2020; 526p. [Google Scholar]
- Tezel, A.; Koskela, L.; Tzortzopoulos, P. Visual management in production management: A literature synthesis. JMTM 2016, 27, 766–799. [Google Scholar] [CrossRef]
- Brady, D.; Tzortzopoulos, P.; Rooke, J.; Formoso, C.; Tezel, A. Improving transparency in construction management: A visual planning and control model. Eng. Constr. Archit. Manag. 2018, 25, 1277–1297. [Google Scholar] [CrossRef] [Green Version]
- Mariz, R.; Galvao, E.; Picchi, F.; Melo, R.; Barcelos, M. Daily management application in a dam construction project. In Proceedings of the 27th Annual Conference of the International Group for Lean Construction, (IGLC), Dublin, Ireland, 3–5 July 2019; pp. 1425–1434. [Google Scholar] [CrossRef] [Green Version]
- Bascoul, A.; Tommelein, I.; Douthett, D. Visual Management of Daily Construction Site Space Use. Front. Built Environ. 2020, 6, 139. [Google Scholar] [CrossRef]
- Brady, D.A. Using Visual Management to Improve Transparency in Planning and Control in Construction. Ph.D. Thesis, University of Salford, Salford, UK, 2014. [Google Scholar]
- Morêda Neto, H.; Leite, R.; Costa, D.; Durão, F. Visual communication panels for production control using gamification techniques. In Proceedings of the 22nd Anual Conference of the International Group for Lean Construction, Oslo, Norway, 25–27 June 2014; pp. 689–702. [Google Scholar]
- Hamzeh, F.; Ezzeddine, A.; Shehab, L.; Khalife, S.; EL-Samad, G.; Emdanat, S. Early Warning Dashboard for Advanced Construction Planning Metrics. In Proceedings of the Construction Research Congress 2020: Project Management and Controls, Materials, and Contracts, Tempe, AZ, USA, 8–10 March 2020; American Society of Civil Engineers: Reston, VA, USA, 2020; pp. 67–75. [Google Scholar]
- Álvares, J.; Costa, D. Construction progress monitoring using unmanned aerial system and 4D BIM. In Proceedings of the 27th Annual Conference of the International, Dublin, Irlanda, 3–5 July 2019; Group for Lean Construction (IGLC): Dublin, Ireland, 2019; pp. 1445–1456. [Google Scholar]
- Ghossaini, B.; Dehaini, K.; Alruzz, M.; Fakhr Eddine, N.; Hamzeh, F. An Application for Improved Lean Construction Practices. In Proceedings of the 26th Annual Conference of the International, Chennai, India, 16–22 July 2018; González, V.A., Ed.; Group for Lean Construction (IGLC): Chennai, India, 2018; pp. 1195–1205. [Google Scholar] [CrossRef] [Green Version]
- Nascimento, D.; Caiado, R.; Tortorella, G.; Ivson, P.; Meiriño, M. Digital Obeya Room: Exploring the synergies between BIM and lean for visual construction management. Innov. Infrastruct. Solut. 2018, 3, 19. [Google Scholar] [CrossRef]
- Matta, G.; Herrera, R.; Baladrón, C.; Giménez, Z.; Alarcón, L. Using BIM-Based sheets as a visual management tool for on-site instructions: A case study. In Proceedings of the 26th Annual Conference of the International Group for Lean Construction: Evolving Lean Construction Towards Mature Production Management across Cultures and Frontiers, Chennai, India, 16–22 July 2018; pp. 16–22. [Google Scholar]
- Brandalise, F.; Valente, C.; Viana, D.; Formoso, C. Understanding the effectiveness of Visual Management best practices in construction sites. In Proceedings of the 26th Annual Conference of the International, Chennai, India, 16–22 July 2018; González, V.A., Ed.; Group for Lean Construction (IGLC): Chennai, India, 2018; pp. 754–763. [Google Scholar]
- Deterding, S.; Sicart, M.; Nacke, L.; O’hara, K.; Dixon, D. Gamification using game-design elements in non-gaming contexts. In Proceedings of the CHI’11 Extended Abstracts on Human Factors in Computing Systems, Vancouver, BC, Canada, 7–12 May 2011; pp. 2425–2428. [Google Scholar]
- Zichermann, G.; Cunningham, C. Gamification by Design: Implementing Game Mechanics in Web and Mobile Apps, 1st ed.; O’Reilly Media, Inc.: Sebastopol, CA, USA, 2011; 187p. [Google Scholar]
- Kapp, K.M. The Gamification of Learning and Instruction: Game-Based Methods and Strategies for Training and Education, 1st ed.; John Wiley & Sons: Hoboken, NJ, USA, 2012. [Google Scholar]
- Alves, L.; Minho, M.; Diniz, M. Gamificação: Diálogos Com a Educação. 2014. Available online: http://repositoriosenaiba.fieb.org.br/handle/fieb/667 (accessed on 20 May 2019).
- Huotari, K.; Hamari, J. Defining gamification: A service marketing perspective. In Proceedings of the 16th Academic MindTrek Conference, ACM, Tampere, Finland, 3–5 October 2012; pp. 17–22. [Google Scholar]
- Huotari, K.; Hamari, J. A definition for gamification: Anchoring gamification in the service marketing literature. Electron. Mark. 2017, 27, 21–31. [Google Scholar] [CrossRef] [Green Version]
- Leite, R.; Costa, D.; Morêda Neto, H.; Durão, F. Gamification technique for supporting transparency on construction sites: A case study. Eng. Constr. Archit. Manag. 2016, 23, 801–822. [Google Scholar] [CrossRef]
- Khanzadi, M.; Shahbazi, M.; Arashpour, M.; Ghosh, S. Lean design management using a gamified system. Sci. Iran. 2019, 26, 15–25. [Google Scholar] [CrossRef] [Green Version]
- Selin, J.; Rossi, M. The Functional Design Method for Public Buildings Together with Gamification of Information Models Enables Smart Planning by Crowdsourcing and Simulation and Learning of Rescue Environments. In Proceedings of the SAI Intelligent Systems Conference, London, UK, 3–4 September 2020; Springer: Cham, Switzerland, 2020; pp. 567–587. [Google Scholar]
- Schlemmer, E. Projetos de aprendizagem gamificados: Uma metodologia inventiva para a educação na cultura híbrida e multimodal. Momento-Diálogos Educ. 2018, 27, 42–69. [Google Scholar] [CrossRef]
- Chou, Y. Actionable Gamification: Beyond Points, Badges, and Leaderboards; Packt Publishing Ltd.: Birmingham, UK, 2019; 145p. [Google Scholar]
- Alves, L.; Souza, M. Westworld: Entre no Jogo. In Tecnologias Digitais, Redes e Educação: Perspectivas Contemporâneas, 1st ed.; Sales, M.V.S., Ed.; Edufba: Salvador, Brazil, 2020; pp. 20–55. [Google Scholar]
- Hevner, A.; March, S.; Park, J.; Ram, S. Design science in information systems research. MIS Q. 2004, 1, 75–105. [Google Scholar] [CrossRef] [Green Version]
- Dresch, A.; Lacerda, D.; Júnior, J. Design Science Research: Método de Pesquisa Para Avanço da Ciência e Tecnologia; Bookman Editora: Porto Alegre, Brasil, 2015; 204p. [Google Scholar]
- Lacerda, D.; Dresch, A.; Proença, A.; Antunes Júnior, J. Design Science Research: Método de pesquisa para a engenharia de produção. Gestão Produção 2013, 20, 741–761. [Google Scholar] [CrossRef] [Green Version]
- Lukka, K. The Constructive Research Approaches. Case Study Res. Logistics. Publ. Turku Sch. Econ. Bus. Adm. Ser. B 2003, 1, 83–101. [Google Scholar]
- Hinderks, A.; Schrepp, M.; Thomaschewski, J. A Benchmark for the Short Version of the User Experience Questionnaire. In Proceedings of the 14th International Conference on Web Information Systems and Technologies (WEBIST 2018), Setúbal, Portugal, 23 September 2018; pp. 373–377. [Google Scholar]
- Cota, M.; Thomaschewski, J.; Schrepp, M.; Gonçalves, R. Efficient Measurement of the User Experience. Procedia Comput. Sci. 2014, 27, 491–498. [Google Scholar] [CrossRef] [Green Version]
- Moura Junior, R. Práticas Colaborativas Gamificadas Para Prevenir Lesões Por Pressão. Ph.D. Thesis, Federal University of Bahia, Salvador Bahia, Brasil, 2020. [Google Scholar]
- Brooke, J. SUS: A retrospective. J. Usability Stud. 2013, 8, 29–40. [Google Scholar]
- Moreira, J.; Schlemmer, E. Por um novo conceito e paradigma de educação digital onlife. Rev. Ufg 2020, 20. [Google Scholar] [CrossRef]
- Subhav, S.; Kaushal, K. A study of lean construction and visual management tools through cluster analysis. Ain Shams Eng. J. 2021, 12, 1153–1162. [Google Scholar] [CrossRef]
- Pérez, C.; Costa, D.; Irizarry, J. Algoritmos genéticos: Uma abordagem visual para reduzir as perdas por transporte em canteiros de obra. In Proceedings of the Encontro Nacional de Tecnologia do Ambiente Construído, Porto Alegre, Brazil, 8 December 2020; pp. 1–8. [Google Scholar]
- Pérez, C.; Costa, D. Increasing production efficiency through the reduction of transportation activities and time using 4D BIM simulations. Eng. Constr. Archit. Manag. 2021, 28, 2222–2247. [Google Scholar] [CrossRef]


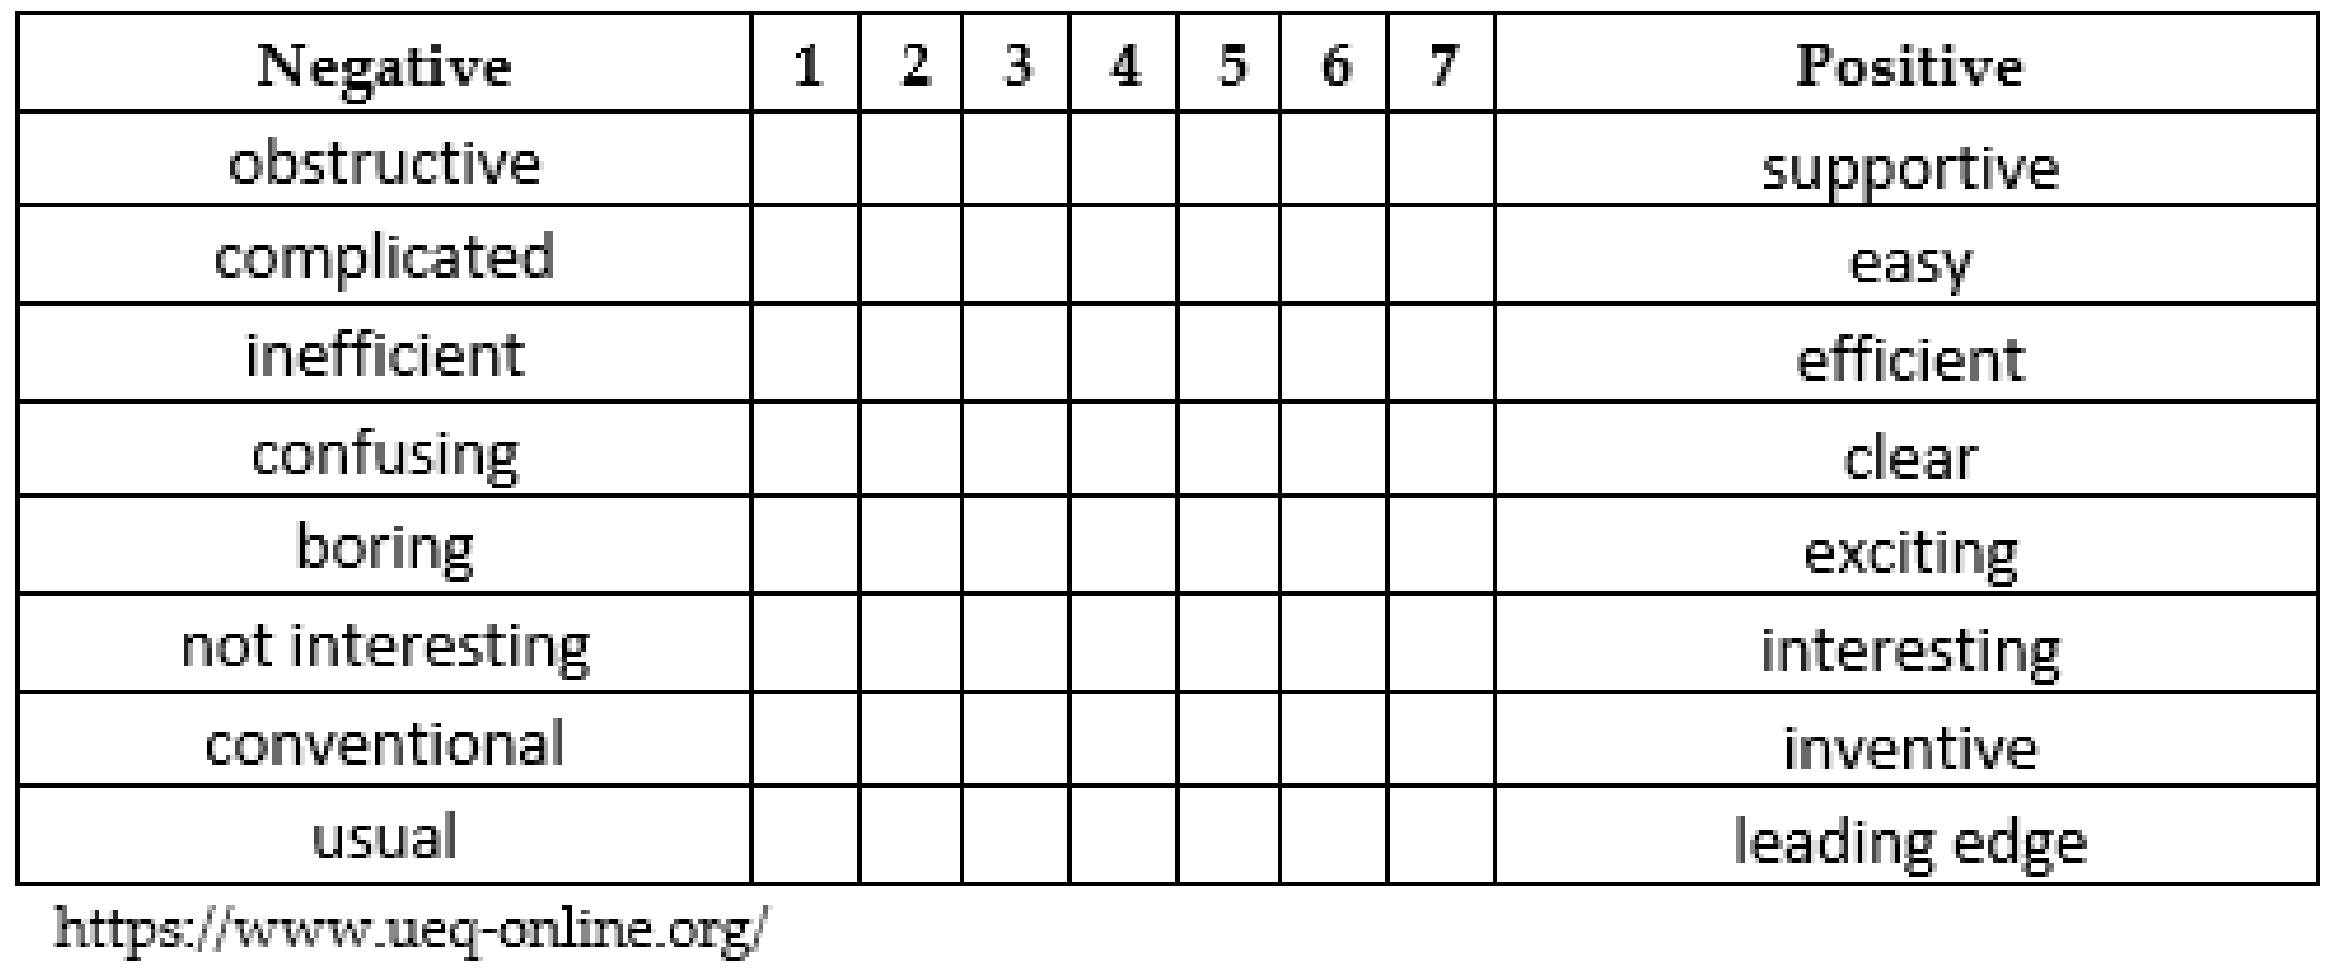
| Item | Mean | Variance | Std. Dev. | No. | Negative | Positive | Scale |
|---|---|---|---|---|---|---|---|
| 1 | 2.5 | 0.5 | 0.7 | 10 | obstructive | supportive | Pragmatic Quality |
| 2 | 3 | 0 | 0 | 10 | complicated | easy | Pragmatic Quality |
| 3 | 3 | 0 | 0 | 10 | inefficient | efficient | Pragmatic Quality |
| 4 | 2.7 | 0.9 | 0.9 | 10 | confusing | clear | Pragmatic Quality |
| 5 | 2 | 1.6 | 1.2 | 10 | boring | exciting | Hedonic Quality |
| 6 | 2.9 | 0.1 | 0.3 | 10 | not interesting | interesting | Hedonic Quality |
| 7 | 2.3 | 3.6 | 1.9 | 10 | conventional | inventive | Hedonic Quality |
| 8 | 2.2 | 3.5 | 1.9 | 10 | usual | leading edge | Hedonic Quality |
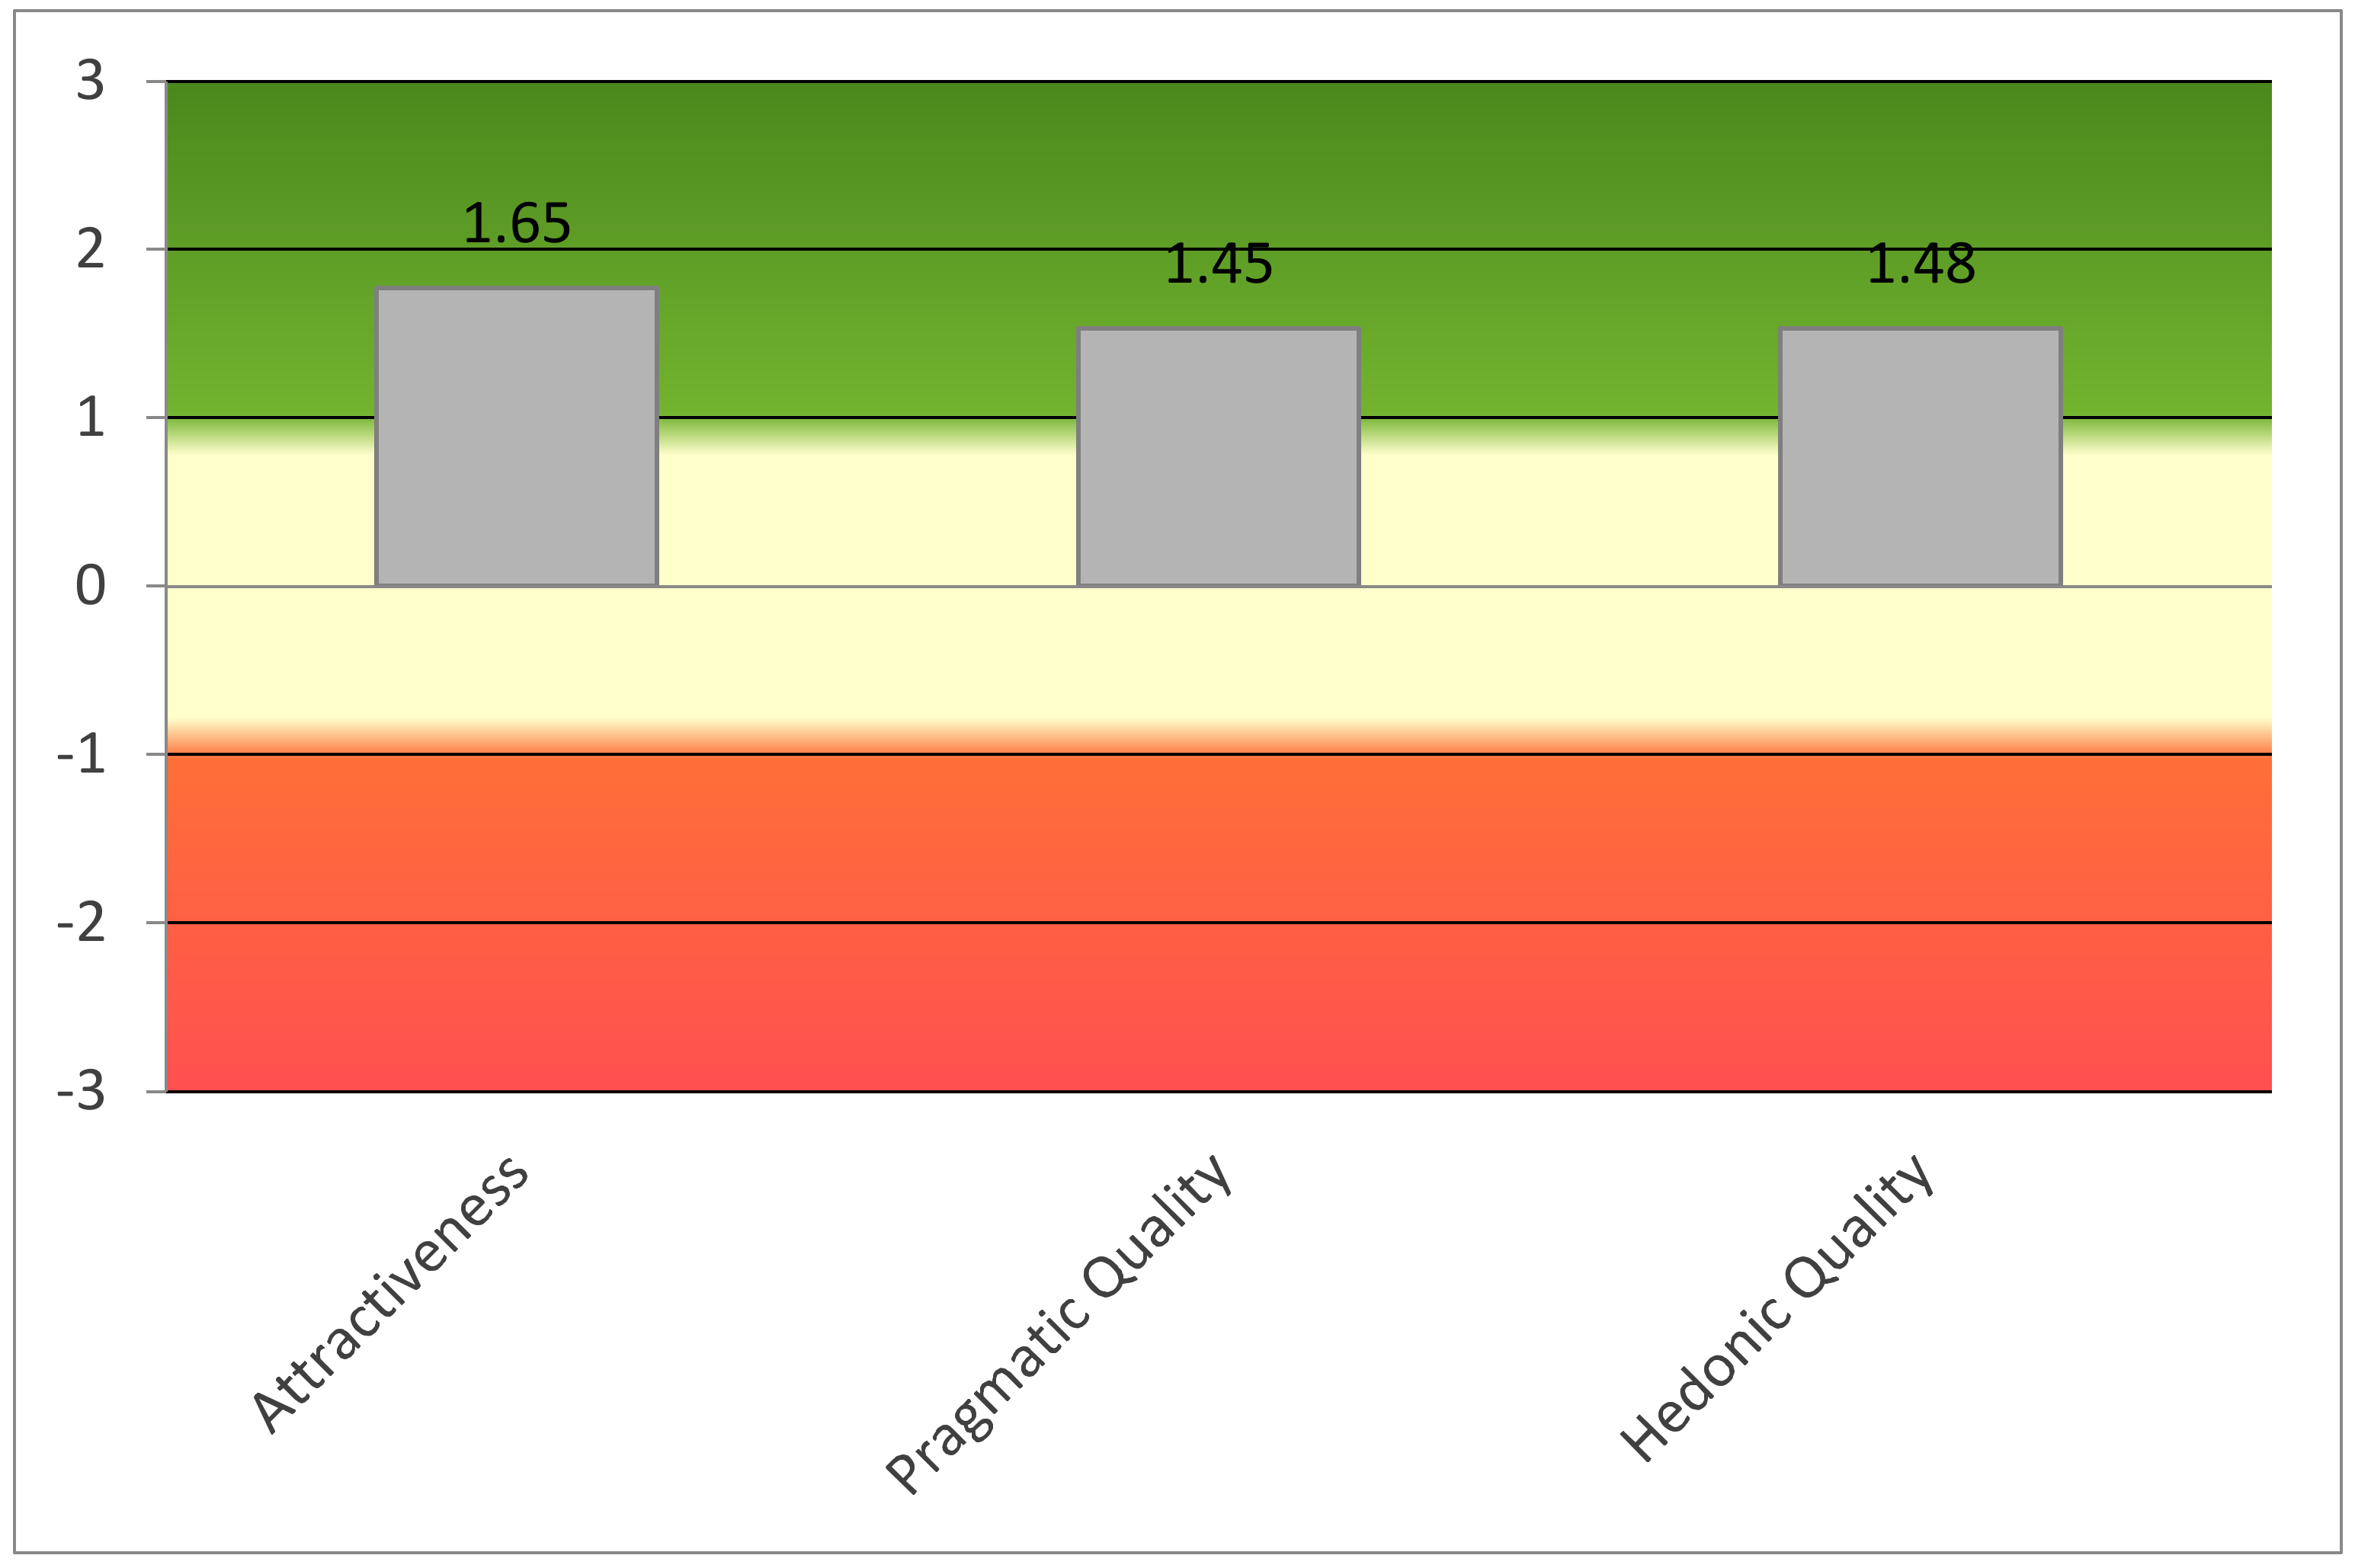
| Scale | Mean | Comparison to Benchmark | Interpretation |
|---|---|---|---|
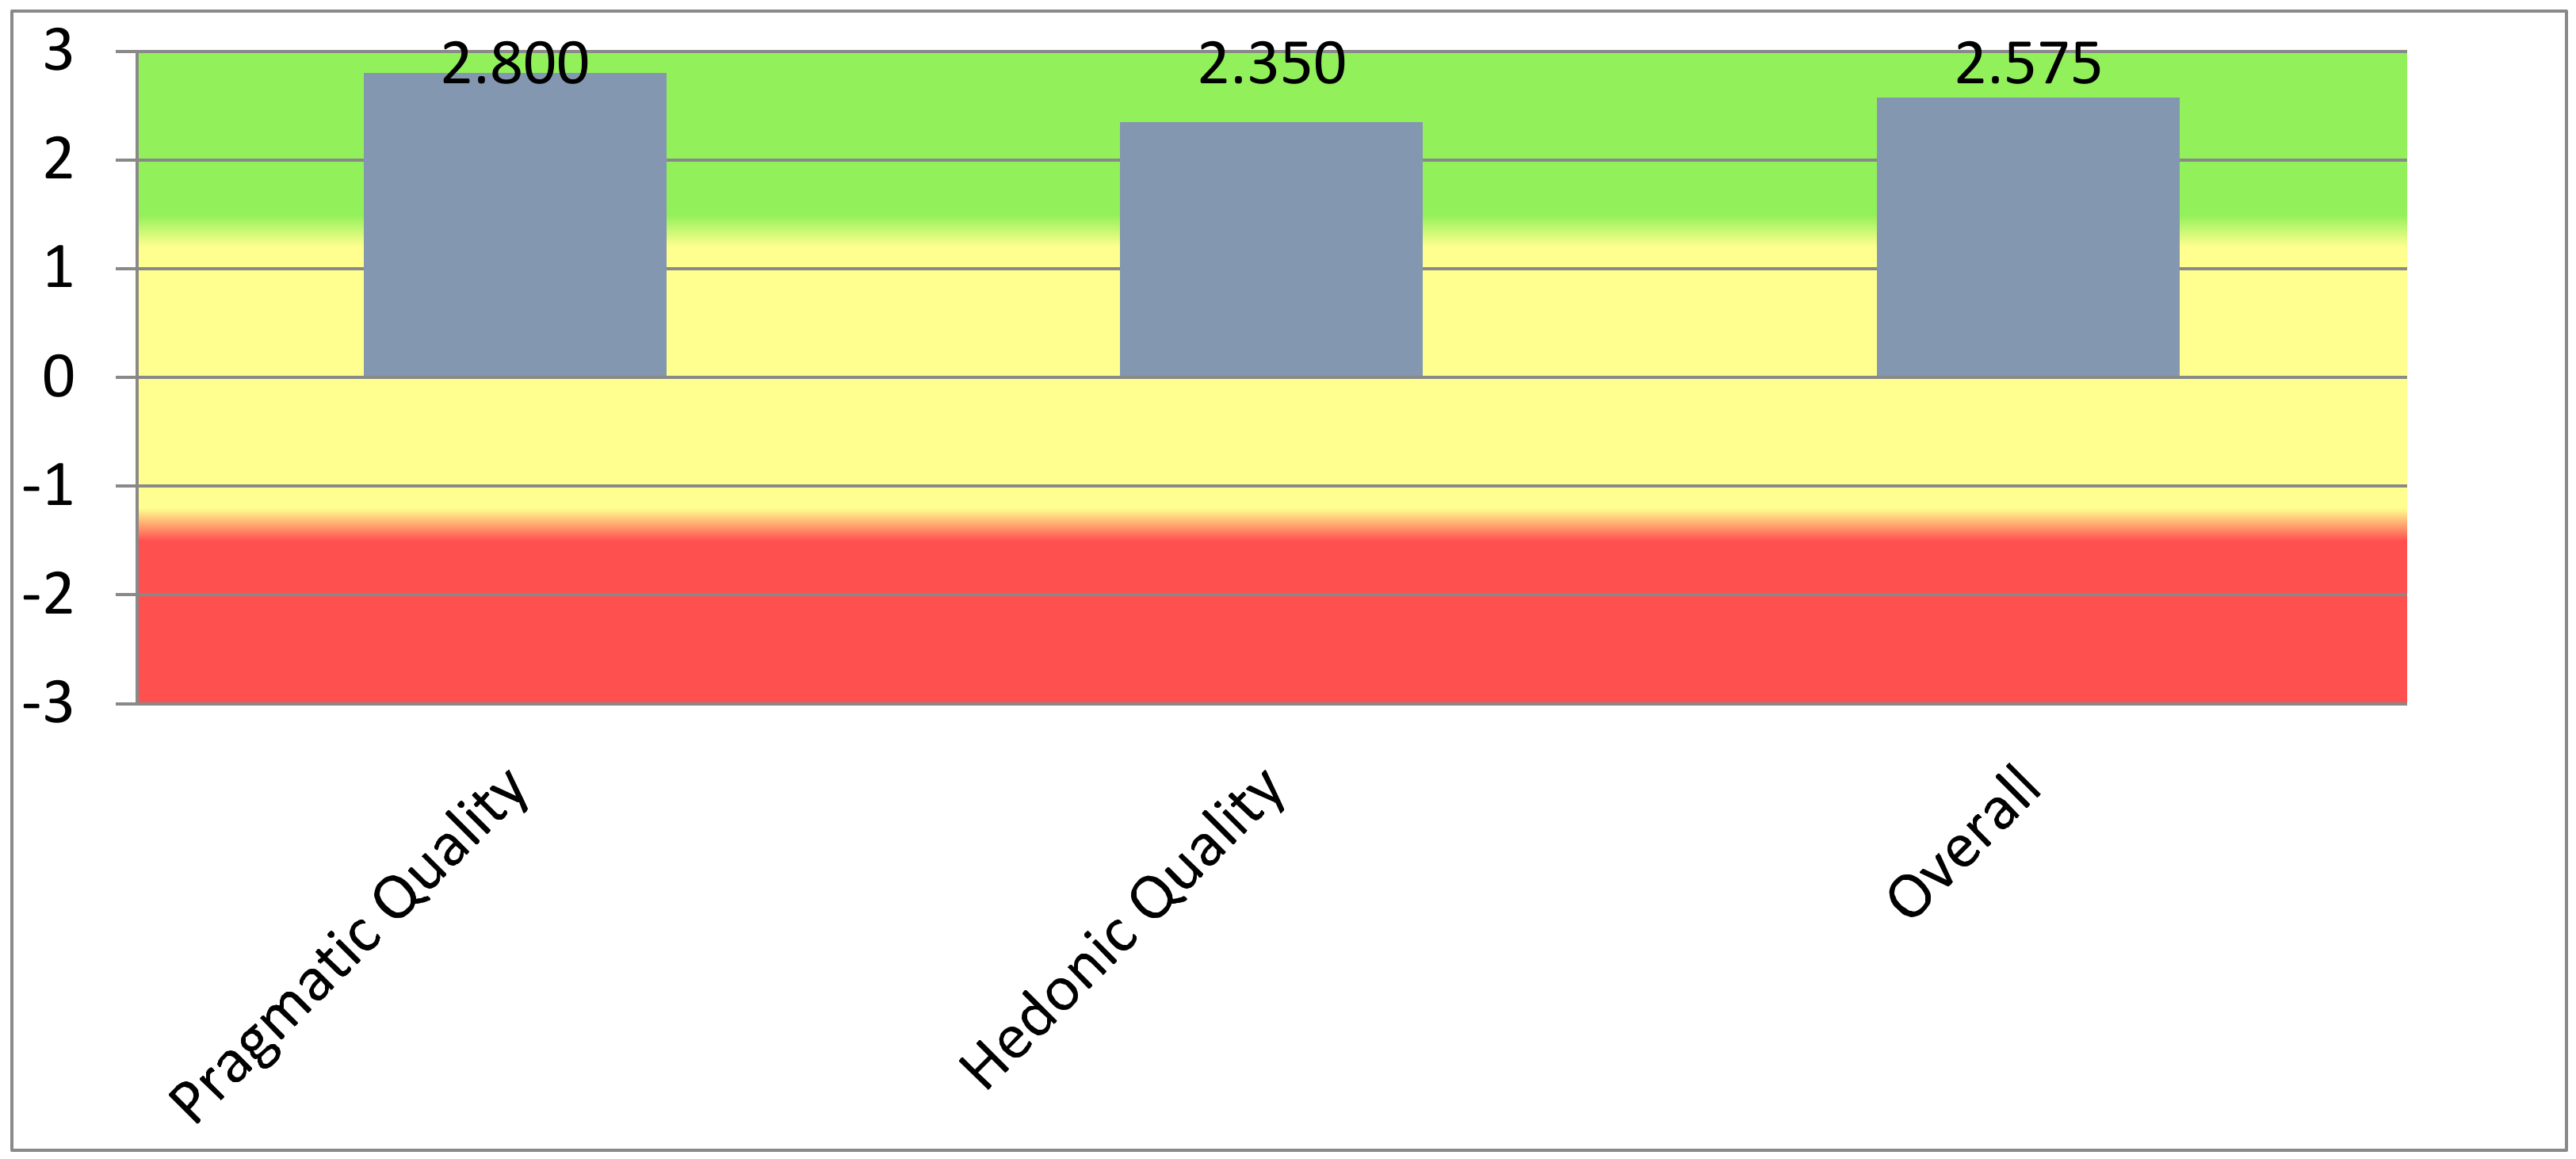
| Pragmatic Quality | 2.80 | Excellent | In the range of the 10% best results |
| Hedonic Quality | 2.35 | Excellent | In the range of the 10% best results |
| Overall | 2.58 | Excellent | In the range of the 10% best results |
| Item | Mean | Variance | Std. Dev. | No. | Negative | Positive | Scale |
|---|---|---|---|---|---|---|---|
| 1 | 1.8 | 2.5 | 1.6 | 15 | obstructive | supportive | Pragmatic Quality |
| 2 | 2.0 | 1.4 | 1.2 | 15 | complicated | easy | Pragmatic Quality |
| 3 | 2.2 | 0.5 | 0.7 | 15 | inefficient | efficient | Pragmatic Quality |
| 4 | 2.1 | 0.9 | 1.0 | 15 | confusing | clear | Pragmatic Quality |
| 5 | 2.2 | 0.5 | 0.7 | 15 | boring | exciting | Hedonic Quality |
| 6 | 2.6 | 0.4 | 0.6 | 15 | not interesting | interesting | Hedonic Quality |
| 7 | 2.6 | 0.5 | 0.7 | 15 | conventional | inventive | Hedonic Quality |
| 8 | 2.3 | 1.1 | 1.0 | 15 | usual | leading edge | Hedonic Quality |
| Scale | Mean | Comparison to Benchmark | Interpretation |
|---|---|---|---|
| Pragmatic Quality | 2.02 | Excellent | In the range of the 10% best results |
| Hedonic Quality | 2.42 | Excellent | In the range of the 10% best results |
| Overall | 2.22 | Excellent | In the range of the 10% best results |
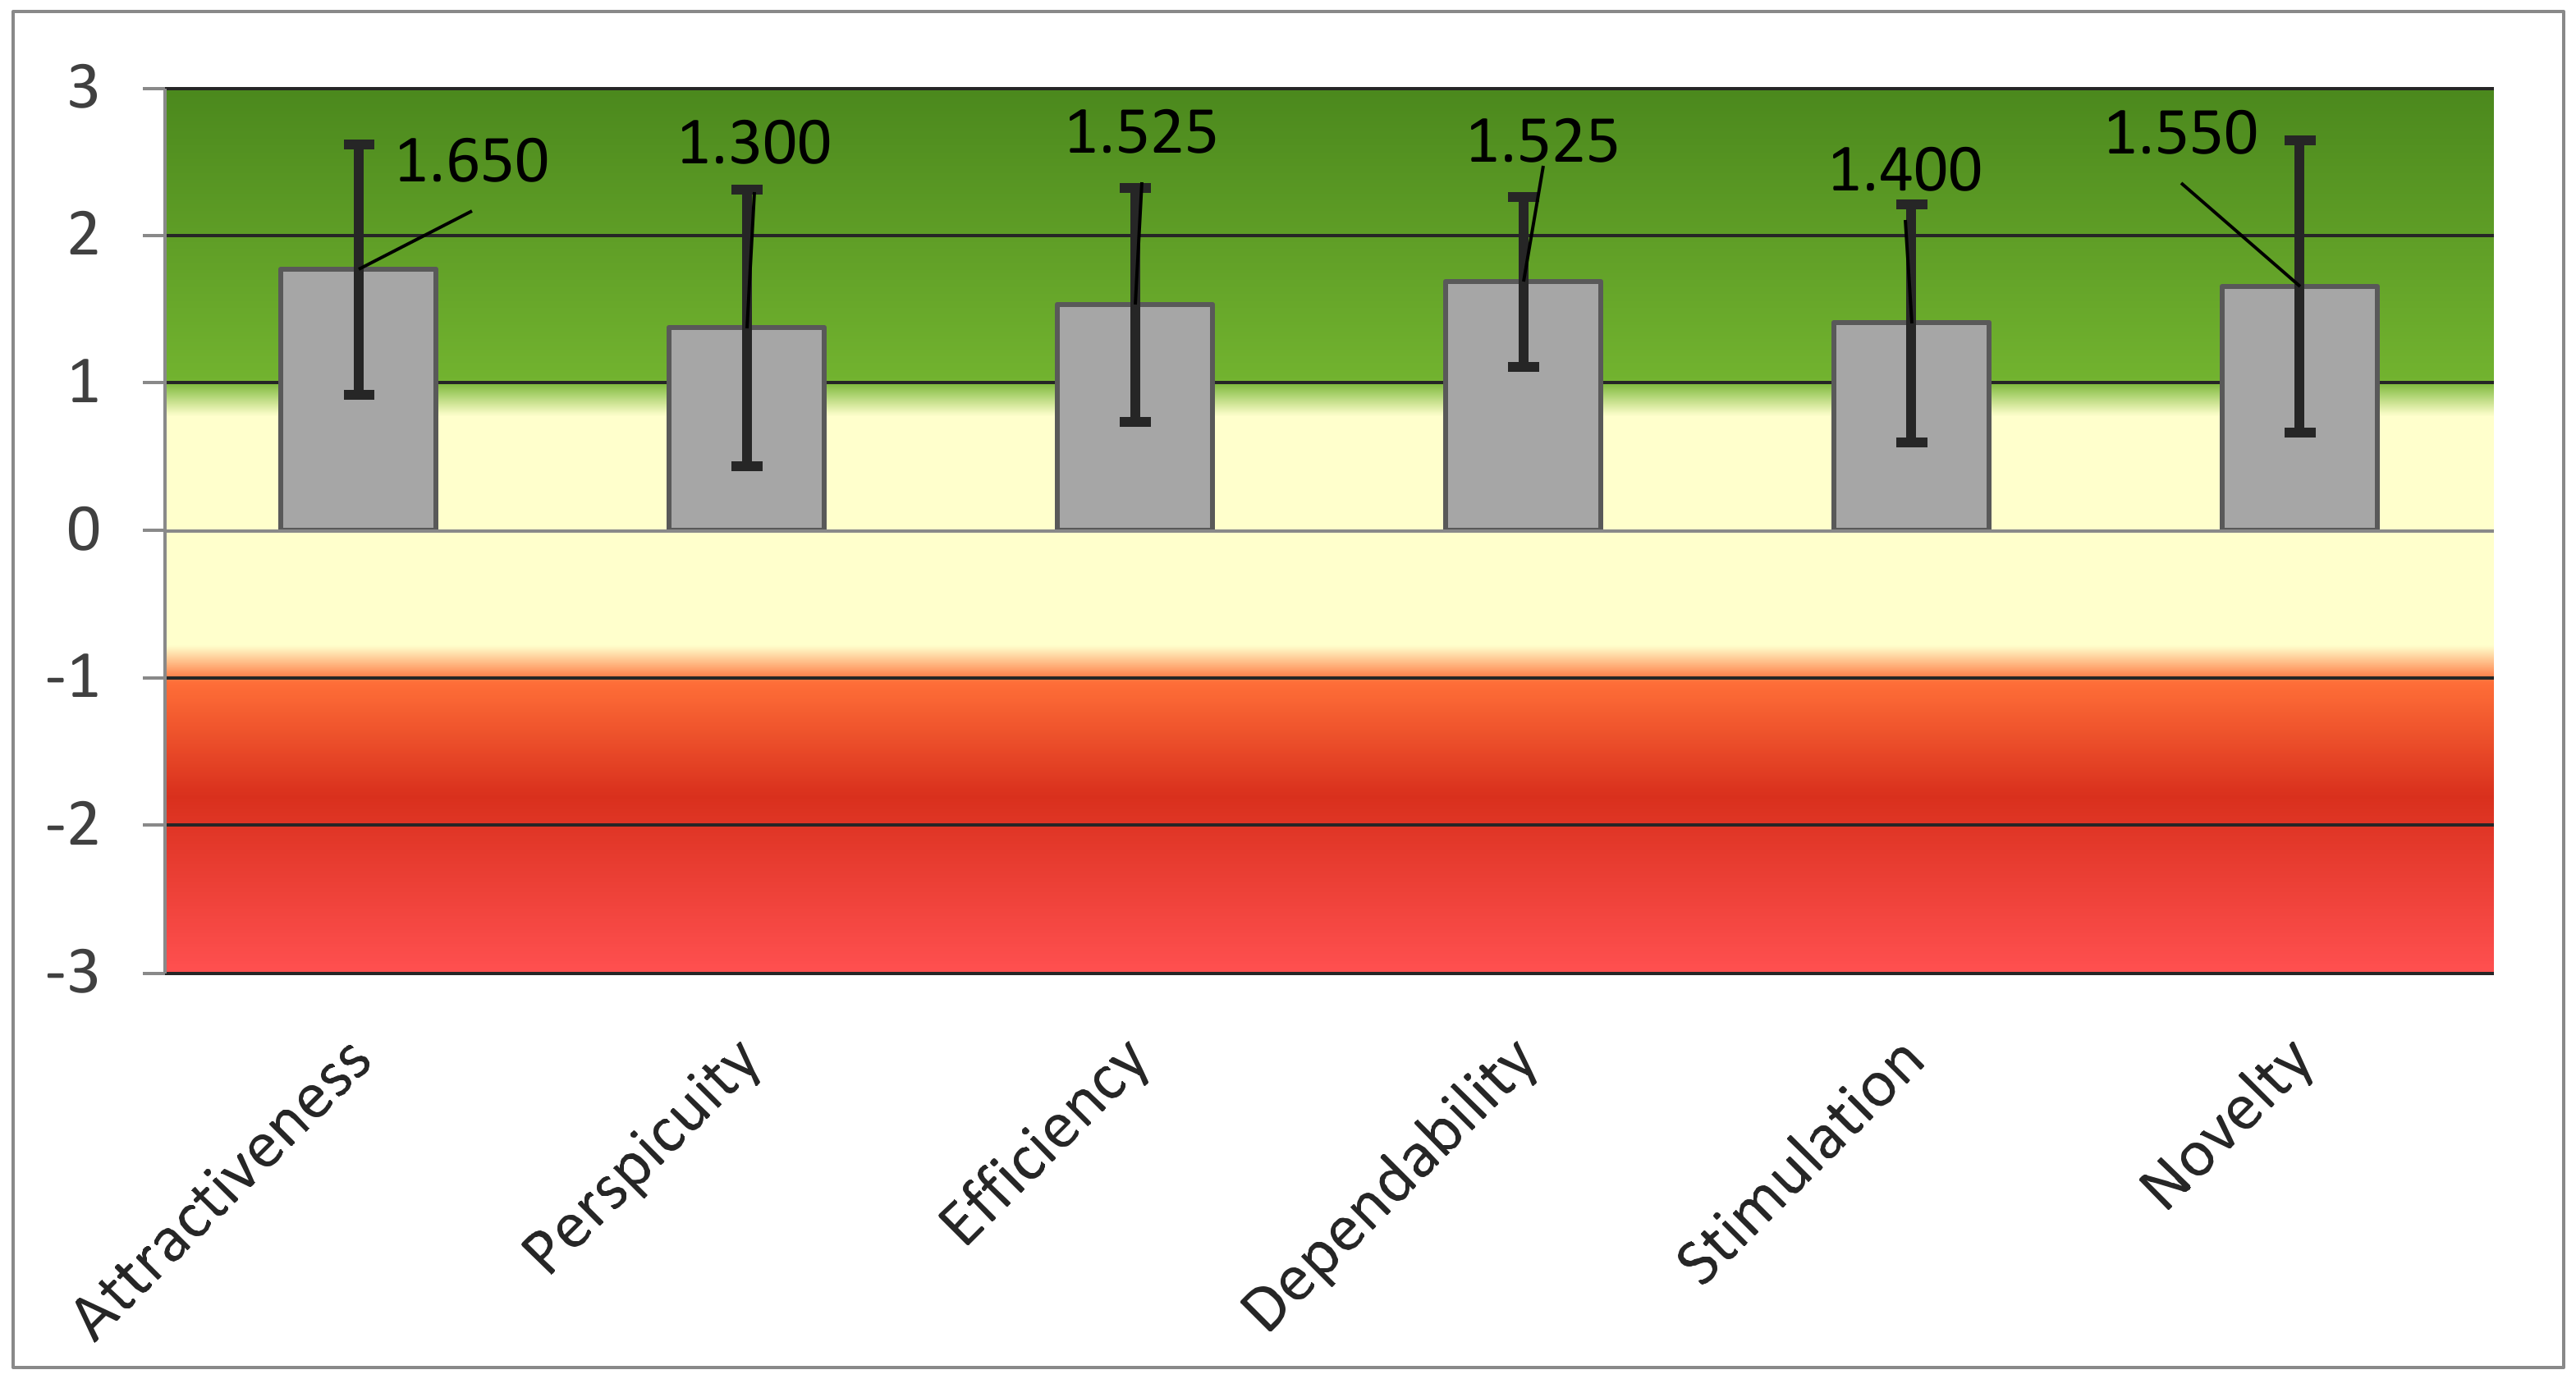
| Item | Mean | Variance | Std. Dev. | No. | Left | Right | Scale |
|---|---|---|---|---|---|---|---|
| 1 | 2.1 | 1.0 | 1.0 | 10 | annoying | enjoyable | Attractiveness |
| 2 | 1.4 | 4.0 | 2.0 | 10 | not understandable | understandable | Perspicuity |
| 3 | 0.0 | 7.1 | 2.7 | 10 | creative | dull | Novelty |
| 4 | 1.0 | 4.9 | 2.2 | 10 | easy to learn | difficult to learn | Perspicuity |
| 5 | 0.5 | 6.1 | 2.5 | 10 | valuable | inferior | Stimulation |
| 6 | 1.8 | 0.8 | 0.9 | 10 | boring | exciting | Stimulation |
| 7 | 2.4 | 0.5 | 0.7 | 10 | not interesting | interesting | Stimulation |
| 8 | 1.1 | 0.8 | 0.9 | 10 | unpredictable | predictable | Dependability |
| 9 | 0.4 | 7.2 | 2.7 | 10 | fast | slow | Efficiency |
| 10 | 1.3 | 7.6 | 2.8 | 10 | inventive | conventional | Novelty |
| 11 | 2.4 | 0.9 | 1.0 | 10 | obstructive | supportive | Dependability |
| 12 | 1.1 | 7.0 | 2.6 | 10 | good | bad | Attractiveness |
| 13 | 2.2 | 1.5 | 1.2 | 10 | complicated | easy | Perspicuity |
| 14 | 2.4 | 0.5 | 0.7 | 10 | unlikable | pleasing | Attractiveness |
| 15 | 2.1 | 1.4 | 1.2 | 10 | usual | leading edge | Novelty |
| 16 | 1.9 | 1.7 | 1.3 | 10 | unpleasant | pleasant | Attractiveness |
| 17 | 1.1 | 4.3 | 2.1 | 10 | secure | not secure | Dependability |
| 18 | 0.9 | 6.5 | 2.6 | 10 | motivating | demotivating | Stimulation |
| 19 | 1.5 | 4.9 | 2.2 | 10 | meets expectations | does not meet expectations | Dependability |
| 20 | 2.0 | 1.6 | 1.2 | 10 | inefficient | efficient | Efficiency |
| 21 | 0.6 | 4.3 | 2.1 | 10 | clear | confusing | Perspicuity |
| 22 | 2.2 | 1.1 | 1.0 | 10 | impractical | practical | Efficiency |
| 23 | 1.5 | 3.6 | 1.9 | 10 | organized | cluttered | Efficiency |
| 24 | 1.1 | 3.0 | 1.7 | 10 | attractive | unattractive | Attractiveness |
| 25 | 1.3 | 6.0 | 2.5 | 10 | friendly | unfriendly | Attractiveness |
| 26 | 2.8 | 0.2 | 0.4 | 10 | conservative | innovative | Novelty |
| Scale | Mean | Comparison to Benchmark | Interpretation |
|---|---|---|---|
| Attractiveness | 1.65 | Good | 10% of results better, 75% of results worse |
| Perspicuity | 1.30 | Above Average | 25% of results better, 50% of results worse |
| Efficiency | 1.53 | Good | 10% of results better, 75% of results worse |
| Dependability | 1.53 | Good | 10% of results better, 75% of results worse |
| Stimulation | 1.40 | Good | 10% of results better, 75% of results worse |
| Novelty | 1.55 | Good | 10% of results better, 75% of results worse |
Publisher’s Note: MDPI stays neutral with regard to jurisdictional claims in published maps and institutional affiliations. |
© 2022 by the authors. Licensee MDPI, Basel, Switzerland. This article is an open access article distributed under the terms and conditions of the Creative Commons Attribution (CC BY) license (https://creativecommons.org/licenses/by/4.0/).
Share and Cite
Leite, R.M.C.; Winkler, I.; Alves, L.R.G. Visual Management and Gamification: An Innovation for Disseminating Information about Production to Construction Professionals. Appl. Sci. 2022, 12, 5682. https://doi.org/10.3390/app12115682
Leite RMC, Winkler I, Alves LRG. Visual Management and Gamification: An Innovation for Disseminating Information about Production to Construction Professionals. Applied Sciences. 2022; 12(11):5682. https://doi.org/10.3390/app12115682
Chicago/Turabian StyleLeite, Regina Maria Cunha, Ingrid Winkler, and Lynn Rosalina Gama Alves. 2022. "Visual Management and Gamification: An Innovation for Disseminating Information about Production to Construction Professionals" Applied Sciences 12, no. 11: 5682. https://doi.org/10.3390/app12115682
APA StyleLeite, R. M. C., Winkler, I., & Alves, L. R. G. (2022). Visual Management and Gamification: An Innovation for Disseminating Information about Production to Construction Professionals. Applied Sciences, 12(11), 5682. https://doi.org/10.3390/app12115682