Abstract
In the Egyptian deserts, new land reclamation projects have been recently established to meet the increasing-population growth rate and food demand. These projects mainly depend on the different groundwater aquifers. El-Farafra Oasis is one of the “1.5-million-feddan reclamation project” areas recently established in the Western Desert of Egypt where the only available water source is the world’s largest fossil freshwater reservoir “the Nubian Sandstone Aquifer System (NSAS)”. Groundwater-dependent springs, and their artificial counterpart “drilled wells”, are reliable water systems throughout the world. In the present study, hydrochemical parameters were collected in 2015 from 16 different springs and wells of the El-Farafra Oasis, and analyzed using the different water quality indices. The calculated water quality index (WQI), its correlations with the water quality parameters Gibbs, Piper, US Salinity-Lab Staff and Wilcox diagrams, and Principal Component Analysis (PCA) were used to evaluate the groundwater suitability for human drinking and irrigation purposes. WQI values revealed good-to-excellent groundwater quality for human drinking. In addition, the spring and well water samples investigated showed good indices for irrigation activities. Gibbs and Piper’s diagrams were presented, with most samples falling into the rock-dominance category, and belonging to hydrogeochemical facies determining the following water types: Mg(HCO3)2 type water (37.5% of the samples), no dominant ions (mixed water-type category; Ca/MgCl2) (50% of the samples), and, finally, NaCl water type (the remaining 12.5%). The groundwater chemistry in the study area is mainly controlled by rock-water interactions, particularly the dissolution of carbonate rocks and silicate weathering. The elevated nutrient concentrations, in particular nitrates, are most likely due to agricultural activities, indicating substantial anthropogenic activities in the area studied.
1. Introduction
Groundwater, the huge water reservoir beneath the Earth’s surface, is a key source for humans and ecosystems around the world [1,2]. More than a third of the world’s water uses originates from underground aquifers. When surface water supply from rivers and reservoirs is insufficient, groundwater is important for preserving the global ecosystem and supporting human demands for drinking purposes and farming practices in mid-latitude dry and semiarid regions [3]. Groundwater demand is rapidly rising in line with population growth, and climate change is putting further pressure on water resources and raising the risk of extreme drought incidence [4,5].
Groundwater flow systems are affected by climate change in a variety of ways [1,6]. Climate change can influence direct recharge to groundwater by modifying the proportion of surface runoff concerning infiltration. Furthermore, rising temperatures increase evaporative demand over land, limiting the quantity of water available to direct recharge [7]. Anthropogenic effects on groundwater resources are mostly attributable to groundwater extraction, as well as to indirect effects via irrigation and land-use changes [8]. However, groundwater flow systems have proved to be outstandingly resilient to natural climate change, as demonstrated by fossil aquifers throughout the planet, nowadays discharging in an arid environment and replenished in pluvial conditions, no more active nowadays [9].
Egypt’s conventional water is supplied by the Nile River, accounting for 93% of the country’s water demand and supplying roughly 55.5 km3 of water annually. Egypt’s annual water demand stands at 81.3 km3, with agriculture consuming 86%, industry using 2.5%, and households using 11.5% [10,11,12]. There is a huge gap between the water demand and availability, which is fulfilled by the exploitation of aquifers and wastewater [13,14]. Another difficulty faced by Egypt’s water resources system is the unpredictability of climate change effects [13]. Egypt is also confronted with significant issues as a result of its limited water supplies and continuously increasing population. Water use per capita has fallen from 2200 m3/capita/year in the 1960s to 570 m3/capita/year in 2018, with 324 m3/capita/year anticipated in 2050 [15]. Despite reduced consumption, climate change is expected to raise even more issues across the country, with serious environmental, social, and economic consequences. In addition, transboundary water agreements need to be expanded and improved, because Egypt’s existing water availability is insufficient to meet the needed water demand for agriculture, industry, residential consumption, and other uses [15].
El Farafra Oasis in the Western Desert is part of the New Valley Project which began in the 1960s to harness groundwater from the well-known Nubian Sandstone Aquifer (NSA) for desert farming and restoration [16]. The problem of hydraulic head drawdown in the Farafra Oasis is a big concern since it jeopardizes the oasis principal spring water. Farafra Oasis is part of the Nubian sandstone aquifer, which has vast, artesian, and non-renewable fossil water. Since numerous deep water wells were drilled near the end of the 1990s, the problem has quickly become apparent [17,18]. Every year, the aquifer supplies enormous amounts of water (267 million m3). Piezometric cones of depression occur around the main pumping zones, where the hydraulic head has decreased 35 m below ground level [16]. Egypt’s total water resources are roughly 79 billion m3·year−1, which includes Nile water, rainfall, reclaimed water, and groundwater [19]. Although groundwater makes up just around 1.5%, it is vital in Egypt’s desert areas, which cover 96% of the country’s land [16].
The aim of the present study was to evaluate the suitability of the Nubian Sandstone Aquifer (El-Farafra Oasis) groundwater for drinking and irrigation/agricultural purposes, especially with the growing challenges of global climatic change.
2. Materials and Methods
2.1. Study Area
El-Farafra Oasis (Figure 1) (26°00″–27°30″ N, 26°30″–29°00″ E) is one of the smallest oases excavated in the limestone plateau occupying the core region of Western Egypt [16,20]. This natural depression has a total area of ~10,000 km2, distanced ~650 km southwest of Cairo [21]. El-Farafra Oasis is characterized by a hot hyperarid desert climate with a mean annual air temperature of ~22 °C and average annual precipitation of less than 10 mm [16,22]. The White Desert National Park (WDNP), also known as Sahara El-Beyda, is one of the main geographic attractions in the El-Farafra Oasis. It is located at a distance of ~45 km north of the oasis. This desert has a white creamy color and massive “chalky carbonate” rocky formations that had been eroded, carved, and sculpted for millions of years by atmospheric agents and occasional sandstorms [20]. Groundwater in the El-Farafra Oasis and the WDNP is derived from bores discharging from the world’s largest non-renewable groundwater resource, the Nubian Sandstone Aquifer System (NSAS), which is the only available water resource in this Saharan ecosystem [22,23]. NSAS is located in the eastern Sahara Desert, ca. 1600 km wide in both north-south and east-west directions. It extends for just over 2.6 Mkm2 between the north-western sector of Sudan, north-east of Chad, south-east of Libya, and most of Egypt, and the thickness of its permeable water-saturated sediments varies from hundreds of meters at its southern peripheries to several kilometers in its center and the north. This aquifer is comprised of wedge-shaped sandstone deposits spanning the early Paleozoic to Cretaceous age with the thin edge of the wedge outcropping to the south in the highlands of Sudan and Chad. Within Libya and Egypt, the aquifer is 1–2 km deep and confined beneath impermeable upper Cretaceous-Eocene beds [24]. Much of NSAS contains a large amount of high-quality groundwater, recharged during previous pluvial periods thousands to millions of years ago, with almost no current recharge [22,23]. The over-use of the Nubian aquifer system (NSAS), as the world’s largest aquifer, has already resulted in the abandonment of oases’ settlements, where natural springs have been dewatered, and this subsequently will lead to oases’ loss and severe environmental impacts [22]. A clear relationship between the ever-increasing number of wells and the dramatic decrease of active flowing springs has been observed (e.g., in oases of the Western Desert of Egypt) and is predicted to exacerbate due to the lack/non-compliance with sustainable exploitation plans [23,25].
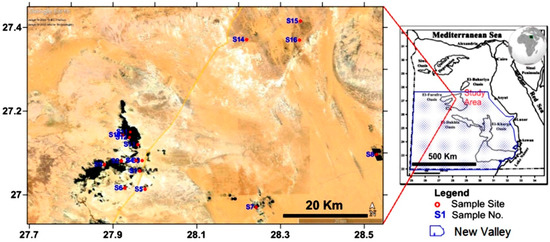
Figure 1.
Location map of the study area and sampling sites.
2.2. Sampling and Hydrochemistry
Water sampling was conducted during the period of 9–11 April 2015 using polyethylene bottles, which had previously been cleaned with ultrapure water and super pure nitric acid (1%), from 16 different springs or their artificial counterparts “drilled wells” to cover, as possible, the groundwater characterization of the El-Farafra Oasis and the WDNP (Figure 2). In situ pH, ion conductivity (EC), and total dissolved solids (TDS) were measured with a calibrated HANNA HI 991301 m. The hydrochemical variables were analyzed following standard methods adopted by Chapman and Pratt [26] and Clesceri et al. [27]. Major cations (Na+, K+, Ca2+, and Mg2+) were estimated using ionic chromatography (ICS 1500 Dionex Corp., Sunnyvale, CA, USA), while the major anions (Cl−, HCO3− and CO32−) were assessed using the titration methods. Sulphates (SO42−) were determined spectrophotometrically by the turbidimetric method. Nutrients (NO3−, NO2−, NH4+, total phosphorus TP, and soluble reactive phosphorus SRP) were determined by molecular absorption spectrometry.
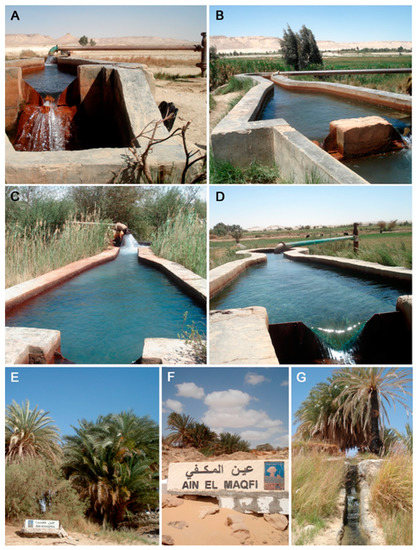
Figure 2.
Photographic views of some important groundwater springs and drilled wells in El-Farafra Oasis. (A): Bir 7 (Lewa Soubah village); (B): Bir 4 (El-Nahda village); (C): Bir 150 (El-Nahda village); (D): Bir Kamel (El-Nahda village); (E): Ain Khadra “also named Ain El-Wadi” (The White Desert National Park); (F): Ain Maqfi “also called Ain Abu Hawas” (The White Desert National Park); (G): Ain El-Serw (The White Desert National Park).
2.3. Reliability Check of Chemical Analysis
The neutrality or ionic balance was determined using Matthess’s method [28]:
where E% indicates the ion balance error percent, ΣC denotes the summation of all cations in milliequivalent per liter (meq·L–1), and ΣA denotes the summation of anions in meq·L–1.
E% = (ΣC − ΣA) × 100/(ΣC + ΣA)
Generally, for accurate analysis, the value of E% should be less than ±5% and certainly, up to ±10% [29], whereas a value greater than 10% is unacceptable.
In the present study, the charge balances were computed for the chemical compositions of the 16 water samples and adopted in the final datasets only if falling within a ±10% error range.
2.4. Calculation of the Water Quality Index (WQI) for Drinking Purposes
WQI is a useful means of determining water quality and the long-term viability as a source of drinking water [30,31]. It expresses the combined effect of various water quality parameters and provides water-quality information to policymakers and the general public. In the current study, we used the WQI developed and proposed by Horton [32] and Brown et al. [33], and subsequently modified by Tiwari and Mishra [34].
The spring and well water quality index (WQI) for drinking purposes was determined by the following steps:
The parameters under consideration were assigned a weight (wi). These weights represent the relative harmful impacts, when present in water. The highest and minimum weights assigned are five and two, respectively. The relative weights (RWi) are determined using the following formula:
where n is the number of parameters being used in WQI.
where: Ci is the mean concentration of each parameter in a water sample; Si is the respective water quality standard.
2.5. Water Quality Indices Calculation for Irrigation Purposes
Sodium absorption ratio (SAR) [35,36]:
Residual sodium carbonate (RSC) [37,38]):
Kelly’s ratio (KR; [39]):
Soluble sodium percentage (SSP; [40]):
Sodium percentage (SP; [40]):
Magnesium hazard (MH; [41]):
Permeability index (PI; [42]):
Potential salinity (PS; [42]):
Soltan classification [43]:
where concentrations of major cations and anions are expressed in meq/L.
2.6. Piper-Trilinear Diagram
For the identification of water types based on hydrochemical facies, the analyzed data of the spring and well water samples were plotted on a Piper trilinear diagram [44]. The Piper trilinear diagram was generated using the functions “Hydrogeo”, “Cowplot”, “sp”, “readxl”, “rgdal” and “broom” in the R statistical environment [45]. The Piper trilinear diagram is formed by two ternary diagrams, the lower left indicating cations and lower right indicating anions, and one central diamond plot representing the matrix transformation of the lower left and right ternary diagrams.
2.7. Gibbs Diagram
Gibbs [46] proposed two diagrams to better explain the natural mechanisms that influence the chemistry of spring and well water. MS Excel 2016 was used to create the Gibbs diagrams. Gibbs diagrams depend on two ratios which are computed by the following equations:
2.8. The US Salinity Laboratory Staff Diagram
The US Salinity Laboratory Staff diagram [35] is used for evaluating the suitability of groundwater for agriculture purposes. According to this diagram, the groundwater can be classified on its salinity and sodium hazard. The sodium hazard (S) is a function of the Sodium Absorption Ratio (SAR) which measures the degree to which sodium (Na+) in irrigation water replaces the adsorbed calcium (Ca2+) and magnesium (Mg2+). The SAR is defined by the following equation:
The resulting four categories of sodium hazard are: S1 is less than 10, considered to be low sodium hazard water. S2 is between 10 and 18, considered to be medium sodium hazard water. S3 is between 18 and 26, considered to be high sodium hazard water. S4 is more than 26, considered to be very high sodium hazard water.
While the resulting four categories of salinity are: C1 is less than 250 μS·cm–1 and considered low salinity water. C2 is between 250 and 750 μS·cm–1 and is considered medium salinity water. C3 is between 750 and 2250 μS·cm–1 and is considered high salinity water. C4 is more than 2250 μS·cm–1 and is considered very high salinity water.
In addition, the suitability of groundwater for irrigation purposes was estimated by using the diagram proposed by Wilcox [47]. The water classes are determined by the quantity of mineral substances as indicated by the specific conductance (or meq·L–1) and the percentage of sodium. In general, the water takes a progressively lower classification as the mineralization and percentage of sodium increase.
2.9. Principal Component Analysis (PCA)
The application of PCA to water quality evaluation has increased in popularity, due to the need for significant data reduction for analysis and decision-making [48,49,50]. Kaiser suggested that only components with eigenvalues greater than one be used [51]. The completely standardized dataset was subjected to PCA. The two most significant components were chosen based on a mix of criteria for factor selection with eigenvalues greater than 1.0. PCA was carried out with the “FactoMineR” and “Factoextra” packages in R [45].
3. Results and Discussion
3.1. Drinking Purposes
According to Carroll [52], groundwater can be classified into four types: type I is fresh water with TDS < 1000 mg·L−1; type II is brackish water with TDS between 1000 and 10,000 mg·L−1; type III is saline water with TDS from 10,000 till 100,000 mg·L−1; and type IV is brine water with TDS > 100,000 mg·L−1. The total dissolved salts (TDS) in groundwater in the study area varied between 143 mg·L−1 and 901 mg·L−1 (Table 1). Based on the concentrations of major ions and Carrol’s classification, the area can be assigned to the freshwater type. Nutrients (nitrate, NO3−; nitrite, NO2−; ammonium, NH4+; total phosphorus, TP; soluble reactive phosphorus, SRP ions) have been determined as shown in Table 1. Nitrate in groundwater systems is of concern because it is considered as an indicator of human activities (pollution). While nitrate does occur naturally in groundwater, concentrations greater than 3 mg·L−1 generally indicate contamination [53], and a more recent nationwide study found that concentrations over 1 mg·L−1 nitrate indicate human activity [54]. According to The Environmental Protection Agency Data Standards, EPA’s maximum contaminant level (MCL) for nitrate set for drinking water is 10 mg·L−1. The data in this study area showed that the nutrient concentrations do not exceed 1 mg·L−1, except samples No. S3, S4, and S10, in groundwater, indicating a human activities source.

Table 1.
Values of physico-chemical parameters for the springs and drilled wells studied in the El-Farafra Oasis.

Table 3.
WQI range and water quality classification for drinking purposes in the study area.

Table 2.
Assigned and relative weight of water quality variables for Water Quality Index computation with WHO [55].
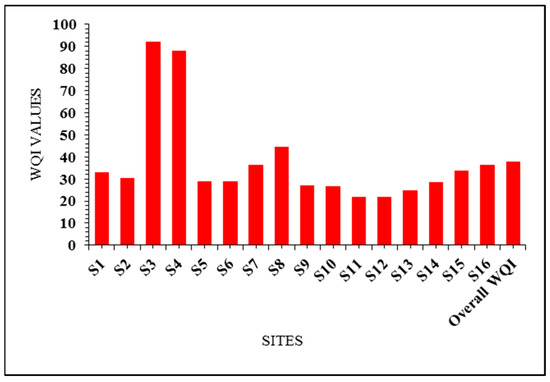
Figure 3.
Results of water quality index (WQI) for drinking purposes for the different springs and drilled well water samples.
Table 1.
Values of physico-chemical parameters for the springs and drilled wells studied in the El-Farafra Oasis.
| Samples No. | Latitude | Longitude | Elevation | pH | E.C. | T.D.S. | Ca2+ | Mg2+ | Na+ | K+ | HCO3− | CO32– | Cl− | SO42− | NO2− | NO3− | NH4+ | TP | SRP |
|---|---|---|---|---|---|---|---|---|---|---|---|---|---|---|---|---|---|---|---|
| (N) | (E) | m (a.s.l.) | µS·cm−1 | mg·L−1 | mg·L−1 | mg·L−1 | mg·L−1 | mg·L−1 | mg·L−1 | mg·L−1 | mg·L−1 | mg·L−1 | µg·L−1 | µg·L−1 | µg·L−1 | µg·L−1 | µg·L−1 | ||
| S1 | 27°03′24.6″ | 27°57′49.3″ | 117 ± 5.7 | 6.74 | 430 | 291 | 31.6 | 16.4 | 16.9 | 10.3 | 138.8 | 0.0 | 56.9 | 20.1 | 12 | 410 | 0.0 | 70 | 0.0 |
| S2 | 27°04′49.6″ | 27°55′11.6″ | 74.2 ± 8.1 | 6.19 | 390 | 254 | 25.6 | 13.2 | 14.5 | 12.2 | 102.4 | 0.0 | 58.5 | 27.4 | 0.0 | 496 | 5.0 | 14 | 0.0 |
| S3 | 27°04′53.8″ | 27°58′10.3″ | 83 ± 3.9 | 7.78 | 1220 | 864 | 88.9 | 46.0 | 122.8 | 23.5 | 230.2 | 0.0 | 147.1 | 205.6 | 188 | 2740 | 360 | 10 | 3.4 |
| S4 | 27°04′54.2″ | 27°57′17.4″ | 82.1 ± 6.4 | 6.60 | 1290 | 901 | 96.4 | 49.8 | 89.5 | 19.2 | 346.2 | 0.0 | 132.7 | 167.3 | 0.0 | 1230 | 12 | 0.0 | 0.0 |
| S5 | 27°00′46.8″ | 27°58′34.8″ | 107.7 ± 3.4 | 6.33 | 320 | 227 | 22.6 | 11.7 | 20.7 | 14.7 | 91.5 | 0.0 | 45.7 | 19.7 | 0.0 | 382 | 35 | 5.4 | 3.6 |
| S6 | 27°00′58.2″ | 27°55′41.1″ | 100.6 ± 5 | 6.85 | 330 | 227 | 21.1 | 10.9 | 37.5 | 7.4 | 64.7 | 0.0 | 61.5 | 24.3 | 3.2 | 334 | 0.0 | 0.0 | 0.0 |
| S7 | 26°58′13.7″ | 28°14′31.3″ | 103 ± 3.8 | 6.15 | 530 | 322 | 34.6 | 17.9 | 20.9 | 8.5 | 101.4 | 0.0 | 101.4 | 37.4 | 0.0 | 478 | 0.0 | 54 | 26 |
| S8 | 27°05′46.2″ | 28°31′44.7″ | 98 ± 4.1 | 6.20 | 650 | 419 | 49.7 | 25.7 | 23.5 | 8.0 | 185.4 | 0.0 | 111.3 | 15.5 | 0.0 | 660 | 43 | 0.0 | 0.0 |
| S9 | 27°04′18.7″ | 27°52′47.3″ | 63.7 ± 3.5 | 6.19 | 320 | 216 | 27.1 | 14.0 | 15.4 | 9.5 | 76.4 | 0.0 | 55.1 | 18.9 | 0.0 | 360 | 0.0 | 60 | 0.0 |
| S10 | 27°08′35.6″ | 27°55′23.3″ | 54.8 ± 7.6 | 6.31 | 300 | 200 | 27.1 | 14.0 | 16.9 | 12.2 | 48.1 | 0.0 | 70.7 | 10.5 | 4.0 | 1150 | 0.0 | 0.0 | 0.0 |
| S11 | 27°09′00.5″ | 27°56′28.3″ | 58.2 ± 3.7 | 6.20 | 280 | 157 | 21.1 | 10.9 | 15.6 | 4.0 | 12.4 | 0.0 | 88.9 | 4.3 | 0.0 | 520 | 2.0 | 0.0 | 0.0 |
| S12 | 27°08′14.3″ | 27°56′21.4″ | 59.1 ± 3.7 | 6.20 | 230 | 143 | 15.9 | 12.5 | 13.6 | 13.1 | 12.8 | 0.0 | 71.6 | 3.5 | 0.0 | 392 | 0.0 | 0.0 | 0.0 |
| S13 | 27°07′12.5″ | 27°57′31.6″ | 63.7 ± 3.9 | 6.19 | 300 | 177 | 21.9 | 10.9 | 16.0 | 13.0 | 17.8 | 0.0 | 92.6 | 4.6 | 0.0 | 380 | 20 | 0.0 | 0.0 |
| S14 | 27°22′15″ | 28°13′08.8″ | 31.3 ± 4.3 | 7.25 | 330 | 200 | 25.6 | 13.2 | 16.0 | 18.2 | 24.4 | 0.0 | 102.0 | 1.1 | 0.0 | 400 | 15 | 0.0 | 0.0 |
| S15 | 27°24′54.9″ | 28°20′50.6″ | 39.3 ± 5.4 | 7.09 | 440 | 260 | 34.6 | 17.9 | 18.6 | 18.1 | 33.5 | 0.0 | 135.5 | 1.5 | 0.0 | 400 | 0.0 | 0.0 | 0.0 |
| S16 | 27°22′11.6″ | 28°20′43.3″ | 72.7 ± 4.3 | 6.86 | 520 | 292 | 40.7 | 21.0 | 15.2 | 17.5 | 29.2 | 0.0 | 164.8 | 3.5 | 0.0 | 300 | 0.0 | 0.0 | 0.0 |
S1= Ain El-Balad (Qasr El-Farafra), S2 = Bir Sitta (Qasr El-Farafra), S3 = Ain Bishwa (Qasr El-Farafra), S4 = Ain El-Hateyya (Qasr El-Farafra), S5 = Bir Gelaw (Qasr El-Farafra), S6 = Bir Felao (Qasr El-Farafra), S7 = Bir at El-Saad Company for land reclamation (Sahl Baraka), S8 = Bir 10 at Qarawein company for land reclamation (Qarawein), S9 = Bir 7 (Lewa Soubah village), S10 = Bir 4 (El-Nahda village), S11 = Bir 150 (El-Nahda village), S12 = Bir Kamel (El-Nahda village), S13 = Bir Abd El-Azem (Esha Abd El-Rahman village), S14 = Ain Khadra “also called Ain El-Wadi” (The White Desert National Park), S15 = Ain Maqfi “also called Ain Abu Hawas” (The White Desert National Park), S16 = Ain El-Serw (The White Desert National Park). The WQI values revealed that 87.5% of the water samples were in the excellent water category, while 12.5% were in the good category for the drinking purpose category (Table 2 and Table 3; Figure 3).
3.2. Irrigation Purposes
Anions and cations are water resources characteristics that need to be constantly monitored. We used water quality indices such as SAR, MAR, SSP, RSC, PI, SP, and KR to assess the suitability of the groundwater-dependent springs and drilled well waters for agricultural uses.
For irrigation water, the sodium adsorption ratio (SAR) is typically regarded as an appropriate evaluation index [56]. SAR values of irrigation water and the amount to which Na+ is absorbed by the soil have a significant relationship [57]. The cation-exchange complex may become saturated with Na+ if irrigation water is rich in Na+ and low in Ca2+. The dispersion of clay particles has the potential to disrupt the soil structure [36]. The presence of Na+ in irrigation water reacts with the soil to limit permeability, and repeated applications make the soil very poorly permeable, whereas excessive Na+ causes alkali soil to grow. Ca2+ insufficiency is also caused by high Na+ saturation. If the soil is irrigated with high Na+ water for an extended period, it becomes plastic and sticky when wet and forms clods and crusts when dry. The addition of Ca2+ or Mg2+ salts in irrigation water, on the other hand, reduces the negative effects of sodium by enhancing soil permeability [58,59]. The sodium absorption ratio (SAR) values in the research region are within standard limits, indicating excellent to permissible irrigation feasibility (Table 4 and Table 5). Based on soluble sodium percentage (SSP) values, the springs and drilled well waters belong to a good category for irrigation according to Wilcox [40] (Table 4 and Table 5). SSP levels beyond a certain threshold in irrigation water might stifle plant development and decrease soil permeability [60].

Table 4.
Irrigation water quality indices results for the different spring and well water samples investigated in the present study.

Table 5.
Classification of the spring and well water samples for irrigation purposes based on various irrigation indices.
The residual sodium carbonate (RSC) has an influence on water irrigation suitability in several places of the world. RSC occurs when the concentration of carbonate and bicarbonate exceeds the calcium and magnesium levels. RSC may be estimated by subtracting the alkaline earth (Ca2+ + Mg2+) from the carbonate-bicarbonate (CO32– + HCO3–). When the total carbonates is in calcium and magnesium, complete precipitation of calcium and magnesium is possible [38]. As a result, sodium carbonate raises the sodium concentration in water [37,38]. If RSC is >2.5, water is not suitable for irrigation but RSC values in the study area were below 1.25 (Table 4 and Table 5), and 100% of the samples fell in the good category.
When determining whether or not water is suitable for irrigation, the sodium content is essential. Sodium reduces the permeability of soil by bonding with it [40,56]. Alkaline soils are formed when sodium combines with carbonate, whereas saline soils are formed when sodium reacts with chloride. This type of soil makes it difficult for plants to grow [36]. Through a base exchange process, higher sodium levels in irrigation water cause ions to migrate towards clay particles by omitting Ca2+ and Mg2+ ions. As a result of this base exchange process in the soil, water movement capacity is reduced, inhibiting water flow under wet circumstances, and such soils become hard dry. The sodium content of irrigation water is called sodium, and it may be calculated using the method described below [40]. It is observed that, based on percent sodium, 87.5% and 12.5 % of the spring and well water samples belong to the good and moderate class, respectively [37]. %Na ranges between 21.10 mg·L−1 to 48.29 mg/ℓ with a median value of 31.18 mg·L−1 (Table 4 and Table 5).
In most waters, calcium and magnesium are in balance, and a high level of Mg2+ is attributable to the presence of exchangeable Na+ in irrigated soils. Excess Mg2+ alters soil quality making it alkaline ensuing in decreased crop yield and poor agricultural returns [61]. An Mg hazard (MH) value <50 is suggested for irrigation. MH in our study region ranges between 46 and 56 (Table 4 and Table 5), with 94% of the spring and well water samples being classified as suitable for irrigation.
Kelly’s ratio (KR) signifies higher sodium content in water [39]. KR is as well one of the vital parameters in classifying irrigation water. KR index is an alkali hazard indicator. In case of high KR values, gypsum is advised to decrease the effects of Na+ ions [41]. KR values of our spring and well water samples range from 0.2 to 0.8, with an average value of 0.36. Only water with KR < 1 is suitable for irrigation. Therefore, the spring and well waters studied in the El-Farafra Oasis are suitable for irrigation (Table 4 and Table 5).
Permeability Index (PI) is an essential variable for classifying permeability of the soils to irrigation water and is affected by prolonged application of irrigation water (higher salts), as it is influenced by Na+, Ca2+, Mg2+, and HCO3– ions in soils. PI values of the study region ranged from 14.8 to 37.6, classifying the spring and well waters studied as belonging to the ‘Good’ category (Table 4 and Table 5). Waters belonging to ‘Good’ and ‘Moderate’ classes are recommended for irrigation [42].
Potential salinity (PS) is applied for the categorization of water for agricultural purposes. PS < 3 meq·L–1 is good for agricultural applications [43]. The PS values in this area vary from 0.01 to 2.14 meq·L–1. Thus, all the spring and well waters are suitable for irrigation.
As per the Soltan classification, all the waters studied belong to deep meteoric type (Table 4 and Table 5).
The spring and well waters data were plotted using the US Salinity Laboratory Staff diagram [35]. The results indicate that the groundwater of the El-Farafra area is suitable for irrigation of traditional crops. However, samples no. S3 and S4 can only be used to irrigate salt-tolerant crops in good drainage soils (Figure 4).
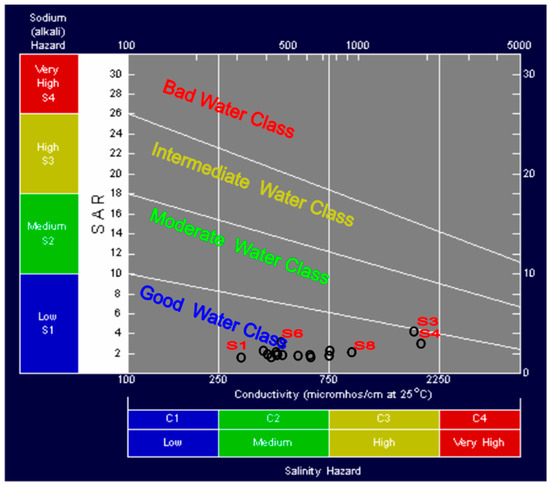
Figure 4.
The US Salinity Lab. Staff diagram [35] for Irrigation water classification in the study area.
In addition, the spring and well waters data were plotted using the Wilcox diagram [47]. The results indicate that the groundwater of the El-Farafra area is excellent-to-good for irrigation, except for samples no. S3 and S4 which are good to permissible (Figure 5).
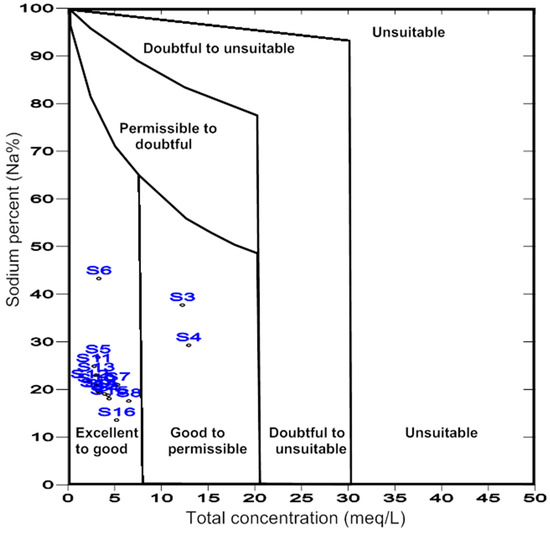
Figure 5.
Classification of water for irrigation use in the study area (after Wilcox [47]).
3.3. Piper-Trilinear Diagram
The hydrochemical facies is depicted in a trilinear diagram by plotting main cations and anions [44]. Spring and well water types may be divided into two categories in the study area: 37.5% of samples had magnesium-bicarbonate Mg(HCO3)2 type water, 50% had no dominant ions (mixed water-type category, Ca/MgCl2), and the remaining 12.5% belonged to the sodium-chloride water type (Figure 6).
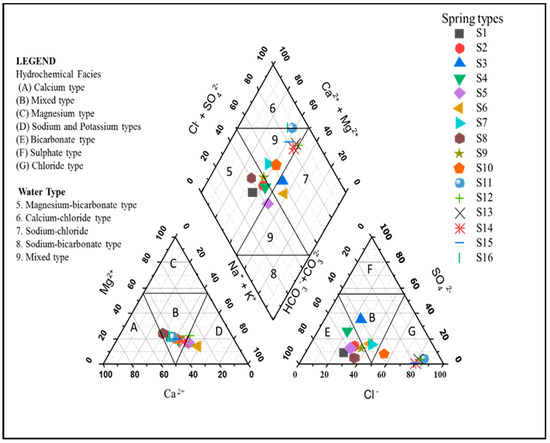
Figure 6.
Piper diagram showing hydrochemical facies and water type of the investigated spring and well water samples in El-Farafra Oasis.
3.4. Gibbs Diagram
To evaluate the factors controlling the spring/well water chemistry, Cl−/ HCO3− + Cl− and Na+ + K+/Na+ + K+ + Ca2+ were plotted as a function of TDS to designate precipitation dominance (PD), rock dominance (RD), and evaporation dominance (ED). Spring and well water samples of the El-Farafra Oasis were plotted as shown in Figure 1. Results of Gibb’s plot indicated that all the spring and well water samples belonged to the rock dominance (RD) zone with weathering and dissolution of rocks as the main factors controlling spring and well water chemistry (Figure 7).
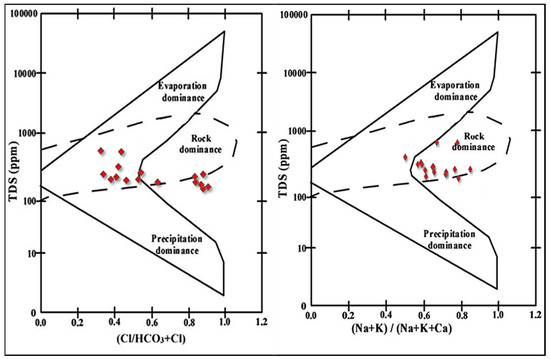
Figure 7.
Gibbs diagram showing the ratio of (Cl−/HCO3− + Cl−) and (Na+ + K+)/(Na+ + K+ + Ca2+) vs. TDS.
3.5. Rock-Water Interaction and Source Deduction
According to Figure 6 and Figure 7, the cations and anions are mostly produced via rock weathering rather than evaporation, crystallization, or precipitation. The weathering of crystalline dolomitic limestones and calcium–magnesium silicates, primarily calcite, gypsum, and plagioclase, can provide a significant amount of these ions [62]. Both Ca2+ and Mg2+ may react with HCO3− and form calcite and dolomite, respectively. Since Ca2+ and Mg2+ react with HCO3−, the Ca2+/HCO3−and Mg2+/HCO3− ratios would be directly related [63]. Even though the current study found a strong positive correlation between Ca2+/HCO3− and Mg2+/HCO3− (r2 = 0.962), calcite and dolomite formation is difficult when TDS levels are less than 600 mg·L−1 [64,65]. Since the average TDS (321 mg·L−1; see Figure 8) is substantially lower than the required value, calcite and dolomite dissolution may not be achievable in the study area. Furthermore, if Ca2+ and Mg2+ come only through carbonate dissolution in aquifer materials and weathering of supplementary pyroxene or amphibole minerals, the (Ca2+ + Mg2+)/ HCO3− ratio would be 0.5 [66]. However, Figure 9a indicates that the ratio is slightly higher than 0.5 (or the 1:2 line), indicating that it is above the 1:2 line. The higher (Ca2+ + Mg2+)/HCO3− ratio clearly indicates that most groundwater samples have Ca2+ + Mg2+ dominance over HCO3−, which reflects the concentration of Ca2+ + Mg2+ from carbonate dissolution (reverse ion exchange). The lower (Ca2+ + Mg2+)/HCO3− ratio in a minority of groundwater samples indicates silicate weathering [67,68,69].
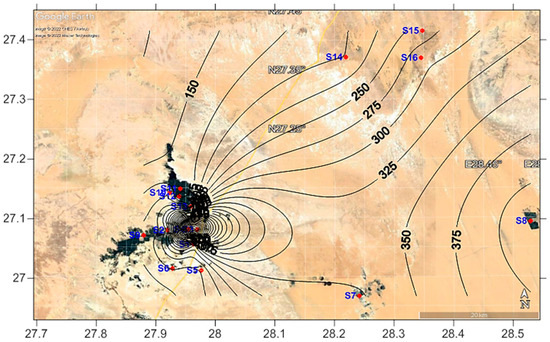
Figure 8.
Spatial distribution of the total dissolved salts (TDS) in the study area.
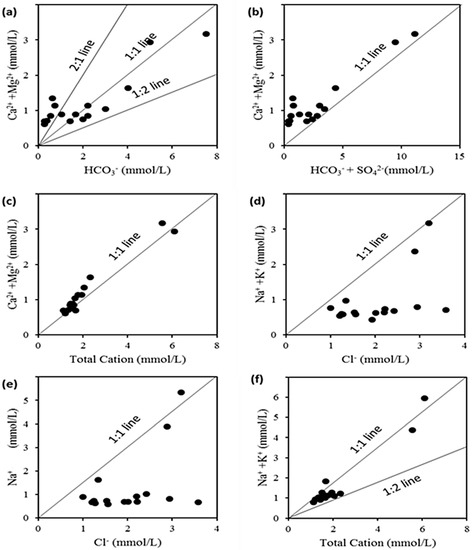
Figure 9.
Bivariate plots of (a) HCO3− vs. Ca2+ + Mg2+; (b) HCO3− + SO42− vs. Ca2+ + Mg2+; (c) Total cations vs. Ca2+ + Mg2+; (d) Cl− vs. Na+ + K+; (e) Cl− vs. Na+; (f) Na+ + K+ vs. total cations.
The plot of (Ca2+ + Mg2+) vs. (HCO3− + SO42−) in Figure 9b shows that all samples are slightly above the 1:1 line, indicating that weathering and dissolution of carbonates and gypsum, as well as reverse ion exchange, are primarily responsible for the formation of these chemical elements [70,71,72]. Furthermore, an excess of alkaline earth elements (Ca2+ and Mg2+) indicates an additional source of them which is balanced by Cl− and SO42− [62]. This claim is corroborated by Figure 9c, which displays (Ca2+ + Mg2+) vs. total cation data immediately above and below the 1:1 line, indicating a growing and decreasing contribution of Na+ and K+ as TDS rises and falls [73,74].
The (Na+ + K+)/Cl− (Figure 9d) shows that 100% of the samples are below the 1:1 equilibrium line, indicating that reverse ion-exchange activity has depleted (Na+ + K+) in the springs and wells [75,76,77]. If sample points lie along the 1:1 equiline in a plot of sodium versus chloride (Figure 9e), halite dissolution is the source of sodium and chloride [73,74,78,79]. The silicate weathering process is indicated by a Na/Cl ratio > 1 [69,80]. The Na+ versus Cl− scatter plot shows that the bulk of the samples is below the 1:1 equiline in this investigation (Figure 9f). The cation exchange mechanisms and human effects are both to blame for the excess chloride in spring water.
The Na-normalized [81] Ca2+ and Mg2+ ratios may have been related. As a result, in Figure 10a, the molar ratios of Mg2+/Na+ vs. Ca2+/Na+ are plotted in a log-log plot. Recharging water moving through carbonate-rich aquifers displays high Ca2+/Na+ and Mg2+/Na+ ratios. Water-draining silicates are the end member with the lowest Na-normalized ratio [73]. The molar Ca2+/Na+ ratio of normal crustal continental rocks is near 0.6 [82], and because Na+ is more soluble than Ca2+, groundwater should have a lower Ca2+/Na+ molar ratio, which is connected to silicate weathering. The observed high Ca2+/Na+ molar ratio groundwater in Figure 10a is determined by carbonate weathering rather than by silicate breakdown. Similarly, high molar ratios of Ca2+/Na+ vs. HCO3−/Na+ in the plot for Ca2+/Na+ vs. HCO3−/Na+ molar ratios (Figure 10b) indicate carbonate weathering.
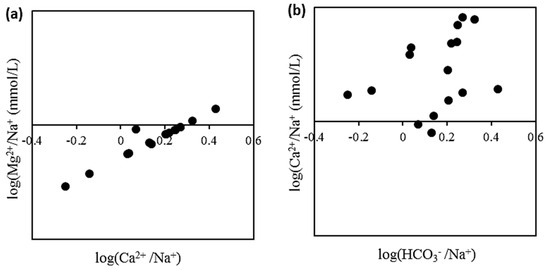
Figure 10.
Bivariate plots of (a) log (Ca2+/Na+) vs. log (Mg2+/Na+); (b) log(HCO3−/Na+) vs. log (Ca2+/Na+).
3.6. Principal Component Analysis (PCA)
PCA shows that the first two components, the eigenvalue of which is >1, accounted for 75.2% of the total variance (Table 6). PC1 shows strong loading for pH, EC, TDS, cations, anions, and nitrogen-based nutrients. This shows the common origin and combined contribution of all ions in the water. PC1 displays the lithological control including carbonate or silicate weathering [74]. PC2 showed strong loadings for TP and SRP. This shows their common origin and combined contribution to the water. TP and SRP may originate from agricultural activities indicating substantial anthropogenic activities in the area studied [11,69,74]. Biologically, previous studies of Shaaban et al. [83], Saber et al. [21], and Wołowski et al. [84] coincide with this observation where they also reported several pollution-tolerant cyanobacterial and microalgal species inhabiting the springs and drilled wells of the El-Farafra Oasis.

Table 6.
Principal component analysis (PCA) and loadings of the water quality parameters for the entire dataset.
4. Conclusions
The recorded pattern of cations and anions in the spring and drilled-well water samples of the El-Farafra Oasis was Ca2+ > Na+ > Mg2+ > K+ and HCO3− > Cl− > SO42−, respectively. The dominant hydrochemical facies in the area investigated are of the alkali-earth type (Ca/MgCl2) having no dominant ion, followed by magnesium-bicarbonate (Mg(HCO3)2) type water, and the remaining belonging to the sodium-chloride water type. Groundwater chemistry in the study area is mainly controlled by rock-water interaction, particularly the dissolution of carbonate rocks and silicate weathering. Groundwater samples in the El-Farafra Oasis aquifer are characterized by deep meteoric origin, slightly acidic to neutral, soft, and within the permissible limits of WHO (2017) for TDS, EC, Ca2+, Mg2+, HCO3−, SO42−, Cl−, NO3−, NO2−, NH4+, TP, and SRP. The assessment of groundwater suitability for drinking purposes revealed that the water samples from the study area fall in the ‘excellent’ to ‘good’ classes. However, the evaluation of groundwater suitability for irrigation revealed that they fall in the ‘excellent’ to ‘good’ categories, except in the case of magnesium hazard which causes 6.3% of the wells and springs studied to be unsuitable for irrigation. Overall, the springs and drilled wells studied in the El-Farafra Oasis are highly amenable to the optimum-development strategy recently applied in the Western Desert of Egypt.
Author Contributions
Conceptualization, A.A.S., S.U.B. and M.C.; methodology, J.G., S.U.B., A.H. and H.G.; software, S.U.B., A.H. and H.G.; validation, A.G., A.A.S. and M.C.; formal analysis, J.G., S.U.B. and A.H.; investigation, J.G., H.G., S.U.B. and A.H.; resources, A.A.S.; data curation, H.G., S.U.B. and A.H.; writing—original draft preparation, S.U.B., A.H., H.G. and A.A.S.; writing—review and editing, A.G. and M.C.; visualization, A.G. and M.C.; supervision, A.G. and M.C.; project administration, M.C.; funding acquisition, M.C. and A.A.S. All authors have read and agreed to the published version of the manuscript.
Funding
This research was a part of the PhyBiO project, partially funded by MUSE—Museo delle Scienze, Trento, Italy, and the Italian Ministry of Foreign Affairs and International Cooperation (MAECI) to the former MUSE Abdullah A. Saber for the academic year 2018/2019.
Institutional Review Board Statement
Not applicable.
Informed Consent Statement
Not applicable.
Data Availability Statement
Not applicable.
Acknowledgments
Authors are very thankful to their home universities and institutions for allowance to conduct this research. We are also thankful to Ahmed Kamal, the responsible manager of the White Desert National Park, for his kind support during materials sampling.
Conflicts of Interest
The authors declare no conflict of interest.
References
- Taylor, R.G.; Scanlon, B.; Döll, P.; Rodell, M.; Van Beek, R.; Wada, Y.; Longuevergne, L.; Leblanc, M.; Famiglietti, J.S.; Edmunds, M.; et al. Ground water and climate change. Nat. Clim. Chang. 2013, 3, 322–329. [Google Scholar] [CrossRef]
- Famiglietti, J. The global groundwater crisis. Nat. Clim. Chang. 2014, 4, 945–948. [Google Scholar] [CrossRef]
- Wu, W.Y.; Lo, M.H.; Wada, Y.; Famiglietti, J.S.; Reager, J.T.; Yeh, P.J.F.; Ducharne, A.; Yang, Z.L. Divergent effects of climate change on future groundwater availability in key mid-latitude aquifers. Nat. Commun. 2020, 11, 3710. [Google Scholar] [CrossRef] [PubMed]
- Dai, A. Increasing drought under global warming in observations and models. Nat. Clim. Chang. 2013, 3, 52–58. [Google Scholar] [CrossRef]
- Trenberth, K.E.; Dai, A.; Van Der Schrier, G.; Jones, P.D.; Barichivich, J.; Briffa, K.R.; Sheffield, J. Global warming and changes in drought. Nat. Clim. Chang. 2014, 4, 17–22. [Google Scholar] [CrossRef]
- Cuthbert, M.O.; Taylor, R.G.; Favreau, G.; Todd, M.C.; Shamsudduha, M.; Villholth, K.G.; MacDonald, A.M.; Scanlon, B.R.; Kotchoni, D.O.; Vouillamoz, J.M.; et al. Observed controls on resilience of groundwater to climate variability in sub-Saharan Africa. Nature 2019, 572, 230–234. [Google Scholar] [CrossRef]
- Berg, A.; Findell, K.; Lintner, B.; Giannini, A.; Seneviratne, S.I.; Van Den Hurk, B.; Lorenz, R.; Pitman, A.; Hagemann, S.; Meier, A.; et al. Land–atmosphere feedbacks amplify aridity increase over land under global warming. Nat. Clim. Chang. 2016, 6, 869–874. [Google Scholar] [CrossRef]
- Lo, M.H.; Famiglietti, J.S. Irrigation in California’s Central Valley strengthens the southwestern US water cycle. Geophys. Res. Lett. 2013, 40, 301–306. [Google Scholar] [CrossRef]
- Abd El Samie, S.; Sadek, M. Groundwater recharge and flow in the Lower Cretaceous Nubian Sandstone aquifer in the Sinai Peninsula, using isotopic techniques and hydrochemistry. Hydrogeol. J. 2001, 9, 378–389. [Google Scholar] [CrossRef]
- Abdel-Satar, A.M. Water quality assessment of River Nile from Idfo to Cairo. Egypt. J. Aquat. Res. 2005, 31, 200–223. [Google Scholar]
- Abd El-Hady, H.H. Alternations in biochemical structures of phytoplankton in Aswan Reservoir and River Nile. Egypt J. Biol. Environ. Sci. 2014, 4, 68–80. [Google Scholar]
- Mohie El Din, M.O.; Moussa, A.M. Water management in Egypt for facing the future challenges. J. Adv. Res. 2016, 7, 403–412. [Google Scholar]
- Mohie El Din, M.O.; Moussa, A.M.; Hinkelmann, R. Impacts of climate change on water quantity, water salinity, food security, and socioeconomy in Egypt. Water Sci. Eng. 2021, 14, 17–27. [Google Scholar]
- Moghazy, N.H.; Kaluarachchi, J.J. Assessment of groundwater resources in Siwa Oasis, Western Desert, Egypt. Alex. Eng. J. 2020, 59, 149–163. [Google Scholar] [CrossRef]
- Gado, T.A.; El-Agha, D.E. Climate Change Impacts on Water Balance in Egypt and Opportunities for Adaptations. In Agro-Environmental Sustainability in MENA Regions; Springer: Cham, Switzerland, 2021; pp. 13–47. [Google Scholar]
- Elsheikh, A.E. Mitigation of groundwater level deterioration of the Nubian Sandstone aquifer in Farafra Oasis, Western Desert, Egypt. Environ. Earth Sci. 2015, 74, 2351–2367. [Google Scholar] [CrossRef]
- Ebraheem, A.; Riad, S.; Wycisk, P.; Seif El-Nasr, A. Simulation of impact of present and future groundwater extraction from the non-replenished Nubian Sandstone Aquifer in southwest Egypt. Environ. Geol. 2002, 43, 188–196. [Google Scholar]
- Gossel, W.; Ebraheem, A.M.; Wycisk, P. A very large scale GISbase groundwater flow model for the Nubian Sandstone aquifer in Easertn Sahara (Egypt, northern Sudan and eastern Libya). Hydrog. J. 2004, 12, 698–713. [Google Scholar] [CrossRef]
- Wagdy, A. An overview of groundwater management in Egypt. J. Eng. Appl. Sci. 2009, 1, 1–13. [Google Scholar]
- El Bastawesy, M.; Ali, R.R. The use of GIS and remote sensing for the assessment of waterlogging in the dryland irrigated catchments of Farafra Oasis, Egypt. Hydrol. Process. 2013, 27, 206–216. [Google Scholar] [CrossRef]
- Saber, A.A.; Ichihara, K.; Cantonati, M. Molecular phylogeny and detailed morphological analysis of two freshwater Rhizoclonium strains from contrasting spring types in Egypt and Italy. Plant Biosyst. 2017, 151, 800–812. [Google Scholar] [CrossRef]
- Powell, O.; Fensham, R. The history and fate of the Nubian Sandstone Aquifer springs in the oasis depressions of the Western Desert, Egypt. Hydrogeol. J. 2016, 24, 395–406. [Google Scholar] [CrossRef]
- Voss, C.I.; Soliman, S.M. The transboundary non-renewable Nubian Aquifer System of Chad, Egypt, Libya and Sudan: Classical groundwater questions and parsimonious hydrogeologic analysis and modeling. Hydrogeol. J. 2014, 22, 441–468. [Google Scholar] [CrossRef]
- Dabous, A.; Osmond, J. Uranium isotopic study of artesian and pluvial contributions to the Nubian Aquifer, Western Desert, Egypt. J. Hydrol. 2001, 243, 242–253. [Google Scholar] [CrossRef]
- Hamed, Y.; Hadji, R.; Redhaounia, B.; Zighmi, K.; Bâali, F.; El Gayar, A. Climate impact on surface and groundwater in North Africa: A global synthesis of findings and recommendations. Euro-Mediterr. J. Environ. Integr. 2018, 3, 25. [Google Scholar] [CrossRef]
- Chapman, H.D.; Pratt, P.F. Methods of Analysis for Soils, Plant and Water; Division of Agricultural Sciences, University of California: Los Angeles, CA, USA, 1978; p. 309. [Google Scholar]
- Clesceri, L.S.; Greenberg, A.E.; Eaton, A.D. Standard Methods for the Examination of Water and Wastewater, 20th ed.; American Public Health Association: Washington, DC, USA, 2000; p. 1325. [Google Scholar]
- Matthess, G. The Properties of Groundwater; Department of Environmental Science, John Wiley and Sons Inc.: New York, NY, USA, 1982; p. 406. [Google Scholar]
- Singhal, B.B.S.; Gupta, R.P. Applied Hydrogeology of Fractured Rocks; Kluwer Academic: Dordrecht, The Netherlands, 1999. [Google Scholar]
- Silvert, W. Fuzzy indices of environmental conditions. Ecol. Model. 2000, 130, 111–119. [Google Scholar] [CrossRef]
- Boyacioglu, H. Development of a water quality index based on a European classification scheme. Water 2007, 33, 101–106. [Google Scholar] [CrossRef]
- Horton, R. An index number system for rating water quality. J. Water Pollut. Control Fed. 1965, 37, 300–306. [Google Scholar]
- Brown, R.M.; Mccleiland, N.J.; Deiniger, R.A.; O’Connor, M.F. Water Quality Index-Crossing the Physical Barrier. In Proceedings of the International Conference on Water Pollution Research Jerusalem, Jerusalem, Israel, 18–23 June 1972; Jenkis, S.H., Ed.; 1972; Volume 6, pp. 787–797. [Google Scholar]
- Tiwari, T.; Mishra, M.A. Preliminary assignment of water quality index of major Indian rivers. Indian J. Environ. Prot. 1985, 5, 276–279. [Google Scholar]
- Richards, L.A. Diagnosis and Improvement of Saline and Alkaline Soils; US Department of Agriculture: Washington, DC, USA, 1954; p. 60.
- Todd, D.K. Groundwater Hydrology; Wiley: New York, NY, USA, 1980. [Google Scholar]
- Eaton, F.M. Significance of carbonates in irrigation waters. Soil Sci. 1950, 69, 123–134. [Google Scholar] [CrossRef]
- Raghunath, H.M. Groundwater; Wiley Eastern: New Delhi, India, 1987. [Google Scholar]
- Kelly, W.P. Permissible composition and concentration of irrigated waters. Proc. AFCS 1940, 66, 607–613. [Google Scholar]
- Wilcox, L.V. Classification and Use of Irrigation Water; No. 969; US Department of Agriculture: Washington, DC, USA, 1955.
- Paliwal, K.V. Irrigation with Saline Water; Monogram No. 2 (New Series); IARI: New Delhi, India, 1972; p. 198.
- Doneen, L.D. Notes on Water Quality in Agriculture; Water Sciences and Engineering Paper 4001; Department of Water Sciences and Engineering, University of California: Los Angeles, CA, USA, 1964.
- Soltan, M.E. Evaluation of groundwater quality in Dakhla Oasis (Egyptian Western Desert). Environ. Monit. Assess 1999, 57, 157–168. [Google Scholar] [CrossRef]
- Piper, A.M. A Graphic Procedure in the Geochemical Interpretation of Water Analysis; USGS Groundwater Note, No. 12; USGS: Reston, VA, USA, 1953. [Google Scholar]
- R Core Team. R: A Language and Environment for Statistical Computing; R Foundation for Statistical Computing: Vienna, Austria, 2017; ISBN 3-900051-07-0. [Google Scholar]
- Gibbs, R.J. Mechanisms controlling world water chemistry. Science 1970, 170, 1081–1090. [Google Scholar] [CrossRef] [PubMed]
- Wilcox, L.V. Classification and Use of Irrigation Waters; No. 962; U.S. Department of Agriculture: Washington, DC, USA, 1948; p. 40.
- Vega, M.; Pardo, R.; Barrado, E.; Debán, L. Assessment of seasonal and polluting effects on the quality of river water by exploratory data analysis. Water Res. 1998, 32, 3581–3592. [Google Scholar] [CrossRef]
- Morales, M.M.; Martı, P.; Llopis, A.; Campos, L.; Sagrado, S. An environmental study by factor analysis of surface seawater in the Gulf of Valencia (Western Mediterranean). Anal. Chim. Acta 1999, 394, 109–117. [Google Scholar] [CrossRef]
- Helena, B.; Pardo, R.; Vega, M.; Barrado, E.; Fernandez, J.M.; Fernandez, L. Temporal evolution of groundwater composition in an alluvial aquifer (Pisuerga River, Spain) by principal component analysis. Water Res. 2000, 34, 807–816. [Google Scholar] [CrossRef]
- Liu, C.W.; Lin, K.H.; Kuo, Y.M. Application of factor analysis in the assessment of groundwater quality in a Blackfoot disease area in Taiwan. Sci. Total Environ. 2003, 313, 77–89. [Google Scholar] [CrossRef]
- Carroll, D. Rainwater As A Chemical Agent of Geologic Processes: A Review; USGS Water Supply Paper; US Government Printing Office: Washington, DC, USA, 1962; p. 1535.
- Madison, R.J.; Brunett, J.O. Overview of the occurrence of nitrate in ground water of the United States. In National Water Summary 1984-Hydrologic Events, Selected Water-Quality Trends, and Ground-Water Resources; U.S. Geological Survey Water-Supply Paper 2275; U.S. Geological Survey: Reston, VA, USA, 1984; pp. 93–105. [Google Scholar]
- Dubrovsky, N.M.; Burow, K.R.; Clark, G.M.; Gronberg, J.M.; Hamilton, P.A.; Hitt, K.J.; Mueller, D.K.; Munn, M.D.; Nolan, B.T.; Puckett, L.J.; et al. The Quality of our Nation’s Waters—Nutrients in the Nation’s Streams and Groundwater, 1992–2004; U.S. Geological Survey Circular 1350; U.S. Geological Survey: Reston, VA, USA, 2010; p. 174.
- World Health Organization (WHO). Guidelines for Drinking Water Quality, 4th ed.; World Health Organization: Washington, DC, USA, 2017; p. 541.
- Ayers, R.S.; Westcot, D.W. Water Quality for Agriculture, Irrigation and Drainage (Paper No. 29); FAO: Rome, Italy, 1985. [Google Scholar]
- Raihan, F.; Alam, J.B. Assessment of groundwater quality in Sunamganj Bangladesh. Iran. J. Environ. Health Sci. Eng. 2008, 6, 155–166. [Google Scholar]
- Punmia, B.C.; Lal, P.B.B. Irrigation and Water Power Engineering; Standard Publishers Distributors: New Delhi, India, 1981. [Google Scholar]
- Asaduzzaman, M. Handbook of Groundwater and Wells; BRAC; Prokashana: Dhaka, Bangladesh, 1985. [Google Scholar]
- Joshi, D.M.; Kumar, A.; Agrawal, N. Assessment of the irrigation water quality of River Ganga in Haridwar district. Rasayan J. Chem. 2009, 2, 285–292. [Google Scholar]
- Szabolcs, I.; Darab, C. The Influence of Irrigation Water of High Sodium Carbonate Content of Soils. In Proceedings of 8th International Congress Soil Science Sodics Soils; Szabolics, I., Ed.; Research Institute for Soil Science and Agricultural Chemistry of the Hungarian Academy of Sciences, ISSS Trans II: Tsukuba, Japan, 1964; pp. 802–812. [Google Scholar]
- Wen, X.; Wu, Y.; Su, J.; Zhang, Y.; Liu, F.J.E.G. Hydrochemical characteristics and salinity of groundwater in the Ejina Basin, Northwestern China. Environ. Geol. 2005, 48, 665–675. [Google Scholar] [CrossRef]
- Zahid, A.; Hassan, M.Q.; Balke, K.D.; Flegr, M.; Clark, D.W. Groundwater chemistry and occurrence of arsenic in the Meghna floodplain aquifer, southeastern Bangladesh. Environ. Geol. 2008, 54, 1247–1260. [Google Scholar] [CrossRef]
- Zhang, G.; Deng, W.; Yang, Y.S.; Salama, R.B. Evolution study of a regional groundwater system using hydrochemistry and stable isotopes in Songnen Plain, northeast China. Hydrol. Process. 2007, 21, 1055–1065. [Google Scholar] [CrossRef]
- Brindha, K.; Pavelic, P.; Sotoukee, T.; Douangsavanh, S.; Elango, L. Geochemical characteristics and groundwater quality in the Vientiane plain, Laos. Expos. Health 2016, 9, 89–104. [Google Scholar] [CrossRef]
- Sami, K. Recharge mechanisms and geochemical processes in a semi-arid sedimentary basin, Eastern Cape, South Africa. J. Hydrol. 1992, 139, 27–48. [Google Scholar] [CrossRef]
- Rajesh, R.; Brindha, K.; Murugan, R.; Elango, L. Influence of hydrogeochemical processes on temporal changes in groundwater quality in a part of Nalgonda district, Andhra Pradesh, India. Environ. Earth Sci. 2012, 65, 1203–1213. [Google Scholar] [CrossRef]
- Kumar, P.J.S. Evolution of groundwater chemistry in and around Vaniyambadi Industrial Area: Differentiating the natural and anthropogenic sources of contamination. Geochemistry 2014, 74, 641–651. [Google Scholar] [CrossRef]
- Raju, A.; Singh, A. Assessment of groundwater quality and mapping human health risk in central ganga alluvial plain, Northern India. Environ. Process. 2017, 4, 375–397. [Google Scholar] [CrossRef]
- Cerling, T.E.; Pederson, B.L.; Damm, K.L.V. Sodium-calcium ion exchange in the weathering of shales: Implications for global weathering budgets. Geology 1989, 17, 552–554. [Google Scholar] [CrossRef]
- Fisher, R.S.; Mulican, W.F. Hydrochemical evolution of sodium sulfate and sodium-chloride groundwater beneath the Northern Chihuahuan Desert, Trans-Pecos, Texas, USA. Hydrogeol. J. 1997, 10, 455–474. [Google Scholar] [CrossRef]
- Datta, P.S.; Tyagi, S.K. Major ion chemistry of groundwater in Delhi area: Chemical weathering processes and groundwater flow regime. J. Geol. Soc. India 1996, 47, 179–188. [Google Scholar]
- Rahman, M.A.; Majumder, R.K.; Rahman, S.H.; Halim, M. Sources of deep groundwater salinity in the southwestern zone of Bangladesh. Environ. Earth. Sci. 2011, 63, 363–373. [Google Scholar] [CrossRef]
- Tanvir Rahman, M.A.; Saadat, A.H.M.; Islam, M.; Al-Mansur, M.; Ahmed, S. Groundwater characterization and selection of suitable water type for irrigation in the western region of Bangladesh. Appl. Water Sci. 2017, 7, 233–243. [Google Scholar] [CrossRef]
- Stallard, R.F.; Edmond, J.M. Geochemistry of the Amazon: 2. The influence of geology and weathering environment on the dissolved load. J. Geophys. Res. Oceans 1983, 88, 9671–9688. [Google Scholar] [CrossRef]
- Singh, A.; Hasnain, S. Environmental geochemistry of Damodar River basin, east coast of India. Environ. Geol. 1999, 37, 124–136. [Google Scholar] [CrossRef]
- El-Sayed, M.H.; Abo El-Fadl, M.M.; Shawky, H.A. Impact of hydrochemical processes on groundwater quality, Wadi Feiran, South Sinai, Egypt. Aust. J. Basic Appl. Sci. 2012, 6, 638–654. [Google Scholar]
- Zaidi, F.K.; Kassem, O.M.; Al-Bassam, A.M.; Al-Humidan, S. Factors governing groundwater chemistry in paleozoic sedimentary aquifers in an arid environment: A case study from hail province in Saudi Arabia. Arab. J. Sci. Eng. 2015, 40, 1977–1985. [Google Scholar] [CrossRef]
- Iqbal, J.; Nazzal, Y.; Howari, F.; Xavier, C.; Yousef, A. Hydrochemical processes determining the groundwater quality for irrigation use in an arid environment: The case of Liwa Aquifer, Abu Dhabi, United Arab Emirates. Groundw. Sustain. Dev. 2018, 7, 212–219. [Google Scholar] [CrossRef]
- Mayback, M. Global chemical weathering of surficial rocks estimated from river dissolved loads. Am. J. Sci. 1987, 287, 401–428. [Google Scholar] [CrossRef]
- Gaillardet, J.; Dupré, B.; Louvat, P.; Allegre, C.J. Global silicate weathering and CO2 consumption rates deduced from the chemistry of large rivers. Chem. Geol. 1999, 159, 3–30. [Google Scholar] [CrossRef]
- Taylor, S.R.; McLennan, S.M. The Continental Crust: Its Composition and Evolution; Blackwell: Oxford, UK, 1985; pp. 1–312. [Google Scholar]
- Shaaban, A.M.; Mansour, H.A.; Saber, A.A. Unveiling algal biodiversity of El-Farafra Oasis (Western Desert, Egypt) and potential relevance of its use in water bio-assessment: Special interest on springs and drilled wells. Egypt J. Phycol. 2015, 16, 47–75. [Google Scholar] [CrossRef]
- Wołowski, K.; Saber, A.A.; Cantonati, M. Euglenoids from the El Farafra Oasis (Western Desert of Egypt). Pol. Bot. J. 2017, 62, 241–251. [Google Scholar] [CrossRef][Green Version]
Publisher’s Note: MDPI stays neutral with regard to jurisdictional claims in published maps and institutional affiliations. |
© 2022 by the authors. Licensee MDPI, Basel, Switzerland. This article is an open access article distributed under the terms and conditions of the Creative Commons Attribution (CC BY) license (https://creativecommons.org/licenses/by/4.0/).