Abstract
In the field of railway operation, it is essential to establish uniform conditions for interconnectivity requirements and compatibility of equipment in the Pan-European railway area to ensure effective interoperability. It also includes, for example, the introduction of a control system with modern and advanced interlocking systems (safety devices). The European Train Control System (ETCS) is a single European train protection system that will increase safety in rail transport. Nevertheless, this system may have an impact on the throughput on those railway lines where it is applied. The main research objective is to determine the impacts and effects of the configuration of track signaling equipment on the operational management of traffic and especially on the creation of a traffic plan. The optimization of transport processes on the railway infrastructure means creating the conditions for achieving higher throughput performance, especially including a higher number of train paths into the train traffic diagram. This paper examines and compares the impacts of ETCS and its levels (in particular ETCS L3) on the practical throughput of the selected national infrastructure manager. A heuristic procedure is used with the application of the analytical methodology of the Railways of the Slovak Republic (ŽSR), which uses the principles of mathematical statistics and probability. Significant comparative indicators are occupancy times and the degree of utilization of practical throughput. These are used in investment decisions in the modernization of line sections to achieve interoperability of the railway system.
1. Introduction
Rail transport occupies a significant position in Europe, offering the diversity of the infrastructure network. It provides a low-cost, long-term sustainable and especially ecological way of transporting passengers and goods practically over various long distances. Railways often become the main artery for the flow of freight and passenger traffic at the national and international level with gradual electrification, modernization, and construction. However, within transnational transport, railways become less flexible, and carriers have to overcome operational problems in the form of national interlocking systems for individual national railway infrastructure managers [1].
The European Union has established a single procedure to address these problems for all Member States by introducing a single European train control system—ETCS. This process began with the establishment of a core network of ETCS-equipped corridors across the countries of the European Union based on strategy papers. These corridors respect the network of TEN-T corridors that were established earlier. The unification of the signaling system will contribute to the operational interoperability and acceleration of traffic on these lines. Rail transport will become more competitive than other modes of transport. The individual stages of the ERTMS/ETCS track-side equipment are divided into the following application levels [2]:
- L0—zero application level referred to as ETCS L0;
- L NTC—application level referred to as ETCS NTC;
- L1—first application level referred to as ETCS L1;
- L2—second application level referred to as ETCS L2;
- L3—third application level referred to as ETCS L3;
- L3 R—application level referred to as ETCS L3 Regional.
The new ETCS system has both positive and negative effects on rail transport. Although it increases safety on railway lines where it is applied, it can also directly affect the permeability of railways. Berger et al. [3] presented ERTMS system as a standard for railway across Europe and complex real-time system that guarantees safety at all times. Ghazel [4] described the necessity of level-crossing safety in the ERTMS L2/3 operation context. In this paper, we examine and compare the impacts of the ETCS system on a selected section of the line using methods for calculating the practical throughput on ŽSR lines [5]. A similar issue of applying ETCS L2 system to the main rail passenger lines was discussed in Danish infrastructure [6].
When we compare ETCS with the automatic block, we find that there are more problems with the practical throughput of the particular railway line sections equipped with ETCS. In the case of the practical throughput determination, the line (spatial) sections are assessed according to the braking distance, which can ultimately reduce the throughput. The principle of this problem is shown in Figure 1.

Figure 1.
Monitoring line sections according to braking distance.
ETCS application level 1 without additional means (Euroloop, in-fill radio) does not allow for achieving this line throughput as some modern national systems (CIR-ELKE2). The reason is the use of only point transmission of information between the track and vehicle part of the system. Additionally, during the deployment, vehicles or lines must be equipped with both systems (ETCS and national train protection), which increases costs.
In this paper, we examine and compare the impacts of the ETCS system on a selected section of the line using methods for calculating the practical throughput on ŽSR lines [7].
At the end of 2017, 4500 km of the main corridor network and more than 7000 vehicles equipped with the ETCS mobile unit were operational in accordance with ERTMS (European Rail Traffic Management System) [8]. European legislation is constantly implementing new directives and constantly amending older ones to make ERTMS an integral part of the European Railway Area. Directive 2017/6/EC set new targets for the deployment of ERTMS by 2023. This directive stipulates that 30–40% of the core network of corridors will be equipped in accordance with the ERTMS project. Particular attention is given to the individual cross-border interconnection of individual national infrastructures to increase the efficiency of operations on a transnational scale. Figure 2 shows the ETCS corridors network. The sections equipped with ERTMS/ETCS until 2023 are marked in green [8].
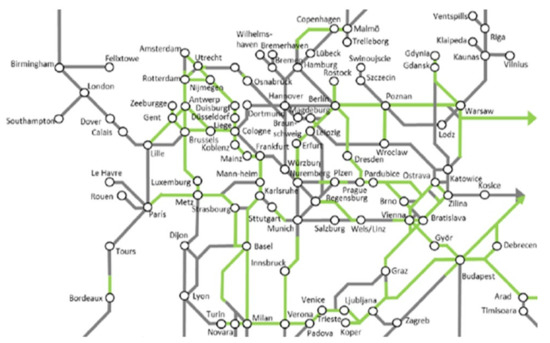
Figure 2.
ETCS corridor network [8].
2. Materials and Methods
This section lists several materials (publications, studies, thesis, etc.) that were studied and from which this research is based. The methods used are described as follows.
2.1. Materials
There are many specific features and methods used in transport processes and railway infrastructure capacity optimization. Whereas these are stochastic processes that contain many random features, it is important to know and explore the best-known stochastic methods. Consequently, these methods can inspire creation of new methods, methodological and heuristic procedures, and other scientific outputs. For example, the employment of Monte Carlo experiments is described in [9]. This method can be used in physical and mathematical problems (it is the most useful method in cases when it is difficult or impossible to use other approaches). A practical application of the methods for optimizing the fleet capacity is presented.
Infrastructure planning is also very important for the traffic service determination. These problems are related to capacity issues. More details of the railway infrastructure capacity estimation are in [10]. A model of the transport capacity of the railway infrastructure is described, based on the types of wagons used. The methods used and results reported for the capacity analysis of the network timetable are described in detail in order to identify the critical issues [11]. Multiple stochastic simulations and the consistency of recent stress-test simulations are also explained. The next paper presents the characteristics of that segment of the Czech railway network from the perspective of all scopes evaluated within a specific research project of the Czech Technical University in Prague (CTU), Faculty of Transportation Sciences. A general multibranch categorization of regional lines is proposed, arising from their technical and economic parameters, and a potential for traveling [12].
Another useful publication [13] reviews research into railway vehicle circulation, where the main topics are progressive methods of vehicle and bus-driver scheduling. Mathematical approaches of bus-driver scheduling are the main field of the research where the author describes some mathematical algorithms used to optimize the scheduling. A very interesting article [14] is concerned with the question of whether the introduction of innovative and smart technologies can guarantee the sustainability of future transport processes and passenger transport.
There are also wide range of publications and studies that examine the issue of railway capacity. For example, [15] presents a pricing model of railway infrastructure capacity allocation that functions as a regulatory measure while fulfilling regulatory requirements on railway infrastructure capacity allocation. The aim of the proposed model is to motivate not only railway undertakings, but also the railway infrastructure capacity allocator to submit requests for railway infrastructure capacity in an annual working timetable mode rather than in an individual ad hoc mode.
The next paper [16] describes testing of railway infrastructure capacity in a computer-based simulation model, which provides results for further research into this issue. To relate a maintenance function to the capacity situation, a fuzzy inference system is used for aggregating selected railway infrastructure performance indicators in [17]. The selected indicators consider the safety, comfort, punctuality, and reliability aspects of railway infrastructure performance. Some very useful information and advanced and progressive features about railway infrastructure are described in publications [18,19].
The ETCS has been a very important topic in recent years. Its system structure and working principles are presented in [20]. Redundant train–distance measurement strategies are adopted to ensure its availability. The safety performance of the overall system is evaluated, and it is compared with ETCS-2. Some very interesting and useful information is provided in [21], where differences between ETCS for 1435 and 1520 mm railway gauges are presented. Technical problems and proposed solutions regarding ETCS implementation in the Baltic states are described. Finally, we drew some scientific and professional knowledge from the contributions focused on transport and economic processes. In addition to the stationary track-side part of the ETCS system, ETCS mobile equipment is also necessary. The scope of this article is to point out the possibility of increasing practical throughput, while the choice of the right means of transport is also important. Using tilting units in service can reduce travel times on the railway track section [22].
Correct setting of train path allocation within the use of railway infrastructure capacity is a basic assumption for a functioning ETCS system. Decision-making is also very important process [23]. The efficiency of using traffic routes is based on correct optimization of combined routes in order to maximize the indicator of the use of rides [24]. Transport process settings also depend on an effective management approach related to monitoring the flows in railway sector [25]. However, there are still many unexplored elements and features in railway infrastructure capacity and new ETCS variants implementation. Therefore, this contribution examines the implementation of the most modern ETCS L3 variant for conditions of the selected Slovak railway line.
2.2. Methods
The procedure for solving this problem was implemented by using currently existing scientific methods, which are employed in the field of railway infrastructure capacity calculations. The proposal part is largely based on the heuristics, which include methods offering and discovering new ways of solving problems and inventing certain new contexts. It is a scientific activity based on a “discovery” procedure, which usually starts with a general proposal, or some rough estimate, which is gradually refined. Heuristic methods represent an intersection between empirical and exact methods. The proposed procedure is also based on this intersection with some steps using exact methods or exact problem-solving procedures. The Slovak Railway infrastructure manager (ŽSR) as an exact method is used. Its basic principle consists of the operating intervals and practical throughput calculation on the Slovak Railway network. For this calculation, the formulas presented in Section 3 are used [26].
The heuristic method is applied to the heuristic procedure shown in Figure 3. In this case, the application of these methods is novel, and the methods are used to calculate the practical throughput of the railway line after the introduction of the most modern innovative variant ETCS L3. Initially, it is necessary to define this ETCS variant correctly. It means to reveal effectively its strengths as well as weaknesses. Subsequently, it is essential to choose the appropriate line section based on its nature and suitability where it is actually possible to implement the ETCS L3 variant in practice. The calculation of the arrival and departure train sequence interval time represents the next step. Based on these data, it is then possible to calculate the practical throughput on the specified line section using the ŽSR method after the implementation of this variant. The last step is to compare the resulting value with the current situation, and for the case of implementing other variants of ETCS. The individual steps noted are shown in Figure 3. It is possible to describe this as a type of heuristic procedure [27].
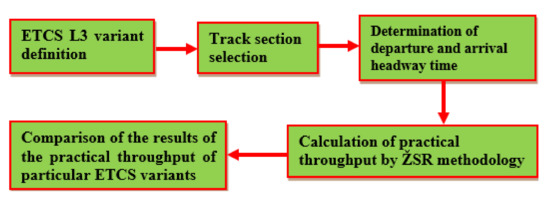
Figure 3.
Heuristic procedure for solving the problem of line capacity calculation.
The ETCS L3 application level is a train control system with radio transmission of information between the stationary and the mobile part of the ERTMS/ETCS system via the GSM-R communication network. It is another extension of the L1 and L2 application levels. The train running is controlled by the RBC (radio block center), into which the functions of the control systems are integrated [2].
The train itself can safely report its position via the GSM-R communication network provided that the train is equipped with technical means to check the integrity of the train. As a result, there is no need for conventional vehicle detection devices as long as all vehicles are equipped with this system. The train running authorization is sent from the RBC via the Euroradio and via the GSM-R communication network. Non-switchable balises serve primarily as reference location points. The ETCS L3 application level requires two-way information transfer between the trackside and the mobile part of the ERTMS/ETCS system. If this application level is used, the need for the existence of fixed track sections, and thus light signals is eliminated. The ERTMS/ETCS L3 system enables control of train journeys in moving block sections. Visual demonstration of ETCS L3 components is shown in Figure 4 [2,27,28].
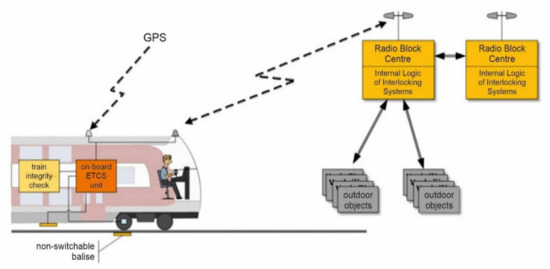
Figure 4.
Visual demonstration of ETCS L3 components [29].
3. Results
This section contains specific research results and consists of several subsections.
3.1. Case Study in Slovakia
When selecting the railway line section, we considered the planned development of ETCS in the conditions of ŽSR but also in the countries of the European Union. For this reason, the Štúrovo–Bratislava railway line was chosen. This track is part of the IV. Pan-European corridor and its importance will grow in international passenger and freight transport.
The line passes through the southern Slovakia, and it connects the capital of Slovakia, Bratislava, with the state border of Hungary. The entire line is double-track and electrified by a 25 kV 50 Hz AC traction system. The track measures 149 km from the state border in Štúrovo to Bratislava. In the Bratislava–Nové Zámky section, a non-public GSM-R network is applied, which serves for the organization and management of railway transport. Currently, the network is only used for voice communication between the train driver and the train dispatcher.
The line section selected for the assessment of individual variants of the ETCS application was the line section from Sládkovičovo to Senec. This section was chosen because of several aspects. The first is the fact that the highest line speed between the Sládkovičovo–Senec stations is up to 140 km/h. The second factor is that it is the longest interstation section on the ŽSR network, with a length of 16 km. The selected section shown in Figure 4 is also a limiting section for calculating the resulting practical throughput of the line.
3.1.1. Train Station Sládkovičovo
The railway station is equipped with a signaling control system of the third category of safety relay, type AŽD 71, and supplemented with a warning-light crossing safety-control system and a two-way automatic block with the possibility of switching the main station tracks to the automatic block mode in both directions [30].
There is a third category control system in the Sládkovičovo–Senec interstation section. It is a three-signal automatic block that allows for controlling the movement of trains in both directions on both tracks. The interstation section is divided into eleven track-line sections by automatic signals [30].
3.1.2. Train Station Senec
There is a signaling control system of the third category of safety relay, type AŽD 71, and supplemented with a crossing-control system (with barriers) on the 79.330 km. At this railway station, there is a two-way automatic block with the possibility of switching the main station tracks to the automatic block mode in both directions [31].
3.1.3. Brief Description of the Railway Operation between Sládkovičovo and Senec
The line from Sládkovičovo to Senec is considered to be very busy based on the analysis of a timetable fragment. Regional suburban trains play an important role because the line lies in the agglomeration of the capital. Regional trains (Os) run in a two-hour cycle from 4:00 to 22:00. During rush hour, more passenger trains and regional express (Rex) trains are engaged. During 24 h, a total of 25 trains of the Os and/or Rex category pass the Sládkovičovo–Senec section. International long-distance passenger traffic is represented by ten Eurocity (EC) trains on the Budapest–Prague (Warsaw) route operating in a two-hour cycle. National long-distance passenger transport is represented by ten fast trains (R) operating in a two-hour cycle on the Bratislava–Banská Bystrica route. Considering freight transport, the strongest representation has running freight trains (Pn) (international or national) supplemented with international express freight trains (Nex). In total, 52 freight trains pass in the Sládkovičovo–Senec section over 24 h. Local service freight trains (Mn) are less represented and occur only on one regular train path.
The following abbreviations are used for each type of train:
- Ex—Eurocity and Express train (passenger);
- R—Fast train (passenger);
- Os—Regional train (passenger);
- Pn—Running freight train;
- Mn—Local service freight train.
In our calculations, we operated with the 98 trains listed in Table 1. The number of trains was determined by analyzing the graphic timetable in the selected section of the line.

Table 1.
Number and type of trains per day used in the calculations.
We did not consider any changes in the direction or height profiles of the line when proposing the implementation of the ETCS L3 system on the given section of the ŽSR 130 line. Additionally, we did not consider any changes in the area of the railway base or superstructure. The scope of traffic also remained unchanged.
3.1.4. Capacity Assessment—ETCS L3 Variant
The following steps are required when using the ELCS L3 control system. In order to calculate the permeability of the specified line section, it is necessary to determine the individual occupancy times with help of calculations. This system is still under development and the procedures for these calculations are not precisely defined in the conditions of ŽSR. Therefore, we adapted a methodically correct procedure for obtaining them. Initially, it is desirable to determine the speed and kilometer profile of the examined track section, which is shown in Figure 5. Shown are the maximum speeds (Vmax) in the railway station and between the line sections. The third and fourth rows show the kilometric distances between the railway stations, from the switch and after the cross switch in the Senec, Sládkovičovo and Galanta stations [32,33].
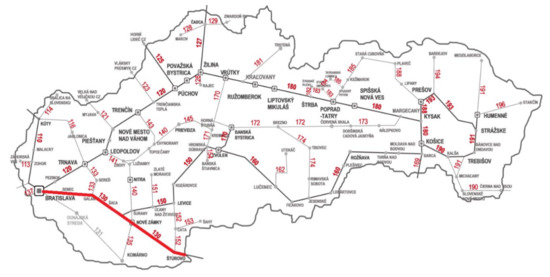
Figure 5.
ŽSR 130 route marked in red on the map.
When implementing ETCS L3, we consider a so-called floating section without signals. It does not have a fixed length or an exactly fixed position on the track. For each train, the system recalculates and determines it differently. There are only balises and sensors on the track to check the exact position of the train on the track. The connection with the train is solved through the RBC. The broad track is entirely without signals; in our case only departure signals remain at the stations [34].
In our opinion, this option is the most progressive of all the proposals. ETCS L3 has not yet been widely adopted. Its development is still ongoing. We assume that all technical train conditions are met in the proposal. We can therefore consider the operation being fully controlled by ETCS L3 [35].
3.1.5. Determination of Arrival and Departure Train Sequence Interval Times
The calculations of individual train sequence interval times are based on the procedure for determining these operating sequence interval times provided in the internal ŽSR regulation DP 1 (internal regulation of the Slovak railway infrastructure manager: “Determination operating intervals and subsequent intermediates”). Since this regulation does not recognize the ETCS L3 currently, we need to model the calculations to suit this system. Since we assume that the speed and kilometer profile will be maintained and only modifications related to the train control system will take place on the track, unmodified train driving times are used in the calculation [36,37].
The calculated stopping distances for trains are a prerequisite when determining the calculation method. These calculations are performed based on standard procedures and are subsequently shown in Table 2. However, these values are greater than the actual technical possibilities for stopping the train. In our investigation, this does not interfere as this reserve includes possible deviations from the perfect braking of the train [36].

Table 2.
Determined braking distances for ETCS L3 level (m).
In determining the subsequent train sequence interval times, we therefore use established train driving times and the calculated stopping distance of the trains, as follows [33]. For a sequence of equally fast trains:
For a sequence of the first fast–second slow train:
For a sequence of the first slow–second fast train:
The particular symbols used that require explanation are as follows (the others are explained directly in the formulas):
3.1.6. Determination Headway Times
The arrival train sequence interval time can be calculated from the departure train sequence time for the rear station as the sum of this departure train sequence time and the difference between the train driving times of the second and first train according to the general formula [36]:
3.1.7. Resulting Headway Times
Resulting headway times were determined based on procedures in the previous section and are shown in Figure 6 and Figure 7.

Figure 6.
Marked chosen railway section.

Figure 7.
Kilometric and speed profile of the track section in the Galanta–Senec direction, ETCS L3.
Figure 8 and Figure 9 show that headway times for individual train sequences are significantly shorter in comparison with the current state. The most significant savings in the headway time is, for example, in the case of a train sequence Mn–R, where this interval is shortened to 0.8 min.
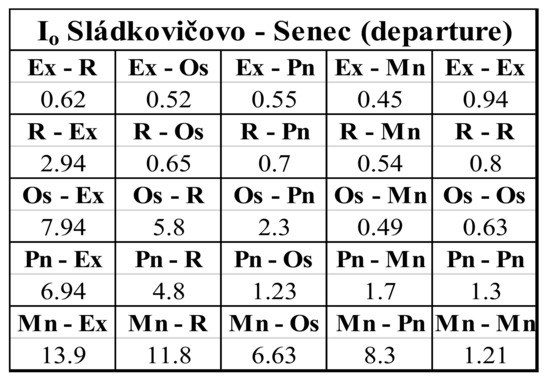
Figure 8.
Resulting headway times (in minutes) for Sládkovičovo railway station—direction from Senec station, ETCS L3.
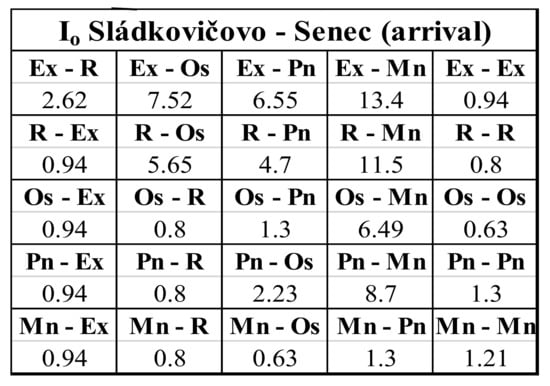
Figure 9.
Resulting headway times (in minutes) for Senec railway station—direction from Sládkovičovo station, ETCS L3.
3.1.8. Calculation of the Practical Throughput by the ŽSR Methodology
Using the ŽSR calculation method with given input data, we obtained the values presented in Figure 10.
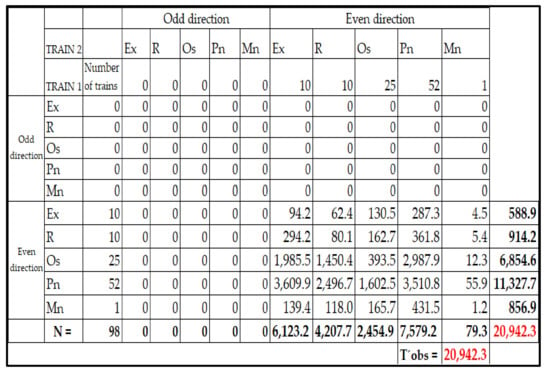
Figure 10.
Resulting table with occupancy times of individual train sequences, ETCS L3 is shown for the even direction (ŽSR methodology).
Figure 10 provides useful results, as explained below. According to the ŽSR methodology, we obtained the total occupancy time of Tobs as the sum of multiples of the product of the number of trains in the corresponding sequence and the resulting headway time of the particular train sequence (from Figure 8). Whereas there is a double track section, the method used above calculates in either an even–even or odd–odd direction. The even direction (Sládkovičovo–Senec) was chosen as the representative direction. The calculated practical throughput indicators are given in Table 3 [36].

Table 3.
Identified indicators of the practical throughput in the analyzed section, ETCS L3 for even direction.
As shown in Table 3, the condition of a minimum buffer time given by regulation D 24 is met:
This condition guarantees that the train schedule in which we consider the expected amount of regular transport of 98 trains per day is feasible. Finally, it is necessary to calculate the practical throughput and two qualitative indicators of the train schedule. Calculation of the practical throughput [35]:
Infrastructure occupation rate per one train path [37]:
Calculation of practical throughput utilization index [37]:
These calculations show that the practical throughput on a given railway section is 336 trains per day in the odd direction, which is more than the daily scheduled range of 98 trains on a given railway section. The required buffer time is lower than the calculated buffer time, so an additional train path insertion is possible. The use of the train schedule is 29.17%, so it still provides enough space for the traffic expansion on the given track section. The complex results for the even direction are the same as for the odd direction.
3.1.9. Mutual Comparison of the Resulting Practical Throughput of Individual Proposals
Full control by the ETCS L3 system is considered in this variant. The occupancy time analysis of the model train sequence is shown in Figure 11. The calculated occupancy time for this train sequence is 19.5 min.
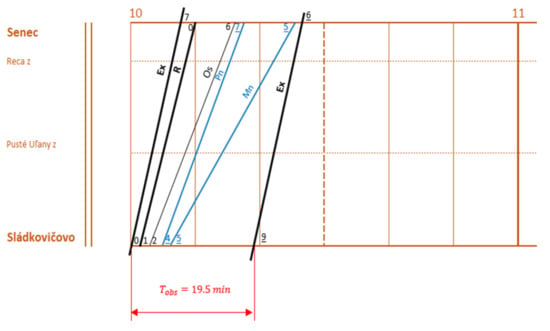
Figure 11.
Occupancy time in the interstation section (ETCS L3) for a timetable fragment.
When comparing the data obtained from the analysis of occupancy times for the model train sequence, we found the following results for configuration of the trackside signaling equipment:
- ETCS L3—19.5 min;
- ETCS L2 with optimized section lengths—29.5 min;
- LS system—29.5 min;
- ETCS L2—32 min;
- ETCS L1—41.5 min.
4. Discussion
The results of occupancy times are shown graphically in Figure 12. The comparison shows that the use of ETCS L3 appears to be the best option. Occupancy time was reduced by up to 10 min for the given train sequence when compared to the original state. Because of the occupancy time of the railway section, ETCS L1 appears to be the worst possible safety device. The ETCS L2 system offers a suitable alternative to the current situation. When combined with the automatic block, the occupancy time is extended by only 2.5 min. This fact does not have a significant effect on the capacity. However, if the ETCS L2 system with optimized sections were applied on the line, we would achieve at least the same occupancy time as at present with the automatic block. It should also be emphasized that rail safety increases with each increasing level of ETCS, however, only on the condition that each train is equipped and supervised by ETCS [38,39].
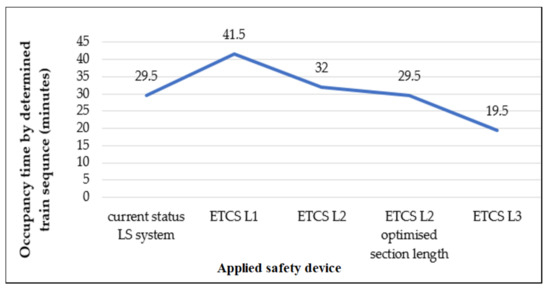
Figure 12.
Mutual comparison of the resulting occupancy times.
The graph in Figure 13 compares the practical throughput of individual variants. The graph shows clearly that the ETCS L3 system offers an optimal ratio of the practical throughput and the practical throughput occupation rate. The practical throughput is used at only 29.17% with an intended traffic volume of 98 trains per day. This system can carry up to 336 trains a day on the line. This represents 171 trains per day more than the second-best variant, ETCS L2 with optimized block section lengths. Again, the ETCS L1 system in combination with the automatic block seems to be the worst, where it is possible to carry a given mix of trains with 98 trains per day with only a small reserve. Both variants with the ETCS L2 system under consideration provide approximately the same ratio for the indicators that were examined.
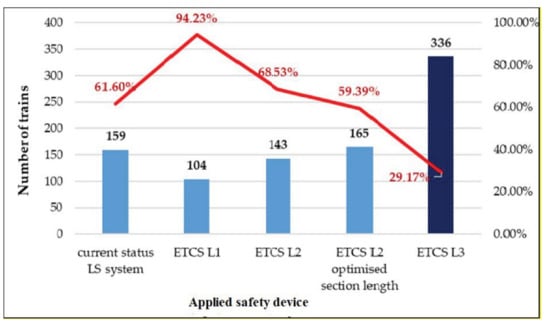
Figure 13.
Mutual comparison of the resulting practical throughput (in number of trains per day) for individual proposals.
Differences in the practical throughput between the different variants may mean an increase in profits from the sold capacity on the railway line for the infrastructure manager. In addition to increasing profits for the infrastructure manager, ETCS also has a direct impact on the design of the train schedule. With the appropriate use of this system, it is possible to plan a train path in very short sequences, which creates a sufficient reserve for the development of rail transport [20]. In developing this research, it is also possible to follow up on the ideas and outputs published in other papers [40,41].
It is also possible to state that the research mentioned is a continuation of other scientific publications that address the issue of railway infrastructure capacity. In the context of this research, it is necessary to evaluate the capacity occupation and to determine possible infrastructure bottlenecks [42], railway operational efficiency [43], consumption of railway line capacity in the context of different railway signaling systems [44], and estimate railway capacity considering vehicle circulation [45]. It is also necessary to address this issue in the context of modeling and simulation of railway infrastructure [46,47,48]. Finally, it is necessary to follow-up on publication [49], which comprehensively analyzes and evaluates ERTMS/ETCS—Level 3.
This research can be applied to other modes of transport, for example, in water transport. It can be used for port capacity or permeability and other important elements [50,51]. Further research may also focus on simulating the virtual ETCS operation on railway line initial requirements for a functional traffic environment entry acceptance, including weather conditions [52].
The contribution of this paper to the literature is considerable and significant, as it offers new ideas in the field of railway infrastructure capacity based on signaling principle. It consists mainly in describing a new procedure for determining railway capacity in the modern progressive variant ETCS L3. The article is intended mainly for the general professional public; it offers to the readers a scientific and professional point of view on the railway infrastructure capacity issue. It points out in the comparison of individual ETCS variants while explaining to the readers the advantages of ETCS L3 and also offers an interesting practical application for better understanding.
5. Conclusions
This research examines the implementation of the most advanced variant—ETCS L3. The heuristic procedure was proposed within the methodology of solving this problem. It contains several important partial steps. After the basic characterization of the ETCS L3 safety system level, the specific railway section (Senec–Sládkovičovo on double-track corridor line of the ŽSR network) was subsequently selected for the practical application of the variant. Practical throughput and other appropriate computations were calculated for this railway section and comparison of the current state with the ETCS L1 and L2 implementation alternatives was performed.
The research results show that only the implementation of ETCS L3 will bring a significant increase in throughput on double-track corridor line equipped with automatic block. The ETCS system prevents dangerous situations. In principle, it can be argued that each of the proposed options is better than the current situation in terms of safety. In terms of the impact on the practical throughput determined analytically for the prospective train traffic diagram according to the principles of the ŽSR methodology contained in regulation D24, the individual ETCS variants are not equivalent. Each variant affected the practical throughput on a different scale. The practical throughput of up to 336 trains per day was achieved with the ETCS L3 variant. This variant offers up to 177 trains per day more than the current state.
In the future, it will be possible to apply the research introduced for ETCS L3 applications to other important lines on the Slovak railway network. The ETCS L3 variant will continue to be researched and developed in the field of transport science, as it is an important progressive element in railway infrastructure. It is also one of the key tools to achieve fast, safe, and reliable railway transport.
Author Contributions
Conceptualization, M.D. and J.G.; methodology, M.D.; formal analysis, V.Š. and M.D.; investigation M.D., V.Š., J.G., V.Ľ. and M.V.; resources, M.D. and J.G.; data curation, M.D. and J.G.; writing—review and editing, M.D., V.Š., J.G., V.Ľ. and M.V.; visualization, M.D., V.Š. and V.Ľ.; supervision, J.G. All authors have read and agreed to the published version of the manuscript.
Funding
This work was supported by the Slovak Research and Development Agency under the contract no. APVV-19-0444.
Informed Consent Statement
Informed consent was obtained from all subjects involved in the study.
Conflicts of Interest
The authors declare no conflict of interest.
References
- Ministry of Transport, Construction and Regional Development of the Slovak Republic: Strategy for the Development of Public Passenger and Non-Motorized Transport in the Slovak Republic until 2020. 2014. Available online: https://www.opii.gov.sk/download/d/sk_transport_masterplan_(en_version).pdf (accessed on 21 March 2022).
- Rástočný, K.; Zahradník, J. ETCS—Single European Train Protection System. ATP J. 2005, 9. (In Slovak) [Google Scholar]
- Berger, U.; James, P.; Lawrence, A.; Roggenbach, M.; Seisenberger, M. Verification of the European rail traffic management system in real-time maude. Sci. Comput. Program. 2018, 154, 61–88. [Google Scholar] [CrossRef]
- Ghazel, M. A control scheme for automatic level crossings under the ERTMS/ETCS level 2/3 operation. IEEE Trans. Intell. Transp. Syst. 2017, 18, 2667–2680. [Google Scholar] [CrossRef]
- Rybička, I.; Stopka, O.; Ľupták, V.; Chovancová, M.; Droždziel, P. Application of the methodology related to the emission standard to specific railway line in comparison with parallel road transport: A case study. In MATEC Web of Conferences; EDP Sciences: Les Ulis, France, 2018; Volume 244, p. 3002. [Google Scholar] [CrossRef]
- Vignali, V.; Cuppi, F.; Lantieri, C.; Dimola, N.; Galasso, T.; Rapagna, L. A methodology for the design of sections block length on ETCS L2 railway networks. J. Rail Transp. Plan. Manag. 2020, 13, 100160. [Google Scholar] [CrossRef]
- Černá, L.; Ľupták, V.; Šulko, P.; Blaho, P. Capacity of main railway lines—Analysis of methodologies for its calculation [print] [kapacita hlavných železničných trait—Analýza metodík ich stanovenia]. NAŠE MORE Znanstveni Časopis za More i Pomorstvo 2018, 65, 213–217. [Google Scholar]
- European Comission. Delivering an Effective and Interoperable European Rail Traffic Management System (ERTMS)—The Way Ahead; European Commision: Brusseles, Belgium, 2017; 375p. [Google Scholar]
- Lampa, M.; Samolejová, A. Fleet optimization based on the monte carlo algorithm. Acta Logist. 2020, 7, 17–21. [Google Scholar] [CrossRef]
- Mašek, J.; Kendra, M.; Čamaj, J. Model of the Transport Capacity of the Train and Railway Track Based on Used Types of Wagons. In Proceedings of the 20th International Conference, Kaunas, Lithuania, 5–7 October 2016; pp. 584–588. [Google Scholar]
- Hansen, I.A. Review of planning and capacity analysis for stations with multiple platforms—Case Stuttgart 21. J. Rail Transp. Plan. Manag. 2017, 6, 313–330. [Google Scholar] [CrossRef]
- Javořík, T.; Novotný, V.; Týfa, L.; Vaněk, M. Evaluation of potential of regional railway lines. Transp. Probl. 2016, 11, 111–126. [Google Scholar] [CrossRef][Green Version]
- Paluch, S.; Majer, T. The Role of Independent Sets in Decomposition of the Vehicle Scheduling Problem. In Proceedings of the 2018 19th International Carpathian Control Conference (ICCC), Szilvasvarad, Hungary, 28–31 May 2018; pp. 619–624. [Google Scholar] [CrossRef]
- Stopka, O.; Zitricky, V.; Abramovic, B.; Marinov, M.; Ricci, S. Innovative technologies for sustainable passenger transport. J. Adv. Transp. 2019, 2019, 4197246. [Google Scholar] [CrossRef]
- Široký, J.; Nachtigall, P.; Gašparík, J.; Čáp, J. Calculation model of railway capacity price in the Czech republic. Promet-Traffic–Traffico 2021, 33, 91–102. [Google Scholar] [CrossRef]
- Gasparik, J.; Abramovic, B.; Zitricky, V. Research on dependences of railway infrastructure capacity. Teh. Vjesn. 2018, 25, 1190–1195. [Google Scholar] [CrossRef]
- Famurewa, S.M.; Stenström, C.; Asplund, M.; Galar, D.; Kumar, U. Composite indicator for railway infrastructure management. J. Mod. Transp. 2014, 22, 214–224. [Google Scholar] [CrossRef]
- Vakulenko, S.P.; Kurenkov, P.V.; Chebotareva, E.A.; Solop, I.A.; Kuzina, E.L.; Vasilenko, M.A.; Barashyan, V.Y.; Astafiev, A.V.; Nadolinsky, P.V.; Gašparík, J. Influence of innovative elements of railway infrastructure complex on the technology of the transport process. Transp. Res. Procedia 2021, 55, 342–347. [Google Scholar] [CrossRef]
- Gašparík, J.; Zitrický, V.; Ľupták, V.; Čechovič, L. Assessment of Slovak rail capacity in terms of freight transport. Ing. Ferrov. 2020, 75, 105–119. [Google Scholar]
- Song, H.; Liu, H.; Schnieder, E. A train-centric communication-based new movement authority proposal for ETCS-2. IEEE Trans. Intell. Transp. Syst. 2018, 20, 2328–2338. [Google Scholar] [CrossRef]
- Liudvinavičius, L.; Sładkowski, A. Train protection systems in different railway gauges. Stud. Syst. Decis. Control 2017, 87, 273–318. [Google Scholar] [CrossRef]
- Ľupták, V.; Stopka, O.; Jeřábek, K. Draft deployment of traction units with active tilting system for regional and long-distance transport on non-modernized railway tracks. In MATEC Web of Conferences; EDP Sciences: Les Ulis, France, 2017; Volume 134, p. 00034. [Google Scholar] [CrossRef]
- Potkány, M.; Krajčírová, L. Cost reporting of the transport company and its use in decision-making. Procedia Eng. 2017, 192, 731–736. [Google Scholar] [CrossRef]
- Georgijevic, M.; Bojic, S.; Matijevic, M. Networking of information Flows—Improved concept for the inland waterway transport on the danube. In Commercial Transport; Lecture Notes in Logistics; Springer: Cham, Switzerland, 2016; pp. 219–230. [Google Scholar] [CrossRef]
- Kozan, E.; Burdett, R. A railway capacity determination model and rail access charging methodologies. Transp. Plan. Technol. 2005, 28, 27–45. [Google Scholar] [CrossRef]
- DP 1 (Internal Regulation of the Slovak Railway Infrastructure Manager—“Determination Operating Intervals and Subsequent Intermediates”). 2017. Available online: https://fpedas.uniza.sk/~gasparik/DP%201%20(10.12.2017).pdf (accessed on 1 January 2020).
- Ľupták, V.; Stopková, M.; Jurkovič, M. Proposed methodology for the calculation of overview distances at level crossings and the inclusion thereof in national standards. Sustainability 2020, 12, 5684. [Google Scholar] [CrossRef]
- Nachtigall, P.; Široký, J.; Tischer, E. The use of simulation modelling for determining the capacity of railway lines in the Czech conditions. Open Eng. 2020, 10, 224–231. [Google Scholar]
- Rástočný, K.; Nagy, P. ERTMS/ETCS–European Train Control System (2). atpjournal.sk. 2016. Available online: https://www.atpjournal.sk/rubriky/prehladove-clanky/ertms-etcs-europsky-system-riadenia-jazdy-vlakov-2.html?page_id=23411 (accessed on 1 January 2016). (In Slovak).
- PPSLA. Operating Rules of the Sládkovičovo Railway Station. Internal Operating Rules; ŽSR Bratislava: Bratislava, Slovakia, 2020. (In Slovak) [Google Scholar]
- PPSC. Operating Rules of the Senec Railway Station. Internal Operating Rules; ŽSR Bratislava: Bratislava, Slovakia, 2021. (In Slovak) [Google Scholar]
- Nachtigall, P.; Ouředníček, J. Ensuring supervision of stopping (reducing speed) in ERTMS/ETCS in context. Sci. Tech. Proc. Czech Railw. 2019, 47. (In Czech) [Google Scholar]
- Abramović, B. Infrastructure access charges. In Sustainable Rail Transport; Springer: Cham, Switzerland, 2018; pp. 45–58. [Google Scholar]
- Gašparík, J.; Šulko, P. Railway Transport Technology—Line Transport Processes; EDIS/University of Žilina: Žilina, Slovakia, 2015; 383p, ISBN 978-80-554-1171-2. (In Slovak) [Google Scholar]
- Gašparík, J.; Abramovic, B.; Halas, M. A new graphical approach to railway infrastructure capacity analysis. Promet 2015, 27, 283–290. [Google Scholar] [CrossRef]
- UIC. Influence of ETCS on Line Capacity—Generic Study. 2008. Available online: https://webinfo.uk/webdocssl/irse-kbase/ref-viewer.aspx?Refno=-1457373802&document=Influence%20of%20ETCS%20on%20line%20capacity%20-%20Generic%20study%20(Aachen%20University%202008).pdf (accessed on 1 January 2008).
- Gasparik, J.; Zitricky, V. A new approach to estimating the occupation time of the railway infrastructure. Transport 2010, 25, 387–393. [Google Scholar] [CrossRef][Green Version]
- Liang, J.; Koo, K.M.; Lee, C.L. Transportation infrastructure improvement and real estate value: Impact of level crossing removal project on housing prices. Transportation 2021, 48, 2969–3011. [Google Scholar] [CrossRef]
- Koper, E.; Kochan, A.; Gruba, Ł. Simulation of the Effect of Selected National Values on the Braking Curves of an ETCS Vehicle. In International Conference on Transport Systems Telematics; Springer: Cham, Switzerland, 2019; pp. 17–31. [Google Scholar]
- Vojtek, M.; Matuška, J.; Široký, J.; Kugler, J.; Kendra, M. Possibilities of railway safety improvement on regional lines. Transp. Res. Procedia 2021, 53, 8–15. [Google Scholar] [CrossRef]
- Široký, J.; Nachtigall, P.; Tischer, E.; Gašparík, J. Simulation of railway lines with a simplified interlocking system. Sustainability 2021, 13, 1394. [Google Scholar] [CrossRef]
- Bešinović, N.; Rob, M.P. Goverde. Capacity Assessment in Railway Networks. Int. Ser. Oper. Res. Manag. Sci. 2018, 268, 25–45. [Google Scholar]
- Diaz de Rivera, A.; Dick, C.T.; Evans, L.E. Improving Railway Operational Efficiency with Moving Blocks, Train Fleeting, and Alternative Single-Track Configurations. Transp. Res. Rec. 2020, 2674, 146–157. [Google Scholar] [CrossRef]
- Goverde, R.M.; Corman, F.; D’Ariano, A. Railway line capacity consumption of different railway signalling systems under scheduled and disturbed conditions. J. Rail Transp. Plan. Manag. 2013, 3, 78–94. [Google Scholar] [CrossRef]
- Liao, Z.; Li, H.; Miao, J.; Corman, F. Railway capacity estimation considering vehicle circulation: Integrated timetable and vehicles scheduling on hybrid timespace networks. Transp. Res. Part C Emerg. Technol. 2021, 124, 102961. [Google Scholar] [CrossRef]
- Lindfeldt, A. Validation of a simulation model for capacity evaluation of double-track railway lines. In Proceedings of the 6th International Seminar on Railway Operations Modelling and Analysis (RailTokyo2015), Tokyo, Japan, 23–26 March 2015. [Google Scholar]
- Rotoli, F.; Navajas, E.C.; Soria, A. Capacity Assessment of Railway Infrastructure: Tools, Methodologies and Policy Relevance in the EU Context; JRC Working Papers; Joint Research Centre: Ispra, Italy, 2016. [Google Scholar]
- Anderson, P.V.; Christofoletti, L.M.; Vilela, P.R.S. Analyzing railway capacity using a planning tool. In 2018 Joint Rail Conference, JRC 2018; American Society of Mechanical Engineers (ASME): New York, NY, USA, 2018. [Google Scholar]
- Biagi, M.; Carnevali, L.; Paolieri, M.; Vicario, E. Performability evaluation of the ERTMS/ETCS–Level 3. Transp. Res. Part C Emerg. Technol. 2017, 82, 314–336. [Google Scholar] [CrossRef]
- Olei, B.A. The Romanian Freight Transportation Market. In Advanced Engineering; Trans Tech Publications Ltd.: Bäch, Switzerland, 2019; Volume 34, pp. 255–260. ISSN 2234-991X. [Google Scholar] [CrossRef]
- Mako, P.; Dávid, A.; Olei, A.B. Possibilities of increasing the throughput of ports. In Proceedings of the 14th International Scientific Conference on Sustainable, Modern and Safe Transport; Online, 26–28 May 2021, Elsevier: Amsterdam, The Netherlands, 2021; pp. 426–433. ISSN 2352-1465. [Google Scholar]
- Čulík, K.; Harantová, V.; Hájnik, A. CAD software using for designing of traffic environment. Transp. Res. Procedia 2020, 44, 248–254. [Google Scholar] [CrossRef]
Publisher’s Note: MDPI stays neutral with regard to jurisdictional claims in published maps and institutional affiliations. |
© 2022 by the authors. Licensee MDPI, Basel, Switzerland. This article is an open access article distributed under the terms and conditions of the Creative Commons Attribution (CC BY) license (https://creativecommons.org/licenses/by/4.0/).