
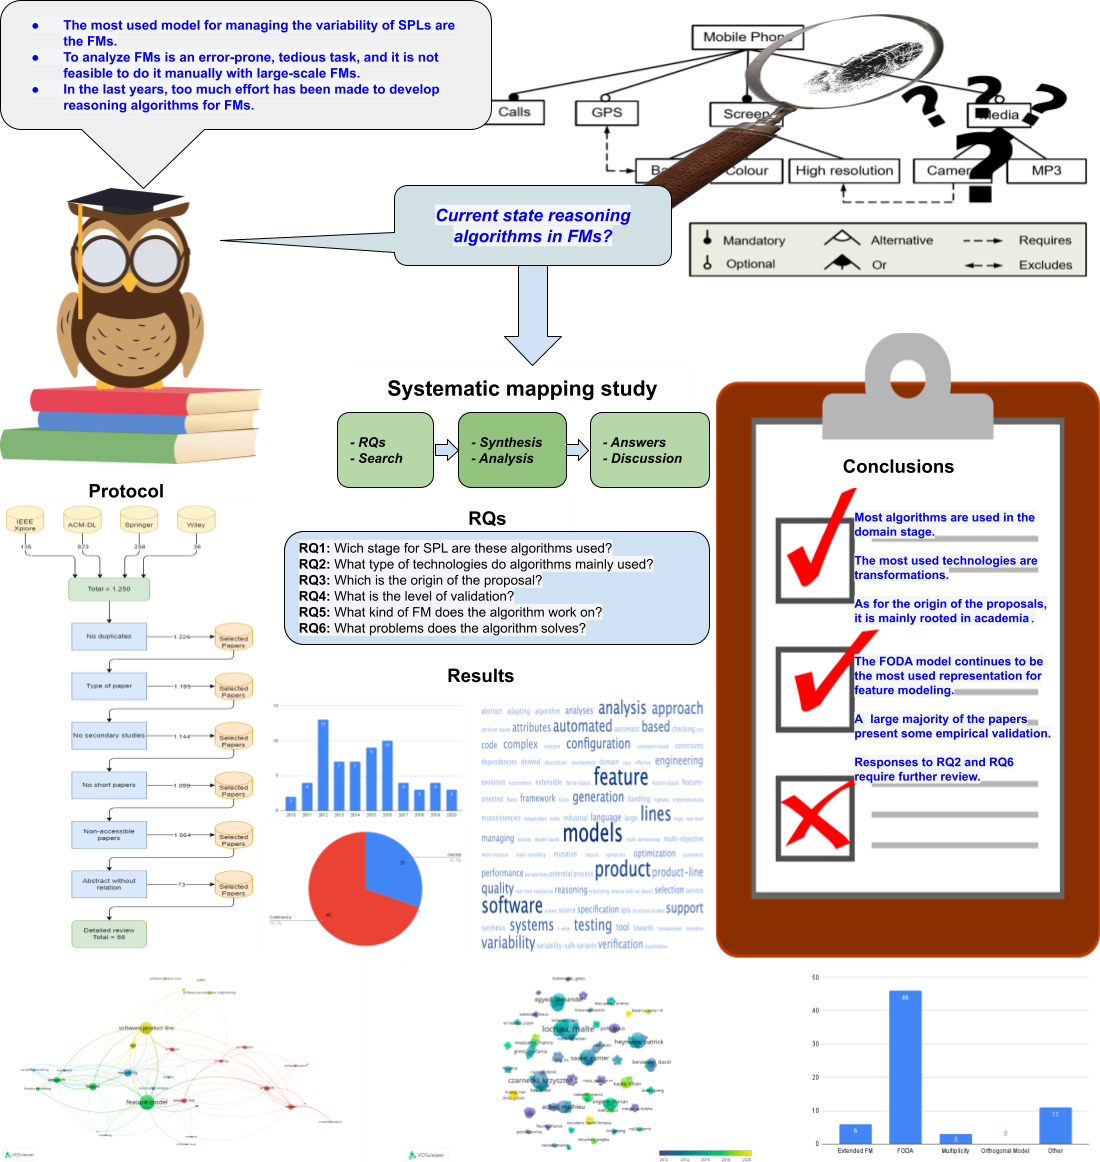
Reasoning Algorithms on Feature Modeling—A Systematic Mapping Study


Abstract
:
1. Introduction
2. Background
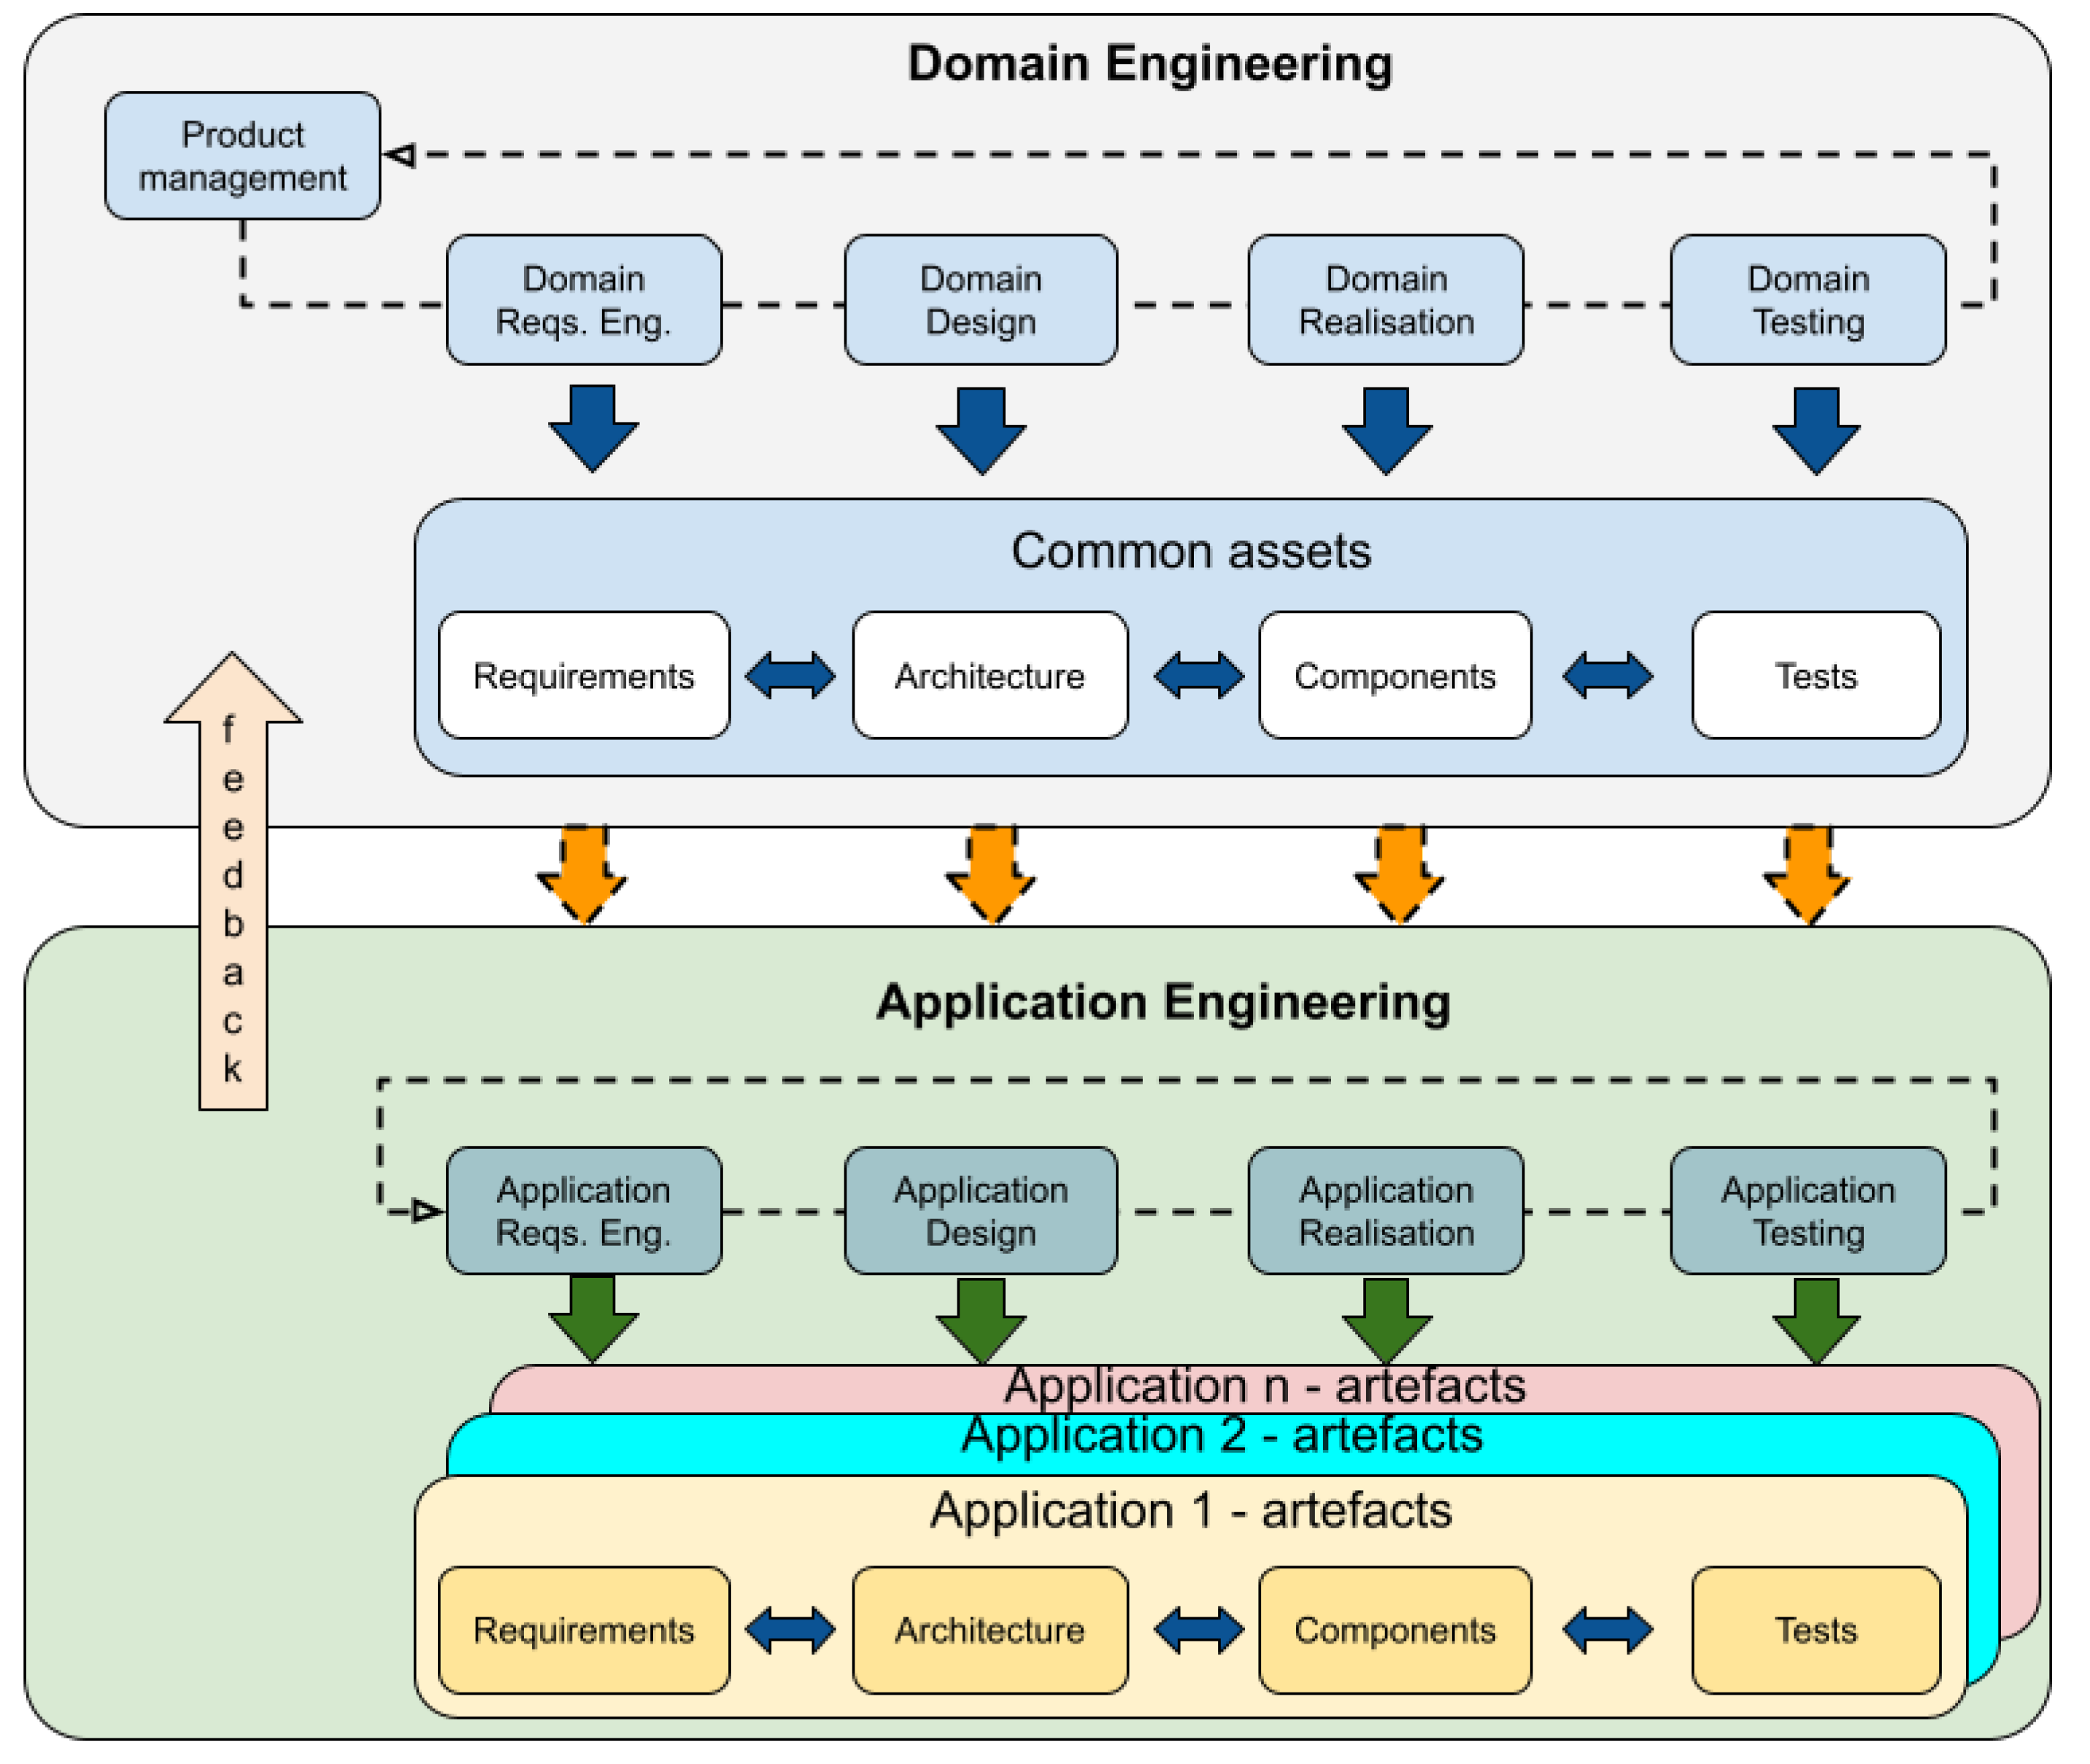
2.1. Software Product Lines
2.2. Variability
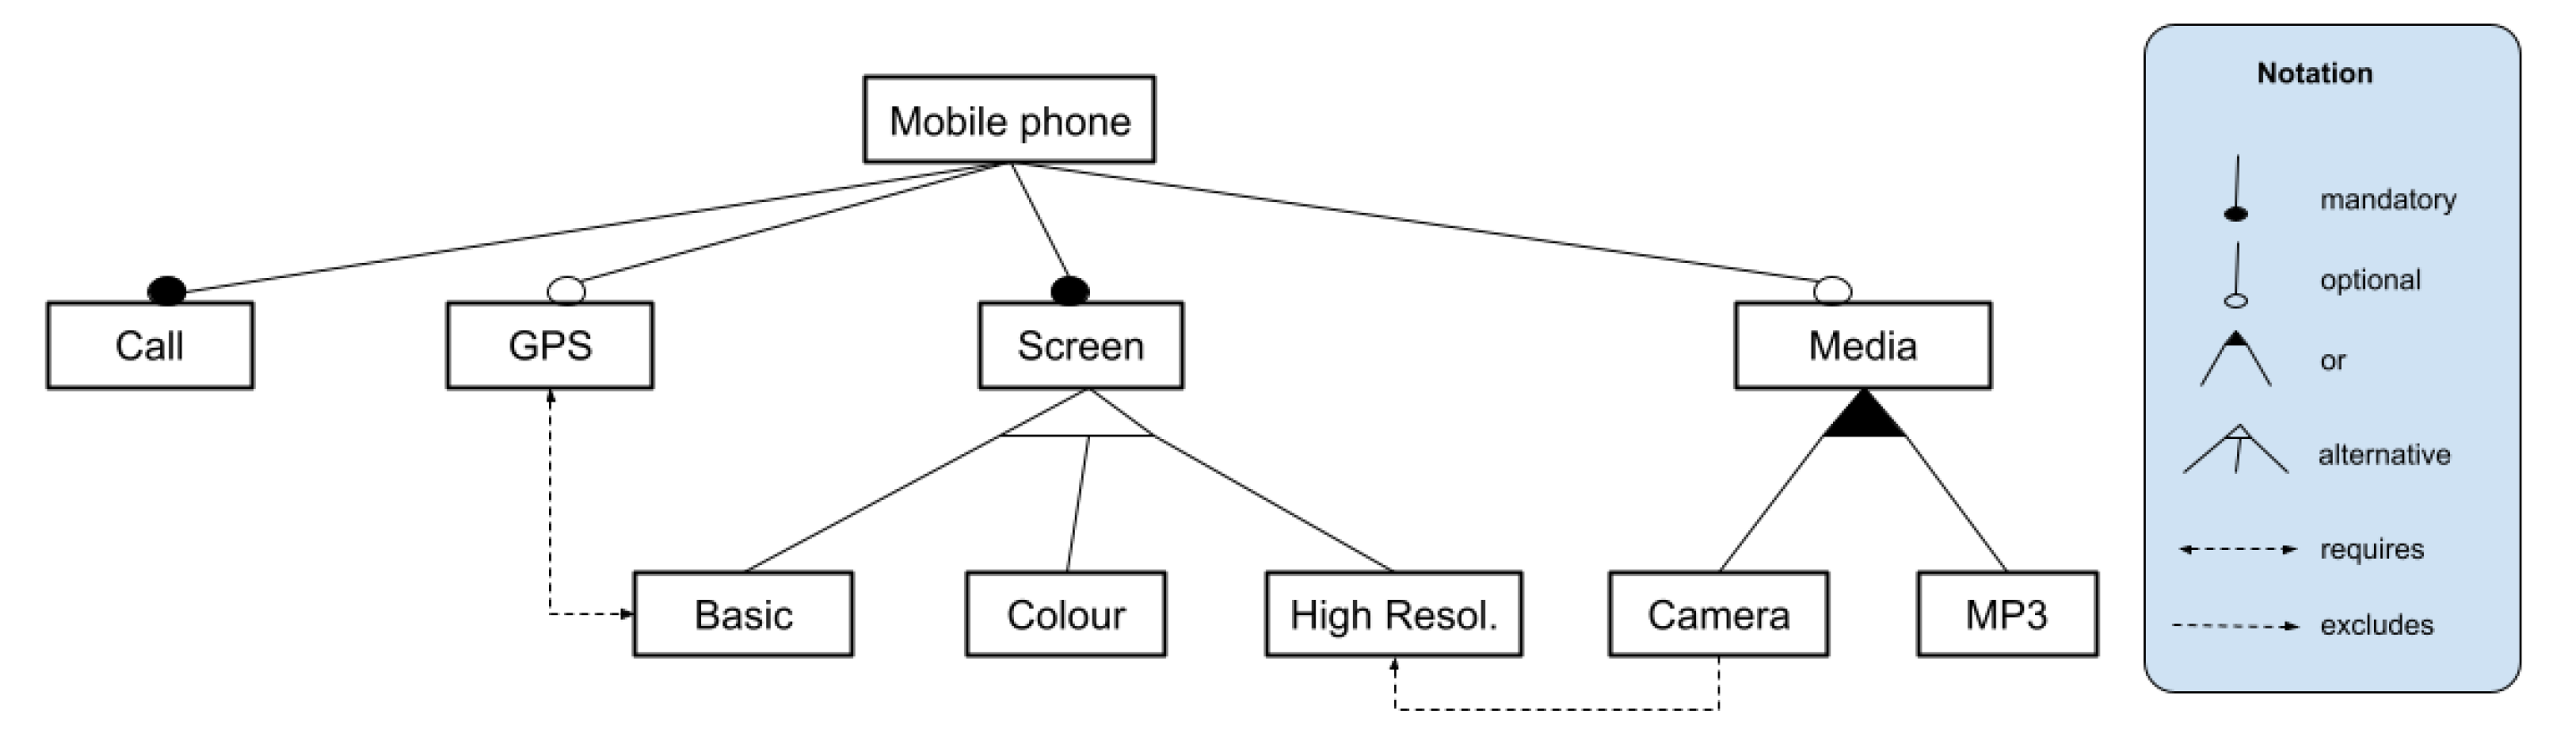
2.3. Feature Models
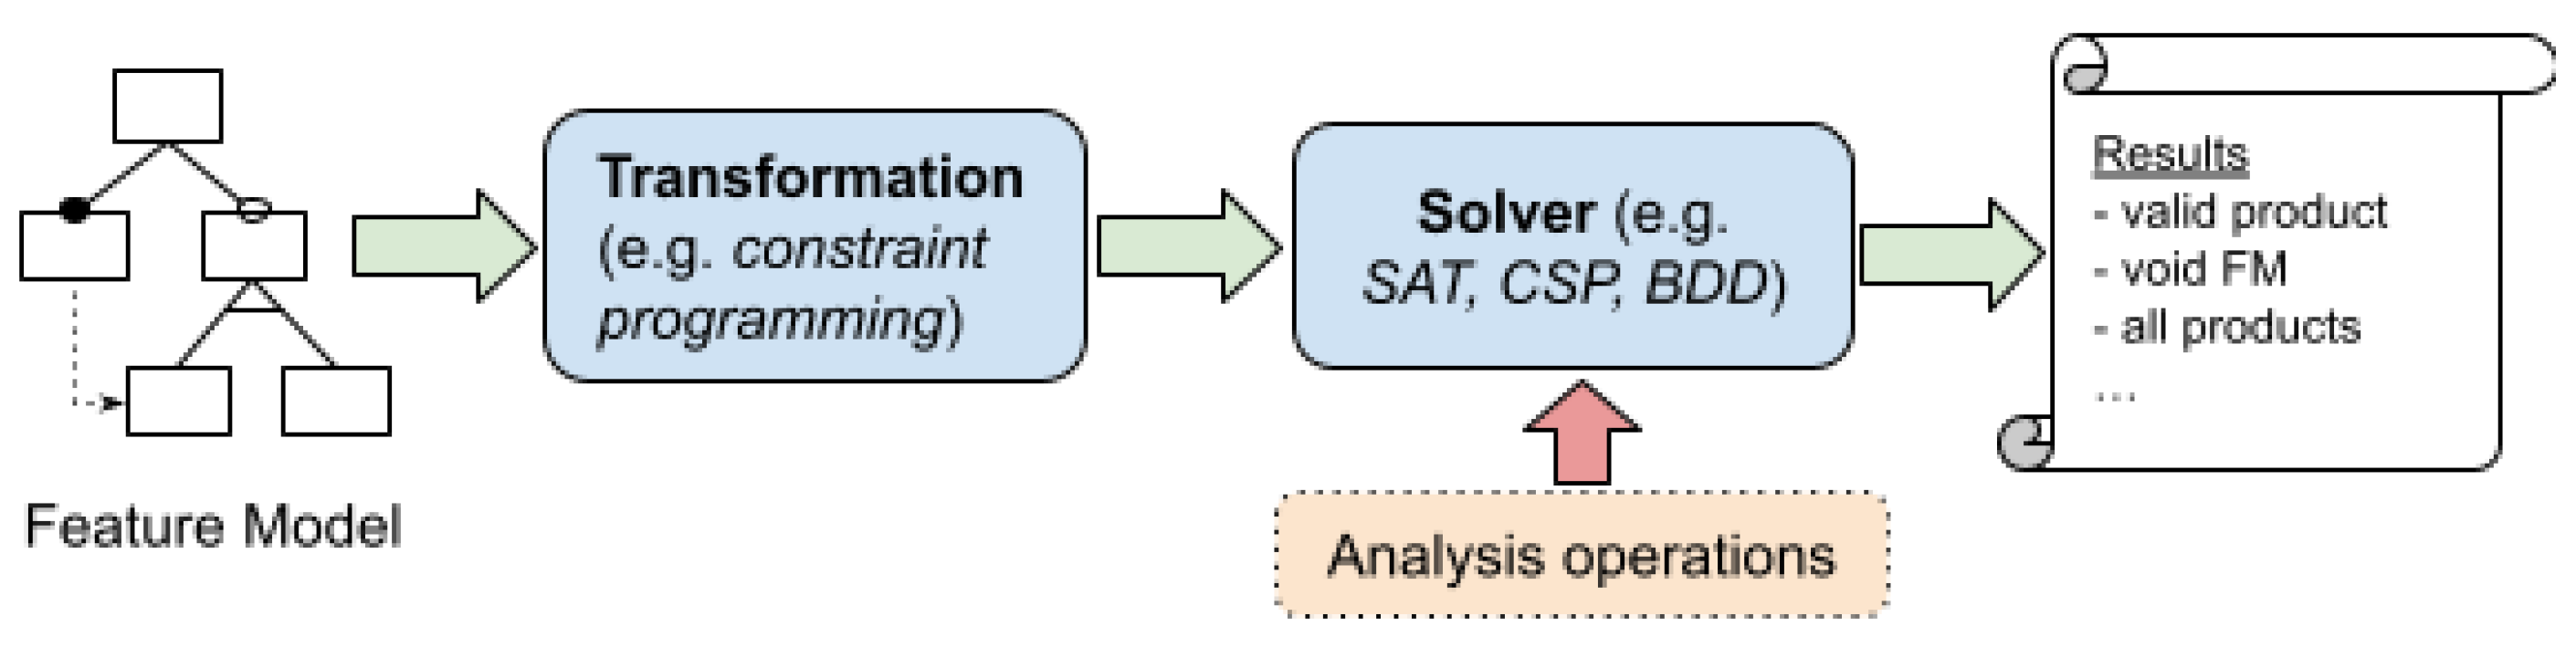
2.4. Automated Analysis of FMs–Reasoning Algorithms
3. Related Work
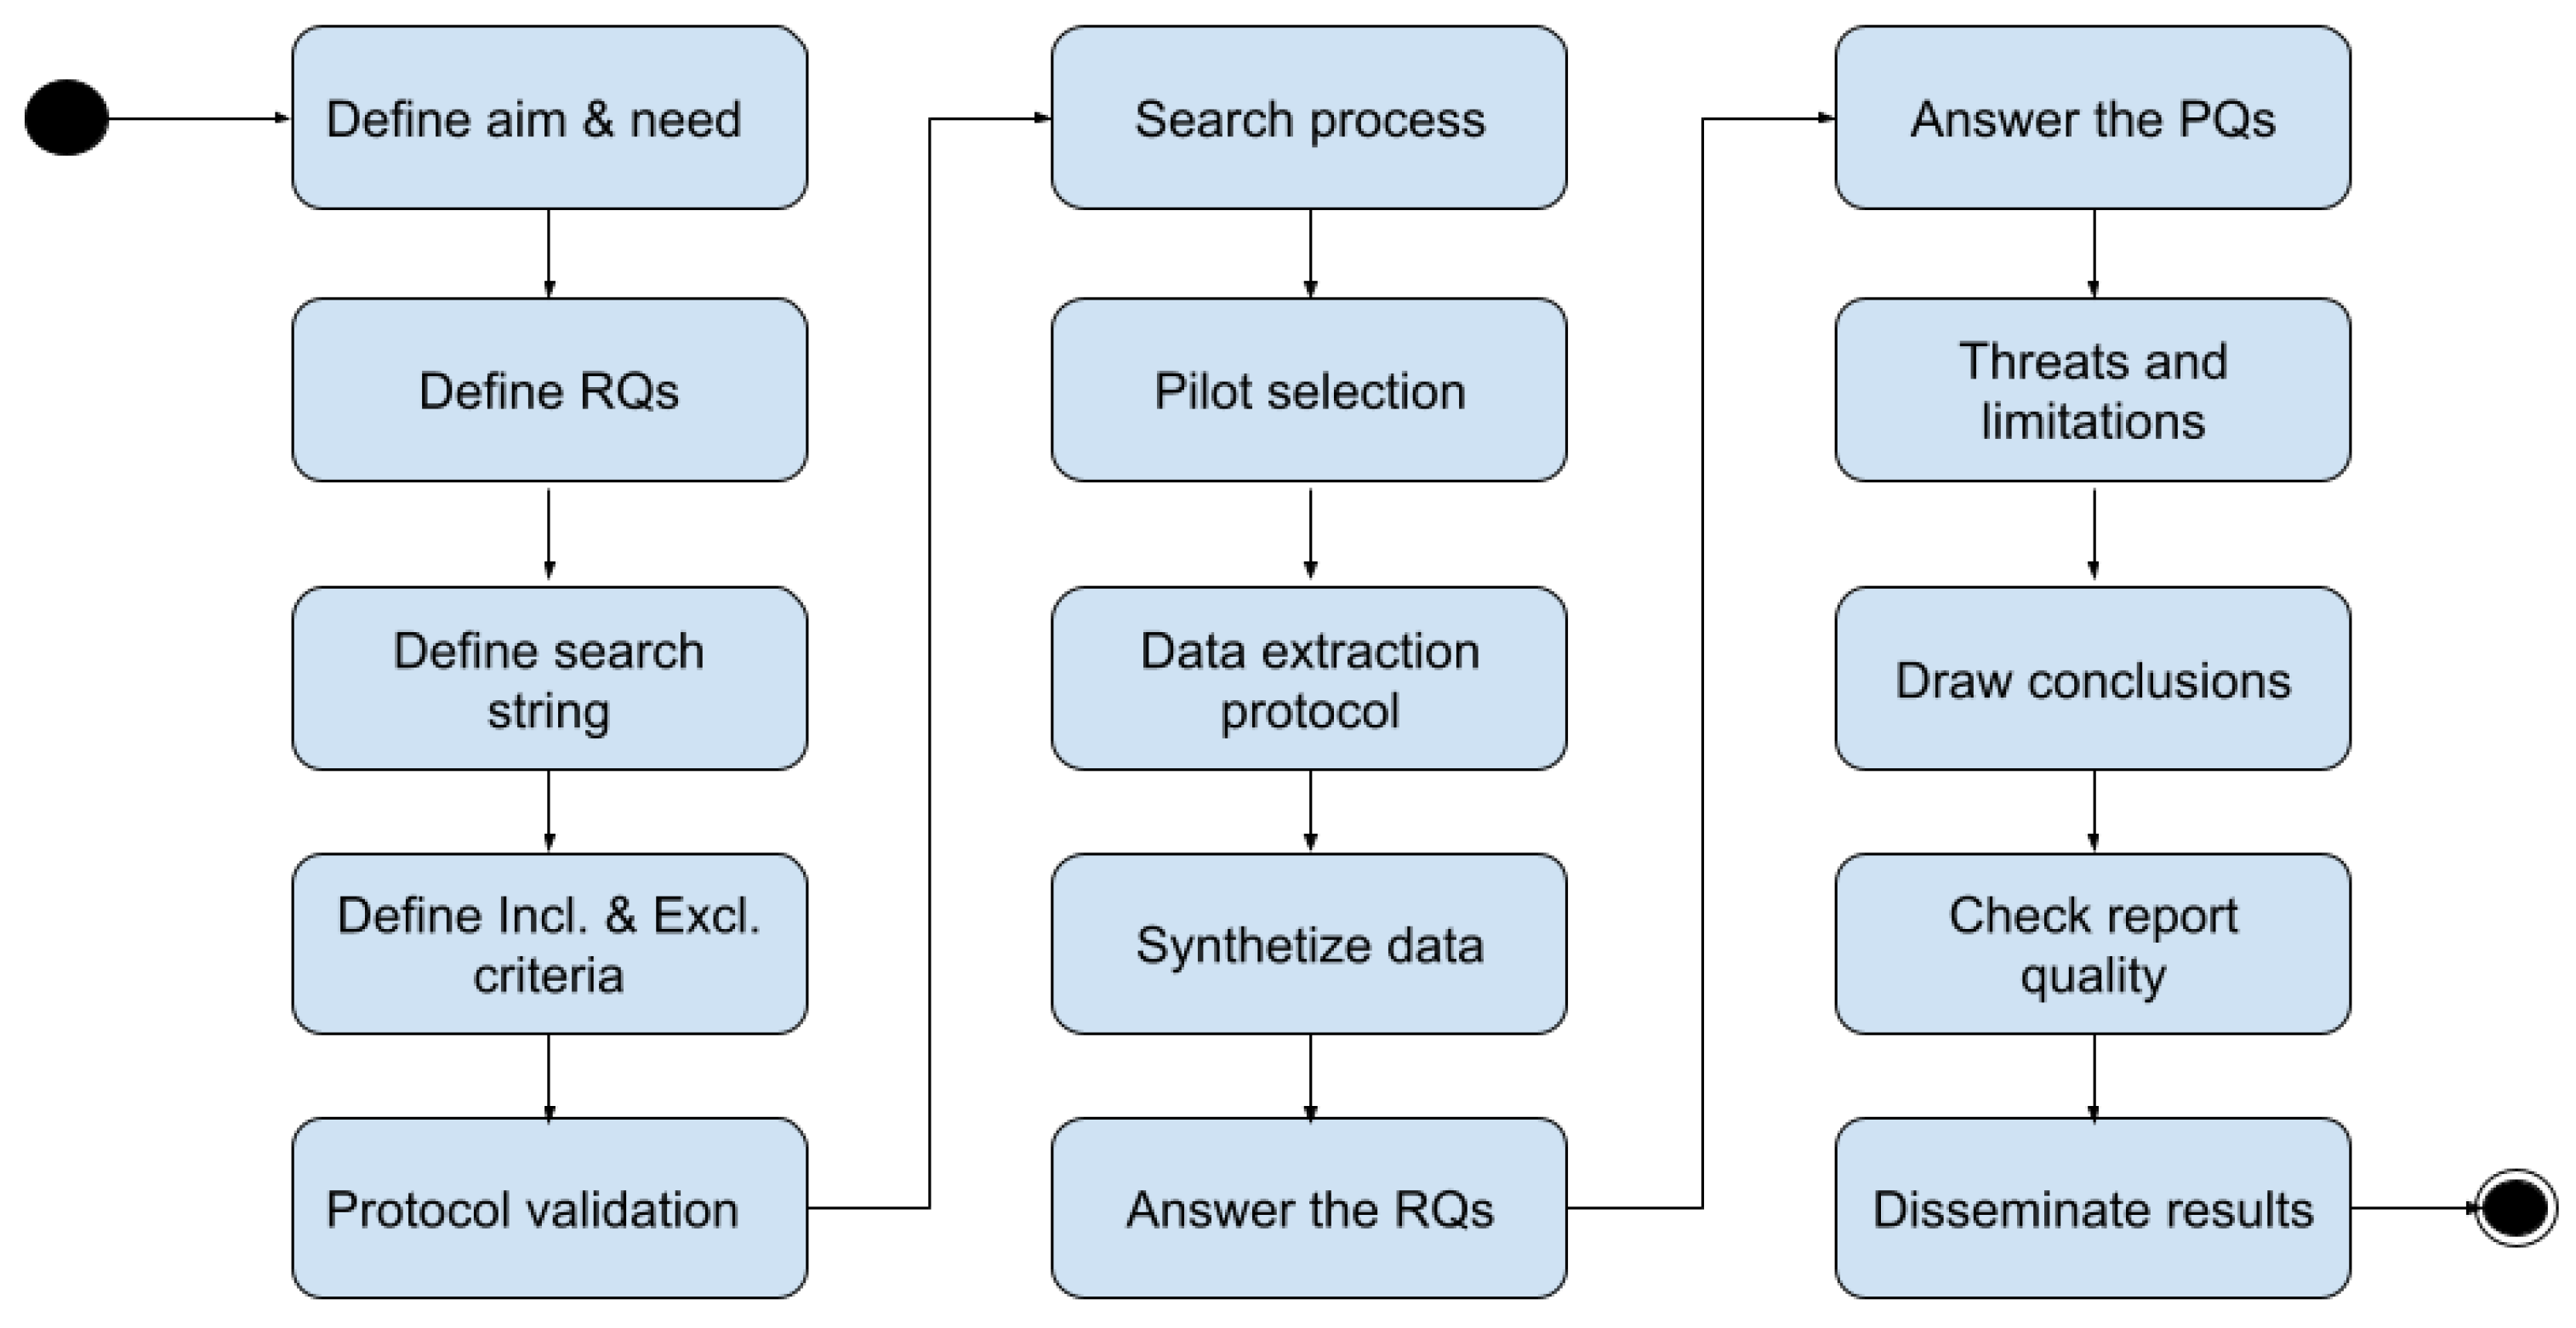
4. Methodology
4.1. Protocol Definition
4.1.1. Aim and Need
- Understand the requirements to create algorithms of this nature.
- Understand what technologies, tools, approaches, etc., are used for building these algorithms, as well as the justifications for using them in each case.
- Avoid activities or processes that have already been carried out by other authors.
4.1.2. Research Questions
4.1.3. Publication Questions
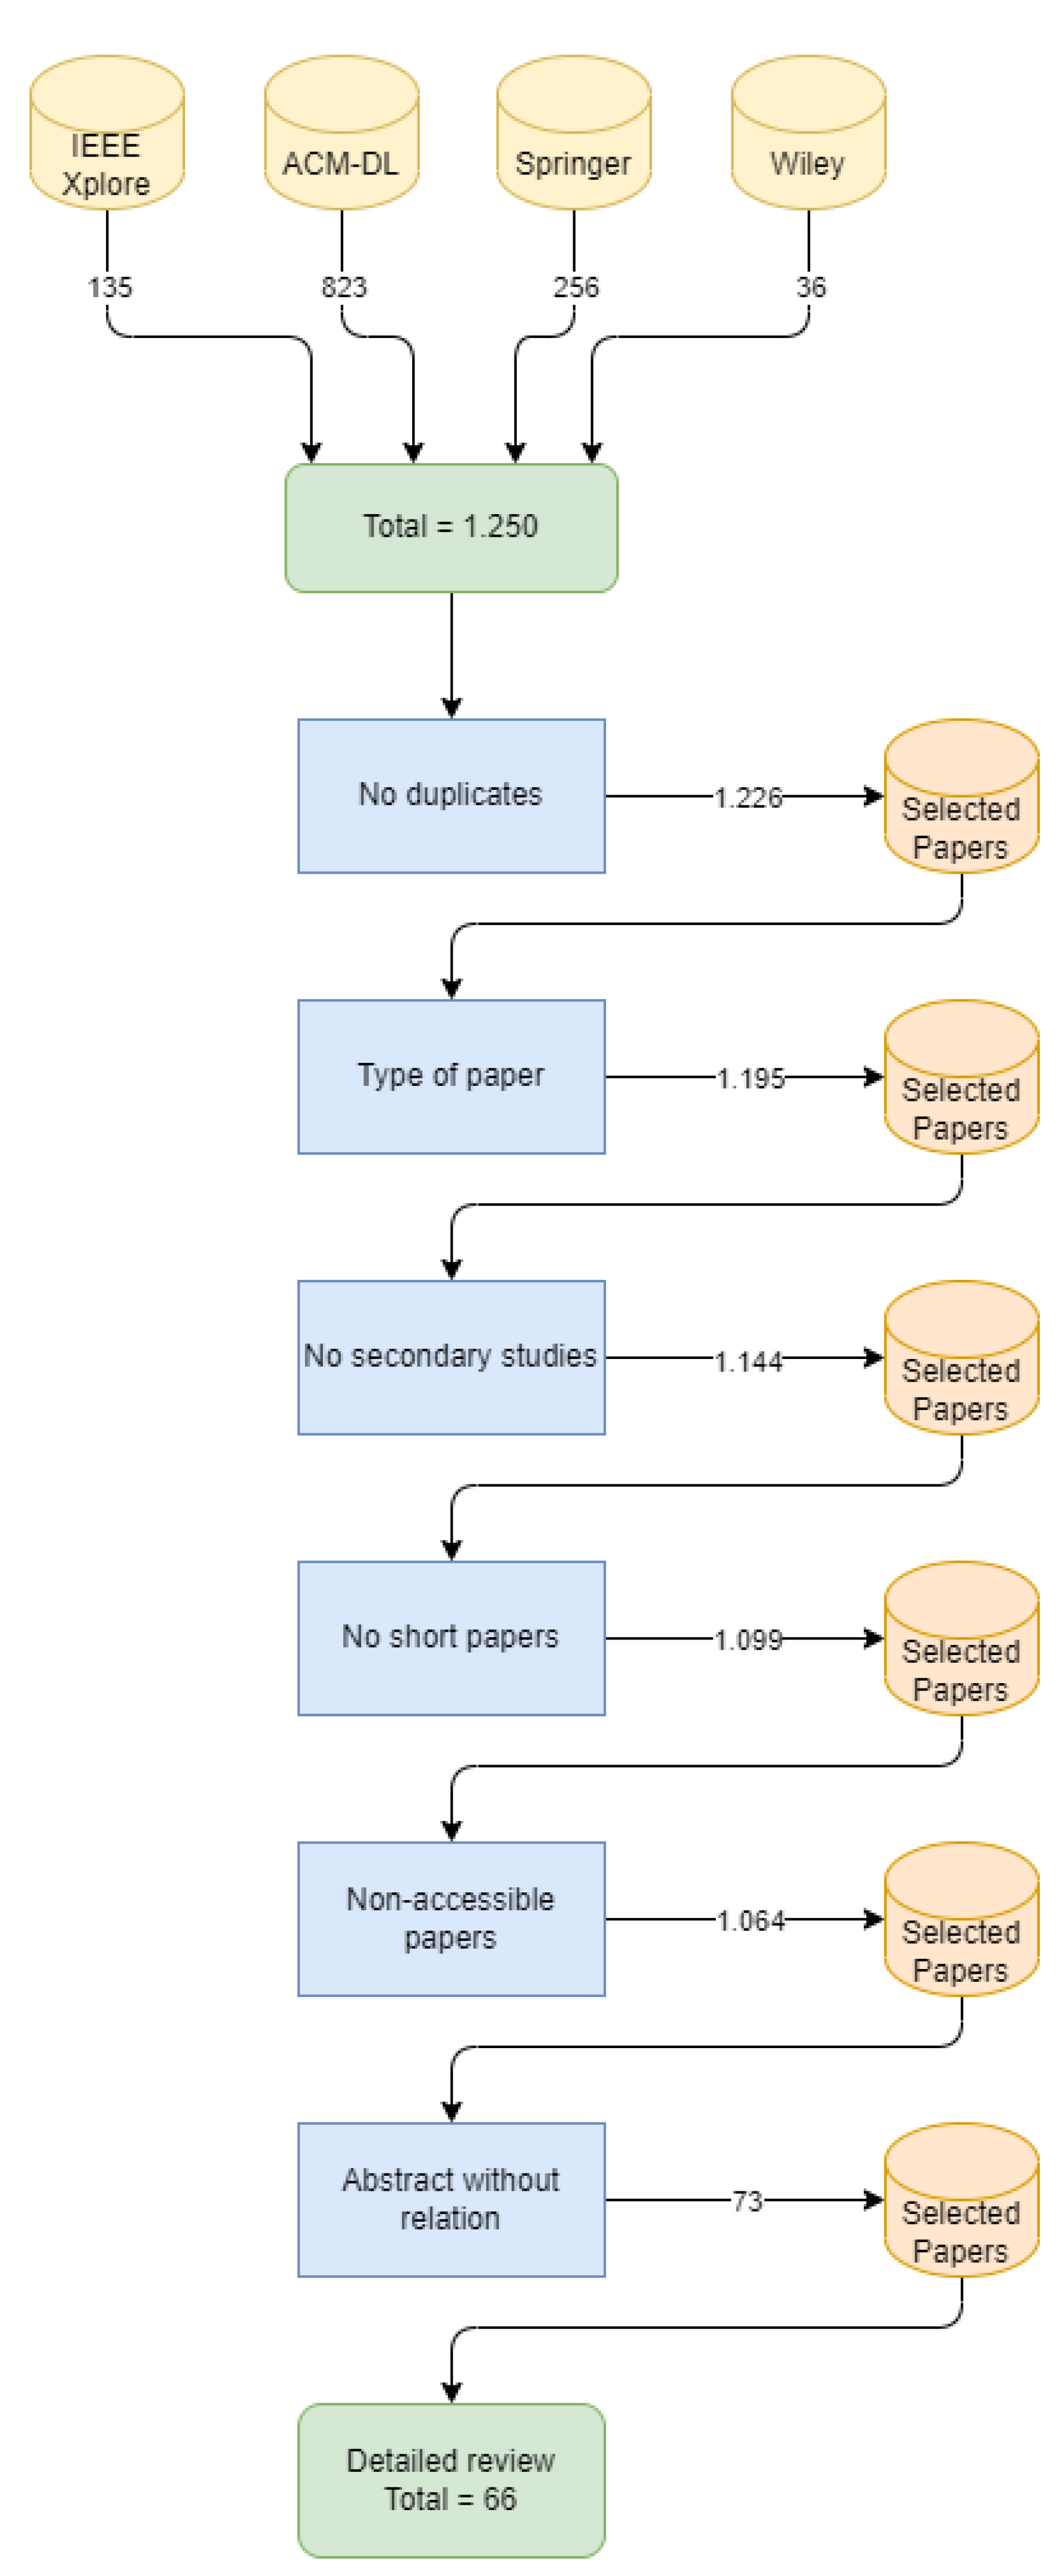
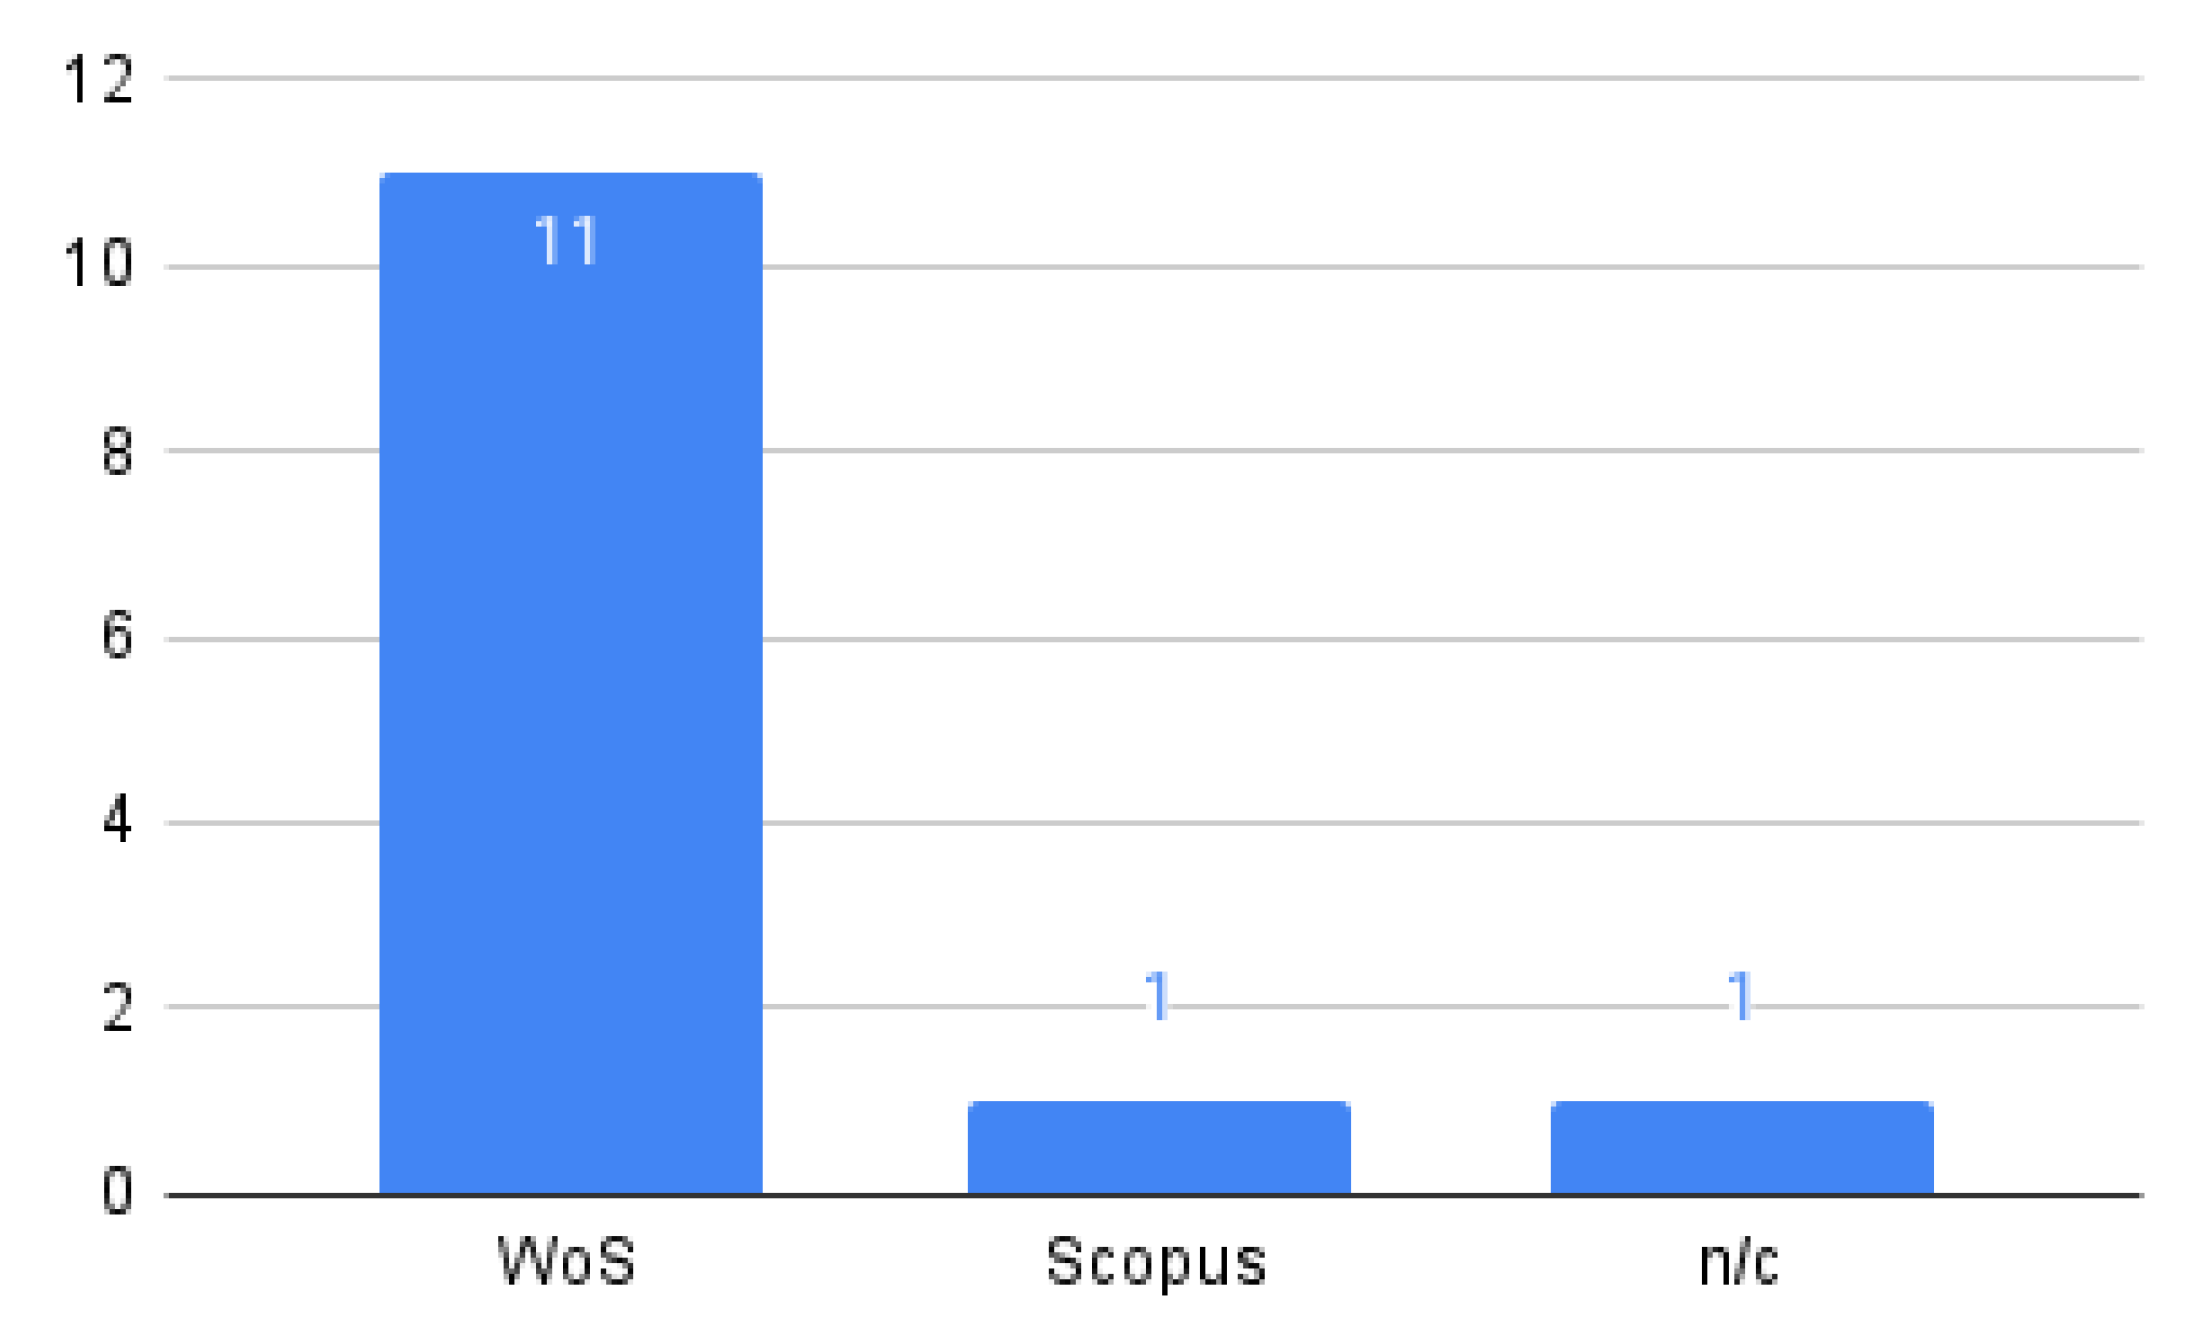
4.1.4. Data Sources
4.1.5. Search String
- From the RQs, we obtained keywords.
- For every keyword, we considered a set of synonyms.
- We applied the Population-Intervention-Comparison-Outcomes-Context (PICOC [41]) criteria.
- feature model/modeling/diagram, variability model/modeling
- software product family/lines
- reasoning/reasoner, automated support/verification, computer aided
- algorithm, solver, reasoner
- model checking/validation/verification/querying
- A population in the SE community is defined as a specific role, category of software engineering, an application area, or an industry group. In our case, an application area was selected, specifically feature modeling in SPLs.
- Intervention is defined as a methodology, tool, technology, or procedure addressing a specific issue. In our case, a technology was selected, specifically reasoning algorithms.
- Comparison does not apply to our study because the RQs did not consider the comparison of gathered papers versus a common reasoning algorithm (control condition).
- Outcomes for our RQs were the origin, level of validation, type of FMs, and problems solved for each proposal.
- The context for this study includes SPLs, specifically feature modeling, and reasoning and (semi-) automated algorithms.
4.1.6. Inclusion and Exclusion Criteria
4.1.7. Protocol Validation
4.2. Primary Study Selection
4.2.1. Pilot Selection
4.2.2. Data Extraction Protocol
4.2.3. Preliminary Data Extraction and Assessment
4.3. SMS Tool Support
5. Results
5.1. Answers to RQs
5.1.1. RQ1: In Which SPL Stage Are These Algorithms Used?
- Domain (D): used at the domain engineering stage;
- Application (A): used at the domain engineering stage; and
- Both (D + A): used in both stages.
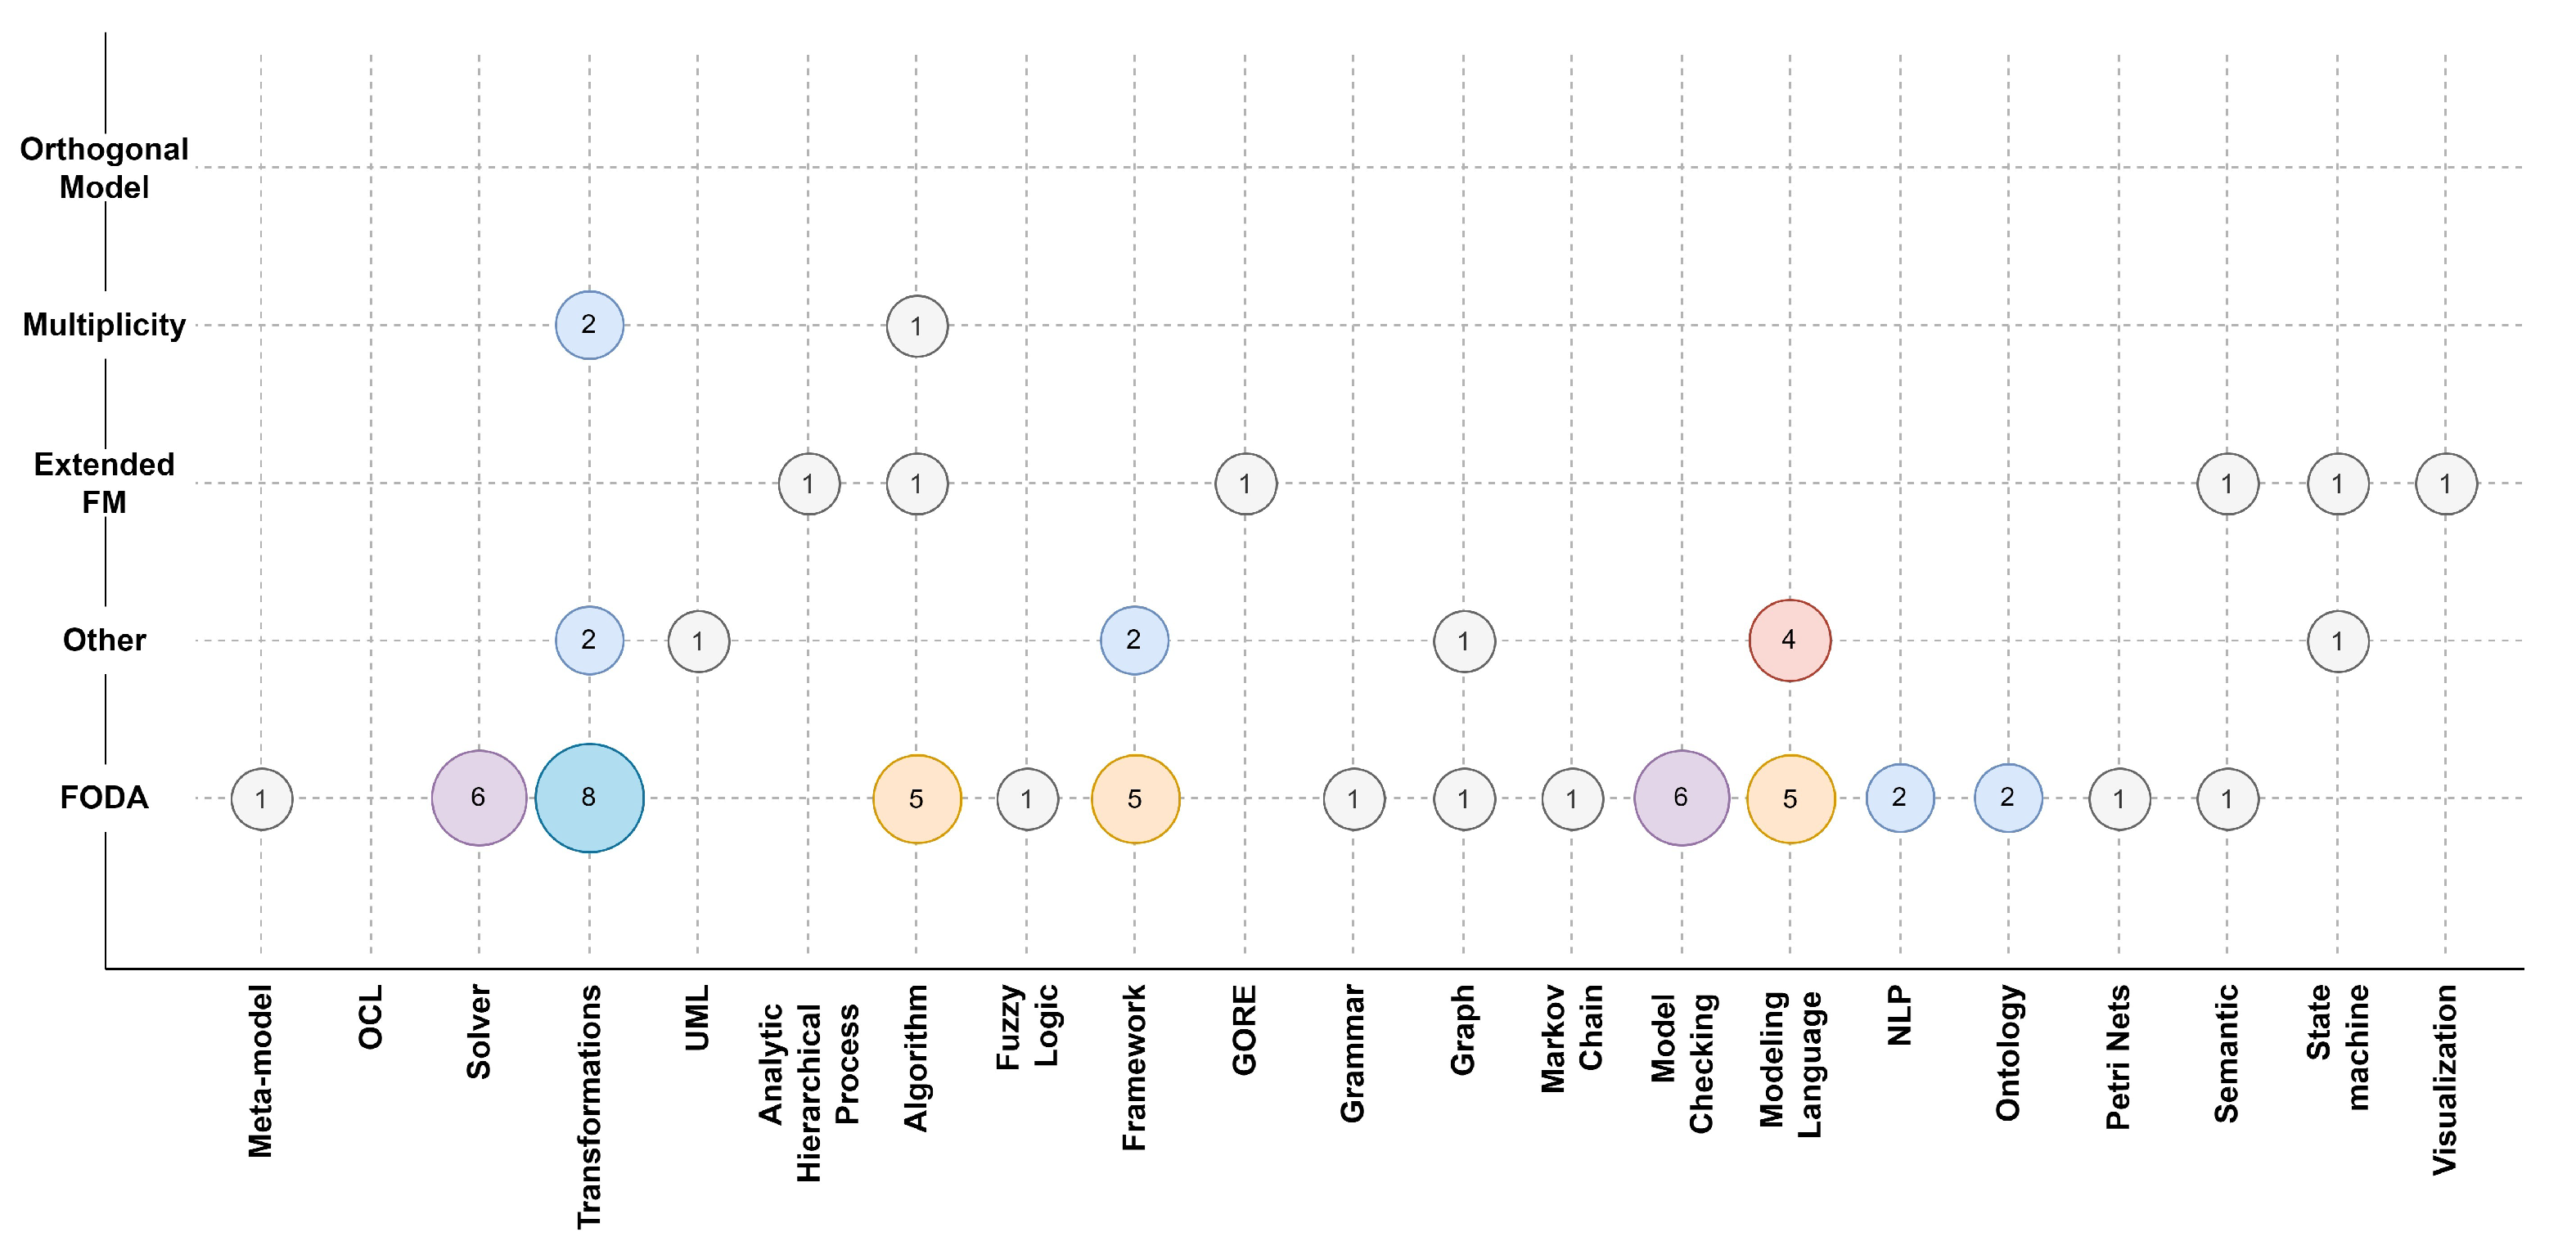
5.1.2. RQ2: What Type of Technologies Do Algorithms Mainly Use?
- Meta-model: based on a meta-model for defining the problem domain or using some aspects of modeling-driven development.
- UML: based on formalisms of UML (class diagram, sequence diagram, state machines, etc.)
- OCL: based on extra constraints over models or languages, using OCL.
- Solver: based on the use of a constraint solving problem (CSP) to analyze the models.
- Transformations: based on using models or other representations as inputs and transforming them into another output to run some analysis.
- Other.
- Algorithm, or set of rules (ALG): based on algorithms or rules (i.e., OCL) to build or analyze the models.
- Framework (FRW): a framework considering a set of technologies and steps based on a framework.
- Graph (GRP): based on the use of directed or undirected graphs to model and analyze the variability.
- Model checking (MCK): based on model checking to verify SPLs.
- Modeling language (MLG): based on modeling languages used to map to code or other “assets”.
- Natural language processing (NLP): based on NLP techniques to infer some characteristics about the models.
- Ontology (ONT): based on the use of ontologies to identify concepts or relations.
- Semantic (SEM): based on the use of semantic techniques to analyze the models.
- Solver (SOL): based on the use of tbe constraint solving problem (CSP) to analyze the models.
- State machines (STM): based on the use of state machines to analyze the models.
- Transformations (TRA): based on the use of models or other representations as inputs and transforming them into another output to run some analysis.
- Other: considers technologies named only once.
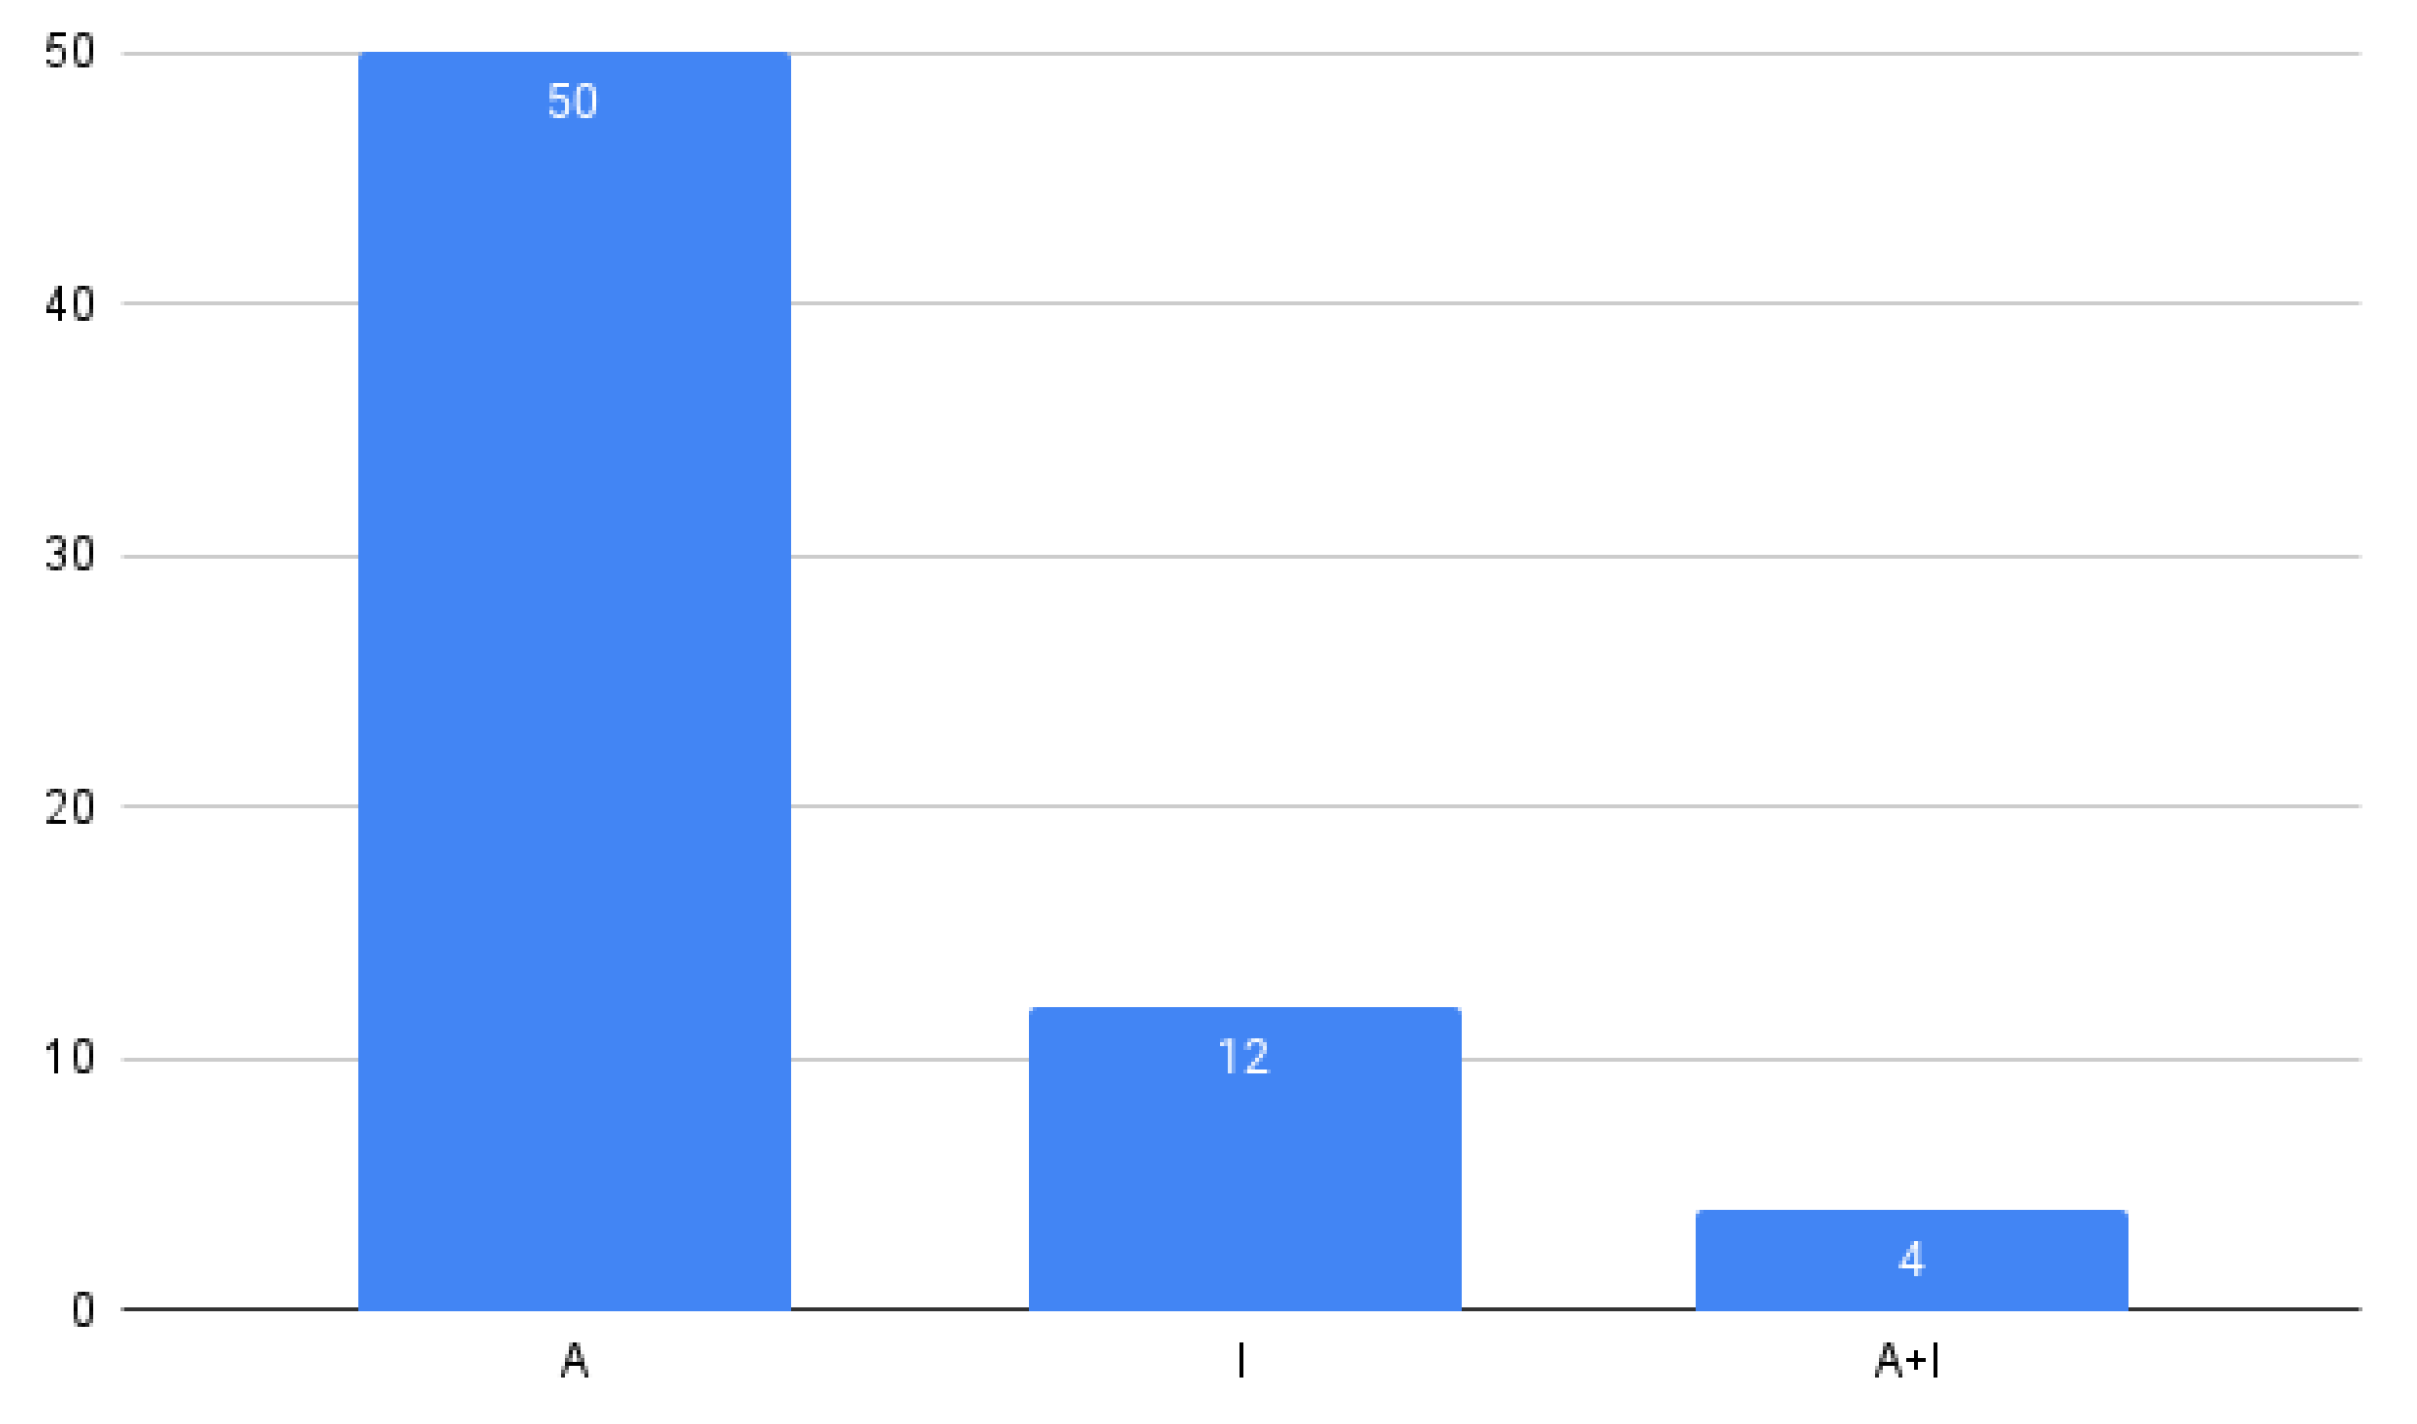
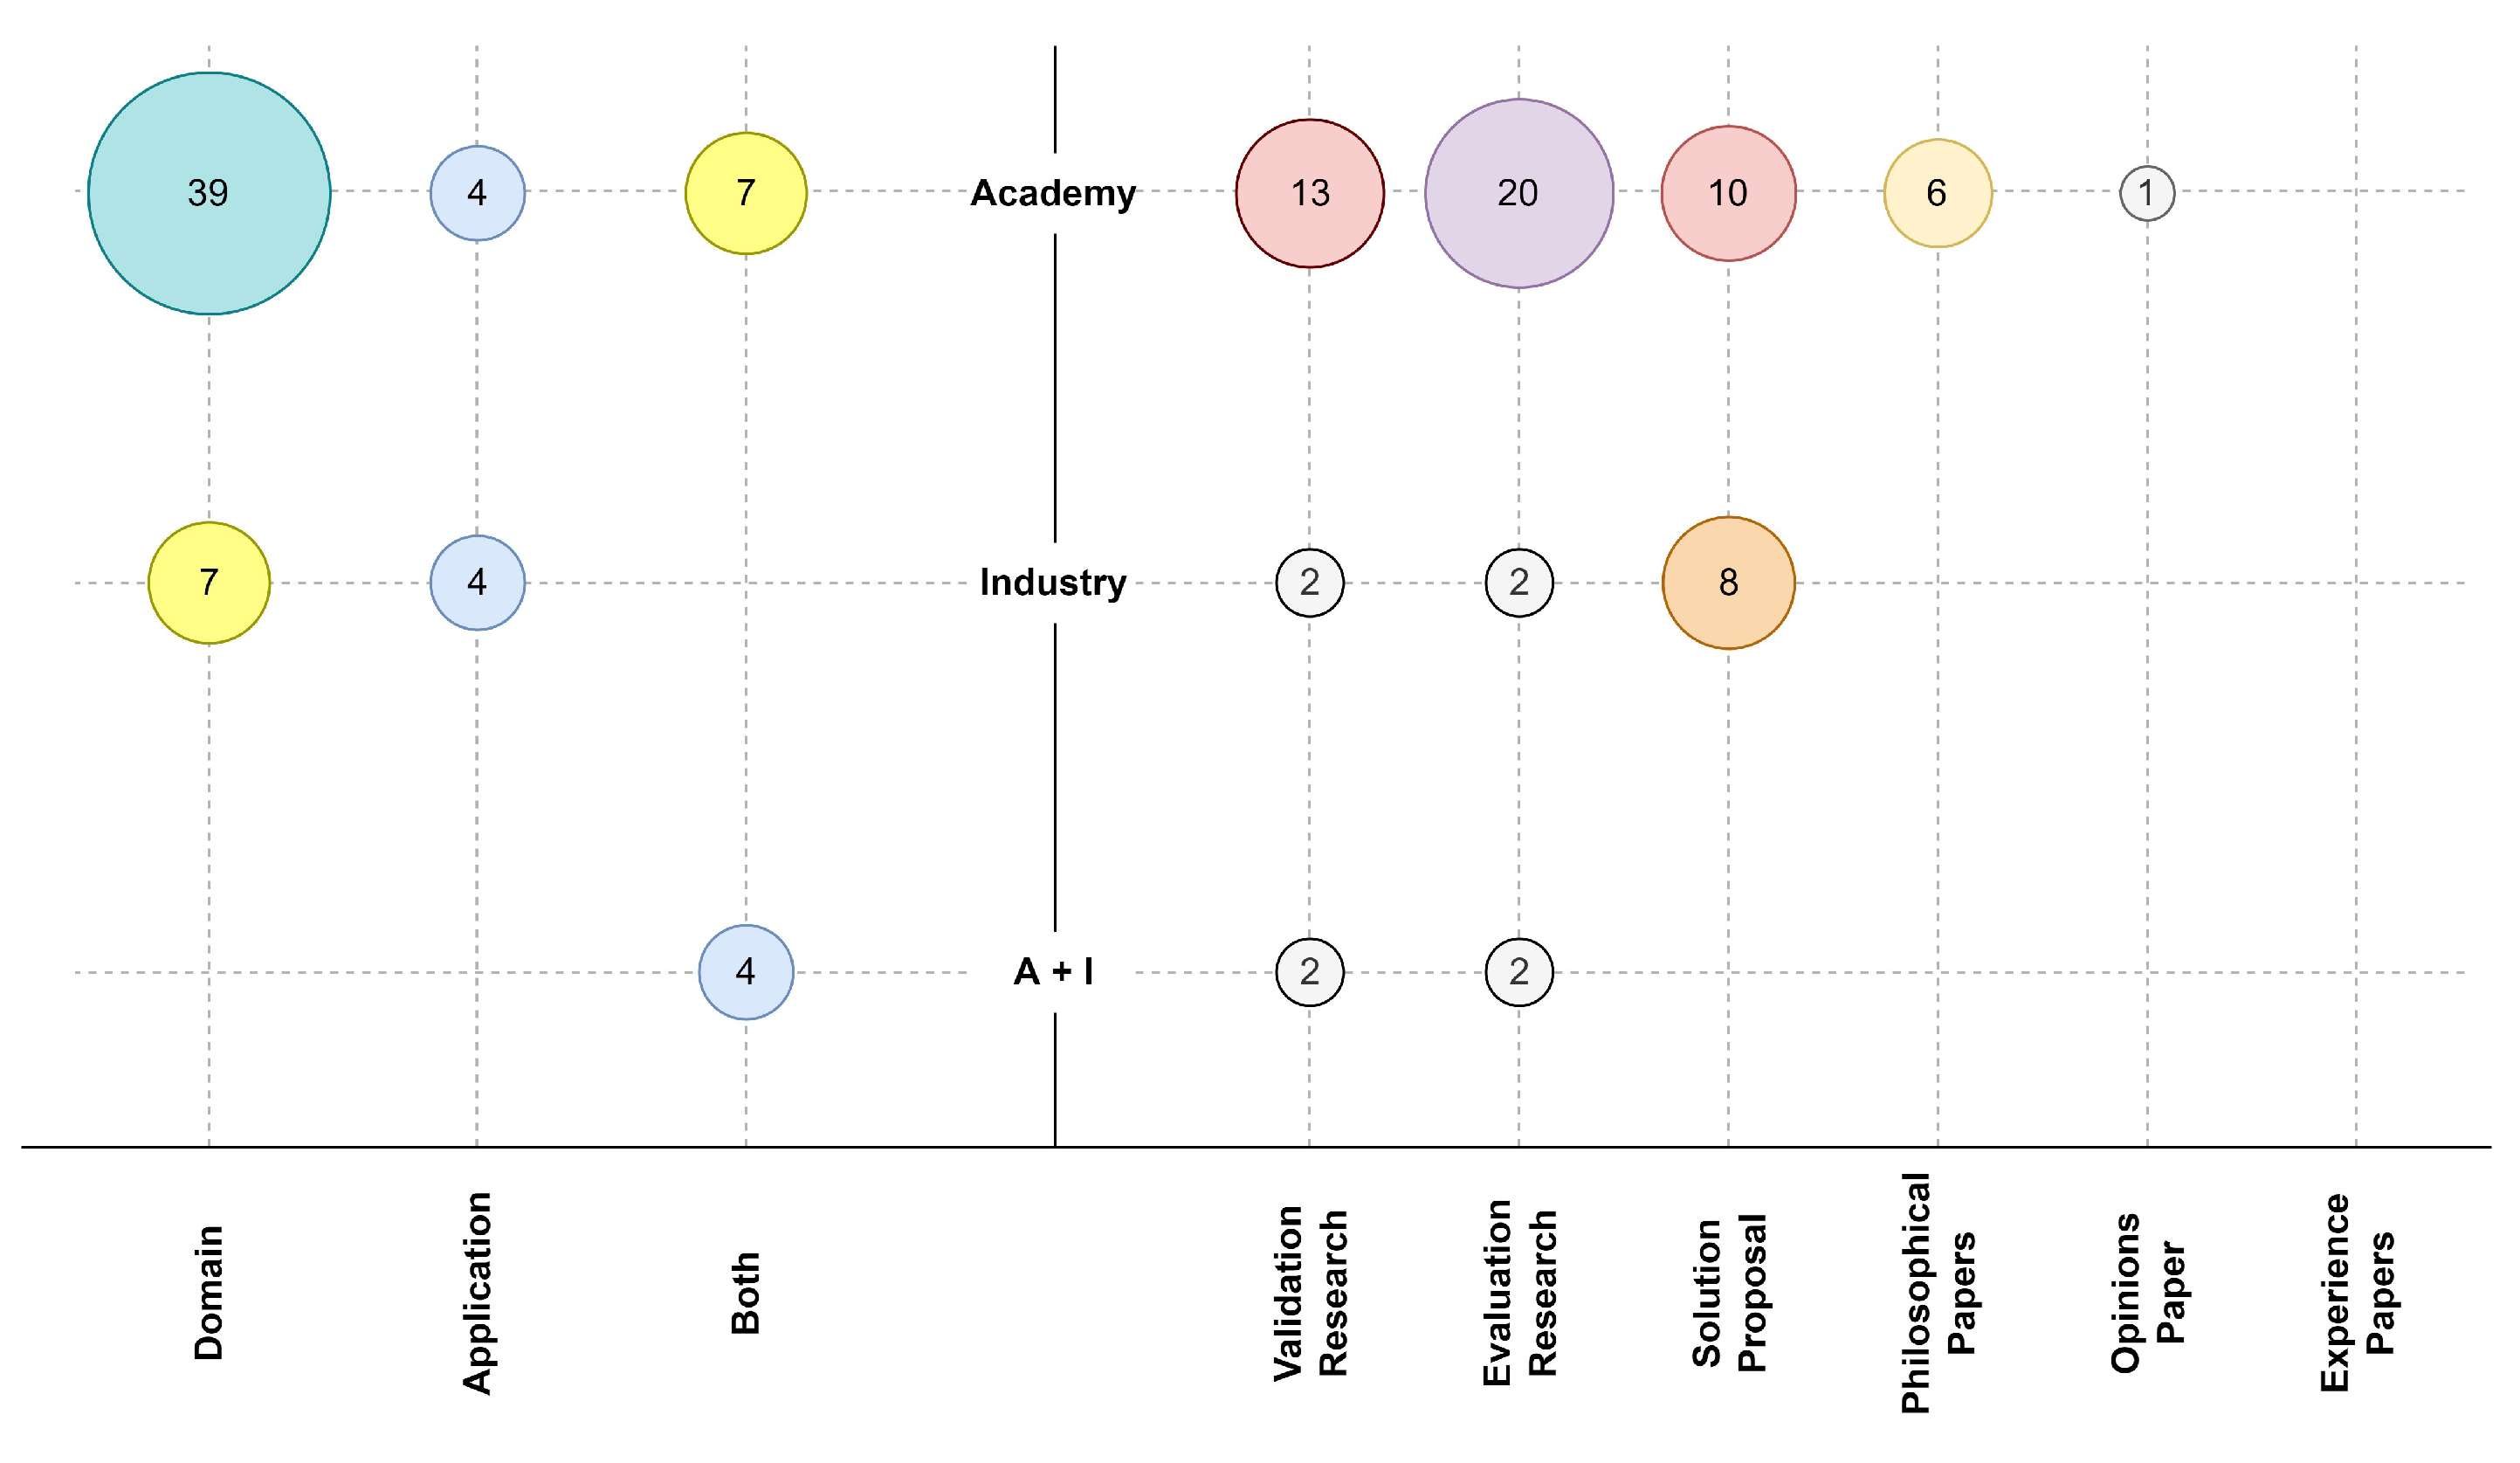
5.1.3. RQ3: What Is the Origin of the Proposal?
- Academia (A): developed by research teams at universities.
- Industry (I): developed by commercial companies.
- Join development (A + I): joint development between academia and industry.
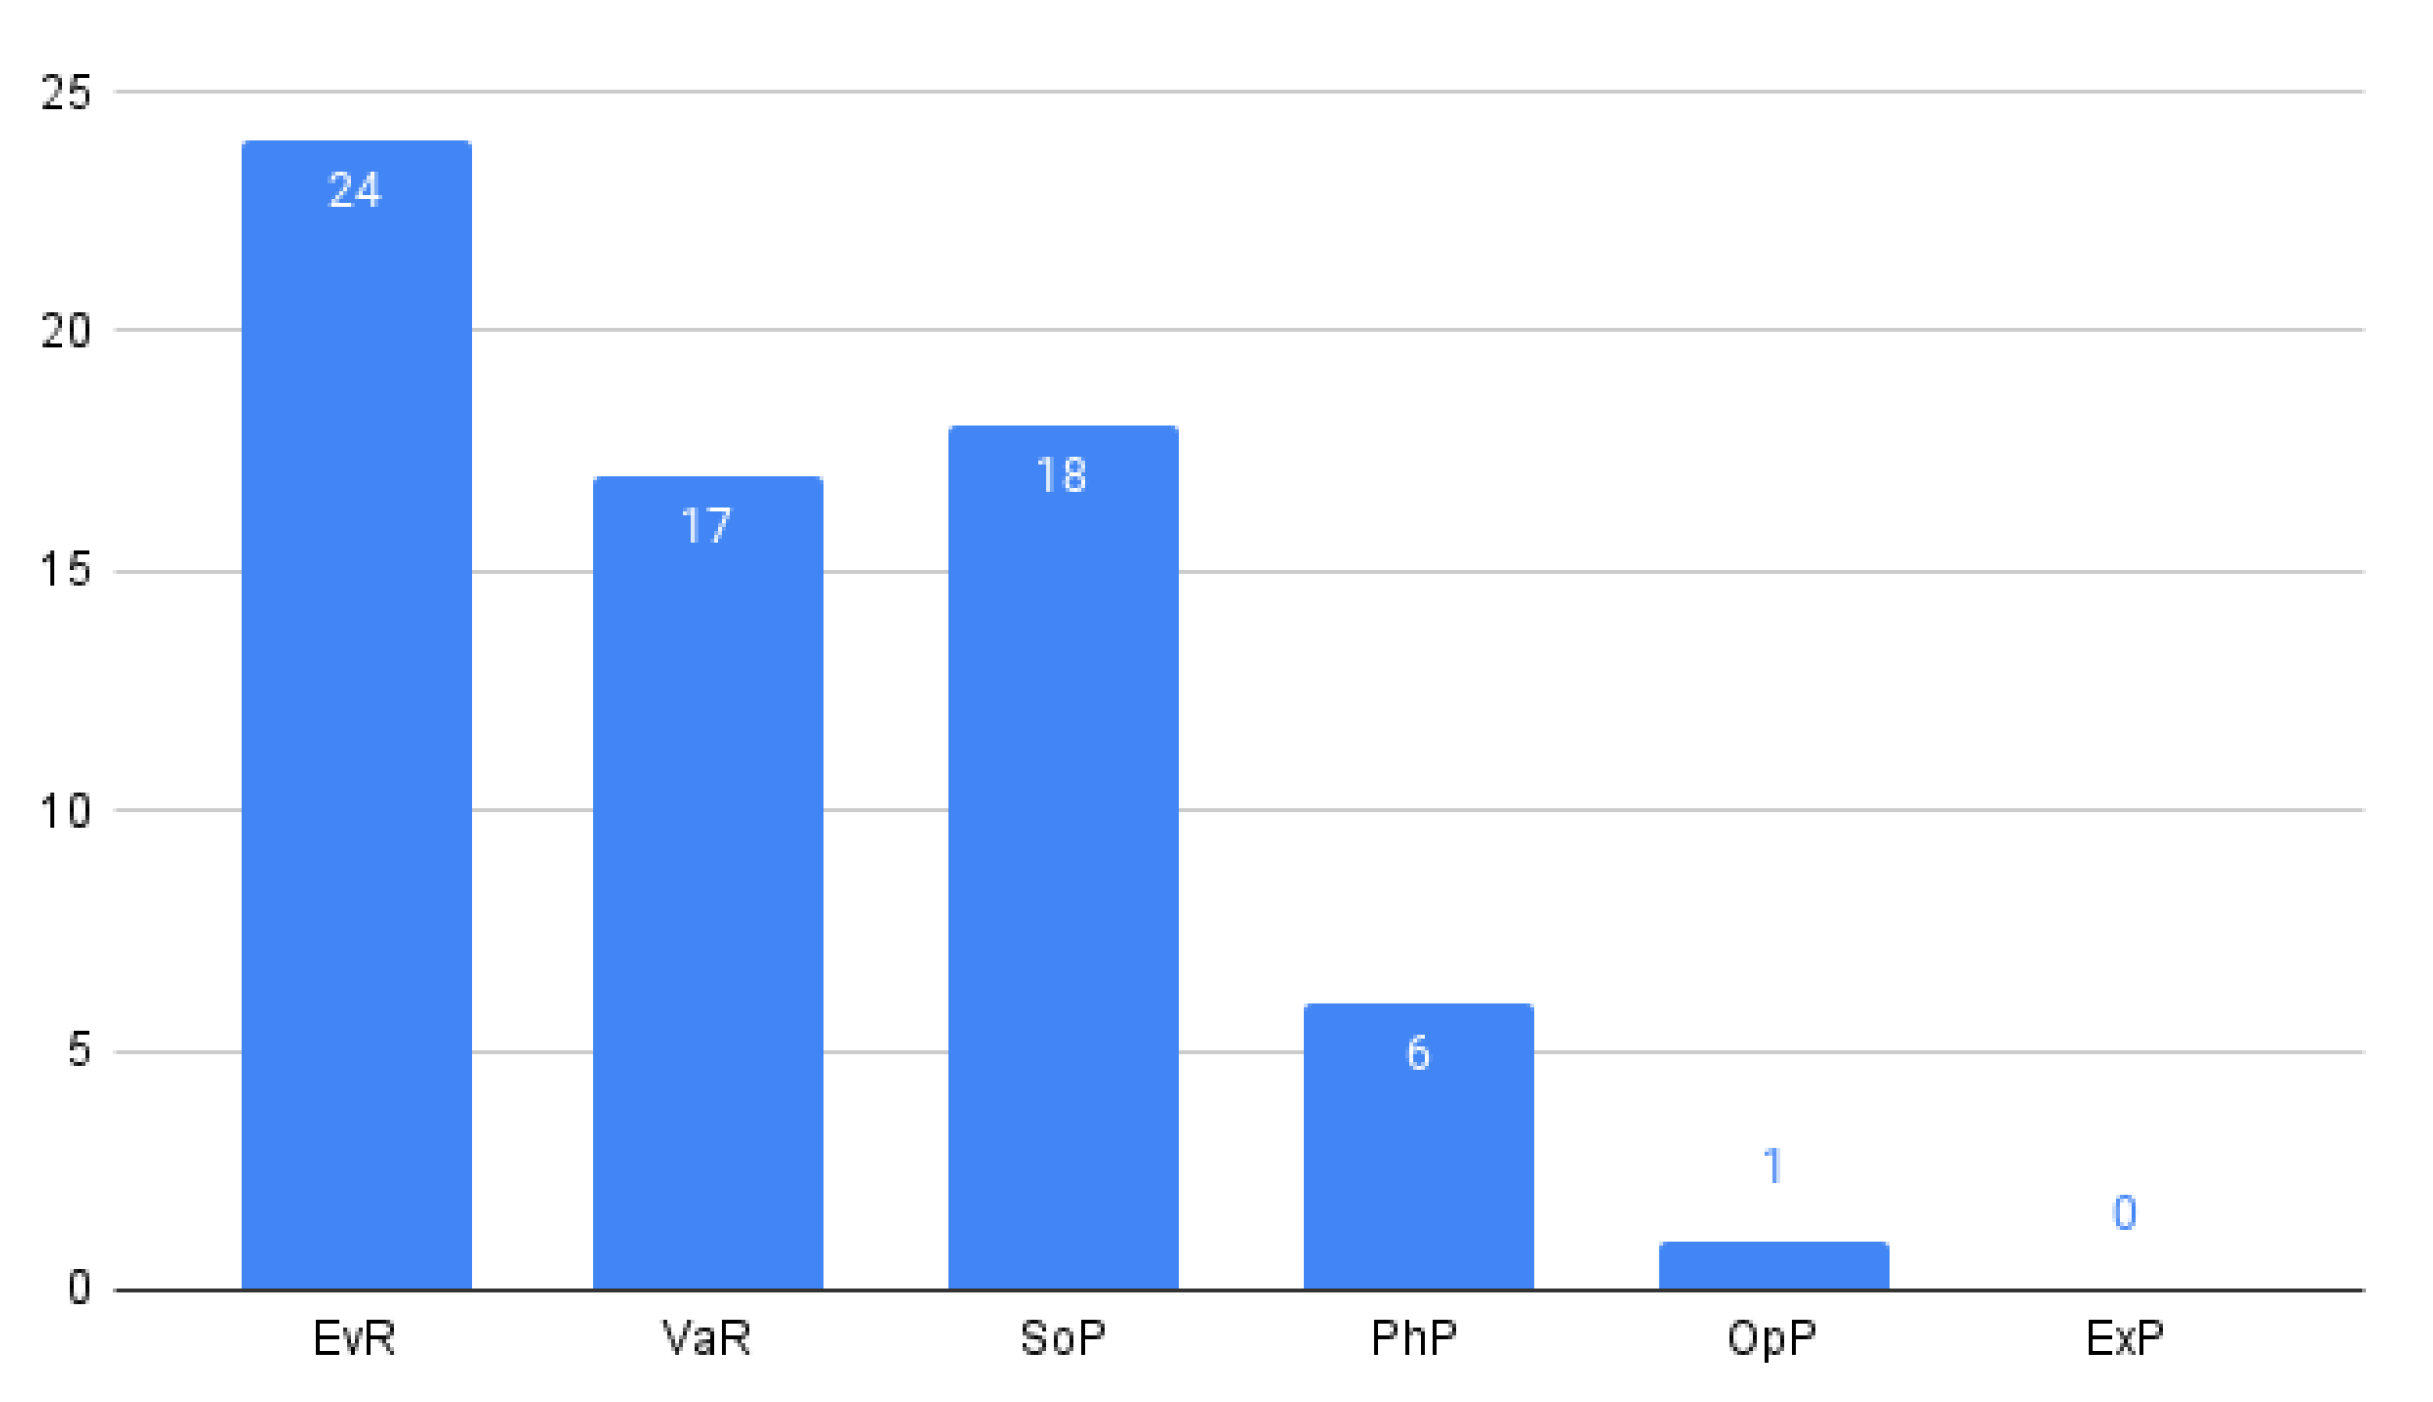
5.1.4. RQ4: What Is the Level of Validation?
- Evaluation research (EvR): the paper investigates a problem or an implementation of a technique in practice.
- Validation research (VaR): the paper investigates a solution proposal’s properties that have not yet been implemented in practice.
- Solution proposal (SoP): the paper proposes a solution technique and argues for its relevance (not necessarily a full validation).
- Philosophical paper (PhP): the paper presents a new way of looking at things.
- Opinion paper (OpP): the paper contains opinions of the author about what is wrong or good about something.
- Experience paper (ExP): the paper contains a list of lessons learned by the author from his or her experience.
5.1.5. RQ5: What Kind of FM Does the Algorithm Work On?
- Extended FM: considers the need to extend FMs to include more information about features (so-called feature attributes) [14].
- FODA: based on the original model proposed in [20].
- Multiplicity FM: Some authors propose extending FODA feature models with UML-like multiplicities (so-called cardinalities). The new relationships introduced in this notation are feature cardinality and group cardinality [14].
- Orthogonal variability model (OVM): The core concepts of the OVM language are variation points and variants. Each variation point has to offer at least one variant [3].
- Other.
5.1.6. RQ6: What Problems Does the Algorithm Solve?
- Null FMs (NFM)
- Valid partial configuration (VC)
- Valid product (VP)
- Other.
- Unable to decide (UTD).
5.2. Answers to PQs
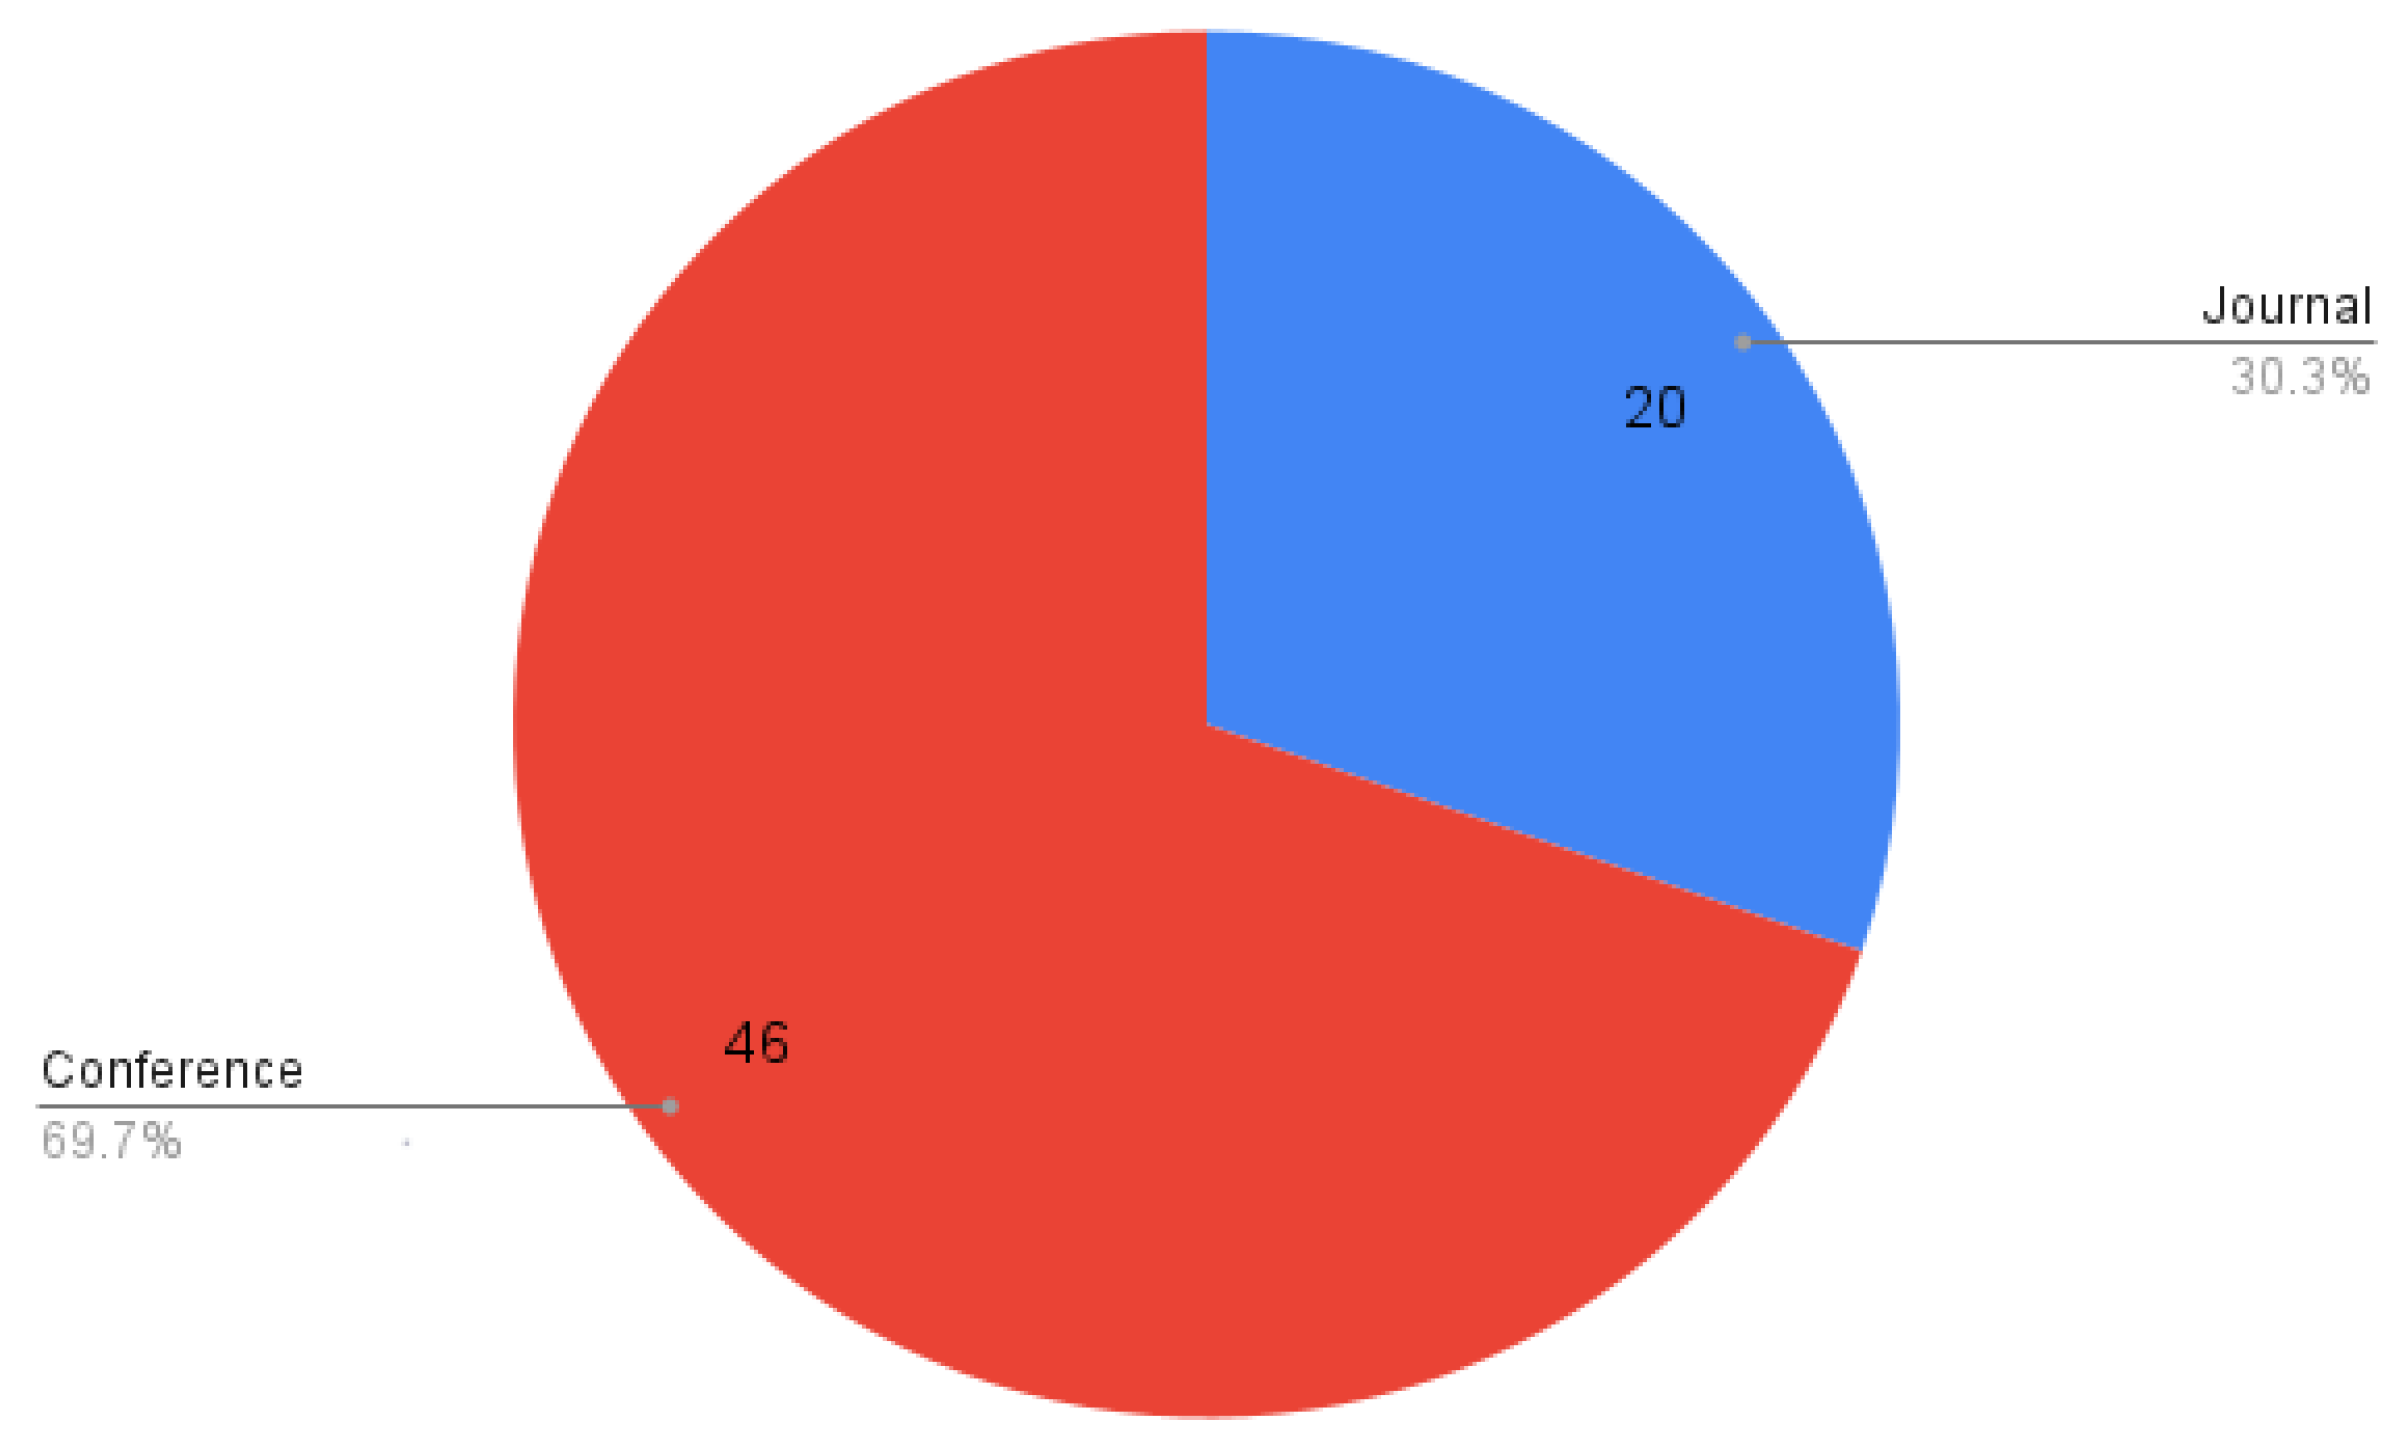
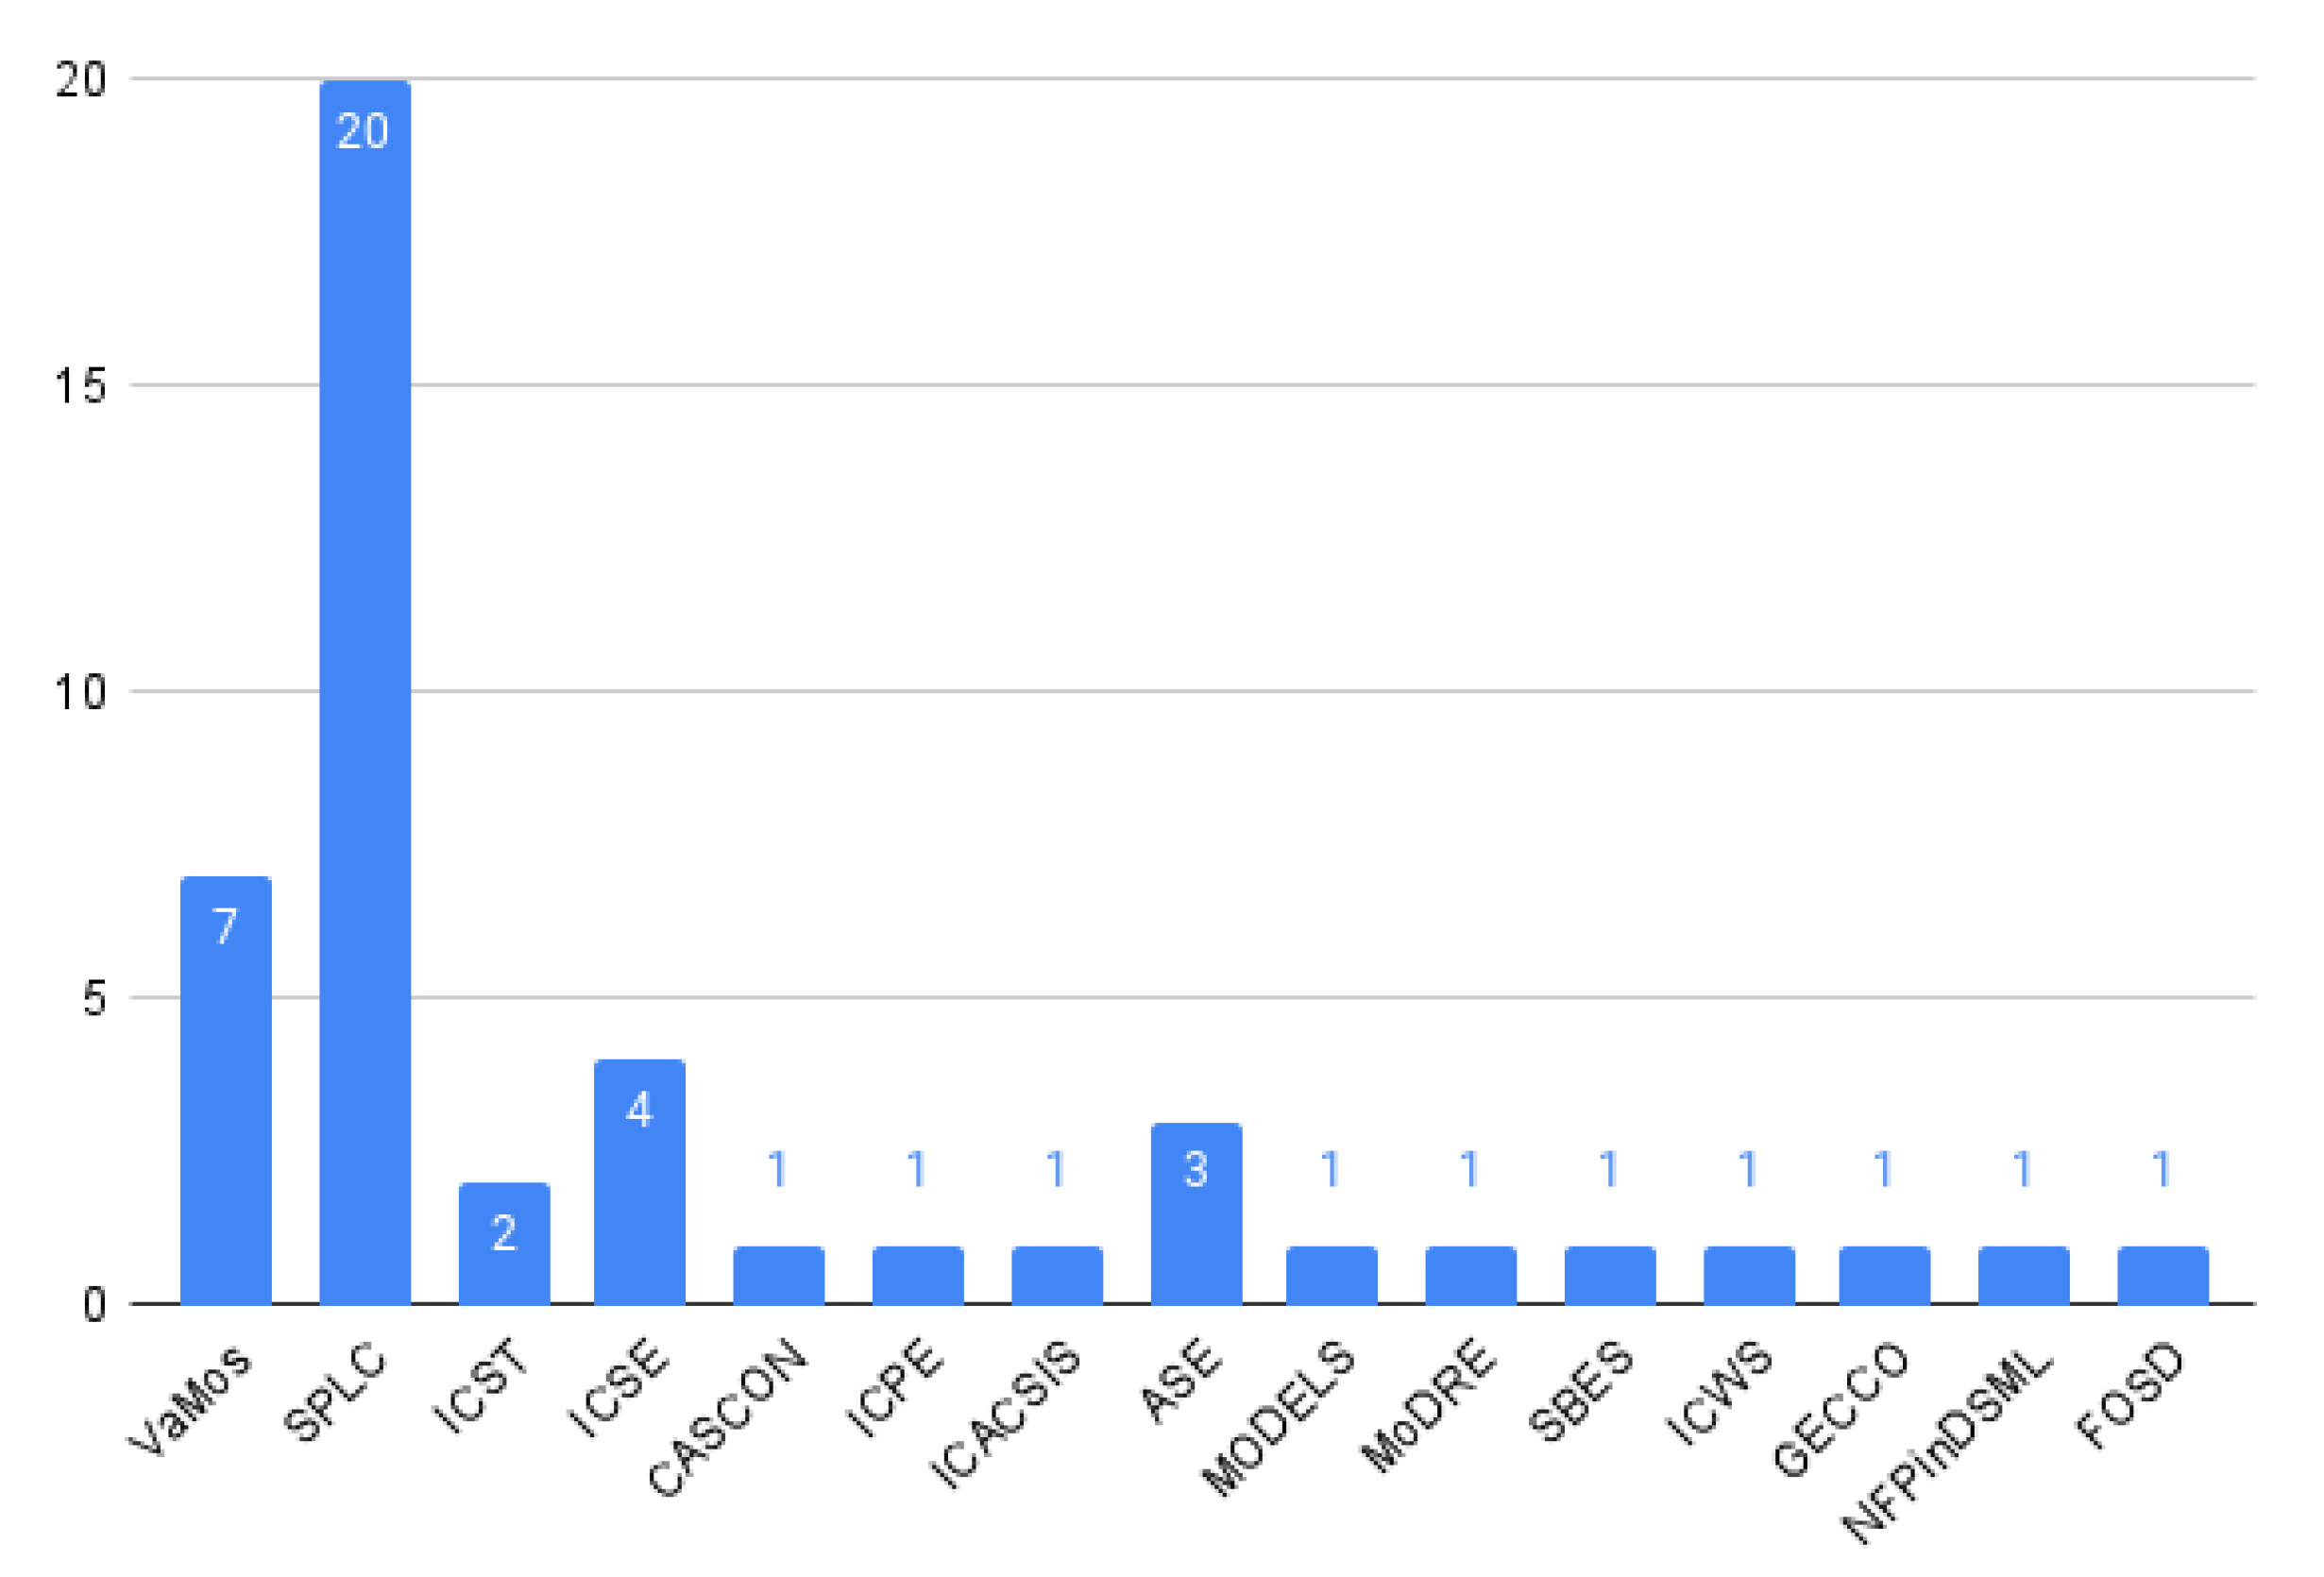
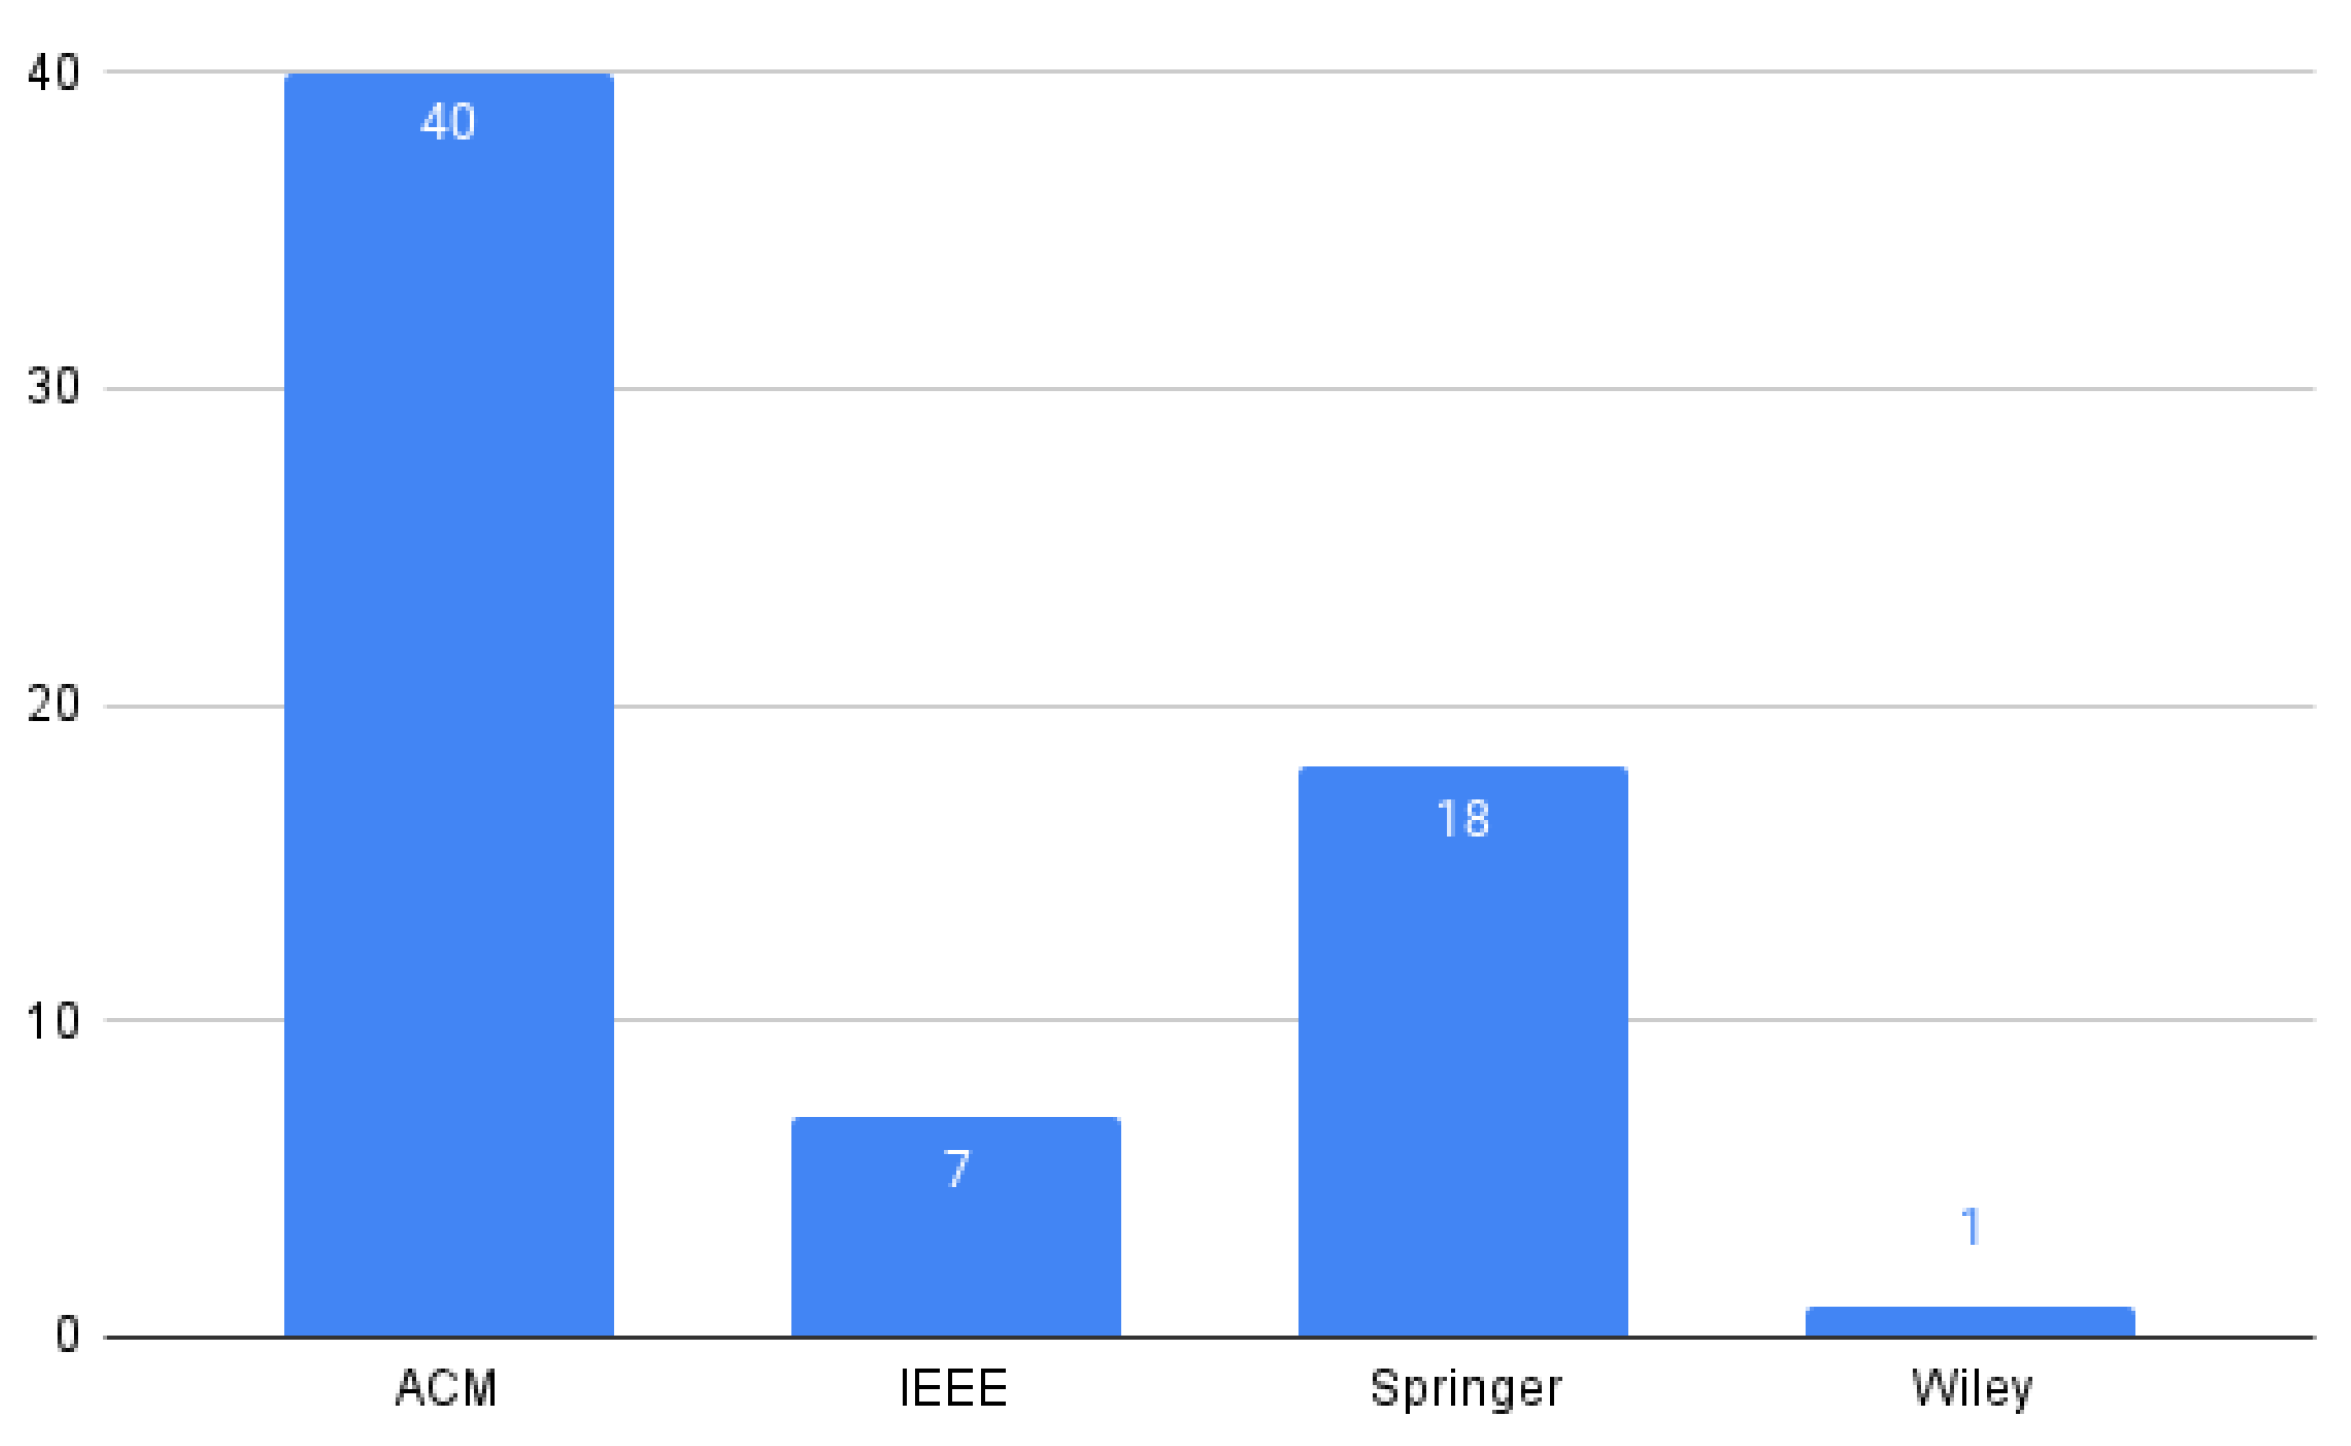
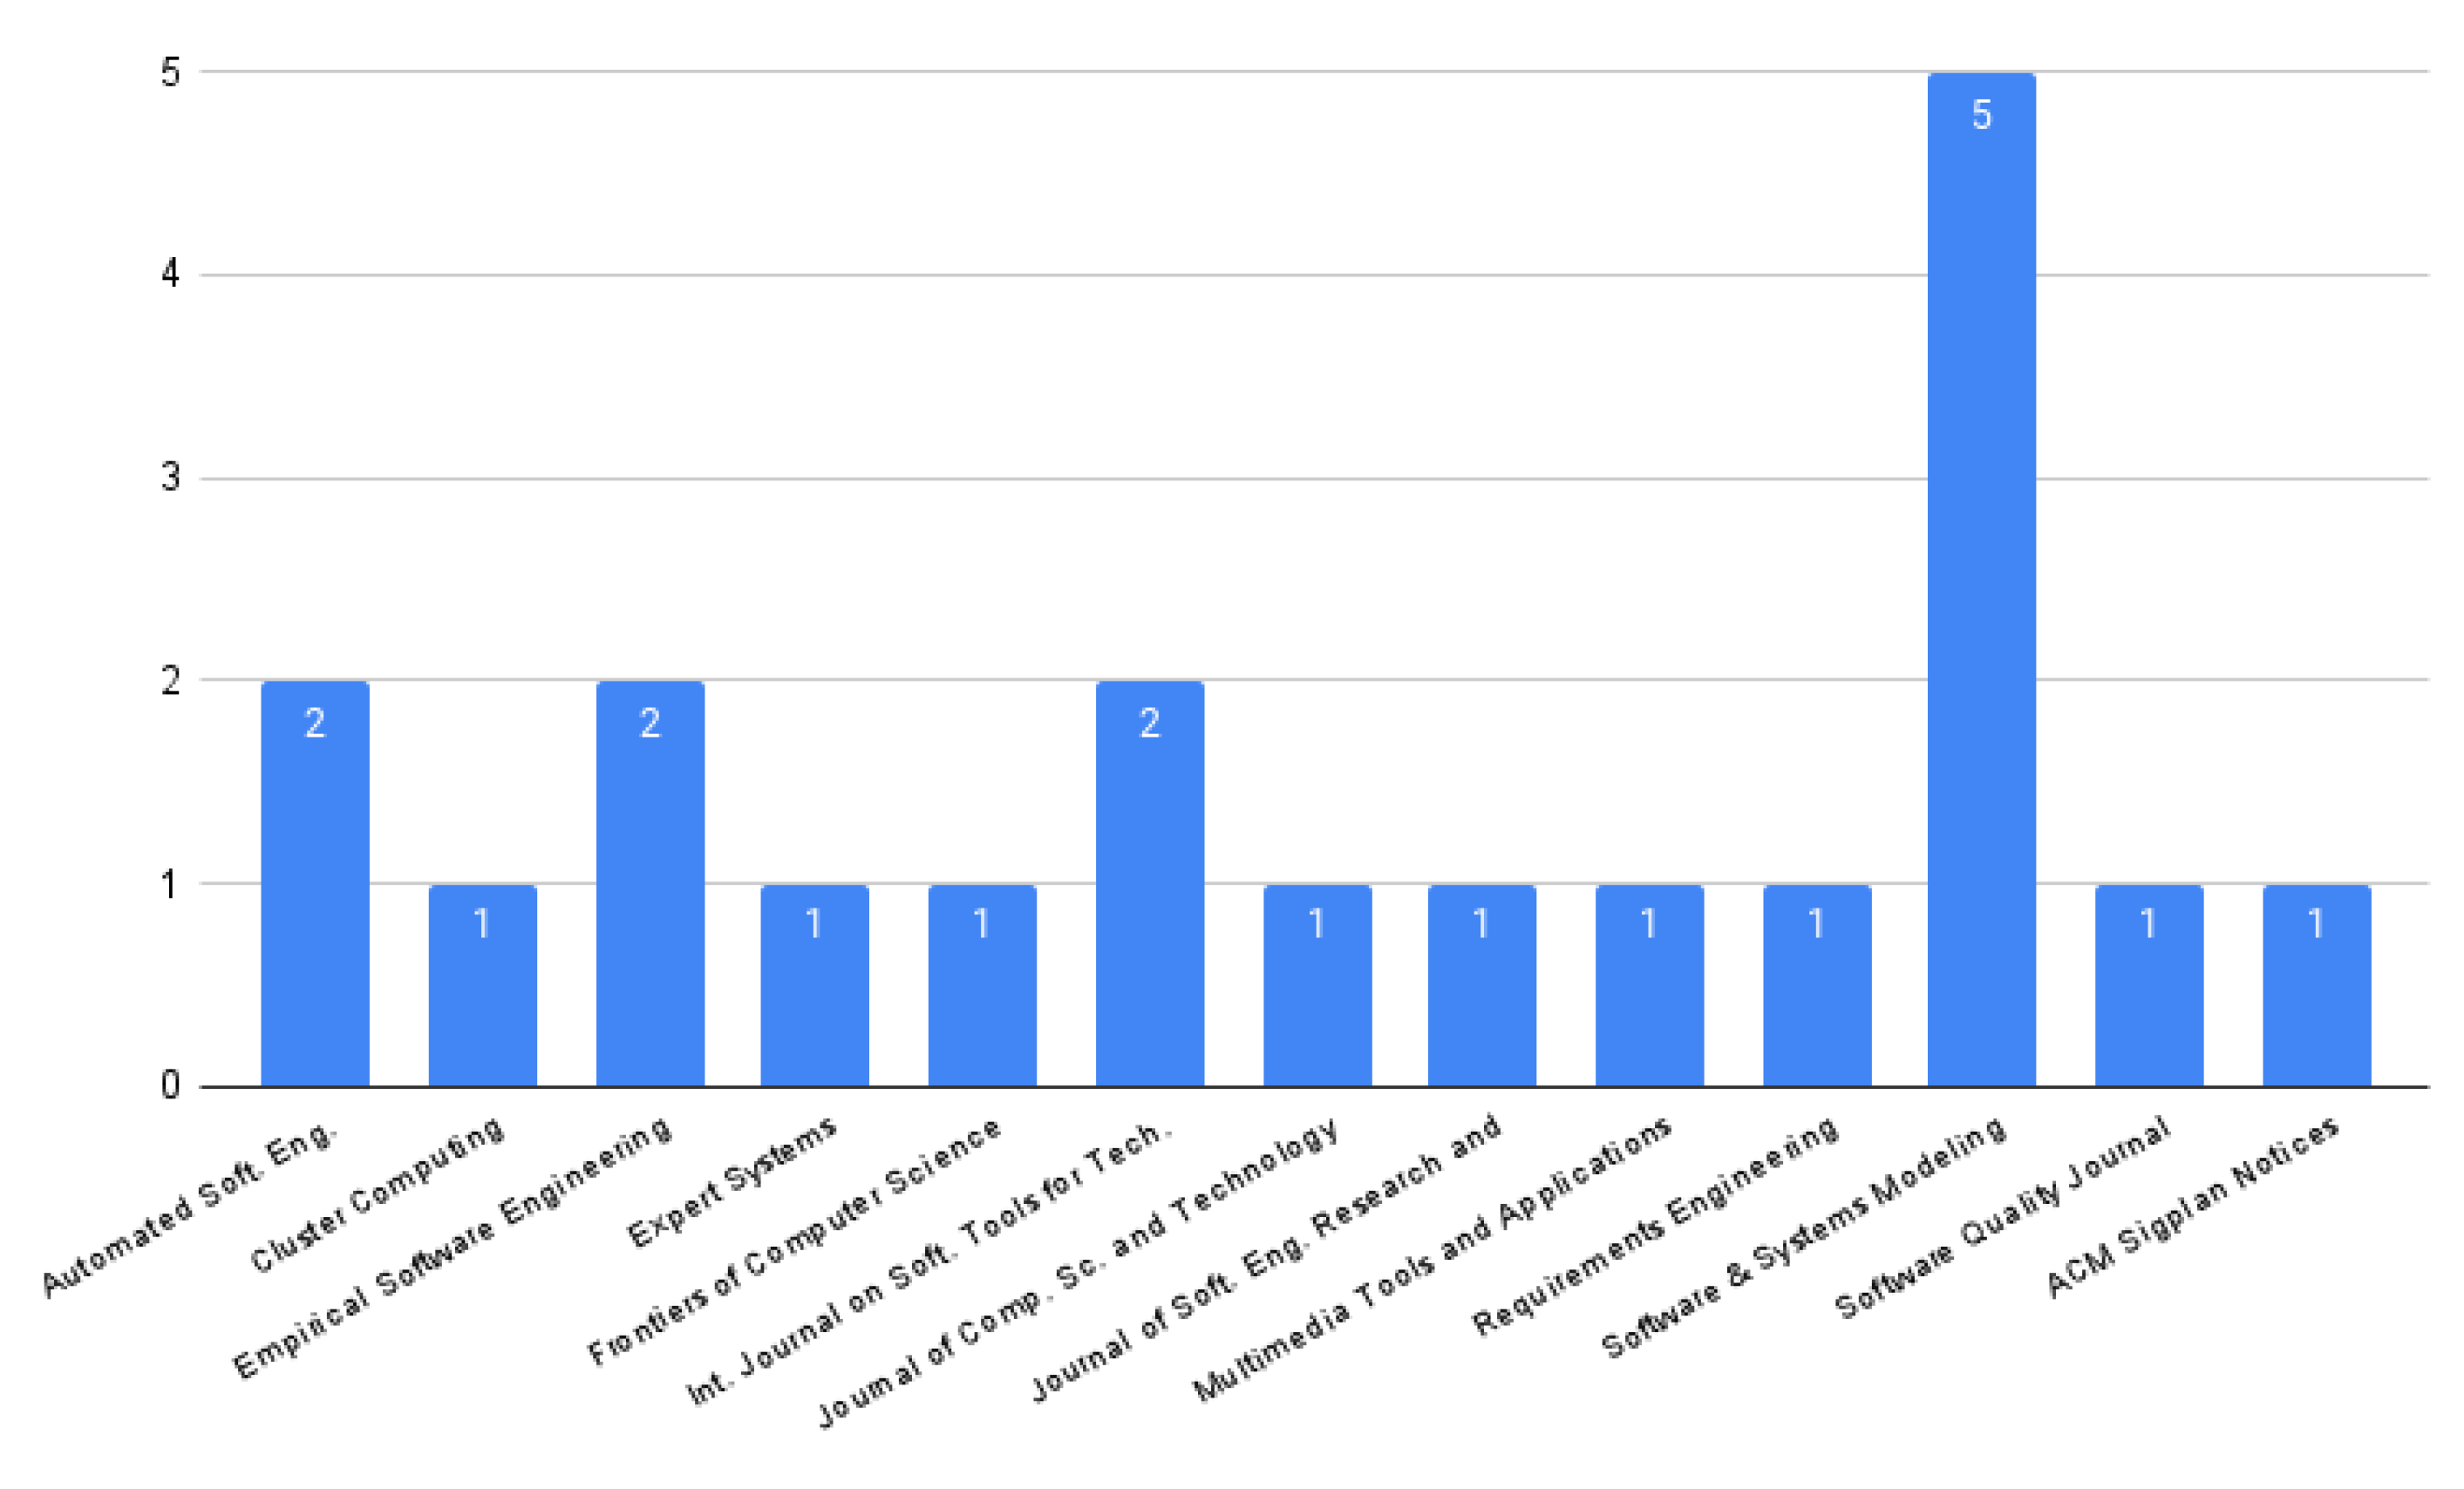
5.2.1. PQ1: Where Was the Paper Published?
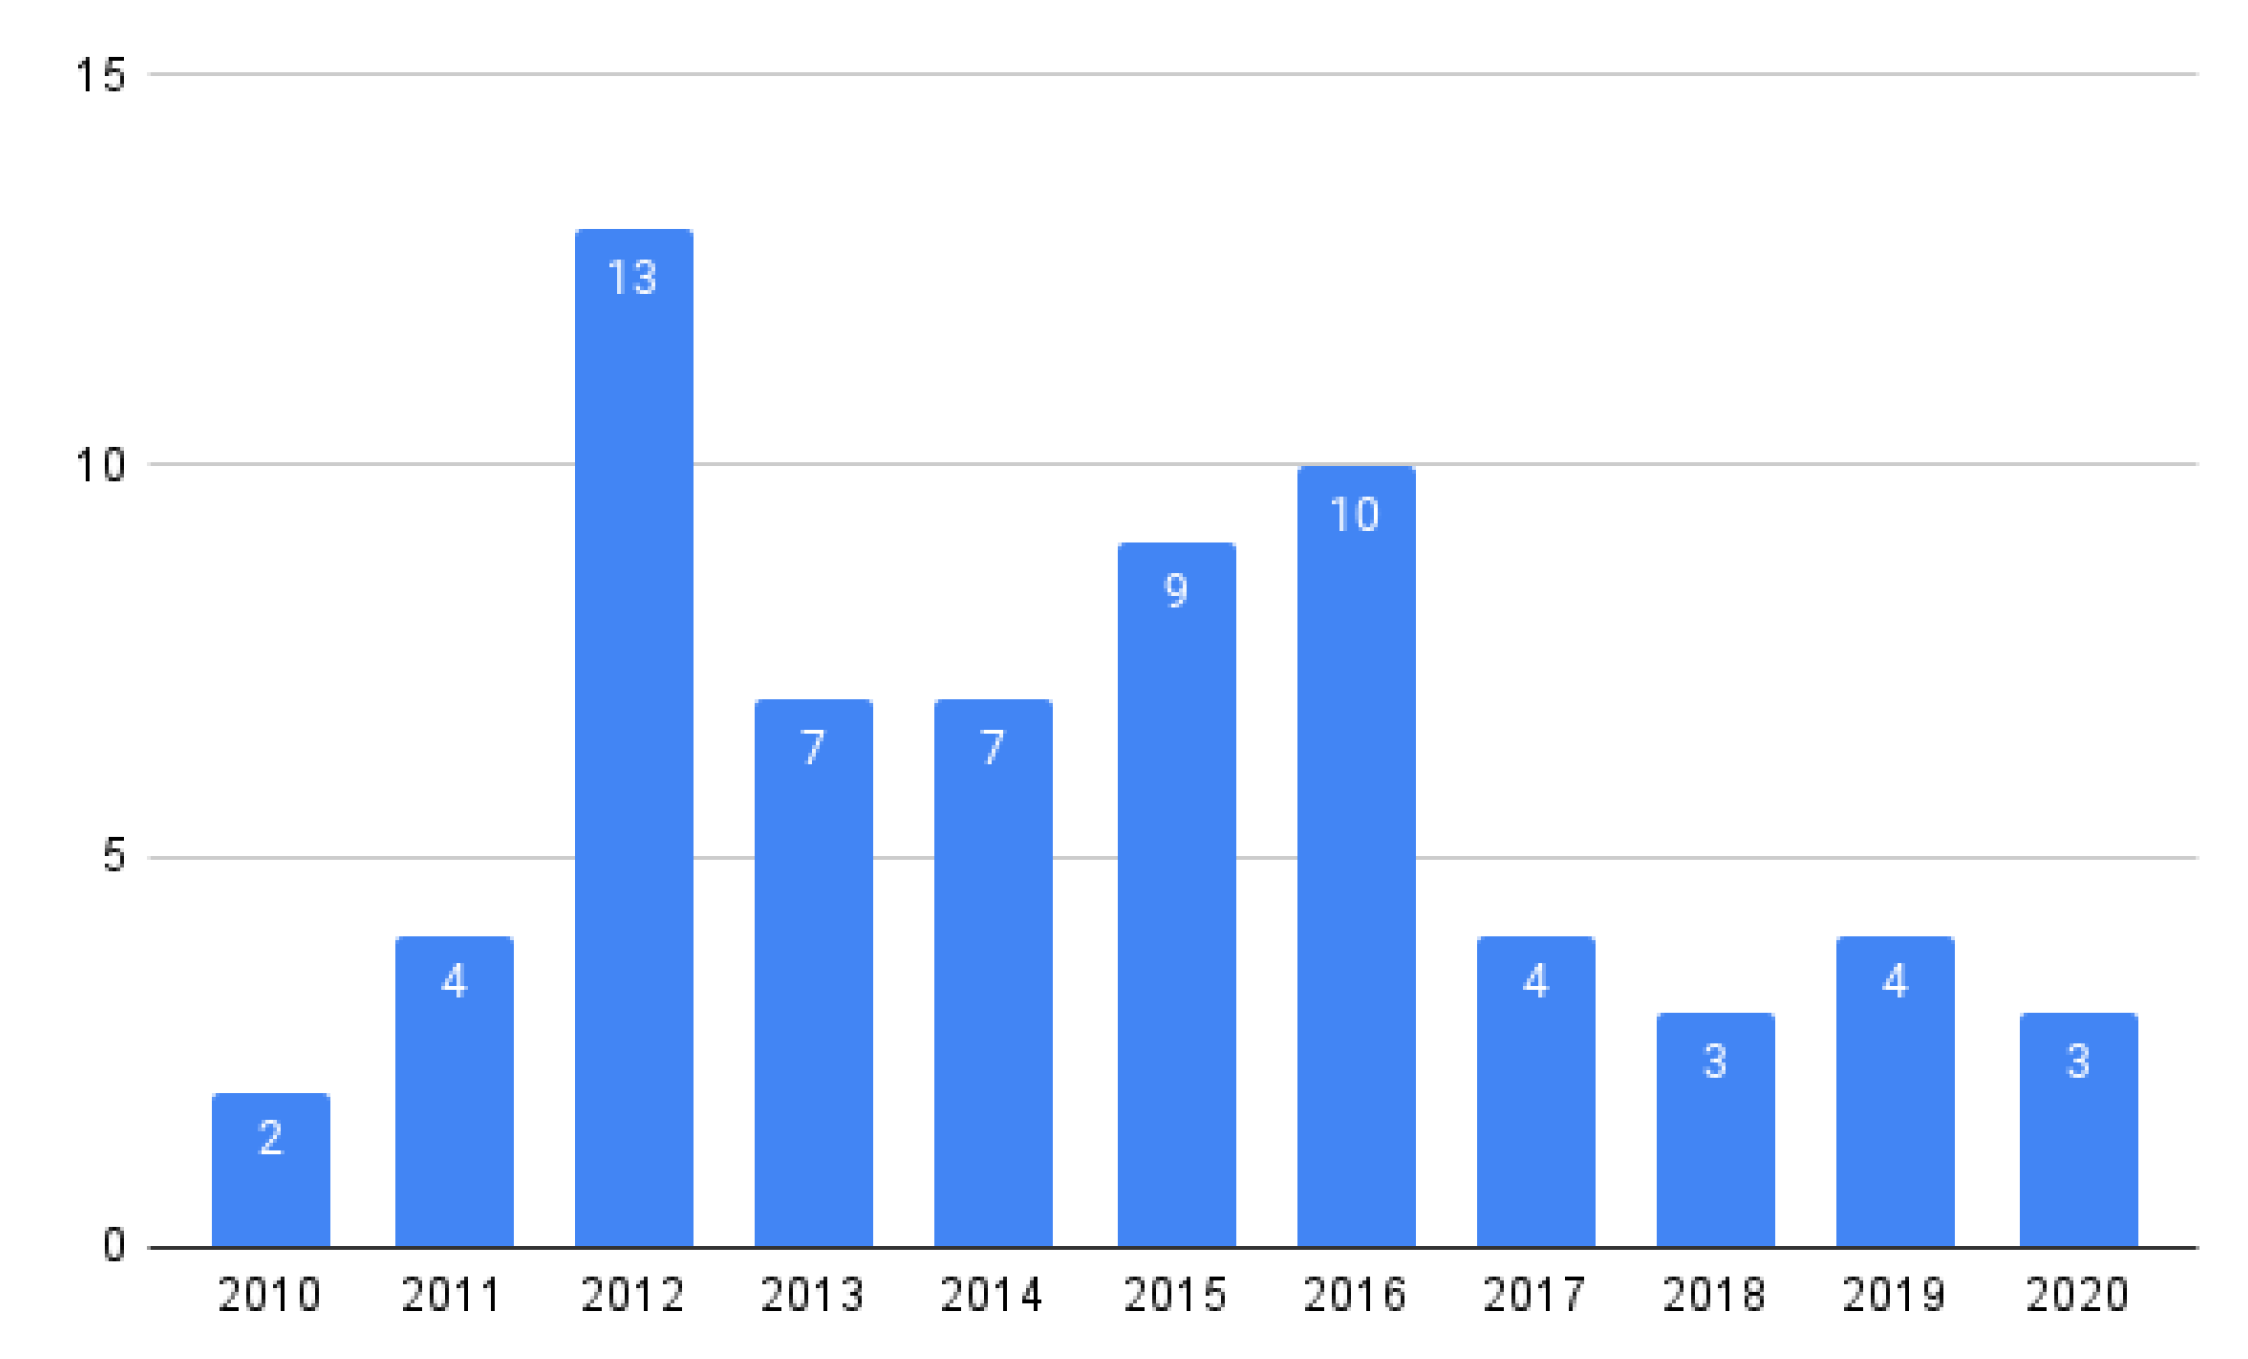
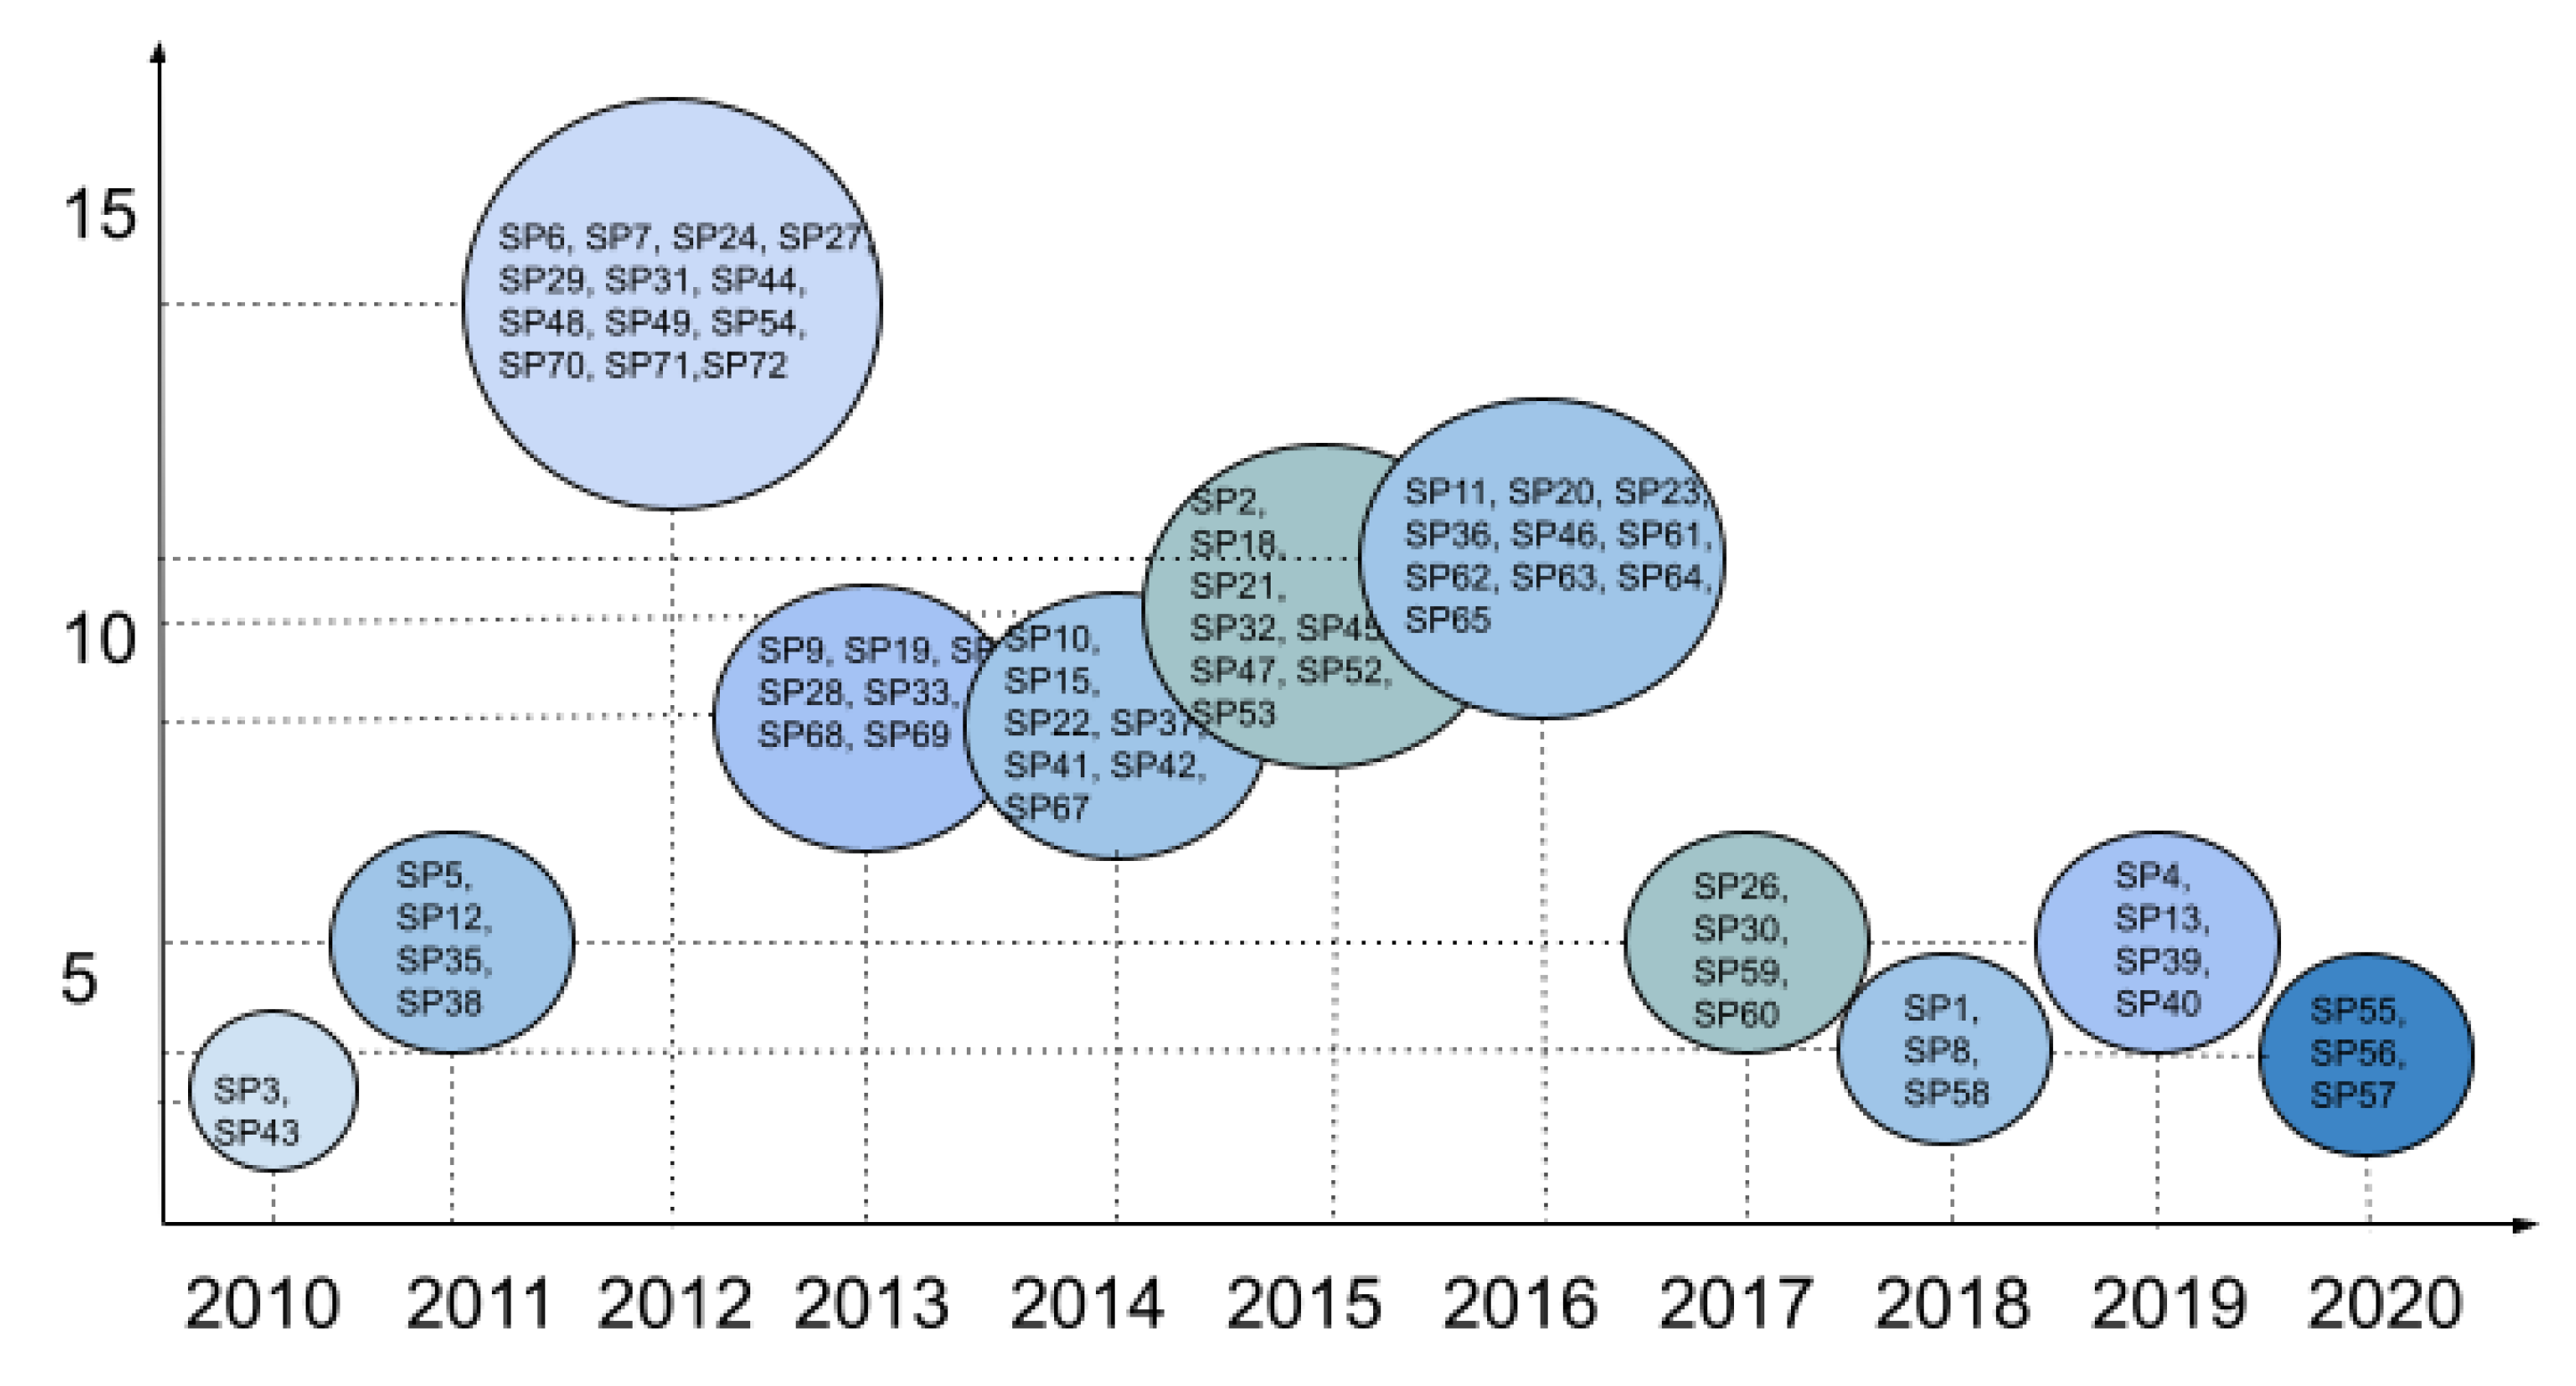
5.2.2. PQ2: What Was the Year of Publication of Each Paper?
6. Discussion
6.1. Interpreting Answers to RQs and PQs
6.1.1. Interpreting Answers to RQs
6.1.2. Interpreting Answers to PQs
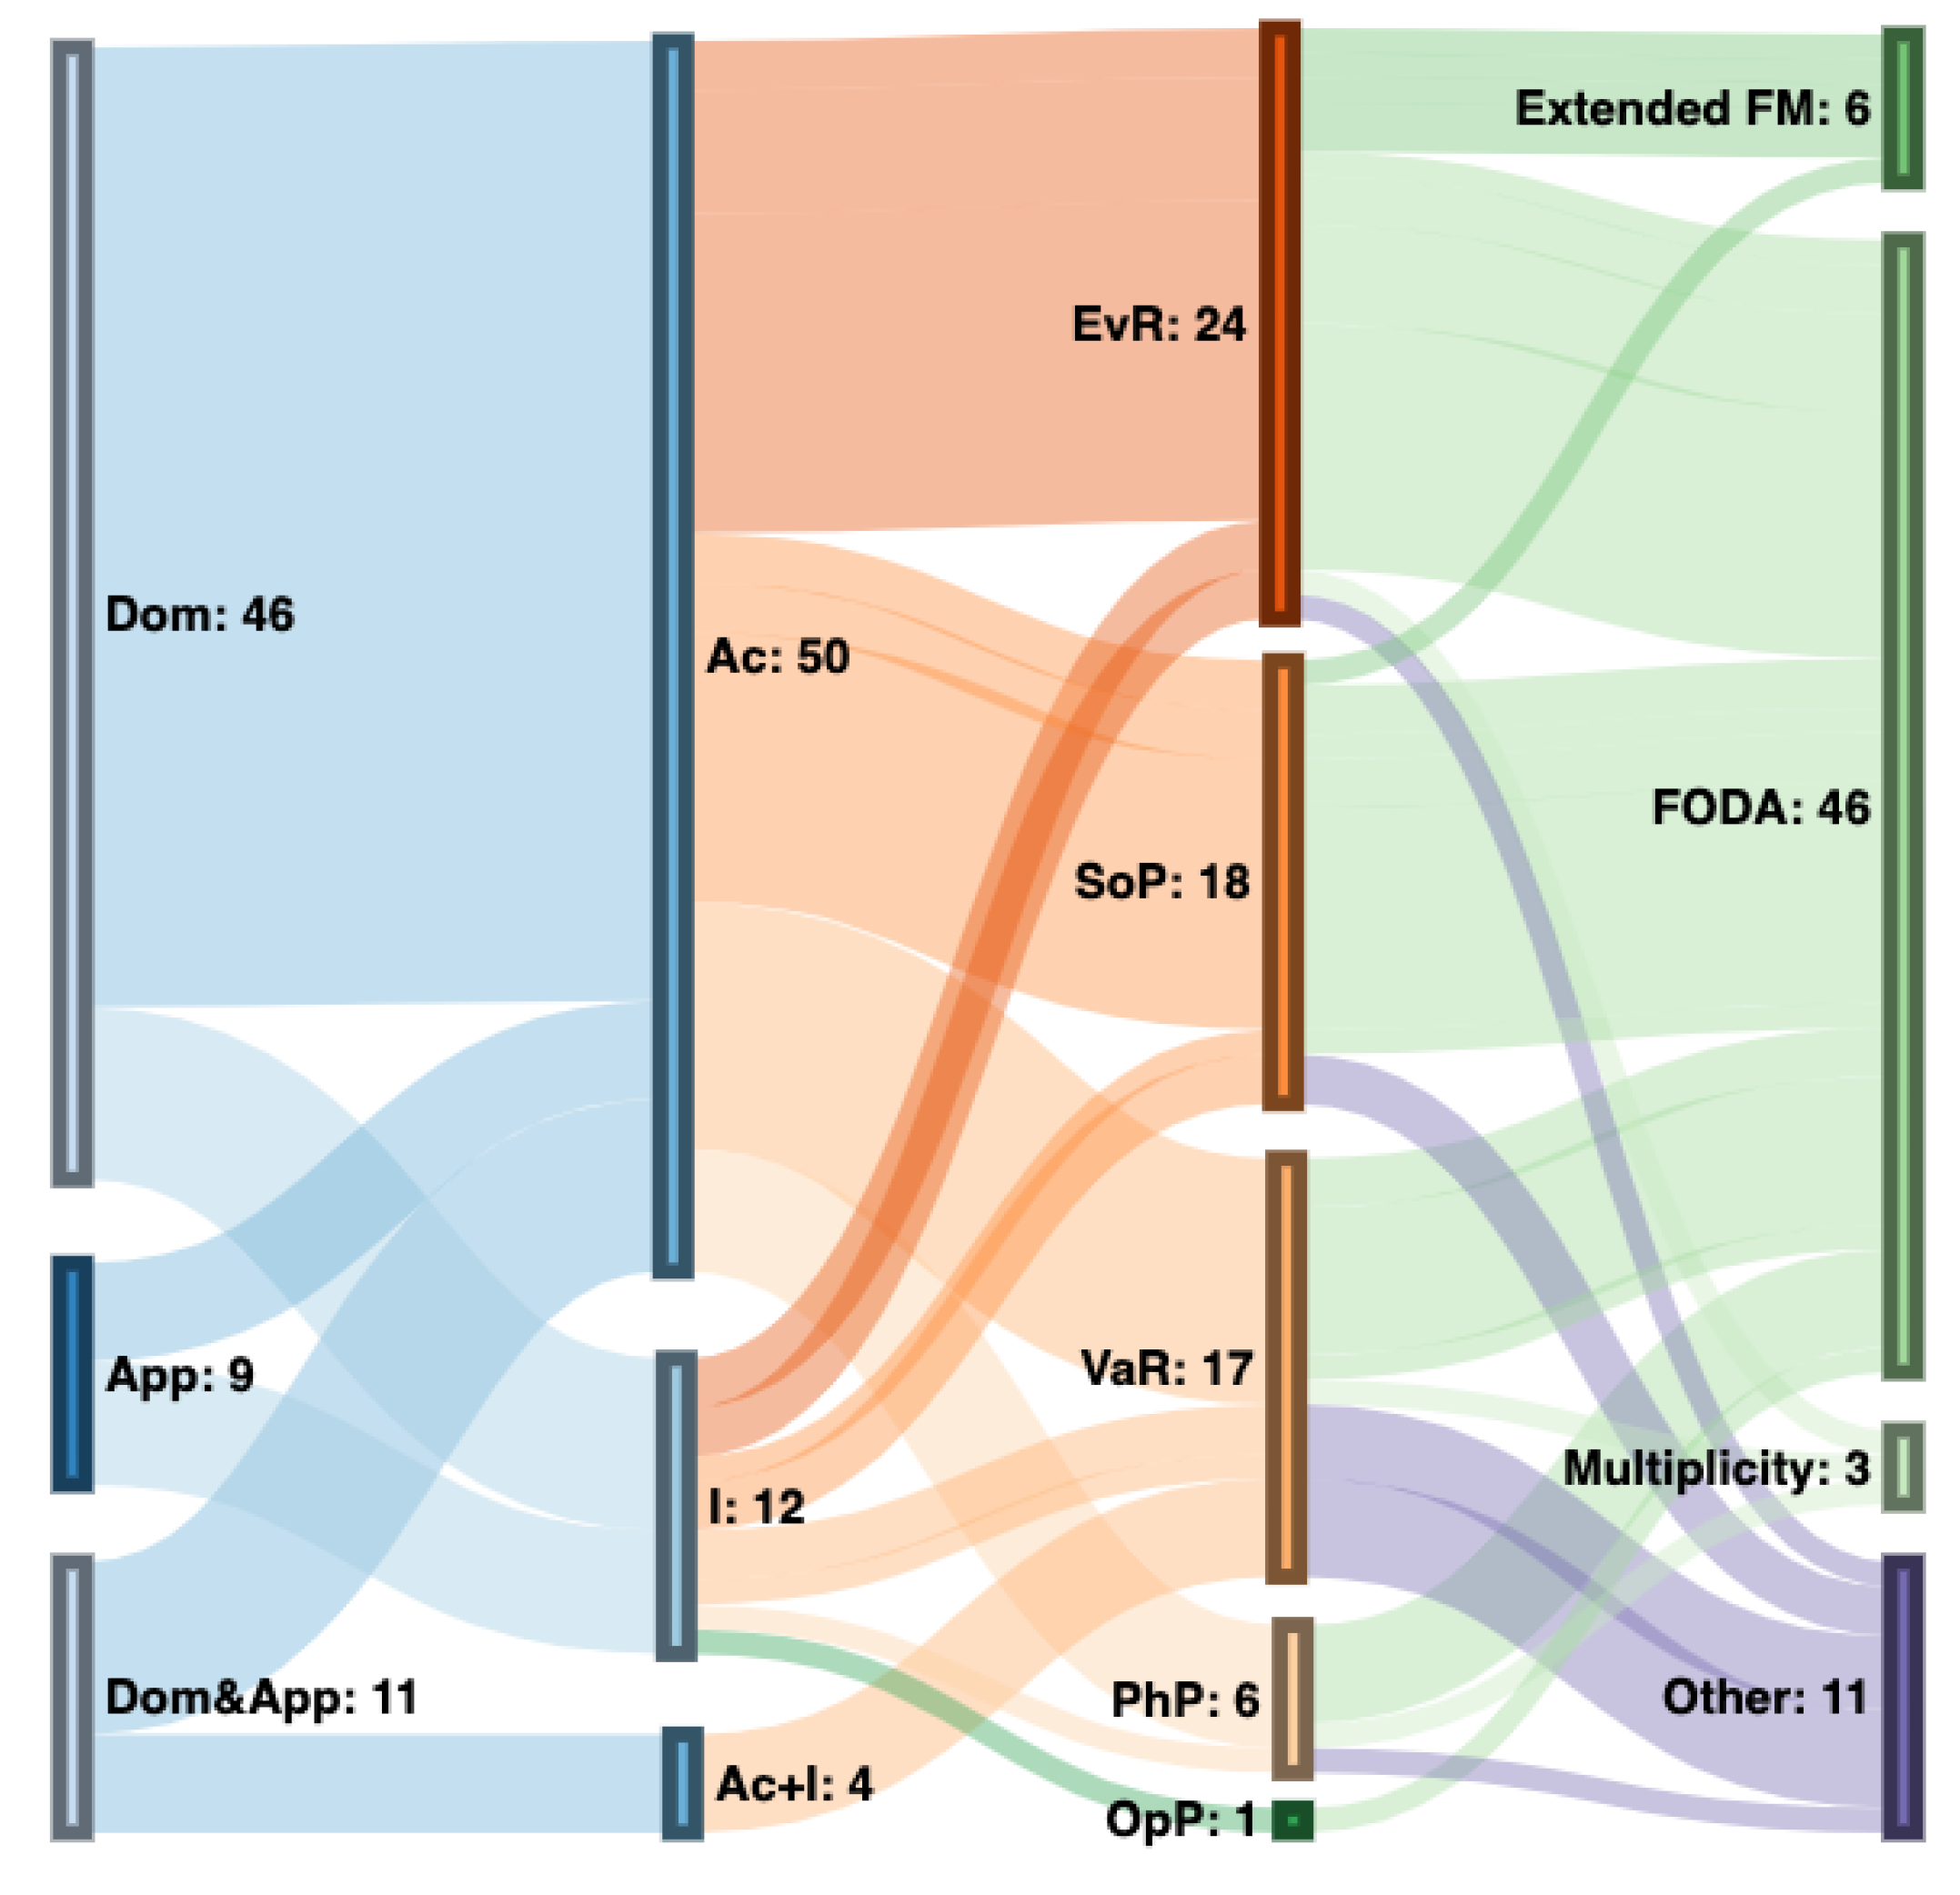
6.2. Relationships between RQs
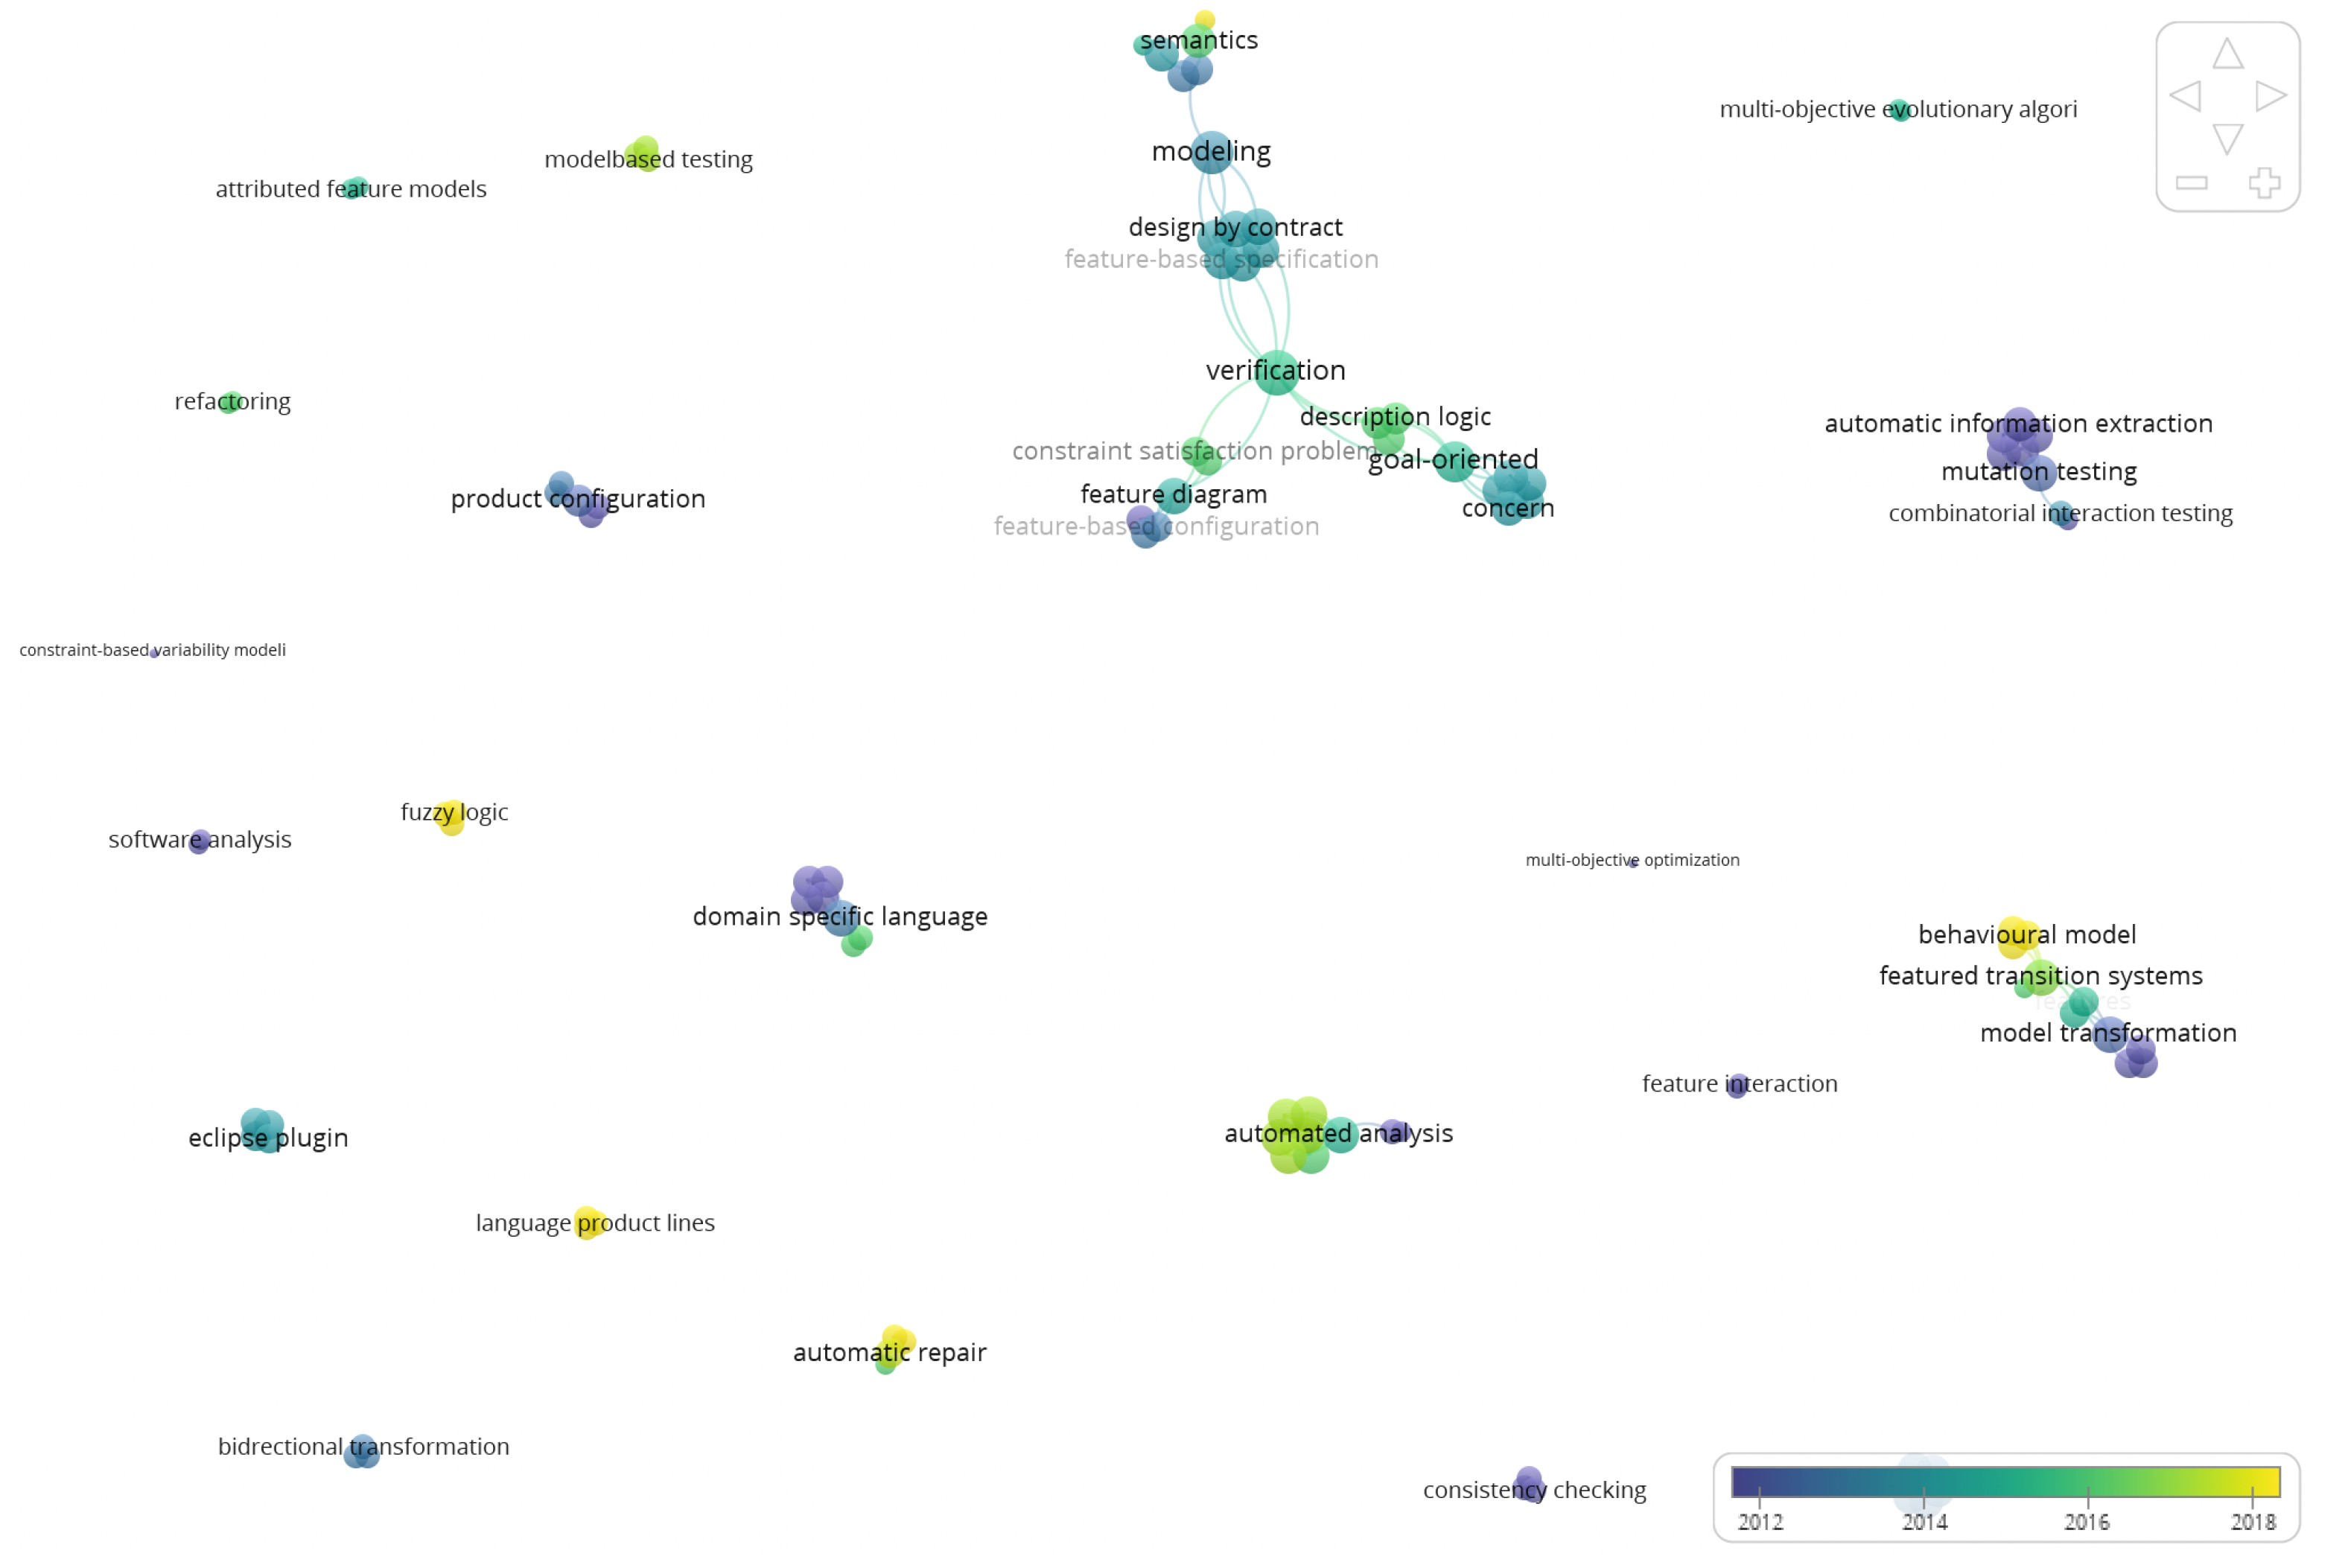
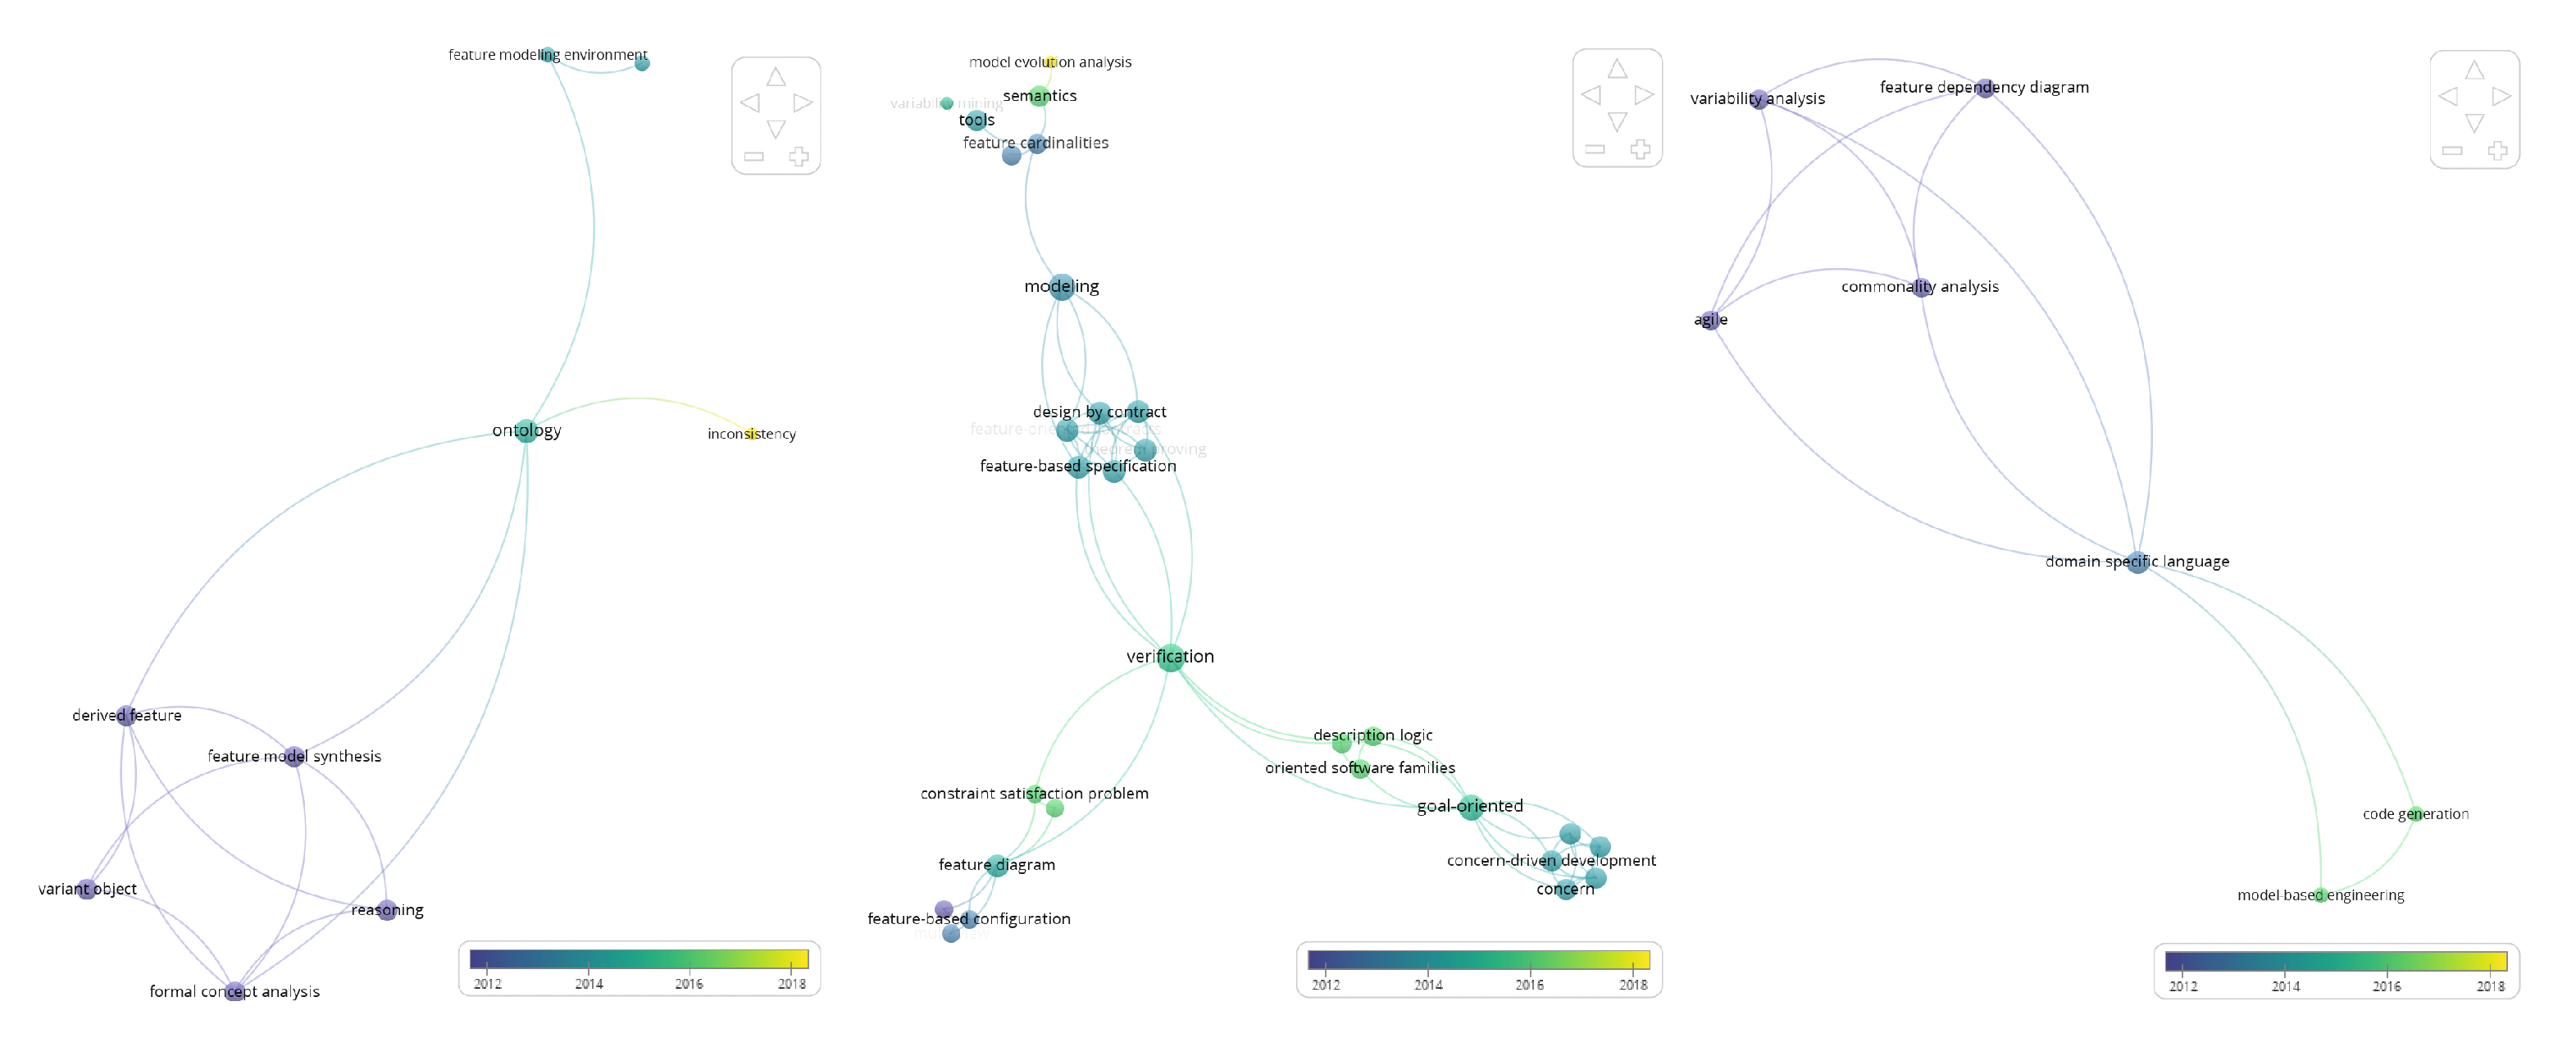
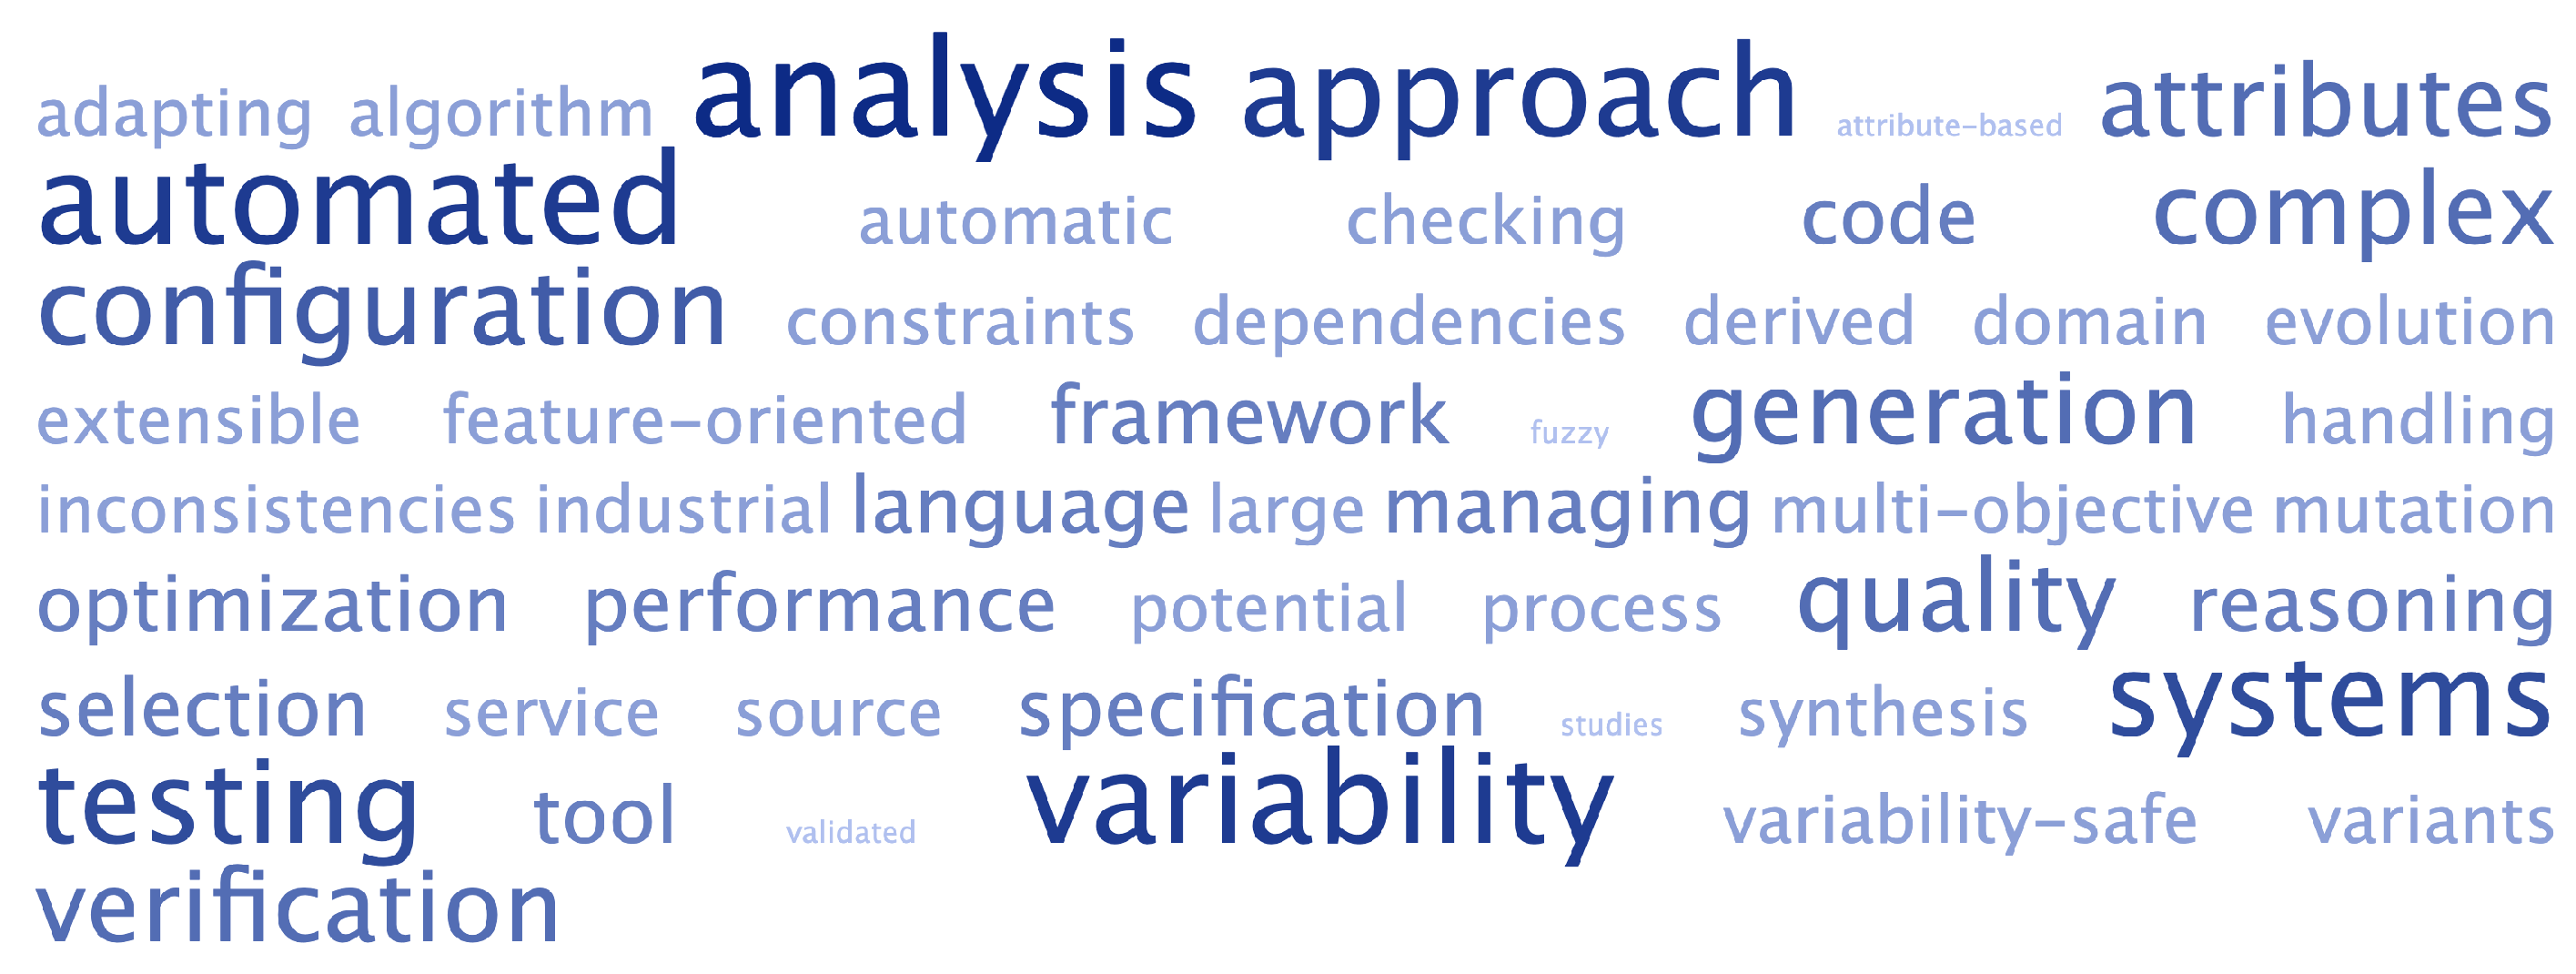
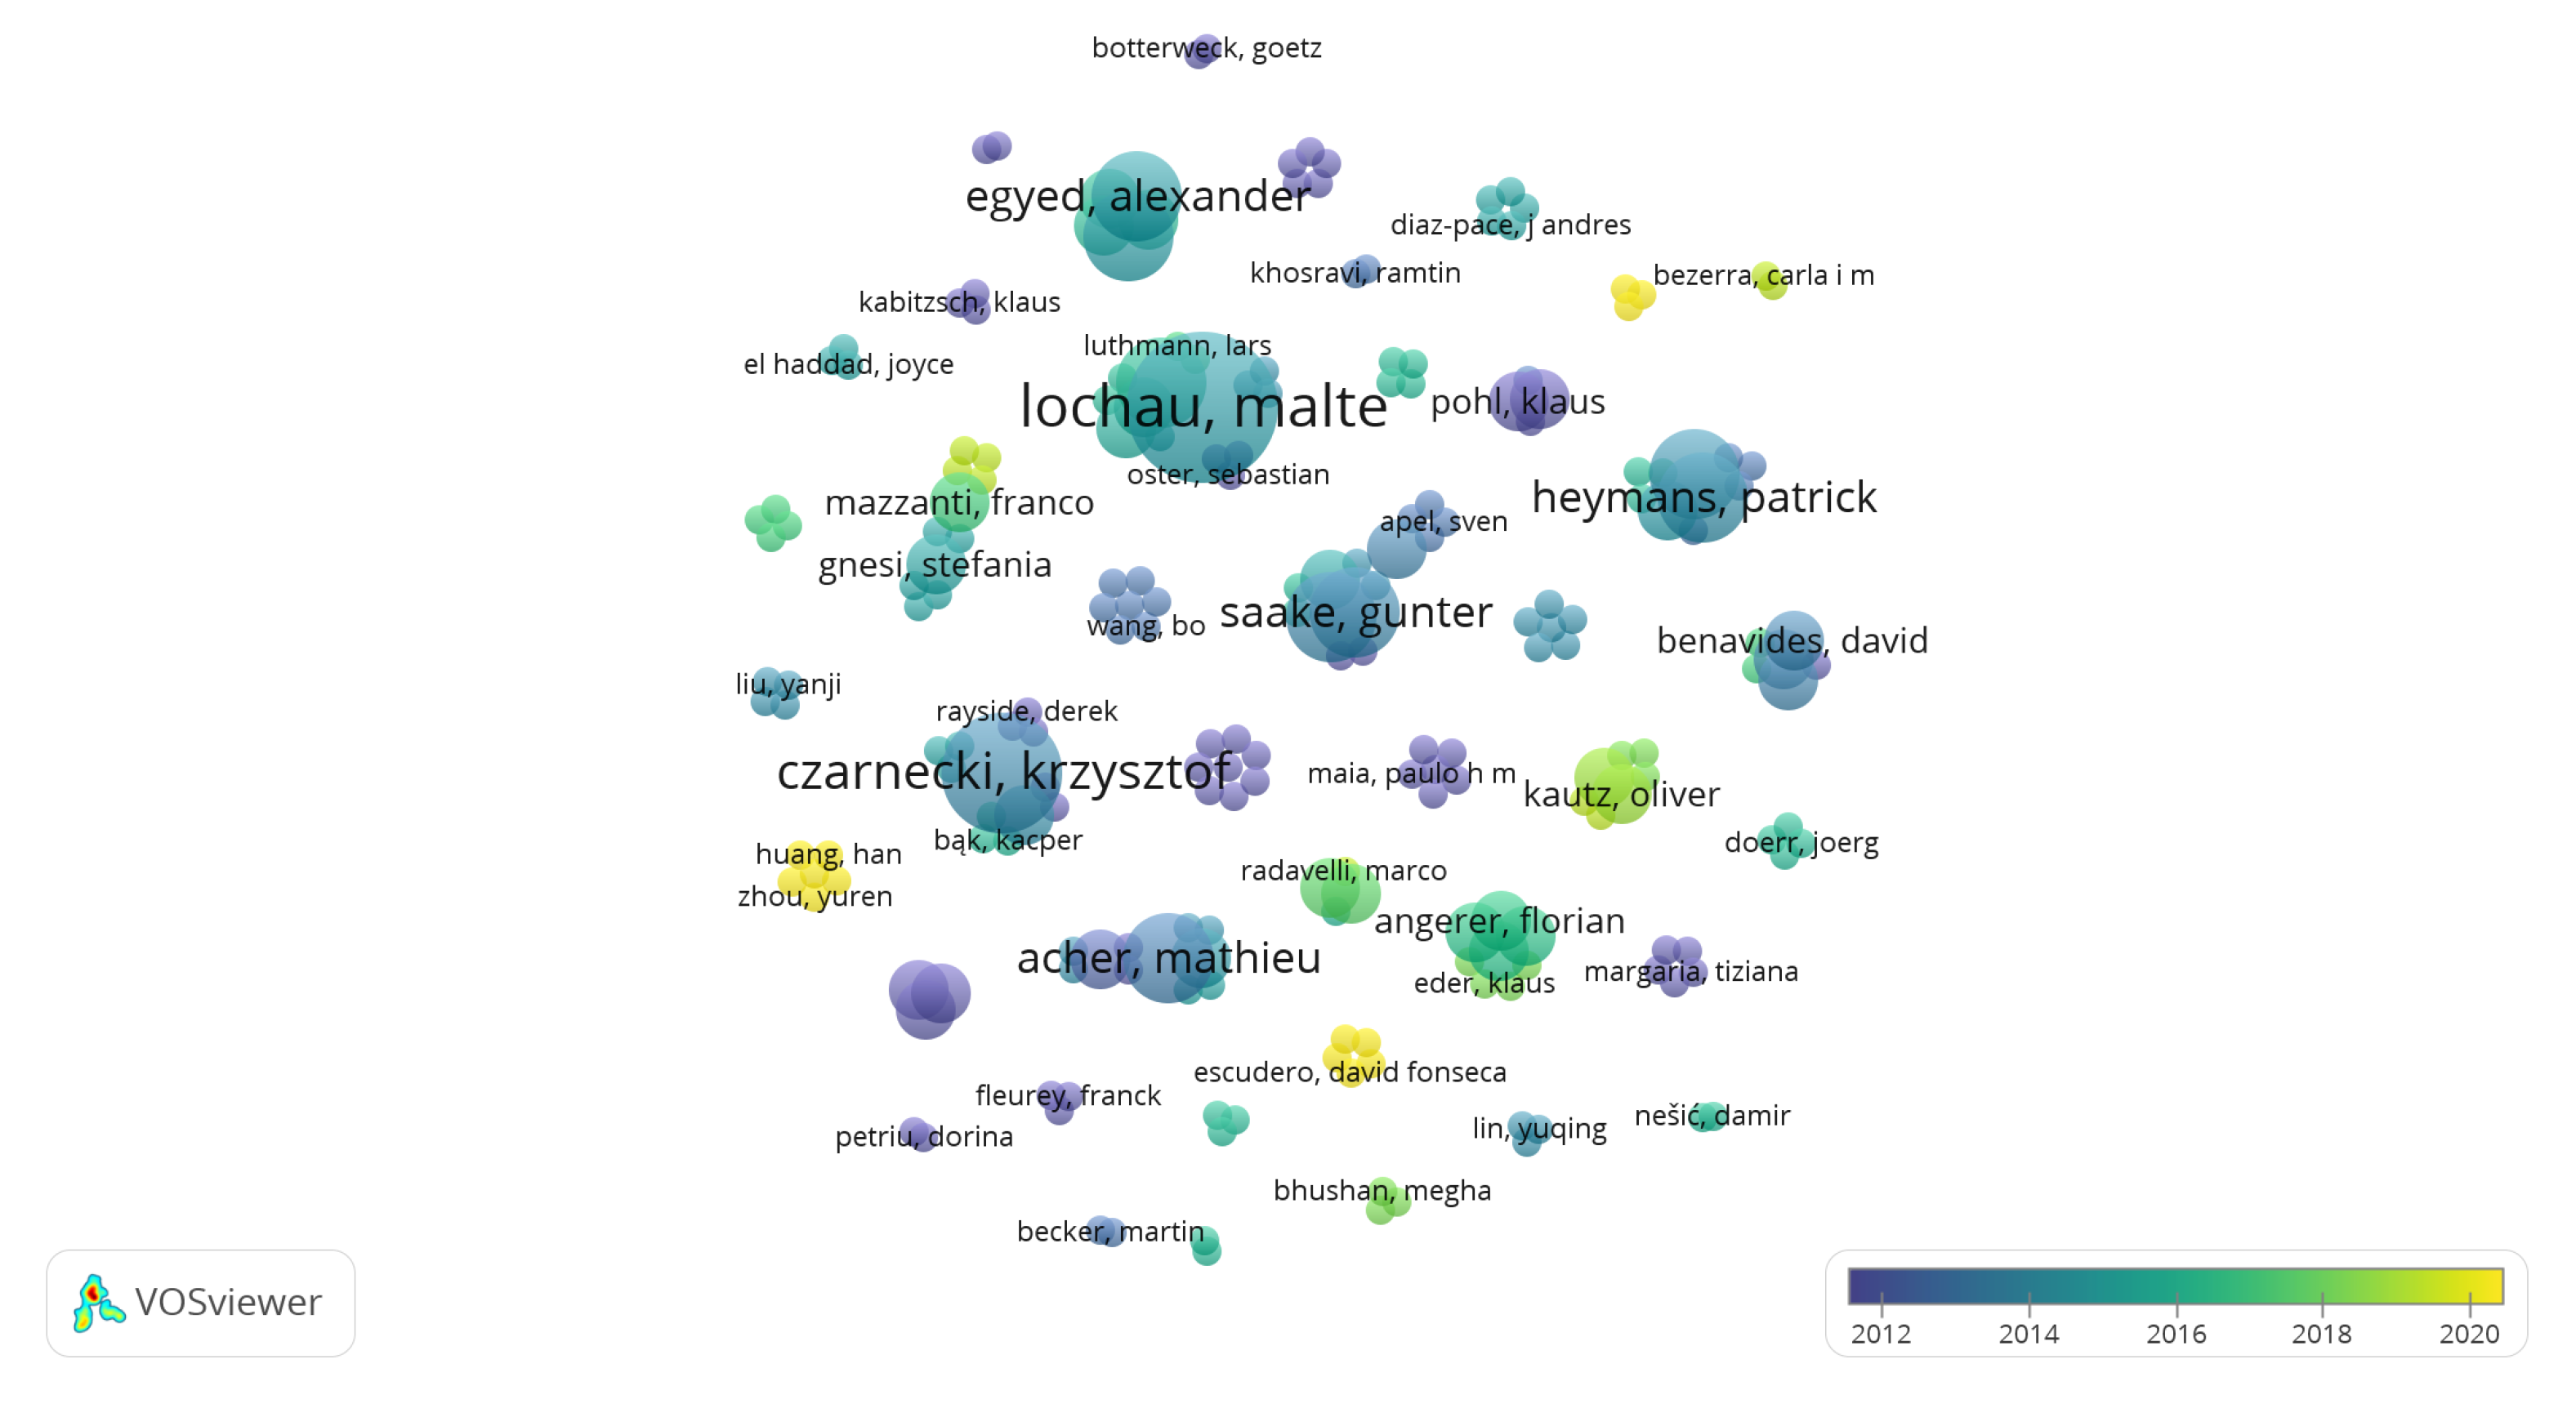
6.3. Bibliometric Analysis
6.3.1. Most Relevant Terms
6.3.2. Most Relevant Authors and Teams
6.4. Threats to Validity
6.4.1. Descriptive Validity
- We structured the information to be collected by means of several forms of data extraction (for RQs and PQs) to support the uniform recording of data and to ensure the objectivity of the data extraction process.
- Moreover, all the researchers participated in an initial meeting, intending to unify concepts and criteria, answer any questions, and demonstrate (using examples) how to conduct the process.
6.4.2. Theoretical Validity
- We started with a search string tailored for the six most popular digital libraries in online computer science databases.
- We defined a set of exclusion criteria to ensure the objectivity of the selection process.
- The selection of articles written in English and the discarding of studies in other languages could have a minimal effect on this criterion.
6.4.3. Generalizability
- We ensured that our set of RQs was general enough to identify and classify the findings on aspect-oriented software development methodologies regardless of specific cases, the type of industry, etc.
6.4.4. Interpretive Validity
- Both of the two researchers validated the conclusions.
- One researcher with experience in the problem domain helped us with the interpretation of data.
6.4.5. Repeatability
- We designed a detailed protocol to allow others to repeat the process that we have followed.
- The protocol was published online [49], so other researchers can replicate the process and, hopefully, corroborate the results.
6.5. Advances and Limitations
7. Conclusions
Author Contributions
Funding
Institutional Review Board Statement
Informed Consent Statement
Data Availability Statement
Acknowledgments
Conflicts of Interest
Appendix A

| REF. | Goal | RQs | Time Span and #Papers | Results |
|---|---|---|---|---|
| [14] | To provide a comprehensive literature review on the automated analysis of feature models 20 years after their invention. | RQ1: What operations of analysis on feature models have been proposed?
RQ2: What kind of automated support has been proposed, and how is it performed? RQ3: What are the challenges to be faced in the future? | 1990–2010 #53 papers | A catalog with 30 analysis operations identified in the literature, classifying the existing proposalsand providing automated support for them according to their underlying logical paradigms. |
| [28] | To provide an overview of the evolution of the automated analysis of FMs since 2010 by performing a systematic mapping study. | RQ1: Where are the papers published?
RQ2: Who are the authors and institutions that conduct research on AAFM? RQ3: What are the areas in which AAFM has been applied? RQ4: What kind of publications are used to address the challenges? RQ5: When were the papers published? RQ6: What are the interrelationships among the papers? | 2010–2017 #423 papers | Six different variability facets in which AAFM was applied were used to define the trends. The resultsproved the maturity in the number of journals published over the years, as well as the diversity of conferences and workshops in which papers were published. |
| [31] | To provide a short overview of the history and the importance of variability modeling and analysis over 30 years. | N/A (not a secondary study) | 1990–2020 N/A | Variability modelling and analysis has progressed in the last three decades. One of their conclusions was that the discipline progressed faster and better when formal approaches were considered by the researchers. |
| [32] | To provide key research issues related to FM defects in SPLs since 1990 by performing a systematic literature review. | RQ1: What is the classification of FM defects?
RQ2: What are the types of FM defects and relationships that cause these defects? RQ3: What corrective explanations have been proposed and implemented for defect removal in FMs? RQ4: What are the future challenges in the field of FM defects? | 1990–2015 #77 papers | The authors derived a typology of FM defects according to their level of importance. Information on the identification of defects and explanations are provided with a formalization. Furthermore, corrective explanations are presented, incorporating various techniques used to fix defects, along with their implementation. |
Appendix B
| REF. | Tool | Resume | URL (Last access) |
|---|---|---|---|
| [53] | S.P.L.O.T. | A web application that allows the creation of FMs and offers some model reasoning functionalities. This application uses a DB engine and SAT solver to perform various analyses. | http://www.splot-research.org/ (accessed on 5 June 2021) |
| [54] | FAMILIAR (FeAture Model scrIpt Language for manIpulation and Automatic Reasoning) | This is a DSL for working with FMs; among the functionalities it offers are exporting, importing, editing, configuration, composition, and decomposition of models. | https://github.com/FAMILIAR-project/familiar-language (accessed on 5 June 2021) |
| [37] | FaMa | This is an Eclipse plugin for modeling variability using FMs with multiplicity. In particular, through external reasoners, the application allows one to perform automated analysis on the created models. | https://www.isa.us.es/fama/?FaMa_Framework (accessed on 5 June 2021) |
| [55] | Feature IDE | This is is an open-source framework for feature-oriented software development based on Eclipse. | https://featureide.de/ (accessed on 5 June 2021) |
Appendix C
| ID | Title-Authors-Year-Source-Publisher |
|---|---|
| SP1 | Controlled and Extensible Variability of Concrete and Abstract Syntax with Independent Language Features. Butting, A.; Eikermann, R.; Kautz, O.; Rumpe, B.; Wortmann, A., 2018, VaMoS, ACM. |
| SP2 | CMT and FDE: Tools to Bridge the Gap between Natural Language Documents and Feature Diagrams. Ferrari, A.; Spagnolo, G.; Gnesi, S.; Dell’Orletta, F., 2015, SPLC, ACM. |
| SP3 | Automated Test Data Generation on the Analyses of Feature Models: A Metamorphic Testing Approach. S. Segura; R. M. Hierons; D. Benavides; A. Ruiz-Cortés, 2010, ICST. |
| SP4 | Static Analysis of Featured Transition Systems. Beek, M. H.; Damiani, F.; Lienhardt, M.; Mazzanti, F.; Paolini, L., 2019, SPLC, ACM. |
| SP5 | Pairwise Feature-Interaction Testing for SPLs: Potentials and Limitations. Oster, S.; Zink, M.; Lochau, M.; Grechanik, M., 2011, SPLC, ACM. |
| SP6 | An Algorithm for Generating T-Wise Covering Arrays from Large Feature Models. Johansen, M.F.; Haugen, O.; Fleurey, F., 2012, SPLC, ACM. |
| SP7 | User-Friendly Approach for Handling Performance Parameters during Predictive Software Performance Engineering. Tawhid, R.; Petriu, D., 2012, ICPE, ACM. |
| SP8 | Improving quality of software product line by analysing inconsistencies in feature models using an ontological rule-based approach. Bhushan, M.; Goel, S.; Kumar, A., 2018, Expert Systems, Wiley. |
| SP9 | Mining Complex Feature Correlations from Software Product Line Configurations. Zhang, B,; Becker, M., 2013. VaMoS, ACM. |
| SP10 | Handling Complex Configurations in Software Product Lines: A Tooled Approach. Urli, S.; Blay-Fornarino, M.; Collet, P., 2014, SPLC, ACM. |
| SP11 | Automatic Detection and Removal of Conformance Faults in Feature Models. P. Arcaini; A. Gargantini; P. Vavassori, 2016, ICST, IEEE. |
| SP12 | Managing Feature Models with Familiar: A Demonstration of the Language and Its Tool Support. Acher, M.; Collet, P.; Lahire, P.; France, R.B., 2011, VaMoS, ACM. |
| SP13 | Semantic Evolution Analysis of Feature Models. Drave, I.; Kautz, O.; Michael, J.; Rumpe, B., 2019, SPLC, ACM. |
| SP15 | WebFML: Synthesizing Feature Models Everywhere. Bécan, G.; Ben Nasr, S.; Acher, M.; Baudry, B., 2014, SPLC, ACM. |
| SP18 | Synthesis of Attributed Feature Models from Product Descriptions. Bécan, G.; Behjati, R.; Gotlieb, A.; Acher, M., 2015, SPLC, ACM. |
| SP19 | Beyond Boolean Product-Line Model Checking: Dealing with Feature Attributes and Multi-Features. Cordy, M.; Schobbens, P-Y.; Heymans, P.; Legay, A., 2013, ICSE, ACM. |
| SP20 | Featured Model-Based Mutation Analysis. Devroey, X.; Perrouin, G.; Papadakis, M.; Legay, A.; Schobbens, P-Y.; Heymans, P., 2016, ICSE, ACM. |
| SP21 | SAT-Based Analysis of Large Real-World Feature Models is Easy. Liang, J.H.; Ganesh, V.; Czarnecki, K.; Raman, V., 2015, SPLC, ACM. |
| SP22 | Automated Verification of Feature Model Configuration Processes Based on Workflow Petri Nets. Mennicke, S.; Lochau, M.; Schroeter, J.; Winkelmann, T., 2014, SPLC, ACM. |
| SP23 | Multi-View Modeling and Automated Analysis of Product Line Variability in Systems Engineering. Nešić, D.; Nyberg, M., 2016, SPLC, ACM. |
| SP24 | Grammar-Based Test Generation for Software Product Line Feature Models. Bagheri, E.; Ensan, F.; Gasevic, D., 2012, CASCON, ACM. |
| SP25 | Strategies for Product-Line Verification: Case Studies and Experiments. Apel, S.; Rhein, A. von; Wendler, P.; Größlinger, A.; Beyer, D., 2013, ICSE, ACM. |
| SP26 | Modeling and Testing Product Lines with Unbounded Parametric Real-Time Constraints. Luthmann, L.; Stephan, A.; Bürdek, J.; Lochau, M., 2017, SPLC, ACM. |
| SP27 | Towards Fixing Inconsistencies in Models with Variability. Lopez-Herrejon, R.E.; Egyed, A., 2012, VaMoS, ACM. |
| SP28 | Discrete Time Markov Chain Families: Modeling and Verification of Probabilistic Software Product Lines. Varshosaz, M.; Khosravi, R., 2013, SPLC, ACM. |
| SP29 | Squid: An Extensible Infrastructure for Analyzing Software Product Line Implementations. Vianna, A.; Pinto, F.; Sena, D.; Kulesza, U.; Coelho, R.; Santos, J.; Lima, J.; Lima, G., 2012, SPLC, ACM. |
| SP30 | Extending the automated feature model analysis capability of the abstract behavioral specification. Achda, A. C.; Azurat, A.; Muschevici, R.; Setyautami, M. R. A., 2017, ICACSIS, IEEE. |
| SP31 | Safe Adaptation in Context-Aware Feature Models. Marinho, F.; Maia, P.; Andrade, R.; Vidal, V.; Costa, P.; Werner, C., 2012, FOSD, ACM. |
| SP32 | Fault-Based Product-Line Testing: Effective Sample Generation Based on Feature-Diagram Mutation. Reuling, D.; Bürdek, J.; Rotärmel, S.; Lochau, M.; Kelter, U., 2015, SPLC, ACM. |
| SP33 | Measuring the structural complexity of feature models. Pohl, R.; Stricker, V.; Pohl, K., 2013, ASE, IEEE. |
| SP35 | A performance comparison of contemporary algorithmic approaches for automated analysis operations on feature models. Pohl, R.; Lauenroth, K.; Pohl, K., 2011, ASE, IEEE. |
| SP36 | Multi-Variability Modeling and Realization for Software Derivation in Industrial Automation Management. Fang, M.; Leyh, G.; Doerr, J.; Elsner, C., 2016, MODELS, ACM. |
| SP37 | Combined propagation-based reasoning with goal and feature models. Yanji, L.; Yukun, S.; Xinshang, Y.; Mussbacher, G., 2014, MoDRE, IEEE. |
| SP38 | Multi-Dimensional Variability Modeling. Rosenmüller, M.; Siegmund, N.; Thüm, T.; Saake, G., 2011, VaMoS, ACM. |
| SP39 | A Process for Fault-Driven Repair of Constraints Among Features. Arcaini, P.; Gargantini, A.; Radavelli, M., 2019, SPLC, ACM. |
| SP40 | Development of the Maintainability Index for SPLs Feature Models Using Fuzzy Logic. de Oliveira, D.; Bezerra, C., 2019, SBES, ACM. |
| SP41 | Potential Synergies of Theorem Proving and Model Checking for Software Product Lines. Thüm, T.; Meinicke, J.; Benduhn, F.; Hentschel, M.; von Rhein, A.; Saake, G., 2014, SPLC, ACM. |
| SP42 | Low-Level Variability Support for Web-Based Software Product Lines. Machado, I.; Santos, A,; Cavalcanti, Y,; Trzan, E.; de Souza, M.; de Almeida, E., 2014, VaMoS, ACM. |
| SP43 | A Feature-Oriented Approach for Web Service Customization. Nguyen, T.; Colman, A., 2010, ICWS, IEEE. |
| SP44 | Domain Specific Feature Modeling for Software Product Lines. Hofman, P.; Stenzel, T.; Pohley, T.; Kircher, M.; Bermann, A., 2012, SPLC, ACM. |
| SP45 | Extracting Variability-Safe Feature Models from Source Code Dependencies in System Variants. Assunçao, W.; Lopez-Herrejon, R.; Linsbauer, L.; Vergilio, S.; Egyed, A., 2015, GECCO, ACM. |
| SP46 | Feature-Model Interfaces: The Highway to Compositional Analyses of Highly-Configurable Systems. Schröter, R.; Krieter, S.; Thüm, T.; Benduhn, F.; Saake, G., 2016, ICSE, ACM. |
| SP47 | Configuration-Aware Change Impact Analysis. Angerer, F.; Grimmer, A.; Prähofer, H.; Grünbacher, P., 2015, ASE, ACM. |
| SP49 | Efficient Synthesis of Feature Models. Andersen, N.; Czarnecki, K.; She, S.; Wąsowski, A., 2012, SPLC, ACM. |
| SP50 | Modelling and Multi-Objective Optimization of Quality Attributes in Variability-Rich Software. Olaechea, R.; Stewart, S.; Czarnecki, K.; Rayside, D., 2012, NFPinDSML, ACM. |
| SP52 | Using FMC for Family-Based Analysis of Software Product Lines. ter Beek, M.; Fantechi, A.; Gnesi, S.; Mazzanti, F., 2015, SPLC, ACM. |
| SP53 | Managing the Variability in the Transactional Services Selection. Gamez, N.; El Haddad, J.; Fuentes, L., 2015, VaMoS, ACM. |
| SP54 | Reasoning of Feature Models from Derived Features. Ryssel, U.; Ploennigs, J.; Kabitzsch, K., 2012, SIGPLAN Notices, ACM. |
| SP55 | A novel hybrid approach for feature selection in software product lines. Hitesh Y.; Charan K., 2020, Multimedia Tools and Applications, Springer. |
| SP56 | Connecting domain-specific features to source code: towards the automatization of dashboard generation. Vázquez-Ingelmo, A.; García-Peñalvo, F.; Therón, R.; Filvà, D.; Escudero, D., 2020, Cluster Computing, Springer. |
| SP57 | Going deeper with optimal software products selection using many-objective optimization and satisfiability solvers. Yi, X.; Xiaowei, Y.; Yuren, Z.; Zibin, Z; Miqing, L.; Han, H., 2020, Empirical Software Engineering, Springer. |
| SP58 | Multi-purpose, multi-level feature modeling of large-scale industrial software systems. Rabiser, D.; Prähofer, H.; Grünbacher, P.; Petruzelka, M.; Eder, K.; Angerer, F.; Kromoser, M.; Grimmer, A., 2018, Software & Systems Modeling, Springer. |
| SP59 | FLAME: a formal framework for the automated analysis of software product lines validated by automated specification testing. Durán, A.; Benavides, D.; Segura, S.; Trinidad, P.; Ruiz-Cortés, A., 2017, Software & Systems Modeling, Springer. |
| SP60 | Multi-objective reverse engineering of variability-safe feature models based on code dependencies of system variants. Assunção, W.; Lopez-Herrejon, R.; Linsbauer, L.; Vergilio, S,; Egyed, A., 2017, Empirical Software Engineering, Springer. |
| SP61 | Reasoning about product-line evolution using complex feature model differences. Bürdek, J.; Kehrer, T.; Lochau, M.; Reuling, D.; Kelter, U.;, Schürr, A., 2016, Automated Software Engineering, Springer. |
| SP62 | A Feature Model Based Framework for Refactoring Software Product Line Architecture. Tanhaei, M.; Habibi, J.; Mirian-Hosseinabadi, S.-H., 2016, Journal of Computer Science and Technology, Springer. |
| SP63 | Clafer: unifying class and feature modeling. Bąk, K.; Diskin, Z.; Antkiewicz, M.; Czarnecki, K.; Wąsowski, A., 2016, Software & Systems Modeling, Springer. |
| SP64 | Attribute-based variability in feature models. Ahmet, Serkan, Karataş; Halit, O., 2016, Requirements Engineering, Springer. |
| SP65 | Goal-oriented modeling and verification of feature-oriented product lines. Mohsen, A.; Gerd, G.; Bardia, M.; Dragan, G., 2016, Software & Systems Modeling, Springer. |
| SP66 | An approach based on feature models and quality criteria for adapting component-based systems. Sanchez, E.; Diaz-Pace, A.; Zunino, A.; Moisan, S.; Rigault, J.P., 2015, Journal of Software Engineering Research and Development, Springer. |
| SP67 | Quality attribute modeling and quality aware product configuration in software product lines. Guoheng, Z.; Huilin, Y.; Yuqing, L., 2014, Software Quality Journal, Springer. |
| SP68 | Supporting multiple perspectives in feature-based configuration. Hubaux, A.; Heymans, P.; Schobbens, P.Y.; Deridder, D.; Khalil Abbasi, E., 2013, Software & Systems Modeling, Springer. |
| SP69 | Supporting feature model refinement with updatable view. Bo, Wang; Zhenjiang, HuQiang; SunHaiyan, Zhao; Yingfei, Xiong; Wei, Zhang; Hong, Mei, 2013, Frontiers of Computer Science, Springer. |
| SP70 | A constraint-based variability modeling framework. Jörges, S.; Lamprecht, A.-L.; Tiziana, MargariaIna; Schaefer, B., 2012, International Journal on Software Tools for Technology Transfer, Springer. |
| SP71 | Visualization of variability and configuration options. Pleuss, A.; Botterweck, G., 2012, International Journal on Software Tools for Technology Transfer, Springer. |
| SP72 | Decision support for the software product line domain engineering lifecycle. Bagheri, E.; Ensan, F; Gasevic, D., 2012, Automated Software Engineering, Springer. |
References
- Van der Linden, F.J.; Schmid, K.; Rommes, E. Software Product Lines in Action: The Best Industrial Practice in Product Line Engineering; Springer Science & Business Media: Berlin/Heidelberg, Germany, 2007. [Google Scholar]
- Clements, P.; Northrop, L. Software Product Lines, Course Notes of Product Line Systems Program; Software Engineering Institute, Carnegie Mellon University: Pittsburgh, PA, USA, 2003. [Google Scholar]
- Pohl, K.; Böckle, G.; van Der Linden, F.J. Software Product Line Engineering: Foundations, Principles and Techniques; Springer Science & Business Media: Berlin/Heidelberg, Germany, 2005. [Google Scholar]
- Ahmed, F.; Capretz, L.F. The software product line architecture: An empirical investigation of key process activities. Inf. Softw. Technol. 2008, 50, 1098–1113. [Google Scholar] [CrossRef]
- Chen, L.; Babar, M.A. A systematic review of evaluation of variability management approaches in software product lines. Inf. Softw. Technol. 2011, 53, 344–362. [Google Scholar] [CrossRef] [Green Version]
- Asikainen, T.; Mannisto, T.; Soininen, T. A unified conceptual foundation for feature modelling. In Proceedings of the 10th International Software Product Line Conference (SPLC’06), Baltimore, MD, USA, 21–24 August 2006; pp. 31–40. [Google Scholar] [CrossRef]
- Raatikainen, M.; Tiihonen, J.; Männistö, T. Software product lines and variability modeling. J. Syst. Softw. 2019, 149, 485–510. [Google Scholar] [CrossRef]
- Geraldi, R.T.; Reinehr, S.; Malucelli, A. Software product line applied to the Internet of Things: A systematic literature review. Inf. Softw. Technol. 2020, 124, 106293. [Google Scholar] [CrossRef]
- Ji, W.; Berger, T.; Antkiewicz, M.; Czarnecki, K. Maintaining feature traceability with embedded annotations. In Proceedings of the 19th International Conference on Software Product Line, Nashville, TN, USA, 20–24 July 2015; pp. 61–70. [Google Scholar]
- Krüger, J.; Gu, W.; Shen, H.; Mukelabai, M.; Hebig, R.; Berger, T. Towards a better understanding of software features and their characteristics: A case study of marlin. In Proceedings of the 12th International Workshop on Variability Modelling of Software-Intensive Systems, Madrid, Spain, 7–9 February 2018; pp. 105–112. [Google Scholar]
- Bhushan, M.; Goel, S. Improving software product line using an ontological approach. Sādhanā 2016, 41, 1381–1391. [Google Scholar] [CrossRef] [Green Version]
- Hähnle, R.; Schaefer, I. The quest for formal methods in software product line engineering. In Software Technology: 10 Years of Innovation in IEEE Computer; John Wiley & Sons: Hoboken, NJ, USA, 2018. [Google Scholar]
- Heradio, R.; Perez-Morago, H.; Fernandez-Amoros, D.; Cabrerizo, F.J.; Herrera-Viedma, E. A bibliometric analysis of 20 years of research on software product lines. Inf. Softw. Technol. 2016, 72, 1–15. [Google Scholar] [CrossRef]
- Benavides, D.; Segura, S.; Ruiz-Cortés, A. Automated analysis of feature models 20 years later: A literature review. Inf. Syst. 2010, 35, 615–636. [Google Scholar] [CrossRef] [Green Version]
- Arboleda, H.; Royer, J.C. Model-Driven and Software Product Line Engineering; John Wiley & Sons: Hoboken, NJ, USA, 2012. [Google Scholar] [CrossRef]
- Apel, S.; Batory, D.; Kästner, C.; Saake, G. Software product lines. In Feature-Oriented Software Product Lines; Springer: New York, NY, USA, 2013; pp. 3–15. [Google Scholar] [CrossRef]
- Camacho, M.C.; Álvarez, F.; Collazos, C.; Leger, P.; Bermúdez, J.D.; Hurtado, J.A. A Collaborative Method for Scoping Software Product Lines: A Case Study in a Small Software Company. Appl. Sci. 2021, 11, 6820. [Google Scholar] [CrossRef]
- Galster, M.; Weyns, D.; Tofan, D.; Michalik, B.; Avgeriou, P. Variability in software systems—A systematic literature review. IEEE Trans. Softw. Eng. 2013, 40, 282–306. [Google Scholar] [CrossRef]
- Sinnema, M.; Deelstra, S. Industrial validation of COVAMOF. J. Syst. Softw. 2008, 81, 584–600. [Google Scholar] [CrossRef]
- Kang, K.C.; Cohen, S.G.; Hess, J.A.; Novak, W.E.; Peterson, A.S. Feature-Oriented Domain Analysis (FODA) Feasibility Study; Technical Report CMU/SEI-90-TR-021; Carnegie-Mellon University: Pittsburgh, PA, USA; Software Engineering Institute: Pittsburgh, PA, USA, 1990. [Google Scholar]
- Czarnecki, K.; Wasowski, A. Feature diagrams and logics: There and back again. In Proceedings of the 11th International Software Product Line Conference (SPLC 2007), Kyoto, Japan, 10–14 September 2007; pp. 23–34. [Google Scholar] [CrossRef]
- Batory, D. Feature models, grammars, and propositional formulas. In Proceedings of the International Conference on Software Product Lines, Rennes, France, 26–29 September 2005; pp. 7–20. [Google Scholar] [CrossRef]
- Benavides, D.; Trinidad, P.; Ruiz-Cortes, A. Automated reasoning on feature models. In Proceedings of the International Conference on Advanced Information Systems Engineering, Porto, Portugal, 13–17 June 2005; pp. 491–503. [Google Scholar] [CrossRef] [Green Version]
- Benavides, D.; Galindo, J.A. Automated analysis of feature models: Current state and practices. In Proceedings of the 22nd International Systems and Software Product Line Conference, Gothenburg, Sweden, 10–14 September 2018; Volume 1, p. 298. [Google Scholar] [CrossRef]
- Lettner, M.; Rodas, J.; Galindo, J.A.; Benavides, D. Automated analysis of two-layered feature models with feature attributes. J. Comput. Lang. 2019, 51, 154–172. [Google Scholar] [CrossRef]
- Cook, S.A. The complexity of theorem-proving procedures. In Proceedings of the Third Annual ACM Symposium on Theory of Computing, Shaker Heights, OH, USA, 3–5 May 1971; pp. 151–158. [Google Scholar]
- Bryant, R.E. Graph-based algorithms for boolean function manipulation. IEEE Trans. Comput. 1986, 100, 677–691. [Google Scholar] [CrossRef] [Green Version]
- Galindo, J.; Benavides, D.; Trinidad Martín Arroyo, P.; Gutiérrez, A.; Ruiz, A. Automated analysis of feature models: Quo vadis? Computing 2019, 101, 387–433. [Google Scholar] [CrossRef] [Green Version]
- Gacitúa, R.; Sepúlveda, S.; Mazo, R. FM-CF: A framework for classifying feature model building approaches. J. Syst. Softw. 2019, 154, 1–21. [Google Scholar] [CrossRef]
- Galindo, J.A.; Benavides, D. A Python framework for the automated analysis of feature models: A first step to integrate community efforts. In Proceedings of the 24th ACM International Systems and Software Product Line Conference-Volume B, Montreal, QC, Canada, 19–23 October 2020; pp. 52–55. [Google Scholar] [CrossRef]
- Benavides, D. Variability modelling and analysis during 30 years. In From Software Engineering to Formal Methods and Tools, and Back; Springer: Cham, Switzerland, 2019; pp. 365–373. [Google Scholar]
- Bhushan, M.; Negi, A.; Samant, P.; Goel, S.; Kumar, A. A classification and systematic review of product line feature model defects. Softw. Qual. J. 2020, 28, 1507–1550. [Google Scholar] [CrossRef]
- Segura, S.; Galindo, J.A.; Benavides, D.; Parejo, J.A.; Ruiz-Cortés, A. BeTTy: Benchmarking and testing on the automated analysis of feature models. In Proceedings of the Sixth International Workshop on Variability Modeling of Software-Intensive Systems, Leipzig, Germany, 25–27 January 2012; pp. 63–71. [Google Scholar]
- Pohl, R.; Lauenroth, K.; Pohl, K. A performance comparison of contemporary algorithmic approaches for automated analysis operations on feature models. In Proceedings of the 2011 26th IEEE/ACM International Conference on Automated Software Engineering (ASE 2011), Lawrence, KS, USA, 6–10 November 2011; pp. 313–322. [Google Scholar]
- Petersen, K.; Vakkalanka, S.; Kuzniarz, L. Guidelines for conducting systematic mapping studies in software engineering: An update. Inf. Softw. Technol. 2015, 64, 1–18. [Google Scholar] [CrossRef]
- Kitchenham, B.A.; Budgen, D.; Brereton, O.P. The value of mapping studies—A participant-observer case study. In Proceedings of the 14th International Conference on Evaluation and Assessment in Software Engineering (EASE), Durham, UK, 12–13 April 2010; pp. 1–9. [Google Scholar]
- Benavides, D.; Trinidad, P.; Ruiz-Cortés, A.; Segura, S. Fama. In Systems and Software Variability Management; Springer: Cham, Switzerland, 2013; pp. 163–171. [Google Scholar] [CrossRef]
- Kitchenham, B.A.; Charters, S. Guidelines for Performing Systematic Literature Reviews in Software Engineering; EBSE Technical Report EBSE-2007-01; Keele University: Newcastle, UK, 2007. [Google Scholar]
- Wieringa, R.; Maiden, N.; Mead, N.; Rolland, C. Requirements engineering paper classification and evaluation criteria: A proposal and a discussion. Requir. Eng. 2006, 11, 102–107. [Google Scholar] [CrossRef]
- Brereton, P.; Kitchenham, B.A.; Budgen, D.; Turner, M.; Khalil, M. Lessons from applying the systematic literature review process within the software engineering domain. J. Syst. Softw. 2007, 80, 571–583. [Google Scholar] [CrossRef] [Green Version]
- Petticrew, M.; Roberts, H. Systematic Reviews in the Social Sciences: A Practical Guide; John Wiley & Sons: New York, NY, USA, 2008. [Google Scholar]
- Sepúlveda, S.; Esperguel, M. Systematic Mapping Protocol: Reasoning Algorithms on Feature Model. arXiv 2021, arXiv:2103.16325. [Google Scholar]
- Gwet, K. Inter-rater reliability: Dependency on trait prevalence and marginal homogeneity. Stat. Methods Inter-Rater Reliab. Assess. Ser. 2002, 2, 1–9. [Google Scholar]
- Fleiss, J. Statistical Methods for Rates and Proportions; John Wiley & Sons: New York, NY, USA, 1981. [Google Scholar]
- Esperguel, M.; Sepúlveda, S. Feature modeling tool: A proposal using ADOxx technology. In Proceedings of the 2016 XLII Latin American Computing Conference (CLEI), Valparaiso, Chile, 10–14 October 2016; pp. 1–9. [Google Scholar] [CrossRef]
- Esperguel, M.; Sepúlveda, S.; Monsalve, E. FMxx: A proposal for the creation, management and review of feature models in software product lines. In Proceedings of the 36th International Conference of the Chilean Computer Science Society (SCCC), Arica, Chile, 16–20 October 2017; pp. 1–7. [Google Scholar] [CrossRef]
- Esperguel, M.; Sepúlveda, S. From UML/OCL to ADOxx specifications: How to do it. In Proceedings of the 2018 IEEE International Conference on Automation/XXIII Congress of the Chilean Association of Automatic Control (ICA-ACCA), Concepcion, Chile, 17–19 October 2018; pp. 1–6. [Google Scholar] [CrossRef]
- Sepúlveda, S.; Cravero, A.; Cachero, C. Requirements modeling languages for software product lines: A systematic literature review. Inf. Softw. Technol. 2016, 69, 16–36. [Google Scholar] [CrossRef]
- Sepúlveda, S.; Bobadilla, A.; Espinoza, M.; Esparza, V. Solving errors detected in feature modeling languages: A proposal. In Proceedings of the International Conference on Information Technology & Systems, Libertad City, Ecuador, 4–6 February 2021; pp. 375–385. [Google Scholar]
- Petersen, K.; Gencel, C. Worldviews, research methods, and their relationship to validity in empirical software engineering research. In Proceedings of the 2013 Joint Conference of the 23rd International Workshop on Software Measurement and the 8th International Conference on Software Process and Product Measurement, Ankara, Turkey, 23–26 October 2013; pp. 81–89. [Google Scholar]
- Petersen, K.; Feldt, R.; Mujtaba, S.; Mattsson, M. Systematic mapping studies in software engineering. In Proceedings of the 12th International Conference on Evaluation and Assessment in Software Engineering (EASE), Bari, Italy, 26–27 June 2008; pp. 1–10. [Google Scholar]
- Wohlin, C.; Mendes, E.; Felizardo, K.R.; Kalinowski, M. Guidelines for the search strategy to update systematic literature reviews in software engineering. Inf. Softw. Technol. 2020, 127, 106366. [Google Scholar] [CrossRef]
- Mendonca, M.; Branco, M.; Cowan, D. SPLOT: Software product lines online tools. In Proceedings of the 24th ACM SIGPLAN Conference Companion on Object Oriented Programming Systems Languages and Applications, Orlando, FL, USA, 25–29 October 2009; pp. 761–762. [Google Scholar] [CrossRef]
- Acher, M.; Collet, P.; Lahire, P.; France, R.B. Familiar: A domain-specific language for large scale management of feature models. Sci. Comput. Program. 2013, 78, 657–681. [Google Scholar] [CrossRef]
- Thüm, T.; Kästner, C.; Benduhn, F.; Meinicke, J.; Saake, G.; Leich, T. FeatureIDE: An extensible framework for feature-oriented software development. Sci. Comput. Program. 2014, 79, 70–85. [Google Scholar] [CrossRef]


| Proposal | Characteristics |
|---|---|
| Constraint Satisfaction Problem (CSP) | This consists of a set of variables, finite domains for those variables, and a set of constraints that restrict the values of the variables. It can perform most of the operations currently identified in feature models [23]. |
| Boolean Satisfiability Problem (SAT) | This consists of a set of Boolean variables connected by logical operators. The SAT problem consists of deciding whether a given propositional formula satisfies whether logical values can be assigned to its variables so that the formula is true [26]. |
| Binary Decision Diagrams (BDD) | A data structure is used to represent a boolean function. A BDD is an acyclic, directed, rooted graph composed of a group of decision nodes and two terminal nodes called 0-terminal and 1-terminal. Each node of the graph represents a variable in a Boolean function and has two child nodes representing an assignment of the variable to 0 and 1 [27]. |
| Operation | Definition | Possible Applications |
|---|---|---|
| Void feature model | This operation takes an FM as the input and returns a value indicating whether such model is void. | Automating this operation helps to debug large-scale FMs. |
| Valid product | This operation takes an FM and a product as the input and returns a value that determines whether the product belongs to the set of products represented by the FM or not. | This operation may help ti determine whether a given product is available in an SPL. |
| All products | This operation takes an FM as the input and returns all the products represented by the model. | This operation may help to identify new valid requirement combinations not considered in the initial scope of the SPL. |
| Relationship | PL Mapping | CP Mapping | Examples |
|---|---|---|---|
 | A <–> B | A = B | PL-Mapping: Mobile Phone <–> Calls Mobile Phone <–> Screen CP-Mapping: Mobile Phone = Calls Mobile Phone = Screen |
 | A –> B | if (A = 0) B = 0 | PL-Mapping: GPS –> Mobile Phone Media –> Mobile Phone CP-Mapping: if (Mobile Phone = 0) GPS = 0 if (Mobile Phone = 0) Media = 0 |
| Ref. | RQ1 | RQ2 | RQ3 | RQ4 | RQ5 | RQ6 |
|---|---|---|---|---|---|---|
| [14] | ✓ | ✓ | ||||
| [28] | ✓ | |||||
| [31] | ✓ | |||||
| [32] | ✓ | ✓ |
| ID | RQs | Aim and Classification Schema |
|---|---|---|
| RQ1 | In which SPL stage are these algorithms used? | To highlight the area where the algorithms are applied: domain engineering, application engineering |
| RQ2 | What type of technologies do algorithms mainly use? | To understand which technologies the algorithms are most often based on: meta-model, UML, OCL, transformations, solver, other. |
| RQ3 | What is the origin of the proposal? | To identify the origins of the papers: academia, industry, or jointly. |
| RQ4 | What is the level of validation? | To gain insights into the maturity level of the research based on the Wieringa research taxonomy [39]. |
| RQ5 | What kind of FM does the algorithm work on? | To know what type of FMs are the most used: FODA FM, extended FM, multiplicity, orthogonal model, multi FM, complex FM, others. |
| RQ6 | What problems does the algorithm solve? | To highlight which problems have more solutions and which do not: null FMs, valid product, valid partial configuration, etc. |
| ID | RQs | Aim & Classification Schema |
|---|---|---|
| PQ1 | Where was the paper published? | To help researchers know which journals or conferences are most interested in each topic. |
| PQ2 | What was the year of publication of each paper? | To highlight how the algorithms have progressed through the years from 2010 to 2020. |
| Source | URL (Last Access) |
|---|---|
| ACM Digital Library | https://dl.acm.org (accessed on 5 January 2022) |
| IEEE Xplore | https://ieeexplore.ieee.org/Xplore/home.jsp (accessed on 10 December 2021) |
| Springer Link | https://www.springer.com (accessed on 10 November 2021) |
| Wiley Inter-Science | https://www.onlinelibrary.wiley.com (accessed on 25 November 2021) |
| ID | Criteria |
|---|---|
| IC1 | Papers with more than one version—the most recent version will be included and the others will be excluded. |
| IC2 | Works written in English. |
| IC3 | Type of paper:
|
| IC4 | Papers published between 2010 and 2020. |
| IC5 | Papers of which the abstracts show the study’s relationship with the automatic analysis of FMs. |
| IC6 | General Topic:
|
| ID | Criteria |
|---|---|
| EC1 | Duplicated papers will be excluded. |
| EC2 | The following types of papers will be excluded:
|
| EC3 | Papers of which the abstracts do not show the study’s relationship with the automatic analysis of FMs will be excluded. |
| EC4 | Secondary studies will be excluded. If they are relevant, they could be added as related work. |
| EC5 | Papers that can not be accessed will not be considered. |
| D | A | D + A |
|---|---|---|
| SP2, SP3, SP4, SP6, SP8, SP11, SP12, SP13, SP15, SP18, SP19, SP20, SP21, SP23, SP24, SP25, SP27, SP28, SP30, SP31, SP32, SP33, SP35, SP37, SP38, SP40, SP41, SP44, SP46, SP49, SP50, SP52, SP53, SP54, SP58, SP59, SP61, SP62, SP63, SP64, SP65, SP66, SP68, SP69, SP70, SP72 | SP9, SP10, SP22, SP29, SP36, SP55, SP57, SP60, SP67 | SP1, SP5, SP7, SP26, SP39, SP42, SP43, SP45, SP47, SP56, SP71 |
| ALG | FRW | GRP | MCK | MLG | NLP | ONT | SEM | SOL | STM | TRA | Other |
|---|---|---|---|---|---|---|---|---|---|---|---|
| SP5, SP6, SP18, SP19, SP37, SP55, SP61 | SP9, SP20, SP32, SP52, SP59, SP62, SP70 | SP33, SP47 | SP25, SP27, SP29, SP41, SP42, SP46, | SP1, SP12, SP15, SP36, SP38, SP44, SP50, SP53, SP58 | SP2, SP72 | SP8, SP54 | SP13, SP64 | SP21, SP30, SP35, SP57, SP63, SP71 | SP4, SP26 | SP3, SP10, SP11, SP23, SP31, SP39, SP43, SP45, SP49, SP60, SP66, SP68 | SP7, SP22, SP24, SP28, SP40, SP56, SP65, SP67, SP69 |
| A | I | A + I |
|---|---|---|
| SP1, SP2, SP3, SP4, SP5, SP6, SP7, SP8, SP9, SP10, SP11, SP12, SP13, SP15, SP18, SP19, SP20, SP21, SP22, SP23, SP24, SP25, SP26, SP27, SP28, SP29, SP30, SP31, SP32, SP33, SP35, SP37, SP38, SP39, SP40, SP41, SP42, SP43, SP44, SP46, SP49, SP50, SP52, SP53, SP54, SP58, SP59, SP61, SP62, SP63 | SP36, SP55, SP57, SP60, SP64, SP65, SP66, SP67, SP68, SP69, SP70, SP72 | SP45, SP47, SP56, SP71 |
| EvR | VaR | SoP | PhP | OpP | ExP |
|---|---|---|---|---|---|
| SP1, SP2, SP3, SP4, SP5, SP6, SP7, SP8, SP9, SP10, SP11, SP12, SP13, SP15, SP18, SP19, SP20, SP21, SP26, SP36, SP39, SP55, SP64, SP65 | SP45, SP47, SP49, SP50, SP52, SP53, SP54, SP56, SP58, SP59, SP60, SP61, SP62, SP63, SP67, SP71, SP72 | SP22, SP29, SP30, SP31, SP32, SP33, SP35, SP37, SP38, SP40, SP41, SP42, SP43, SP44, SP46, SP57, SP69, SP70 | SP23, SP24, SP25, SP27, SP28, SP68 | SP66 | – |
| Extended FM | FODA | Multiplicity | OVM | Other |
|---|---|---|---|---|
| SP1, SP2, SP9, SP64, SP65, SP69 | SP3, SP4, SP5, SP6, SP7, SP8, SP10, SP11, SP12, SP13, SP15, SP18, SP19, SP22, SP23, SP24, SP25, SP26, SP27, SP29, SP30, SP31, SP32, SP33, SP35, SP36, SP37, SP38, SP39, SP40, SP41, SP42, SP43, SP49, SP50, SP52, SP53, SP54, SP55, SP57, SP58, SP60, SP66, SP67, SP70, SP72 | SP20, SP28, SP45 | – | SP21, SP44, SP46, SP47, SP56, SP59, SP61, SP62, SP63, SP68, SP71 |
| Category | #Papers (%) | Selected Papers |
|---|---|---|
| Valid partial configuration | 11 (17%) | SP1, SP6, SP12, SP22, SP36, SP37, SP43, SP46, SP64, SP67, SP71 |
| Anomaly detection | 10 (15%) | SP1, SP4, SP6, SP8, SP23, SP27, SP31, SP46, SP59, SP64 |
| Void FM | 7 (11%) | SP3, SP12, SP23, SP30, SP31, SP46, SP59 |
| Synthesizing feature models | 7 (11%) | SP15, SP18, SP44, SP45, SP49, SP54, SP60 |
| Valid product | 6 (9%) | SP3, SP25, SP28, SP30, SP31, SP59 |
| Core Features | 6 (9%) | SP6, SP29, SP30, SP46, SP59, SP64 |
| Feature model relations | 6 (9%) | SP12, SP13, SP29, SP59, SP61, SP62 |
| All products | 5 (8%) | SP3, SP23, SP30, SP59, SP64 |
| SPL testing | 5 (8%) | SP5, SP20, SP24, SP26, SP32 |
| Optimization | 5 (8%) | SP30, SP50, SP55, SP57, SP66 |
| Number of products | 4 (6%) | SP3, SP12, SP30, SP59 |
| Commonality | 4 (6%) | SP3, SP27, SP59, SP64 |
| Model checking | 4 (6%) | SP19, SP41, SP65, SP70 |
| Variability factor | 4 (6%) | SP3, SP40, SP59, SP64 |
| Filter | 4 (6%) | SP52, SP53, SP59, SP64 |
| Dependency analysis | 3 (5%) | SP23, SP43, SP56 |
| Variant features | 3 (5%) | SP29, SP30, SP59 |
| Explanations | 2 (3%) | SP8, SP71 |
| Multi-step configuration | 2 (3%) | SP38, SP64 |
| Atomic set | 2 (3%) | SP46, SP59 |
| Change impact analysis | 2 (3%) | SP29, SP47 |
| Other | 14 (21%) | SP7, SP9, SP11, SP13, SP27, SP29, SP33, SP39, SP40, SP45, SP46, SP58, SP59, SP69 |
| UTD | 8 (12%) | SP2, SP10, SP21, SP35, SP42, SP63, SP68, SP72 |
Publisher’s Note: MDPI stays neutral with regard to jurisdictional claims in published maps and institutional affiliations. |
© 2022 by the authors. Licensee MDPI, Basel, Switzerland. This article is an open access article distributed under the terms and conditions of the Creative Commons Attribution (CC BY) license (https://creativecommons.org/licenses/by/4.0/).
Share and Cite
Sepúlveda, S.; Cravero, A. Reasoning Algorithms on Feature Modeling—A Systematic Mapping Study. Appl. Sci. 2022, 12, 5563. https://doi.org/10.3390/app12115563
Sepúlveda S, Cravero A. Reasoning Algorithms on Feature Modeling—A Systematic Mapping Study. Applied Sciences. 2022; 12(11):5563. https://doi.org/10.3390/app12115563
Chicago/Turabian StyleSepúlveda, Samuel, and Ania Cravero. 2022. "Reasoning Algorithms on Feature Modeling—A Systematic Mapping Study" Applied Sciences 12, no. 11: 5563. https://doi.org/10.3390/app12115563
APA StyleSepúlveda, S., & Cravero, A. (2022). Reasoning Algorithms on Feature Modeling—A Systematic Mapping Study. Applied Sciences, 12(11), 5563. https://doi.org/10.3390/app12115563