
Construction of Safety-Management Platform for Chemical Enterprises Based on the Immune System Model

Abstract
:1. Introduction
2. The Correlation Principle of Accident Risk Immunity in Chemical Enterprises
3. Antigen–Antibody Correspondence Model of Immune System in Chemical Enterprise Production
4. Construction Principle of Immune System Model of Safe Production in Chemical Enterprise
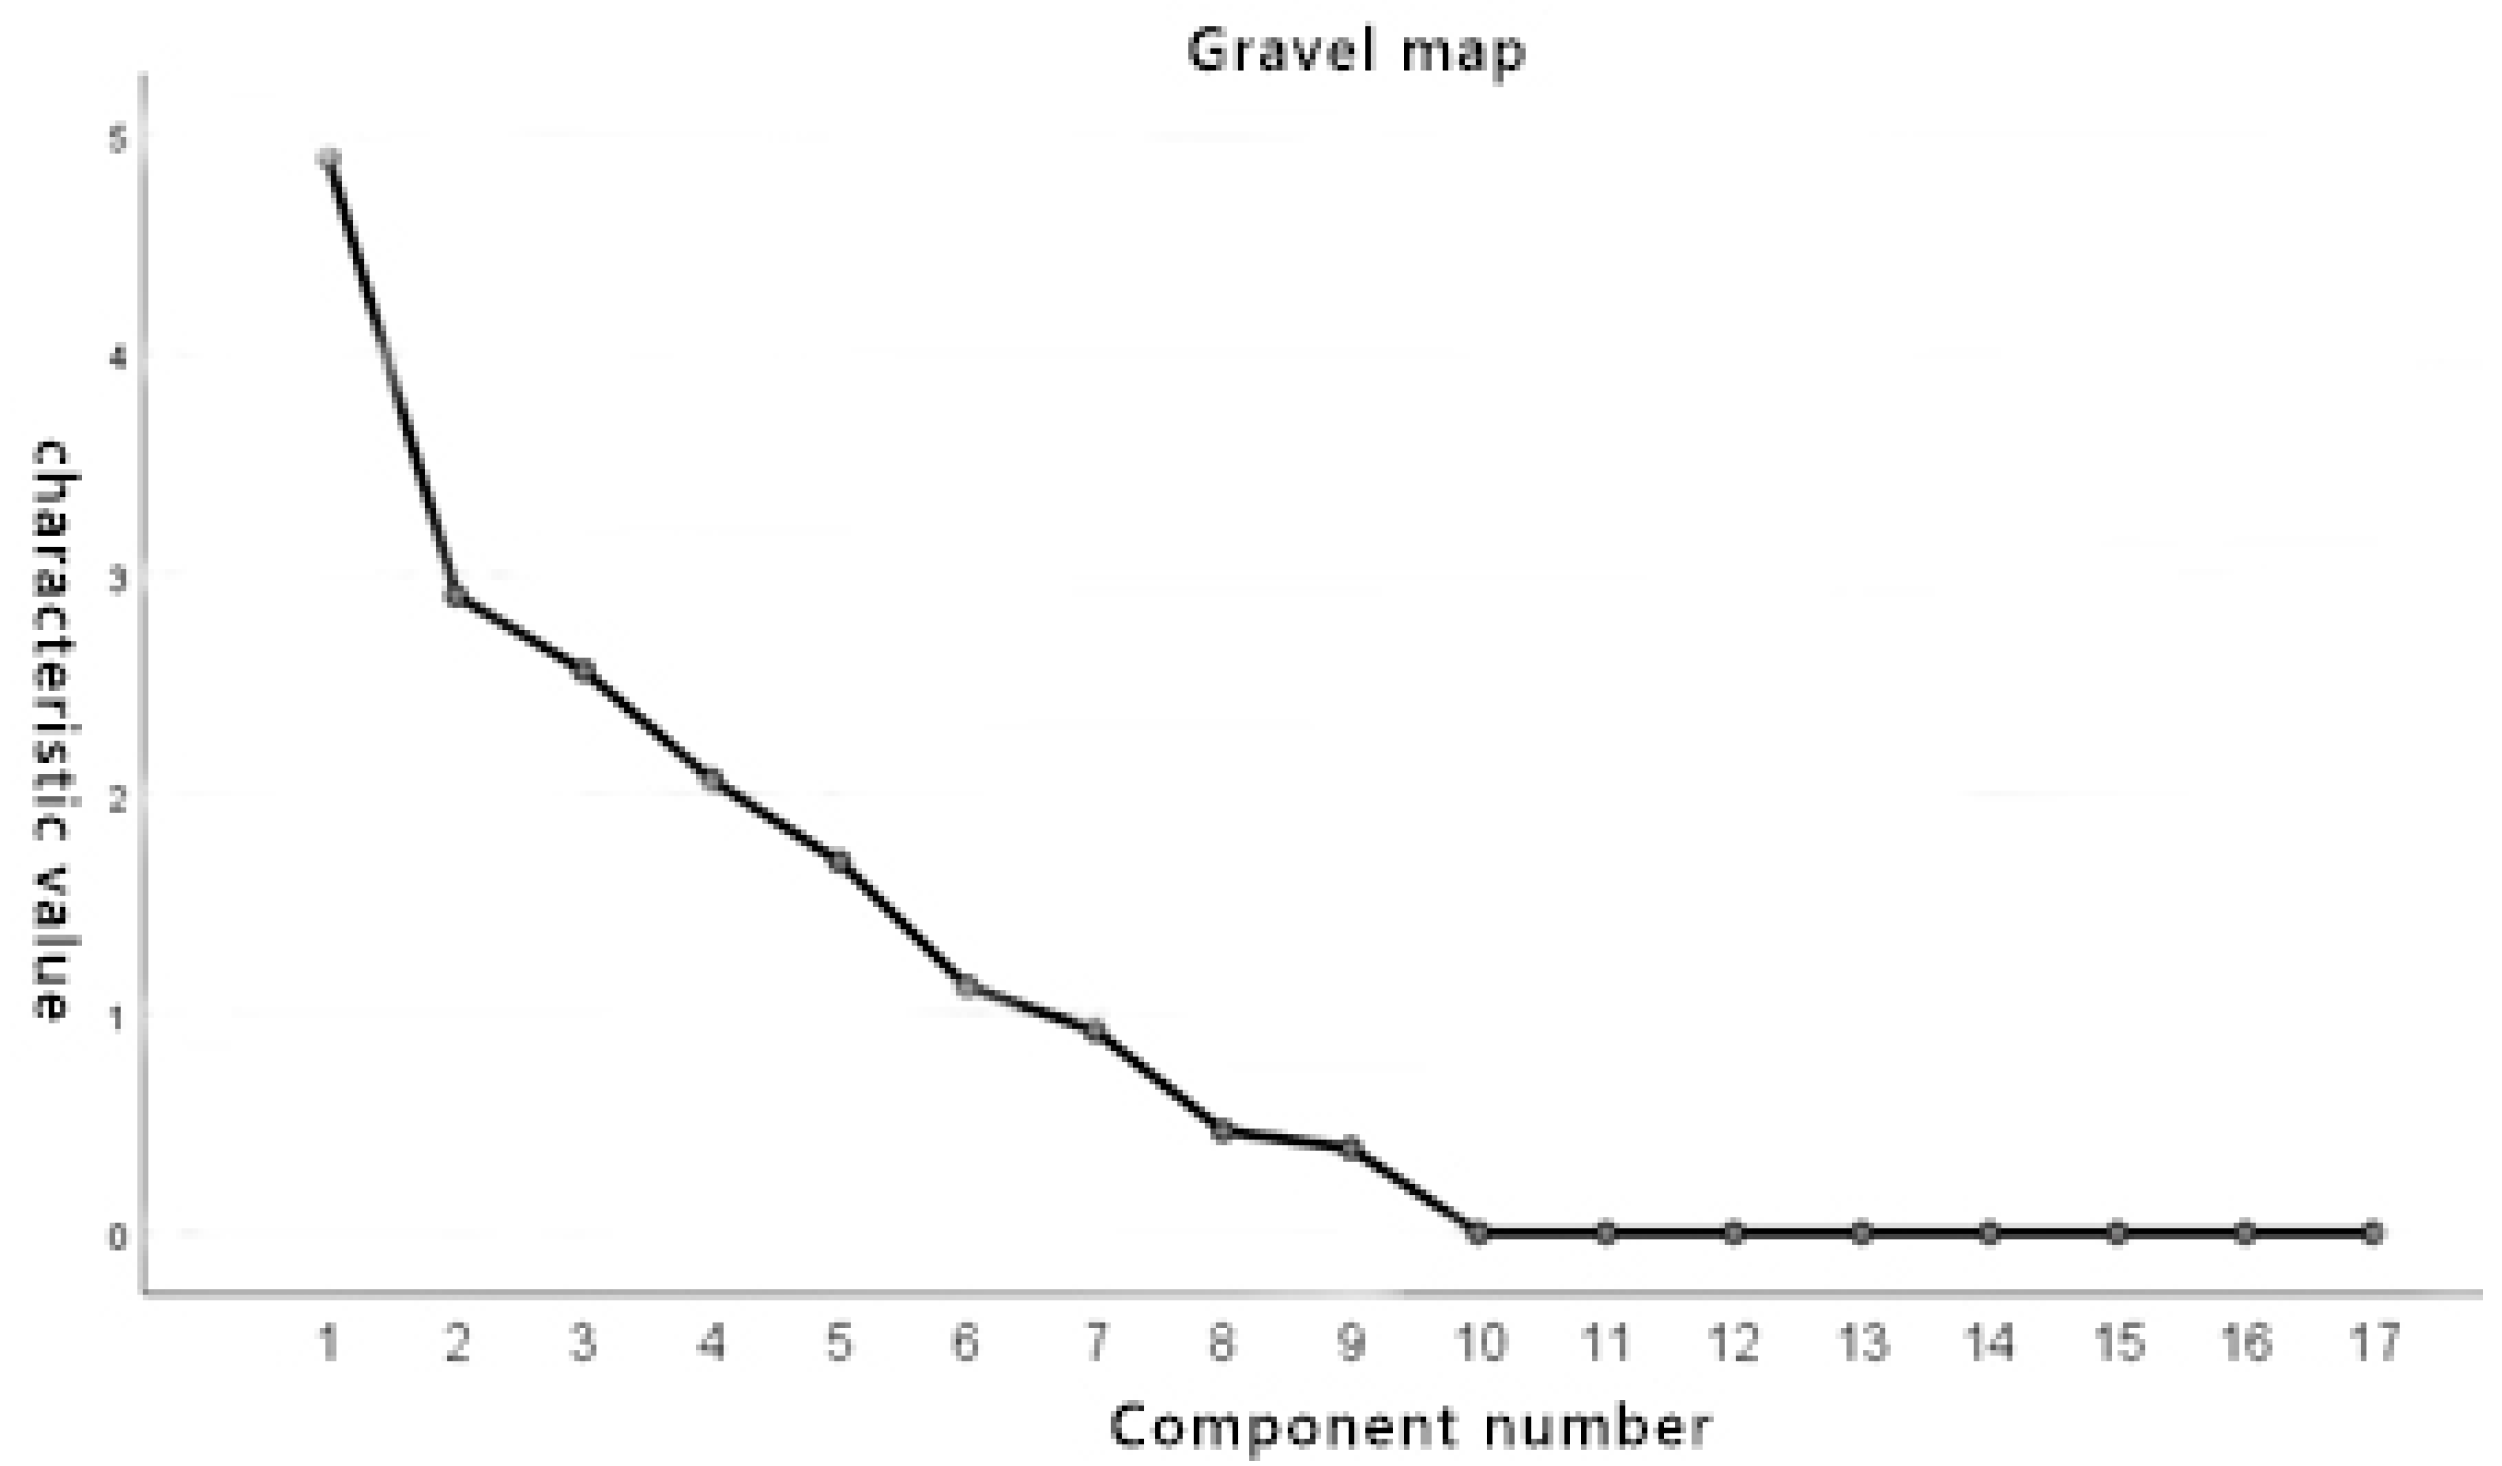
4.1. Determination of Index Weight of Immune Model in Safe Production
4.2. Evaluation Principle of Immune Model in Safe Production
- Calculation of immune indexes’ contributions
- b.
- Layer analysis and evaluation of immune indexes
- c.
- Theory of production safety immune response ability evaluation
5. Construction of Immune System Model for Safe Production in Chemical Enterprises
5.1. Weight Calculation of Safety Production Immune Model Index
- Weight calculation of immune model index
5.2. Construction of Immune Evaluation Model for Safety Production
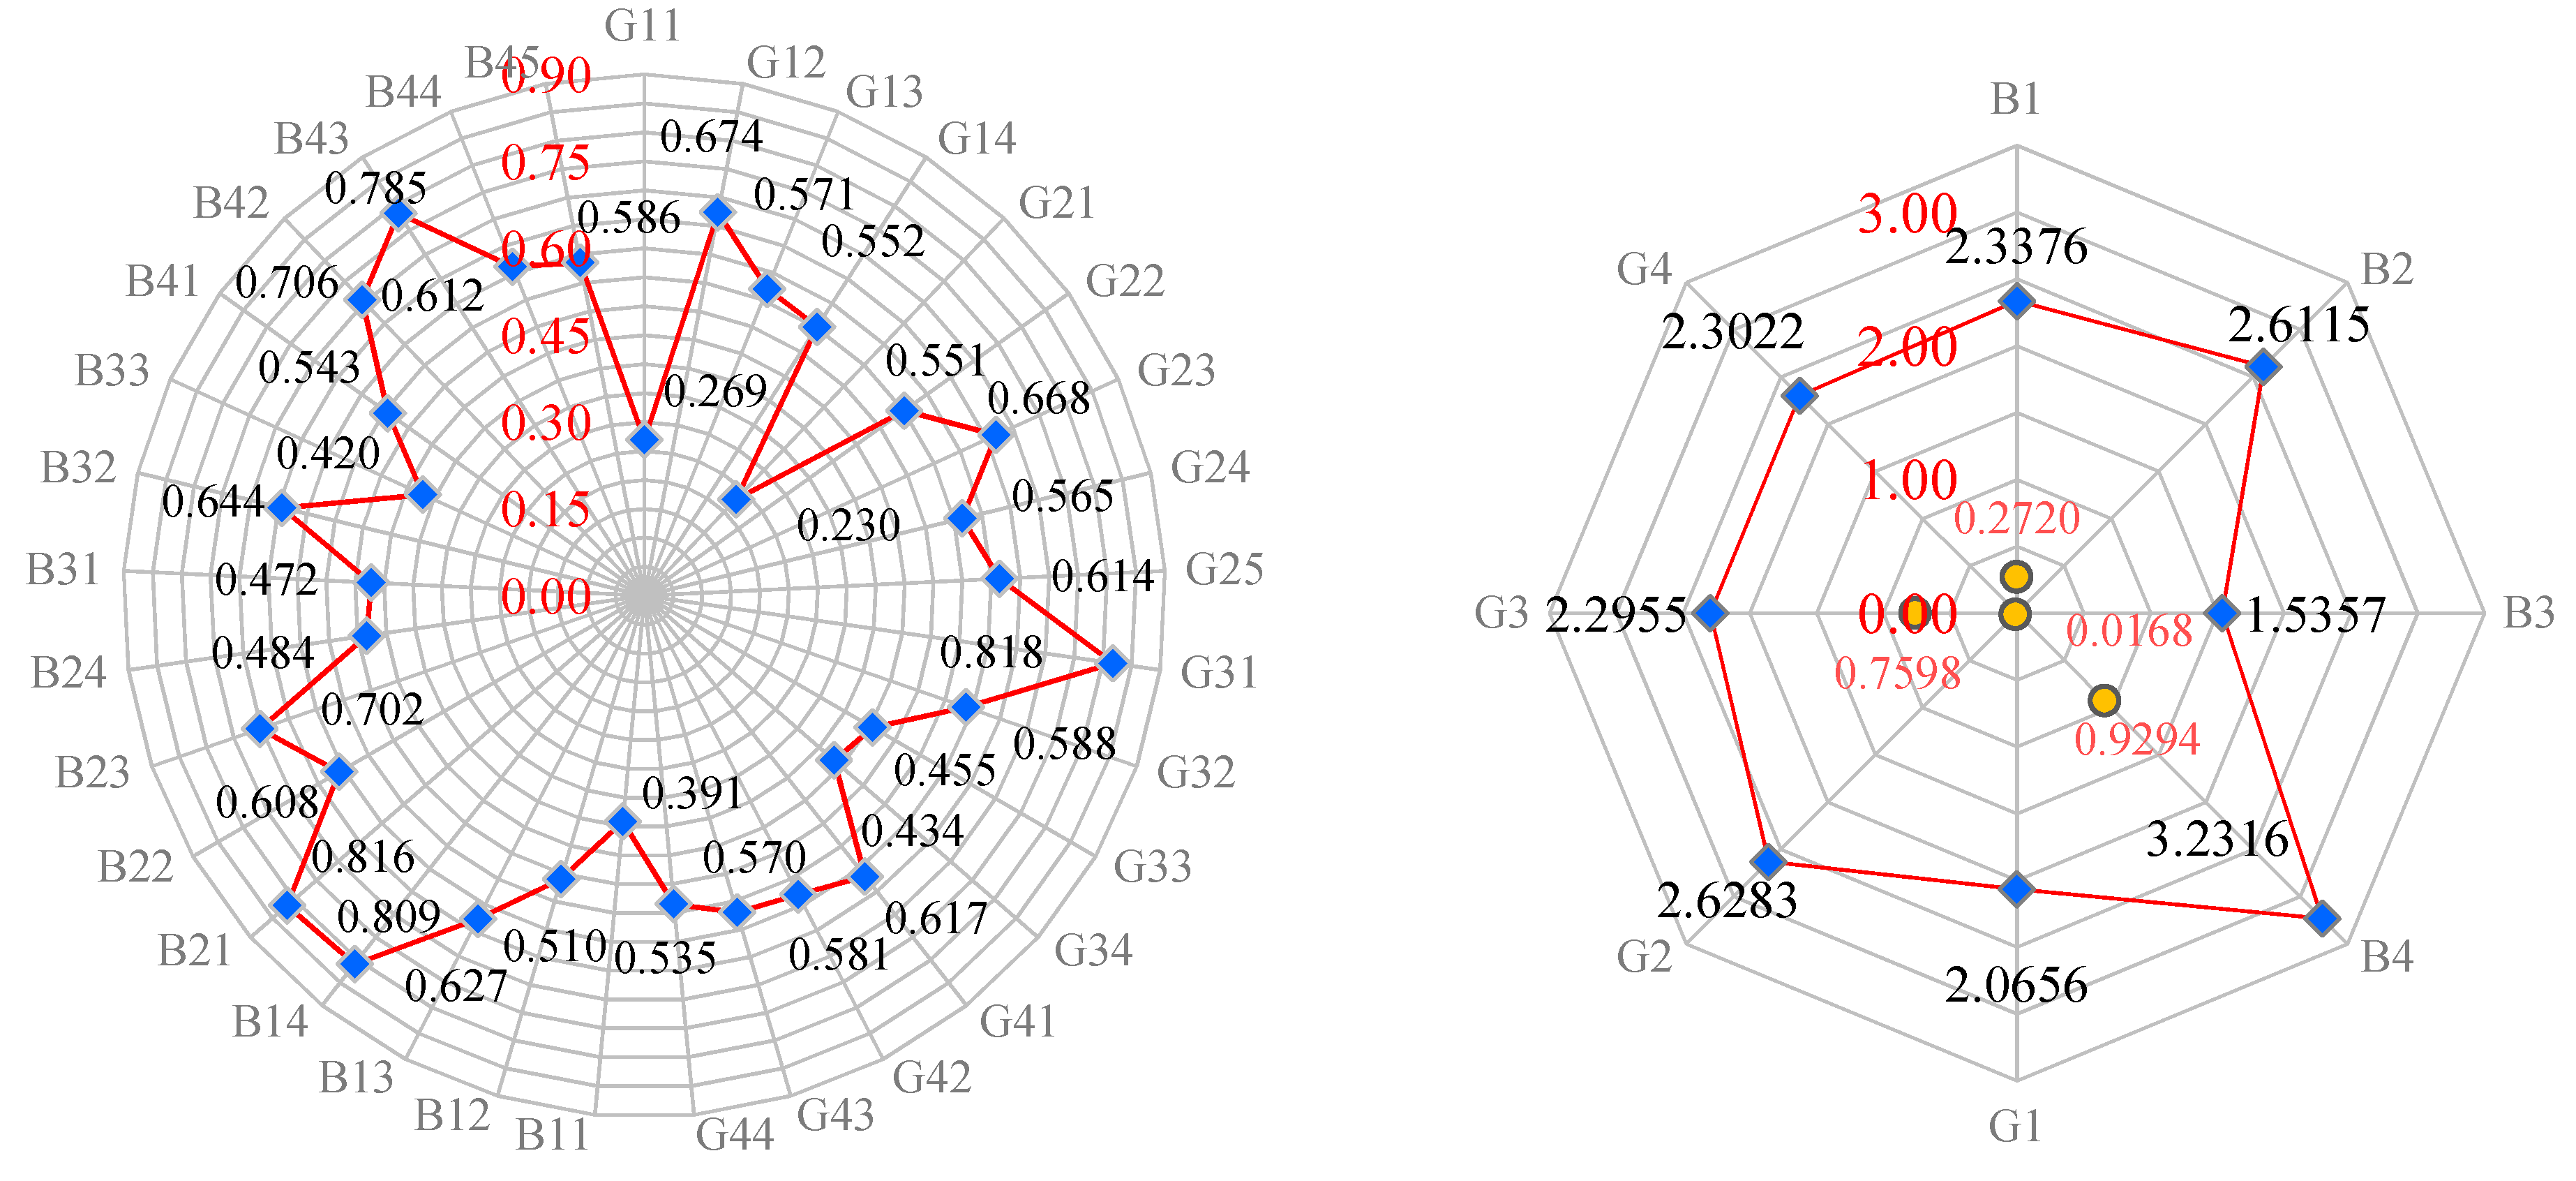
- Contribution of immune indexes
- b.
- Analysis and evaluation of the safety status of immune system model
5.3. Evaluation Model Construction of Immune Response Ability for Safe Production
6. Construction of a Chemical Enterprise Management Platform Based on the Immune Model
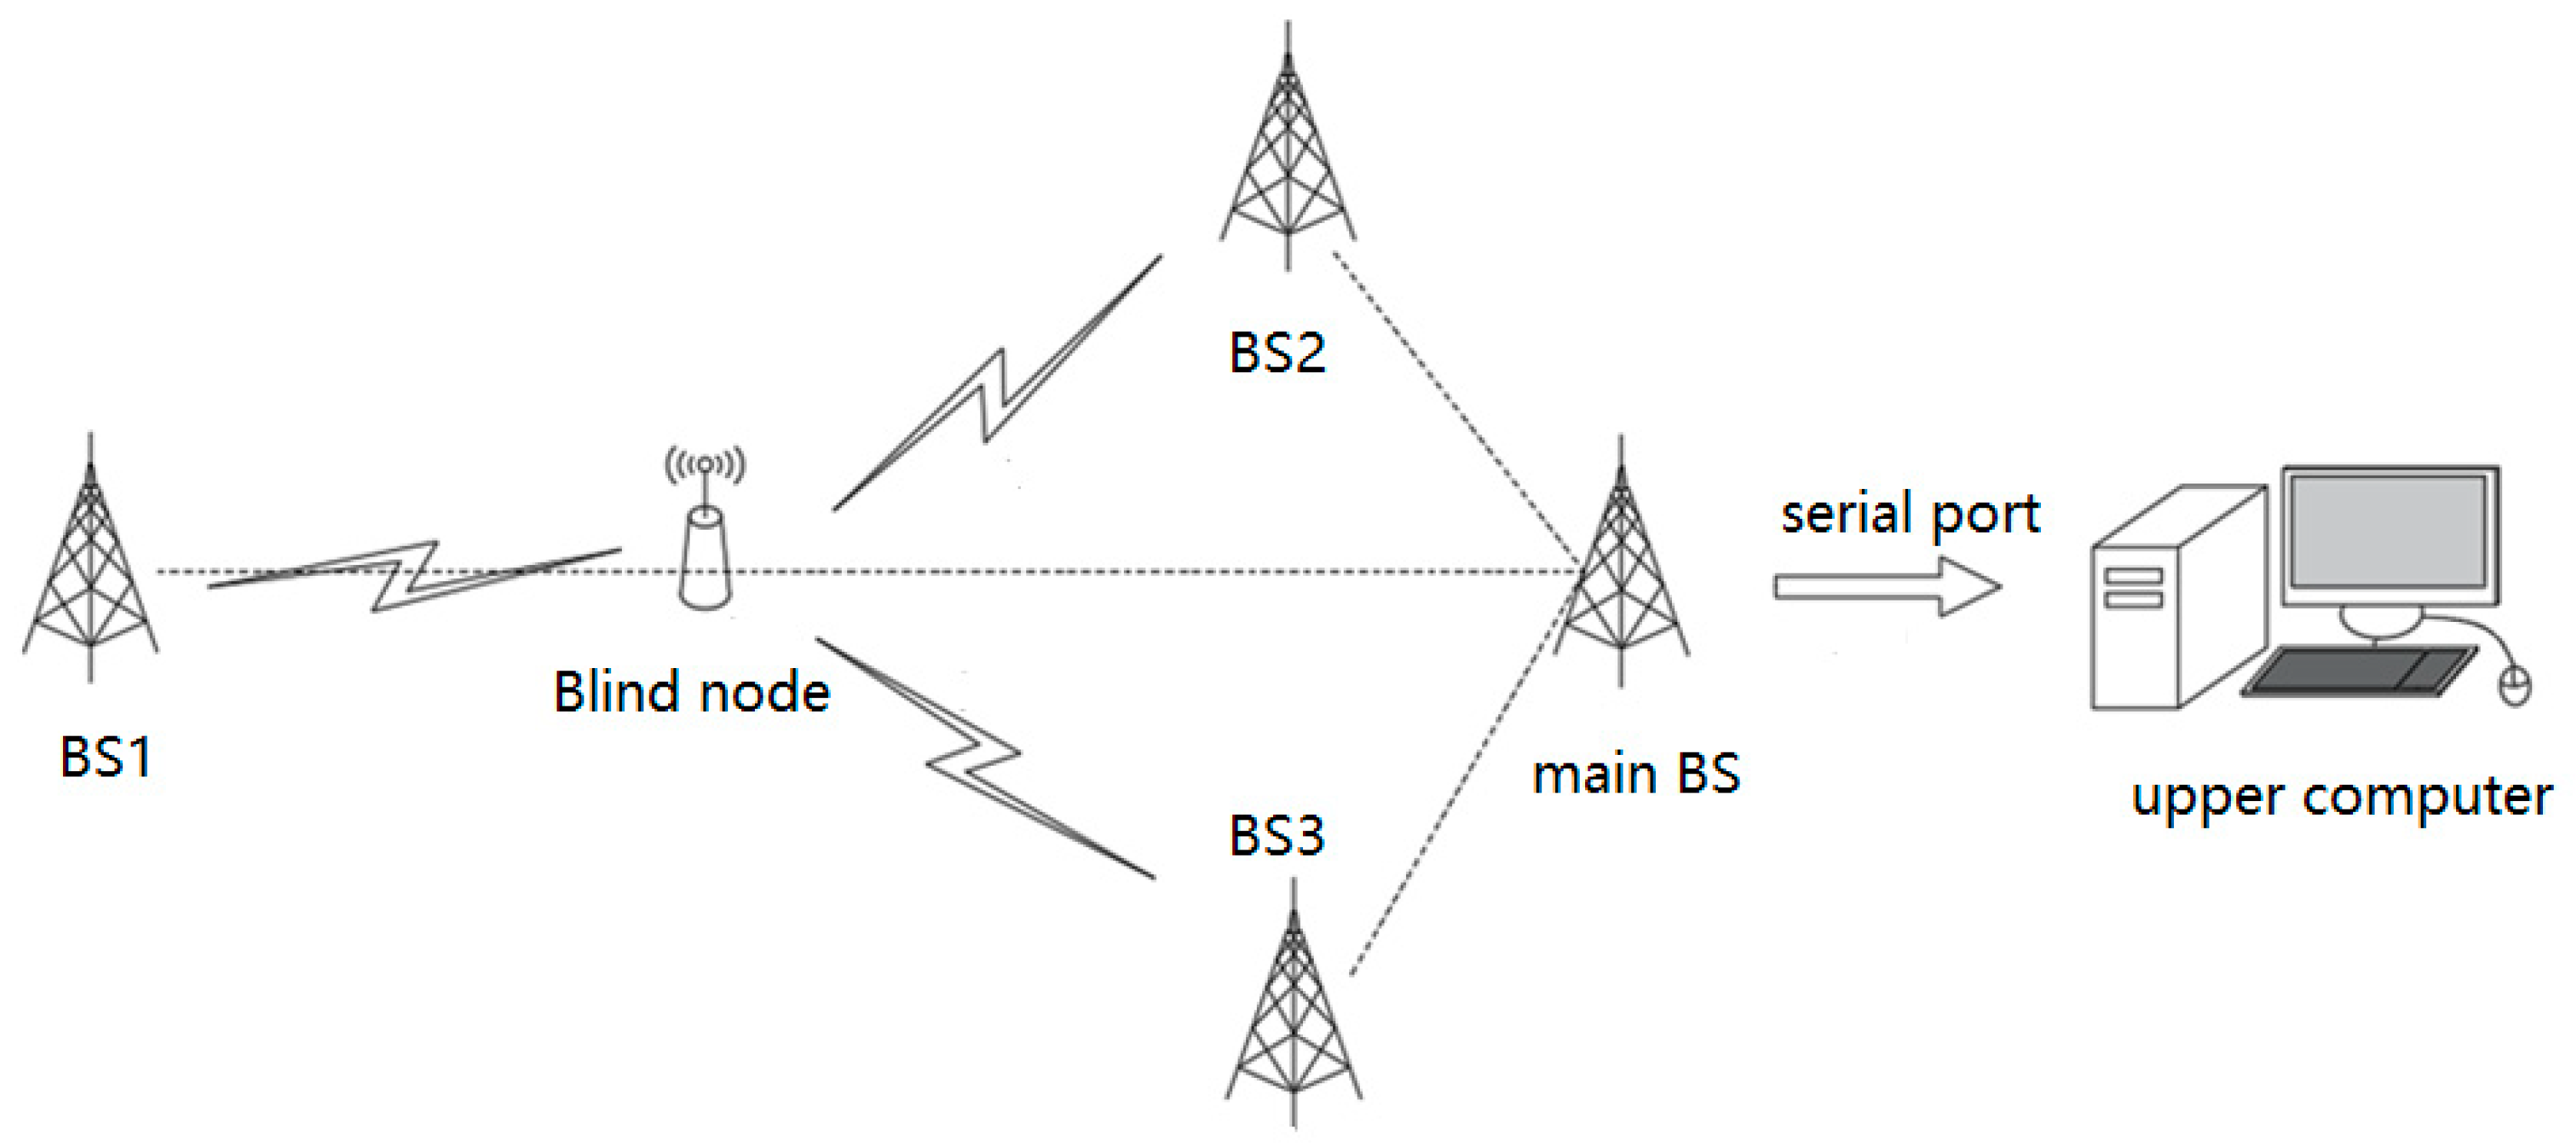
6.1. People-Management Platform Based on Location Service
- Personnel Location System (PLS)
- b.
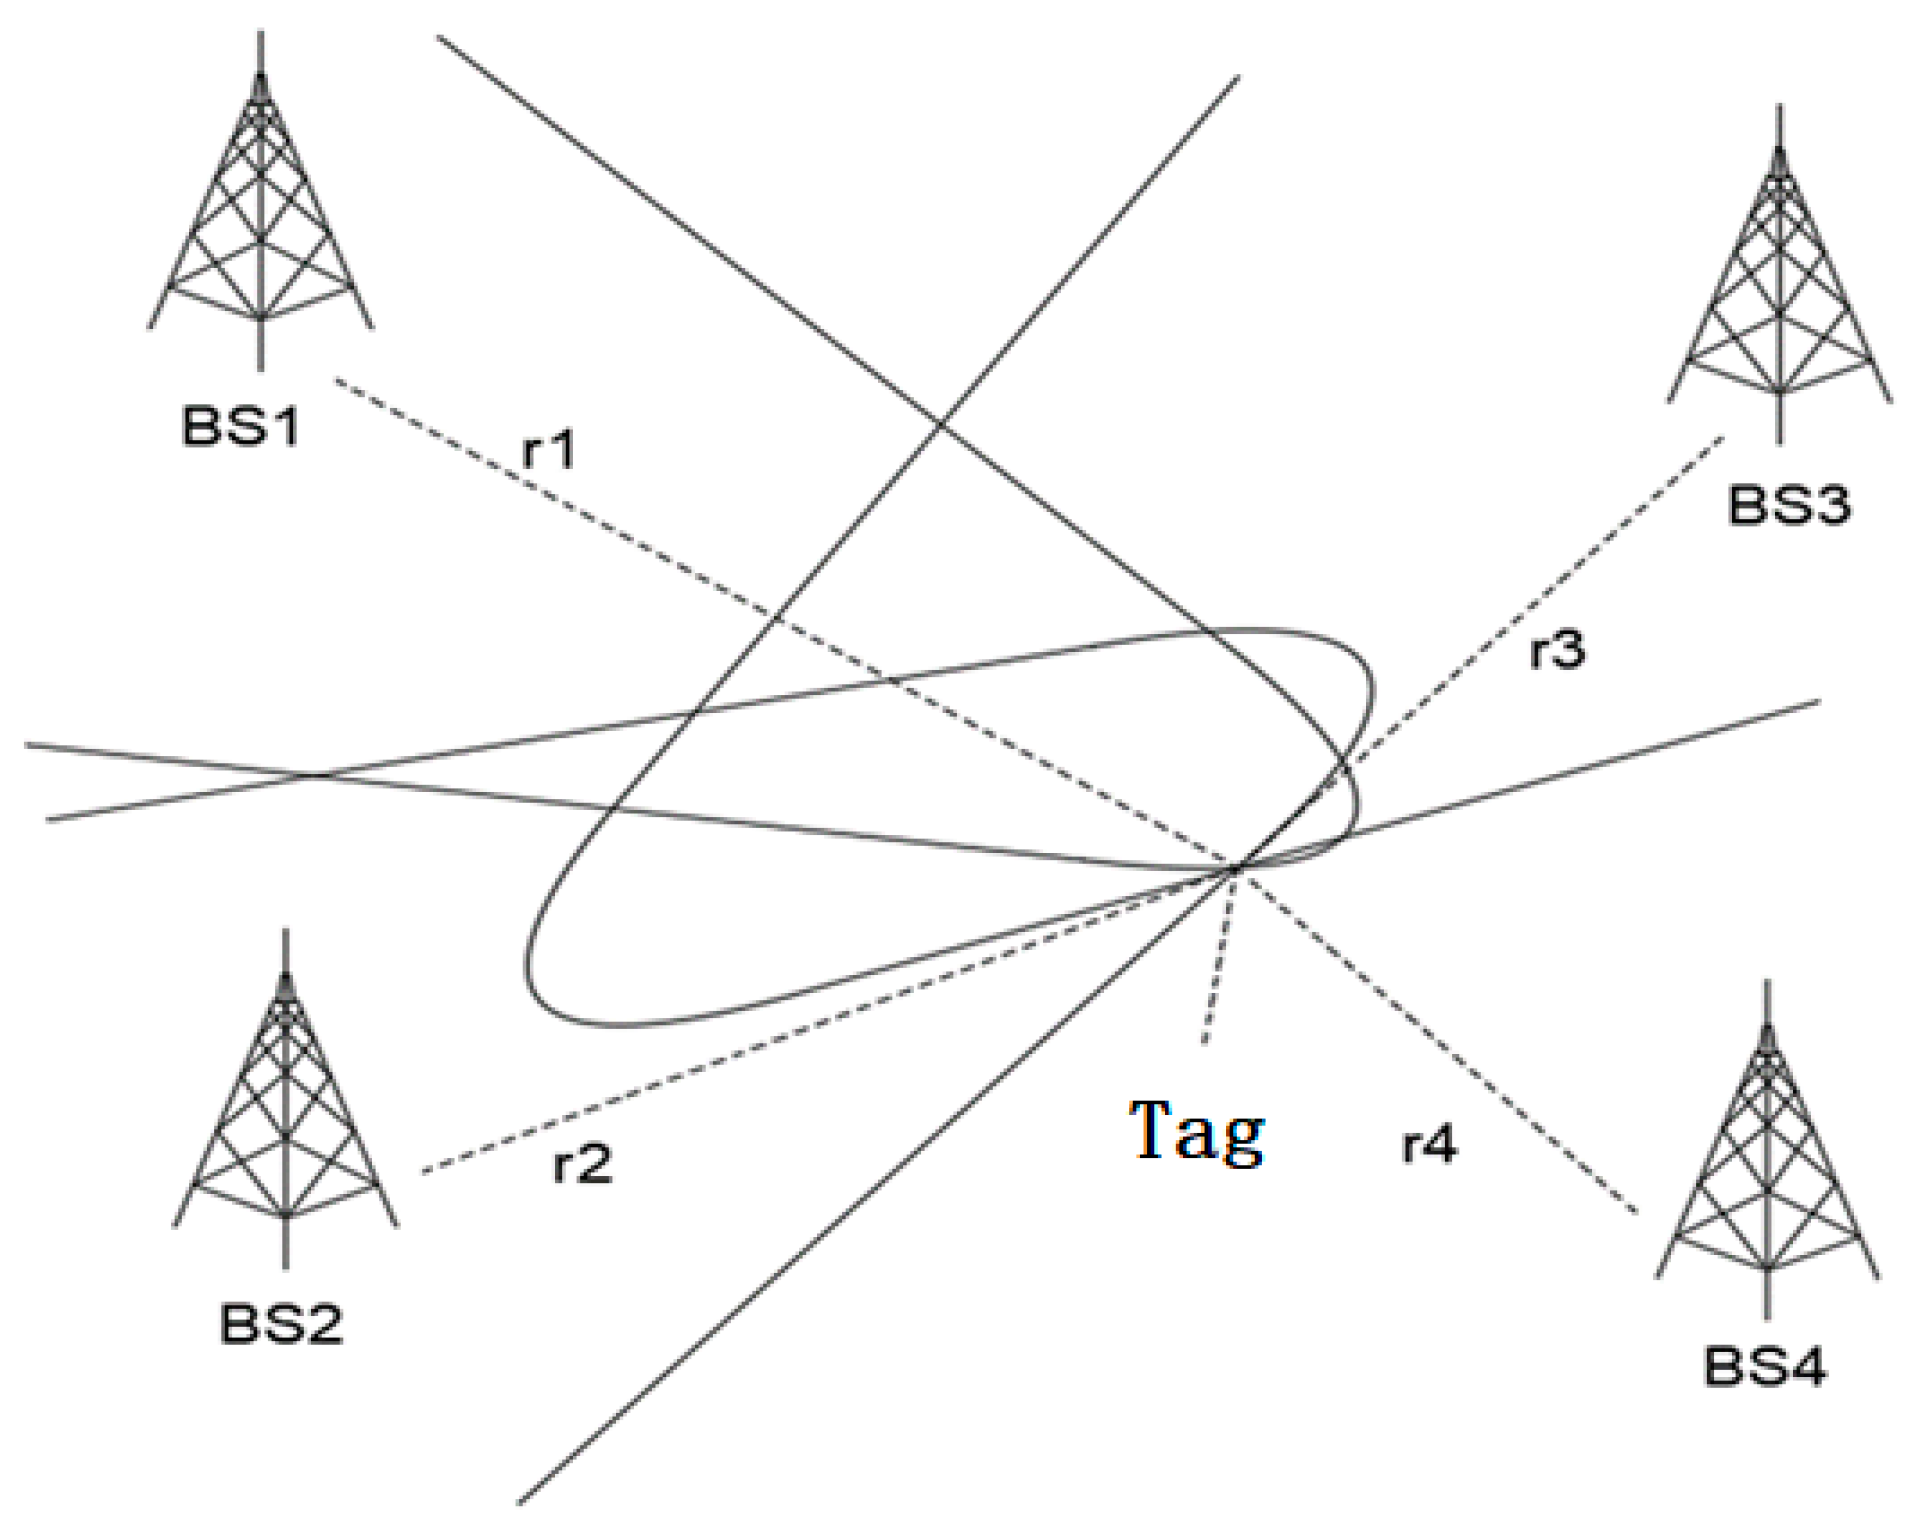
- Location estimation
- c.
- Personnel Management
- (1)
- Personnel information management:
- (2)
- Personnel location tracking in real time:
- (3)
- Historical trace query:
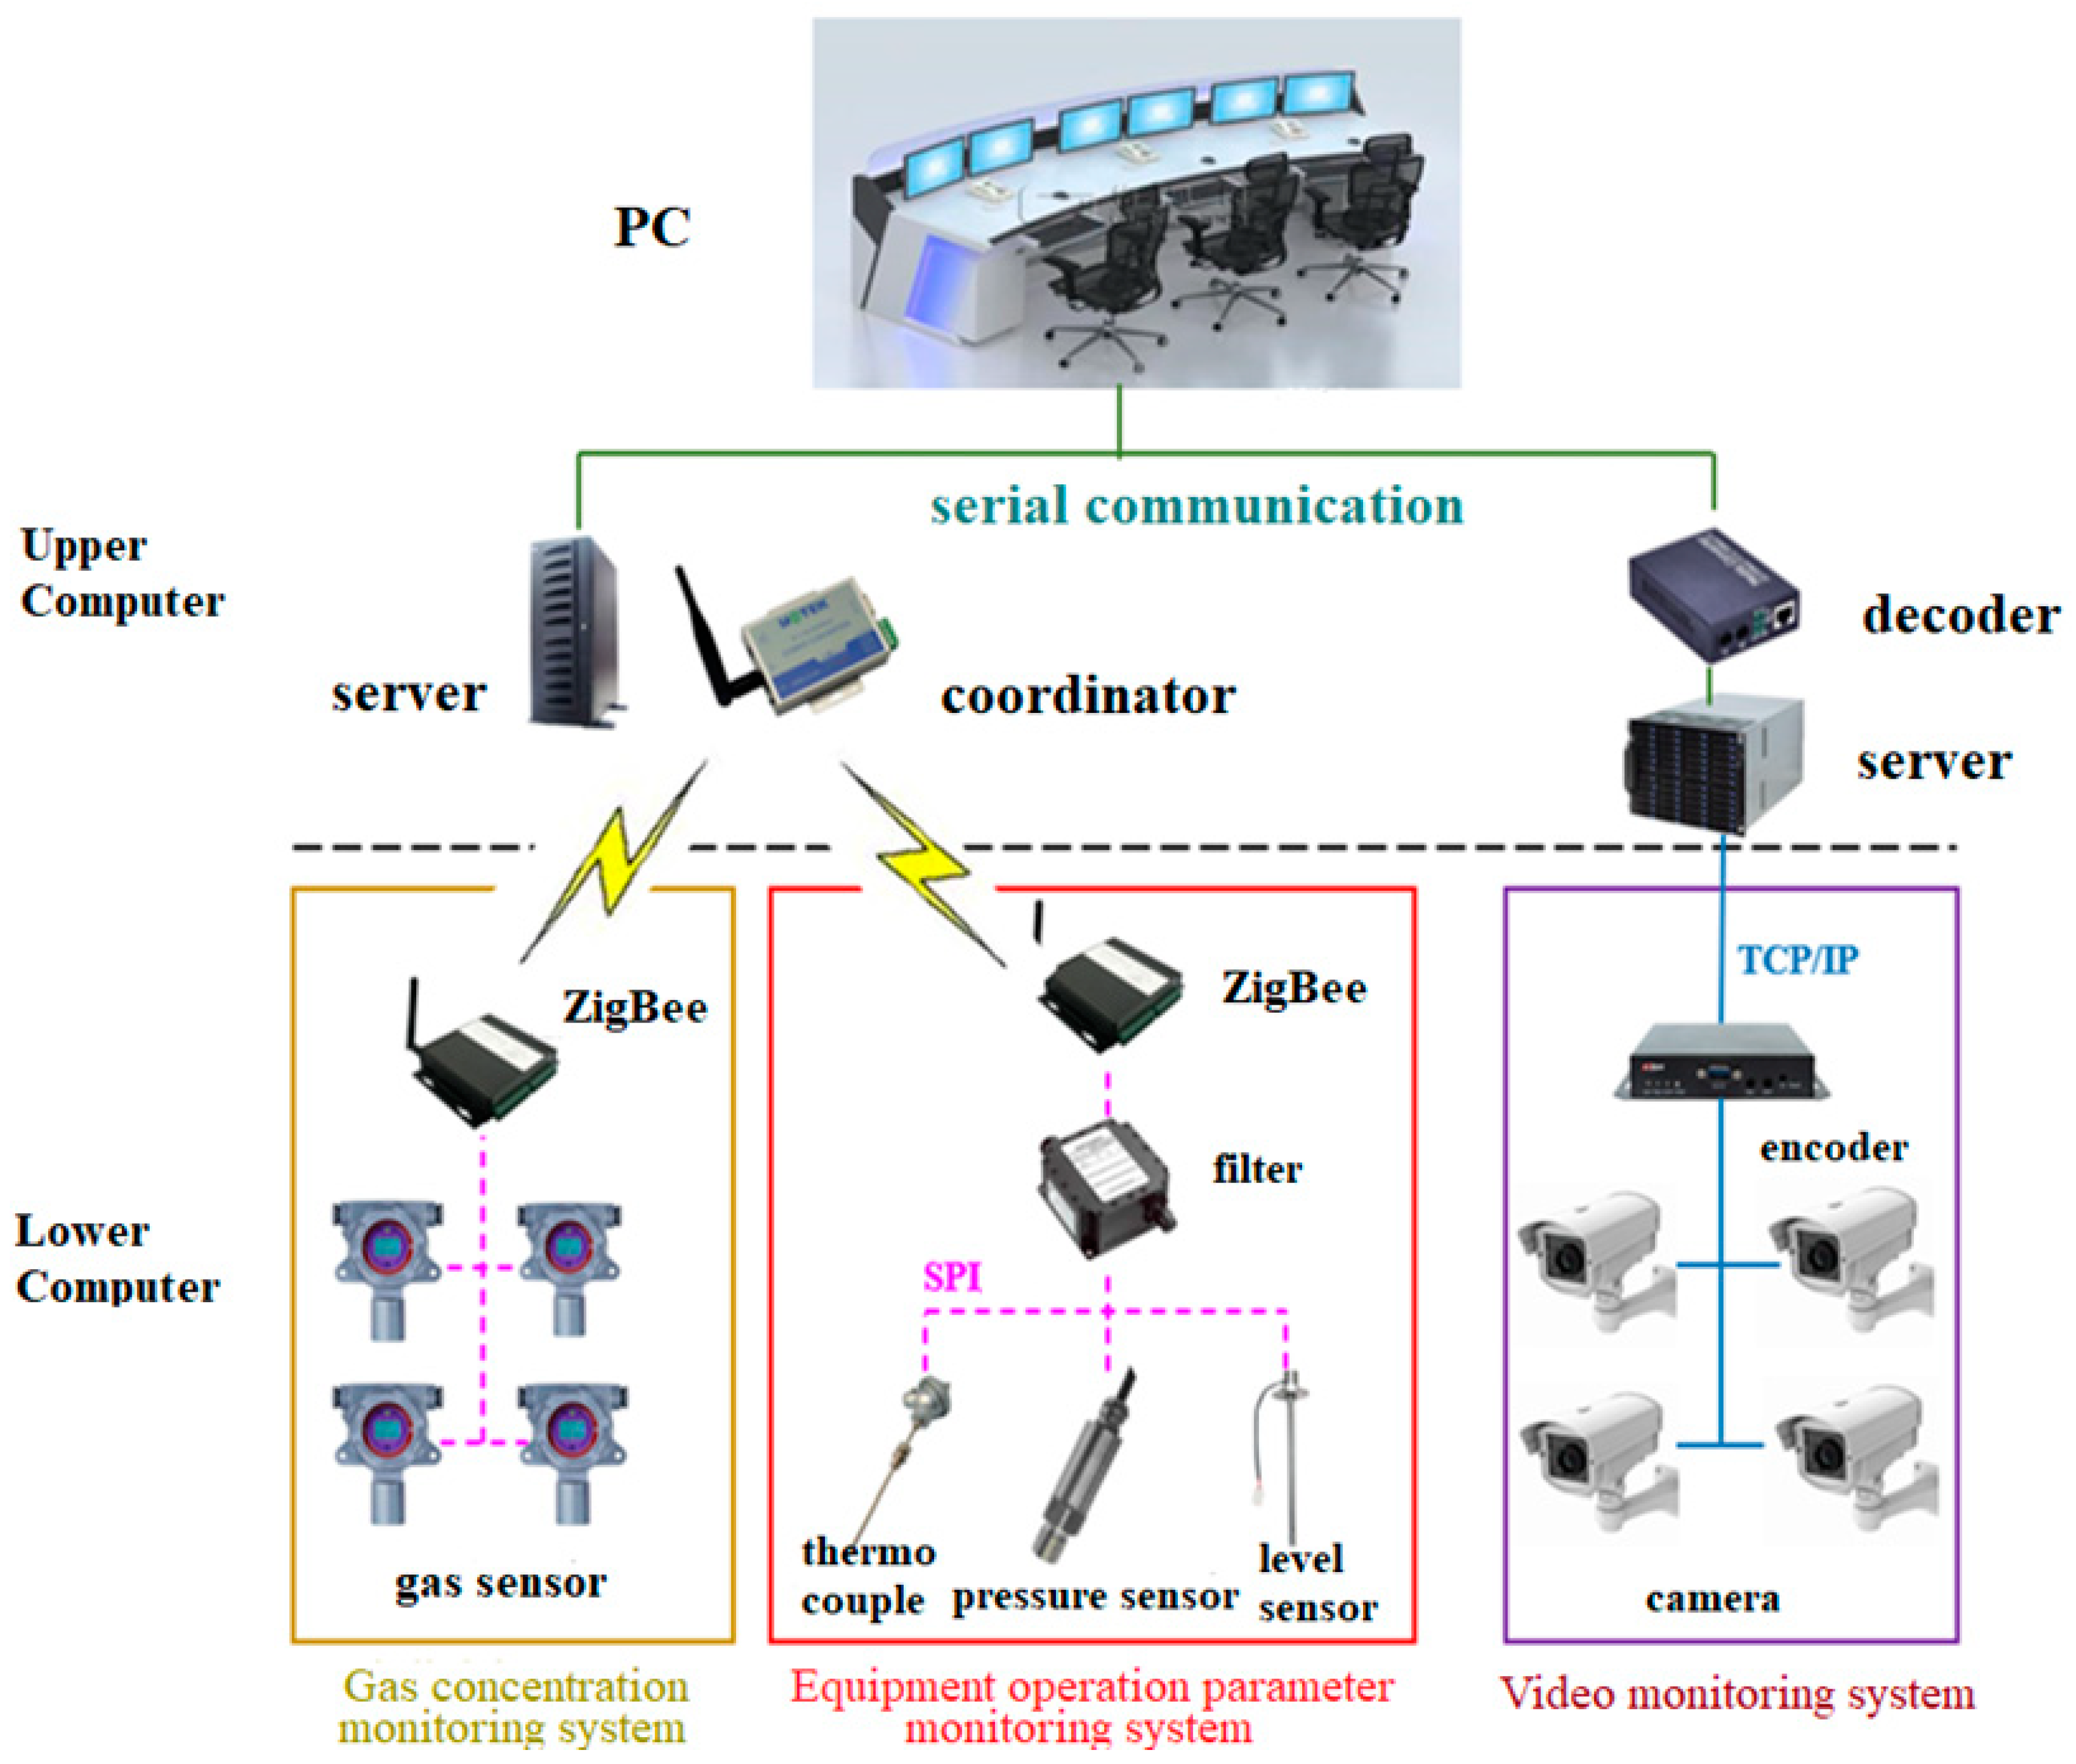
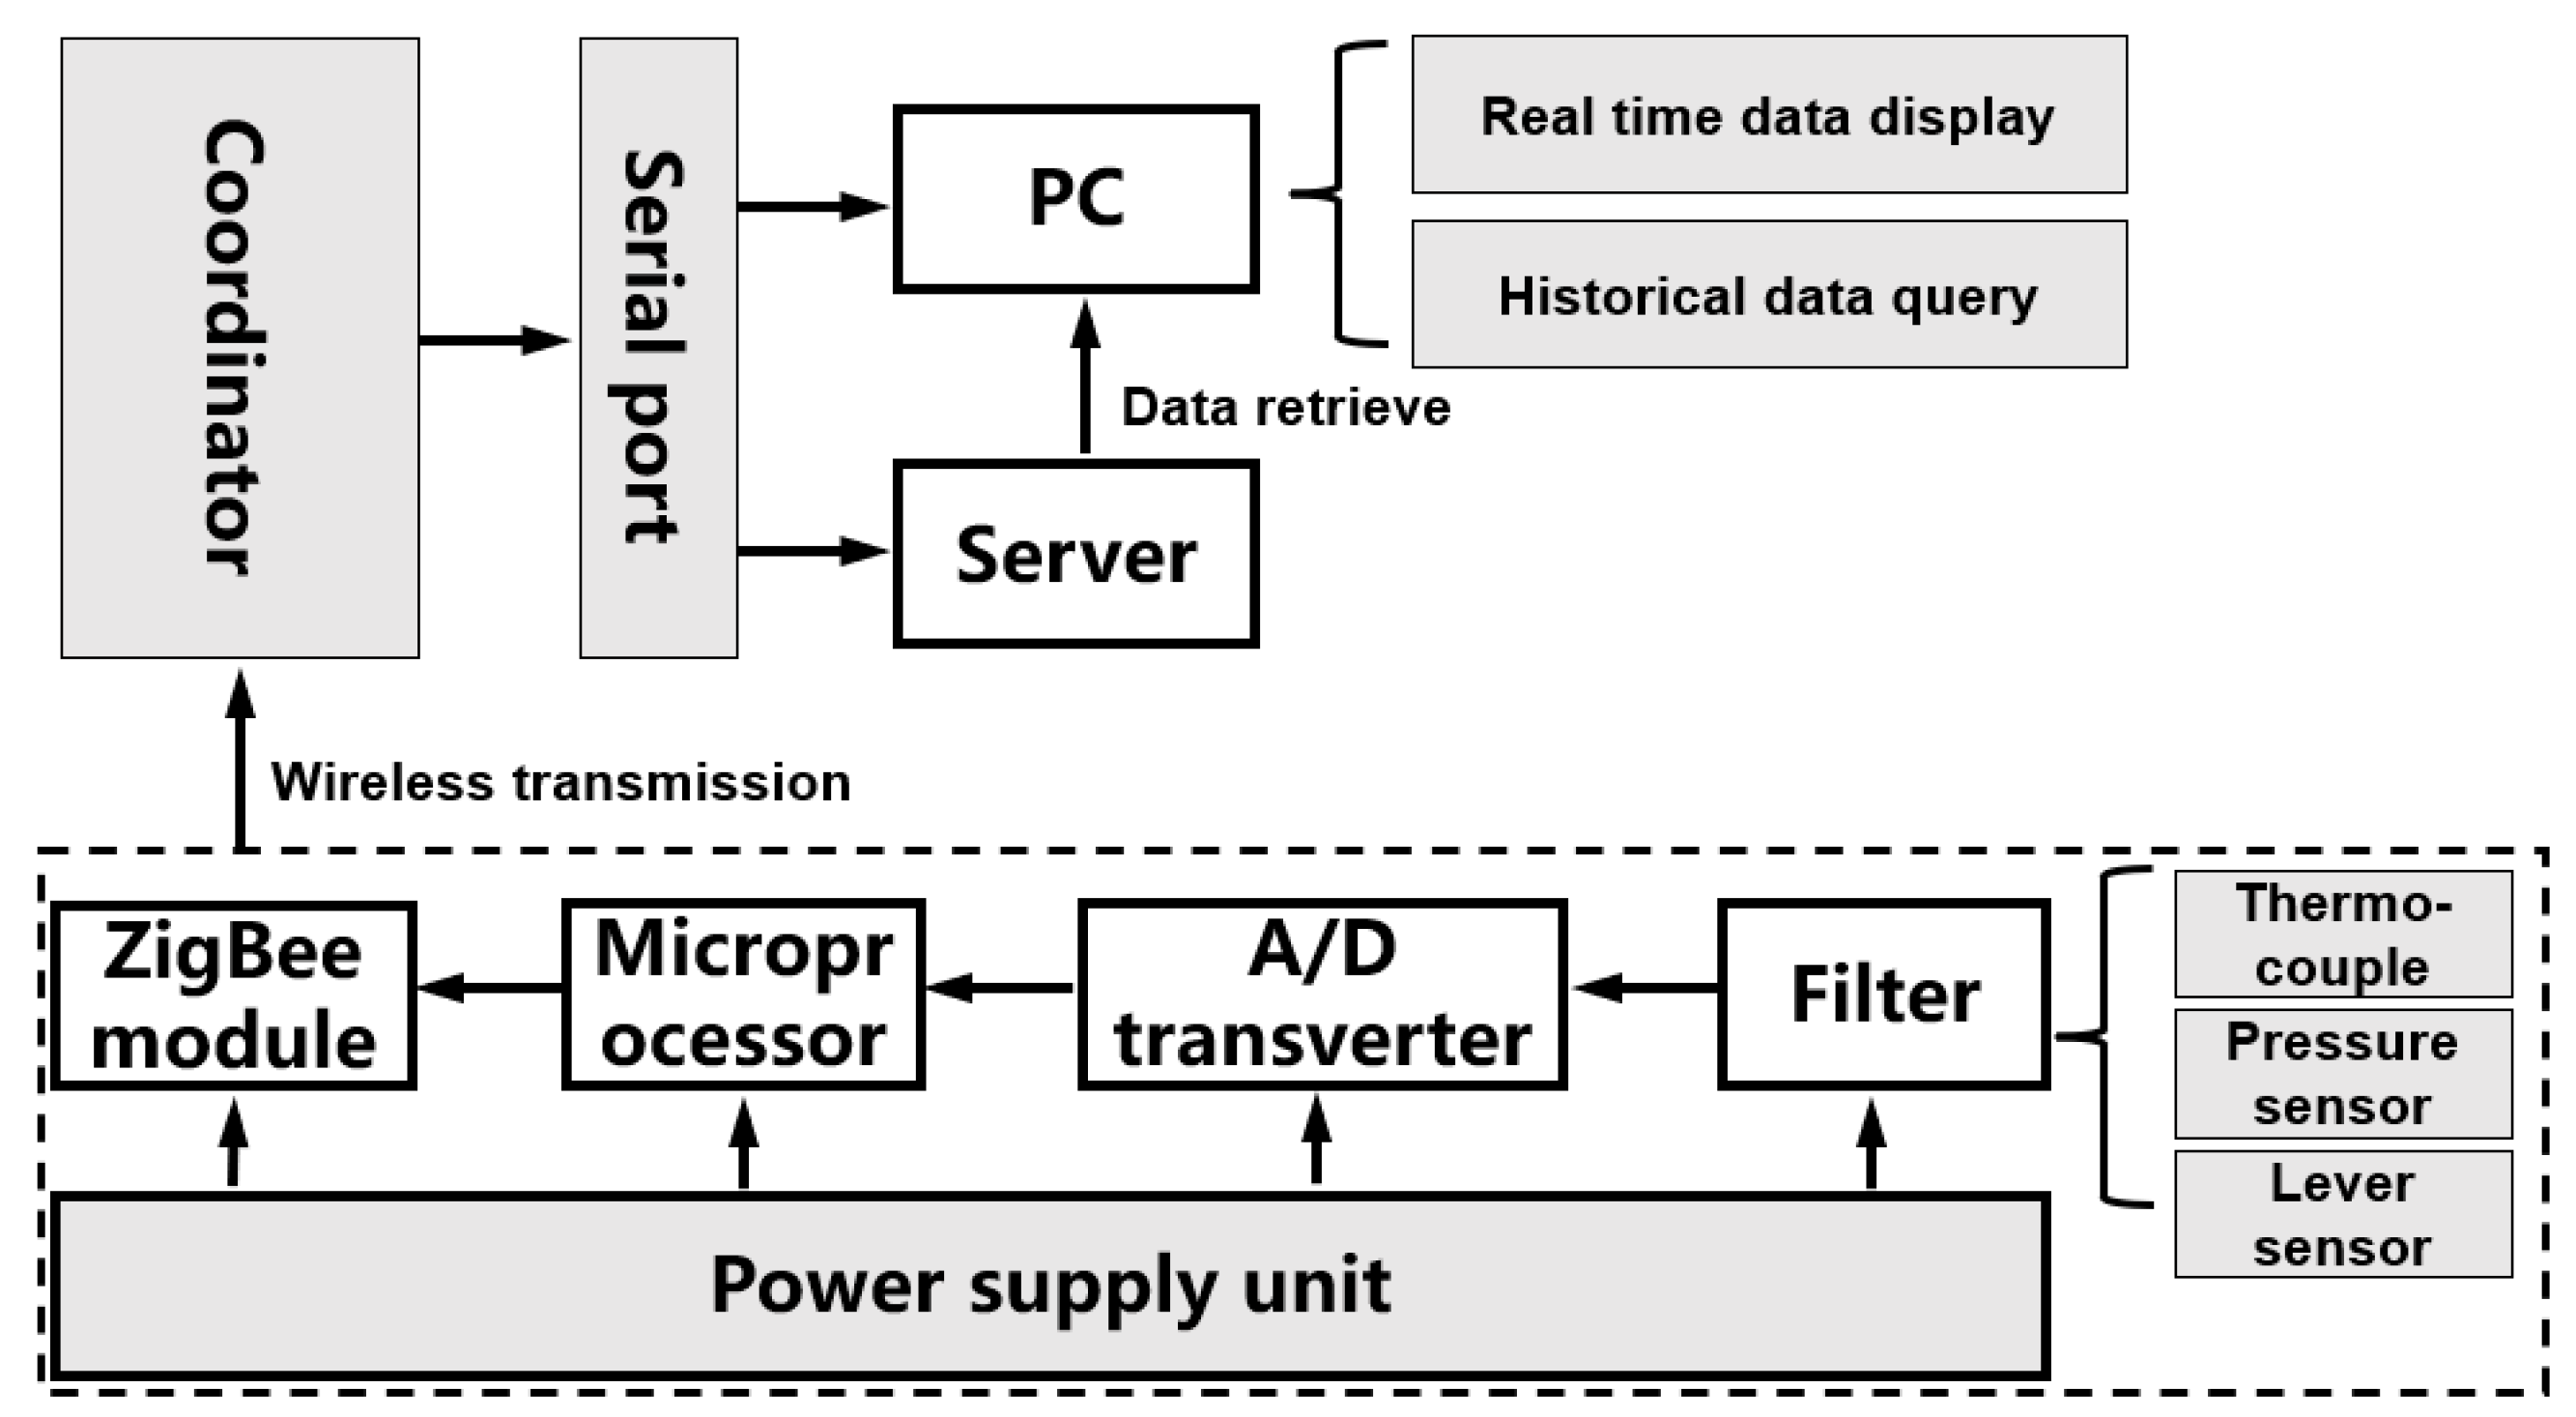
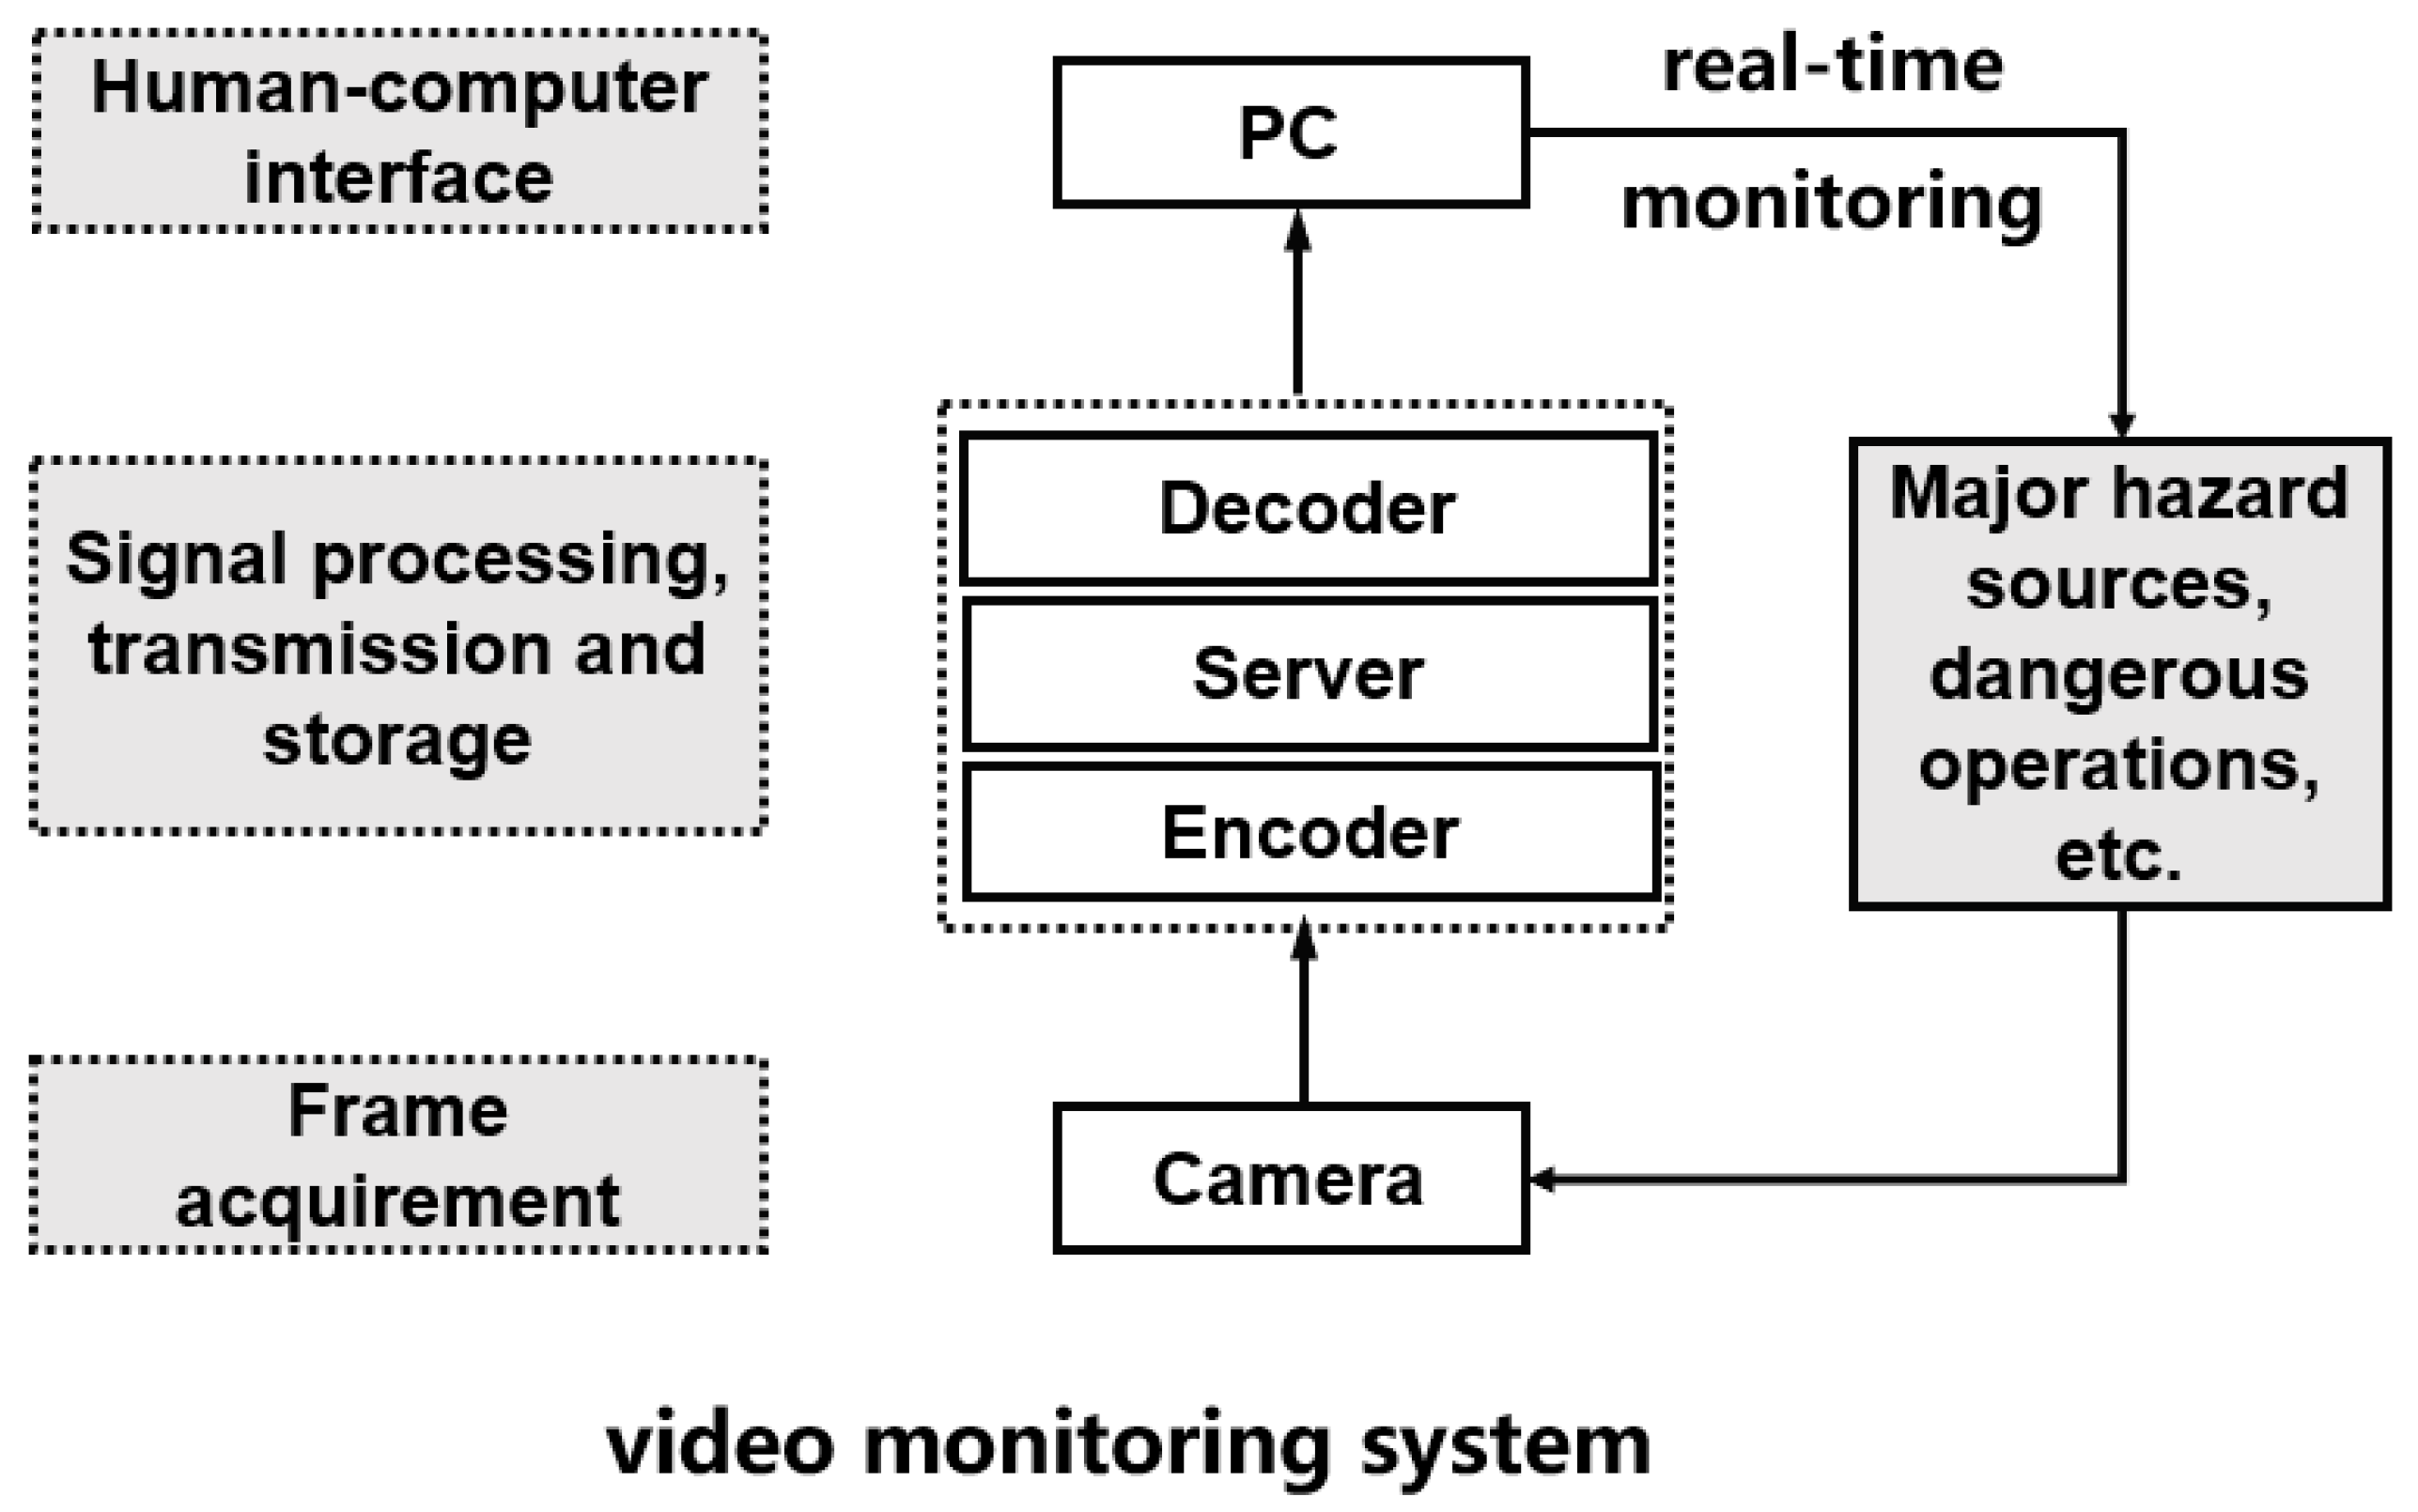
6.2. Visual Monitoring Platform
- Framework design of the platform
- b.
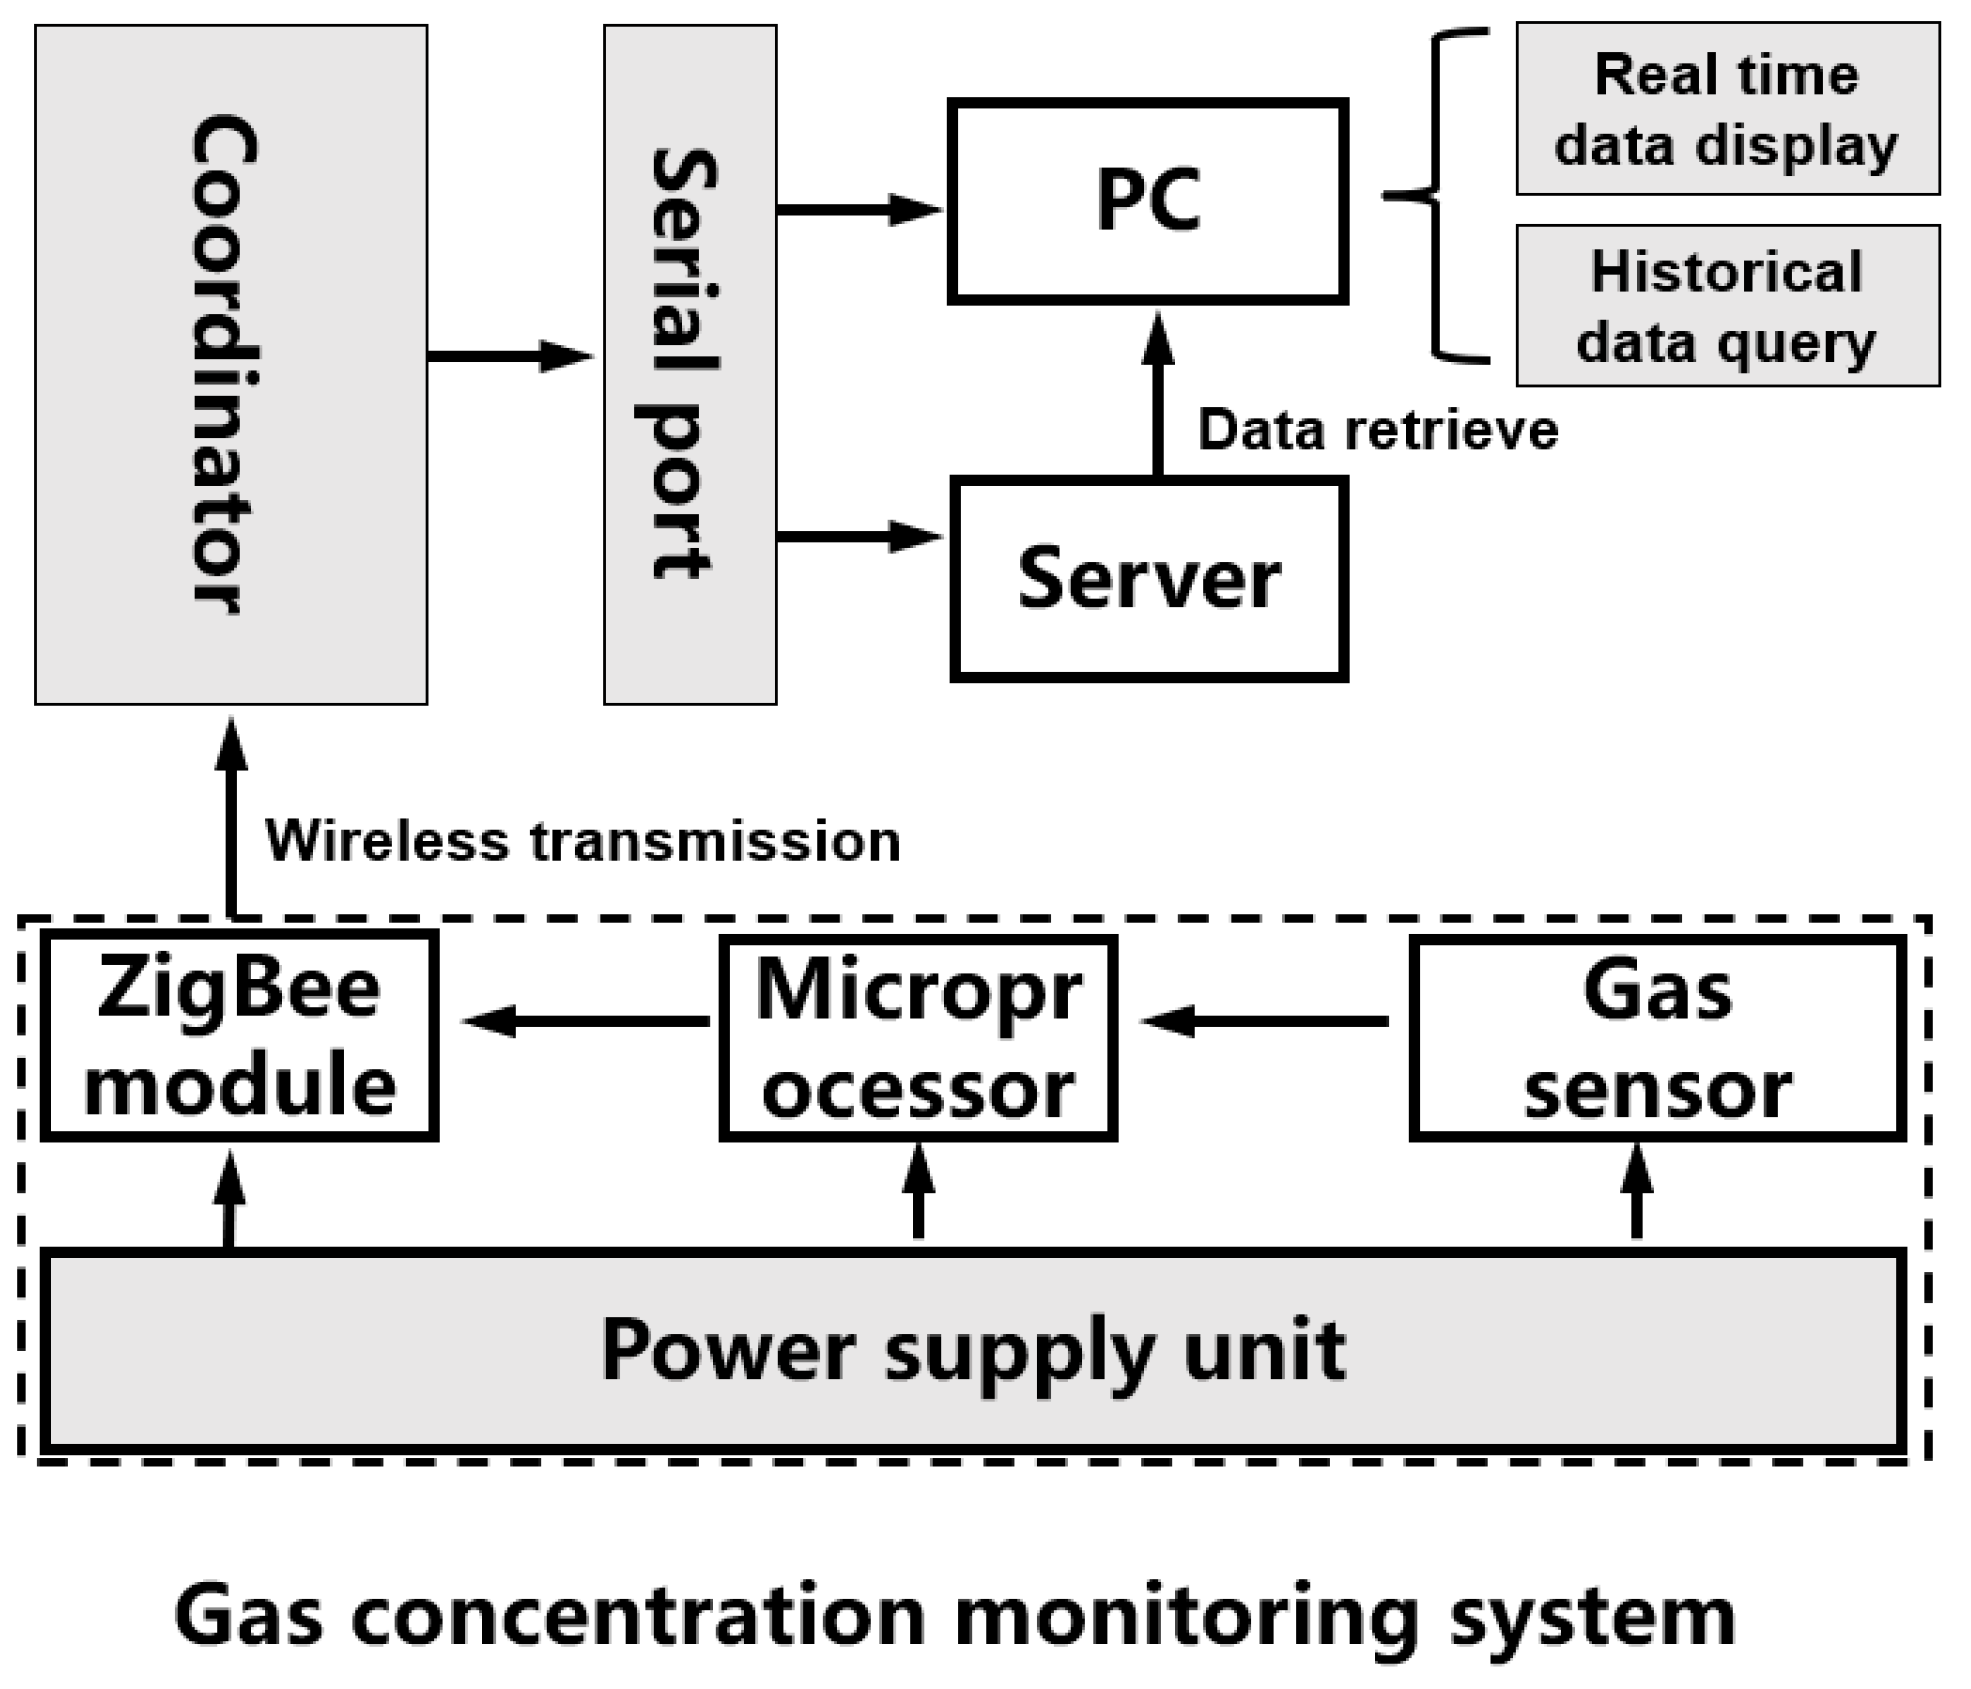
- Gas concentration monitoring system
- c.
- Equipment operation parameter monitoring system
- d.
- Video monitoring system
6.3. Danger Warning Platform
- Location safety warning module
- b.
- Threshold overlimit warning module
7. Conclusions
- (1)
- Based on the biological immune system, this paper deeply integrates the immune mechanism and the production safety management of chemical enterprises to form an accident risk immune correlation principle. According to the actual production situation of chemical enterprises, the evaluation index system of the antigen–antibody model, based on hidden danger and measures in chemical enterprises, has been established, including two systems of antigen G and antibody B with 33 indexes. Antigen G reflects the hidden dangers caused by person, material, environment, and management in the production process of chemical enterprises, while antibody B comprises preventive and control measures for antigen immunity such as education and training, monitoring, and early warning.
- (2)
- Through the analysis of the antigen–antibody model, the existing problems and unknown hidden dangers in the safety management of the enterprises were excavated, and the immune system model of safety production was established. According to the weight of the improved AHP calculation index system and the contribution degree of each index calculated by the PCA method, the production safety immune evaluation model was established. The results show that the immune maturity of the safe production in chemical enterprises is 0.6114, higher than the accident risk maturity of 0.5653, and the influence ranking of antigen factor G is as follows: G2 > G3 > G4 > G1. The contribution of antibody factor B ranked as B4 > B2 > B1> B3, indicating a clear approach to accident prevention.
- (3)
- The evaluation model of immune response ability has been designed based on grey system theory to evaluate the effect of the antigen–antibody model of production safety in chemical enterprises. It reveals that production safety has a good immune response ability, but people’s unsafe behaviors in the element layer are weak. In its subordinate index layer, only the immune response ability of behavior safety observation/B12 is at a poor layer with the value of 3.14. An evaluation model of immune response ability can effectively distinguish and modify the immune deficiency and vulnerability items of the system, guiding the construction of the informatization management platform for chemical enterprise safety production.
- (4)
- Targeting the three categories with the lowest evaluation scores in the index layer, combined with the characteristics of chemical production, the personnel-management platform, the visual monitoring platform, and the danger warning platform—based on personnel positioning technology, sensor monitoring technology, video monitoring technology, and internet of things technology—are constructed, which effectively improve the “immune ability” of chemical enterprises, and have practical significance in improving risk monitoring and early warnings in the whole chemical industry.
Author Contributions
Funding
Institutional Review Board Statement
Informed Consent Statement
Conflicts of Interest
References
- Li, Y.C.; Liu, Z.H.; Jia, J.Z. Statistic analysis of chemical enterprises accidents occurring in China during 2006~2015. Appl. Chem. Ind. 2017, 46, 1620–1623. [Google Scholar]
- Wang, B.; Wu, C.; Reniers, G.; Huang, L.; Kang, L.; Zhang, L. The future of hazardous chemical safety in China: Opportunities, problems, challenges and tasks. Sci. Total Environ. 2018, 643, 1–11. [Google Scholar] [CrossRef] [PubMed]
- Zhao, Y.; Zhang, M.; Liu, T.; Mebarki, A. Impact of safety attitude, safety knowledge and safety leadership on chemical industry workers’ risk perception based on Structural Equation Modelling and System Dynamics. J. Loss Prev. Process Ind. 2021, 72, 104542. [Google Scholar] [CrossRef]
- Motalifu, M.; Tian, Y.; Liu, Y.; Zhao, D.; Bai, M.; Kan, Y.; Qi, M.; Reniers, G.; Roy, N. Chemical process safety education in China: An overview and the way forward. Saf. Sci. 2022, 148, 105643. [Google Scholar] [CrossRef]
- Farmer, J.D.; Packard, N.H.; Perelson, A.S. The immune system, adaptation, and machine learning. Phys. D 1986, 22, 187–204. [Google Scholar] [CrossRef]
- Varela, F.J.; Steward, J. Dynamics of a Class of Immune Network: Global Stability of Idiotype Interactions. Theor. Biol. 1990, 144, 93–101. [Google Scholar] [CrossRef]
- Dasgupta, D. Artificial neural networks and artificial immune systems: Similarities and differences. In Proceedings of the 1997 IEEE International Conference on Systems, Man, and Cybernetics, Orlando, FL, USA, 12–15 October 1997; IEEE: Piscataway, NJ, USA, 1997; Volume 1, pp. 873–878. [Google Scholar]
- Shi, L.; Wu, J. A Study of the Working Mechanism of the Workplace Emergency Capability Immune System Based on Bio-Inspired Theory. In Proceedings of the 2011 International Conference on Management and Service Science (MASS), Wuhan, China, 12–14 August 2011; IEEE: Piscataway, NJ, USA, 2011; pp. 1–4. [Google Scholar]
- Moncayo, H.; Perhinschi, M.G.; Davis, J. Artificial-Immune-System-Based Aircraft Failure Evaluation over Extended Flight Envelope. J. Guid. Control. Dyn. 2011, 34, 989–1001. [Google Scholar] [CrossRef]
- Luh, G.C.; Cheng, W.C. Immune model-based fault diagnosis. Math. Comput. Simul. 2005, 67, 515–539. [Google Scholar] [CrossRef]
- Chen, Y.M.; Lee, M.L. Neural networks-based scheme for system failure detection and diagnosis. Math. Comput. Simul. 2002, 58, 101–109. [Google Scholar] [CrossRef]
- Xie, F.; Gao, Y.; Wang, J.; Zhao, W. Defending local poisoning attacks in multi-party learning via immune system. Knowl.-Based Syst. 2022, 238, 107850. [Google Scholar] [CrossRef]
- Yang, B. Dynamic risk identification safety model based on fuzzy support vector machine and immune optimization algorithm. Saf. Sci. 2019, 118, 205–211. [Google Scholar] [CrossRef]
- Fotohi, R. Securing of Unmanned Aerial Systems (UAS) against security threats using human immune system. Reliab. Eng. Syst. Saf. 2020, 193, 106675. [Google Scholar] [CrossRef]
- Luh, G.C.; Cheng, W.C. Non-linear system identification using an artificial immune system. Proc. Inst. Mech. Eng. Part I-J. Syst. Control. Eng. 2001, 215, 569–585. [Google Scholar] [CrossRef]
- Bayar, N.; Darmoul, S.; Hajri-Gabouj, S.; Pierreval, H. Fault detection, diagnosis and recovery using Artificial Immune Systems: A review. Eng. Appl. Artif. Intell. 2015, 46, 43–57. [Google Scholar] [CrossRef]
- Wang, R.J.; Xu, K.L.; Xu, Y.Y. Study on prediction model of hazardous chemical accidents. J. Loss Prev. Process Ind. 2020, 66, 104183. [Google Scholar] [CrossRef]
- Alcover, A.; Di Bartolo, V.; Roda-Navarro, P. Editorial: Molecular dynamics at the immunological Synapse. Front. Immunol. 2016, 7, 632. [Google Scholar] [CrossRef] [Green Version]
- Li, C.; Peng, H.; Xu, A.; Wang, S. Immune System and Artificial Immune System Application. In Proceedings of the World Congress on Medical Physics and Biomedical Engineering, Seoul, Korea, 27 August–1 September 2006; Volume 14, pp. 477–480. [Google Scholar]
- Chen, W.; Zhou, J.; Wei, H. Compensatory Controller Based on Artificial Immune system. In Proceedings of the IEEE International Conference on Mechatronics and Automation, Luoyang, China, 25–28 June 2006; Volume 1–3, pp. 1608–1613. [Google Scholar]
- Timmis, J.; Neal, M. A resource limited artificial immune system for data analysis. Knowl.-Based Syst. 2001, 14, 121–130. [Google Scholar] [CrossRef]
- Chen, C.; Reniers, G. Chemical industry in China: The current status, safety problems, and pathways for future sustainable development. Saf. Sci. 2020, 128, 104741. [Google Scholar] [CrossRef]
- Bo, Y. The data clustering based dynamic risk identification of biological immune system: Mechanism, method and simulation. Cluster Comput. 2019, 22, 6253–6266. [Google Scholar] [CrossRef]
- Li, P.; Zhang, L.; Dai, L.; Zou, Y.; Li, X. An assessment method of operator’s situation awareness reliability based on fuzzy logic-AHP. Saf. Sci. 2019, 119, 330–343. [Google Scholar] [CrossRef]
- Yuan, Y.; Zhou, X.; Man, J. The safety evaluation of management in chemical enterprise with generalized regression neural network. IOP Conf. Ser. Earth Environ. Sci. 2019, 295, 042010. [Google Scholar] [CrossRef]
- Liu, S.; Forrest, J.; Yang, Y. Advances in Grey Systems Research. J. Grey Syst. 2013, 25, 1–18. [Google Scholar]
- Li, Q.X. The grey elementary functions and their grey derived functions. J. Grey Syst. 2008, 20, 245–254. [Google Scholar]
- Morteza, M.; Bafandeh, A.R. A new method for consistency test in fuzzy AHP. J. Intell. Fuzzy Syst. 2013, 25, 457–461. [Google Scholar]


| Target Layer | Criterion Layer | Element Layer | Index Layer |
|---|---|---|---|
| Safe production in chemical enterprises | Antigen G | Unsafe behavior G1 | Staffing G11 |
| Illegal construction G12 | |||
| Personal protection G13 | |||
| Personal quality G14 | |||
| Unsafe state G2 | Object failure G21 | ||
| Disorderly traffic G22 | |||
| Equipment mechanical damage G23 | |||
| Violation of distance and placement G24 | |||
| Lack of protection G25 | |||
| Adverse operating environment G3 | Major hazard monitoring G31 | ||
| Risk warning value exceeds G32 | |||
| Environmental pollution G33 | |||
| Occupational health hazards G34 | |||
| Lack of Safety Management G4 | Safety education G41 | ||
| Security screening governance G42 | |||
| Work safety supervision G43 | |||
| Safety identification and Emergency G44 | |||
| Antibody B | Safe behaviors B1 | Personnel on-job management B11 | |
| Behavior safety observation B12 | |||
| Personnel safety training B13 | |||
| Risk control of hazardous operations B14 | |||
| Safe state B2 | Monitoring and early warning of major hazard sources B21 | ||
| Monitoring and warning of high-risk processes B22 | |||
| Video surveillance of vital parts B23 | |||
| Inherent facility risk management B24 | |||
| Good working environment B3 | Risk monitoring map B31 | ||
| Monitoring and warning of toxics B32 | |||
| Occupational disease risk monitoring B33 | |||
| Safety management B4 | Risk prevention and control objective management B41 | ||
| Risk identification and control B42 | |||
| Risk investigation and management B43 | |||
| Emergency management B44 | |||
| Training learning assessment B45 |
| Gray Scale | Category | Grey Number | White Function | Functional Diagram | Corresponding Evaluation Coefficient |
|---|---|---|---|---|---|
| e = 1 | Very good |  | |||
| e = 2 | Good |  | |||
| e = 3 | Ordinary |  | |||
| e = 4 | Low | 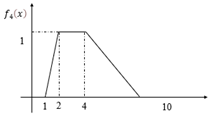 | |||
| e = 5 | Very low | 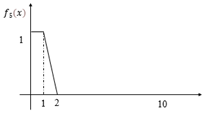 |
| Average | Item | B11 | B12 | B13 | B14 |
|---|---|---|---|---|---|
| 2.200 | B11 | 1 | 0.957 | 0.759 | 0.611 |
| 2.300 | B12 | 1.045 | 1 | 0.793 | 0.639 |
| 2.900 | B13 | 1.318 | 1.261 | 1 | 0.806 |
| 3.600 | B14 | 1.636 | 1.565 | 1.241 | 1 |
| Item | Eigenvector | Weighted Value | Maximum Eigenvalue | CI Value |
|---|---|---|---|---|
| B11 | 0.800 | 20.000% | 4.000 | 0.000 |
| B12 | 0.836 | 20.909% | ||
| B13 | 1.055 | 26.364% | ||
| B14 | 1.309 | 32.727% |
| n | 3 | 4 | 5 | 6 | 7 | 8 | 9 | 10 | 11 | 12 | 13 | 14 | 15 | 16 |
| RI | 0.52 | 0.89 | 1.12 | 1.26 | 1.36 | 1.41 | 1.46 | 1.49 | 1.52 | 1.54 | 1.56 | 1.58 | 1.59 | 1.59 |
| n | 17 | 18 | 19 | 20 | 21 | 22 | 23 | 24 | 25 | 26 | 27 | 28 | 29 | 30 |
| RI | 1.606 | 1.613 | 1.621 | 1.629 | 1.636 | 1.640 | 1.646 | 1.650 | 1.656 | 1.659 | 1.663 | 1.667 | 1.669 | 1.672 |
| Gi Weighted Average | Item | G1 | G2 | G3 | G4 |
|---|---|---|---|---|---|
| 2.940 | G1 | 1 | 1.059 | 0.981 | 1.085 |
| 2.777 | G2 | 0.944 | 1 | 0.926 | 1.025 |
| 2.997 | G3 | 1.020 | 1.079 | 1 | 1.106 |
| 2.709 | G4 | 0.922 | 0.976 | 0.904 | 1 |
| Criterion Layer | Element Layer | Index Layer | Weight of Criteria Layer | |
|---|---|---|---|---|
| Antigen G | Unsafe behavior G1 0.25736 | Staffing G11 | 0.1546 | 0.03977 |
| Illegal construction G12 | 0.3364 | 0.08657 | ||
| Personal protection G13 | 0.2364 | 0.06083 | ||
| Personal quality G14 | 0.2727 | 0.07019 | ||
| Unsafe state G2 0.24308 | Object failure G21 | 0.1812 | 0.04404 | |
| Disorderly traffic G22 | 0.1957 | 0.04756 | ||
| Equipment mechanical damage G23 | 0.1884 | 0.04580 | ||
| Violation of distance and placement G24 | 0.2101 | 0.05108 | ||
| Lack of protection G25 | 0.2246 | 0.05461 | ||
| Adverse operating environment G3 0.26239 | Major hazard monitoring G31 | 0.3044 | 0.07986 | |
| Risk warning value exceeds G32 | 0.2957 | 0.07758 | ||
| Environmental pollution G33 | 0.2174 | 0.05704 | ||
| Occupational health hazards G34 | 0.1826 | 0.04792 | ||
| Lack of Safety Management G4 0.23717 | Safety education G41 | 0.2315 | 0.05490 | |
| Security screening governance G42 | 0.2685 | 0.06368 | ||
| Work safety supervision G43 | 0.2593 | 0.06149 | ||
| Safety identification and Emergency G44 | 0.2407 | 0.05710 | ||
| Antibody B | Safe behavior B1 0.24432 | Personnel on-job management B11 | 0.2000 | 0.04886 |
| Behavior safety observation B12 | 0.2091 | 0.05108 | ||
| Personnel safety training B13 | 0.2636 | 0.06441 | ||
| Risk control of hazardous operations B14 | 0.3273 | 0.07996 | ||
| Safe state B2 0.28723 | Monitoring and early warning of major hazard sources B21 | 0.3023 | 0.08684 | |
| Monitoring and warning of high-risk processes B22 | 0.2713 | 0.07793 | ||
| Video surveillance of vital parts B23 | 0.2636 | 0.07570 | ||
| Inherent facility risk management B24 | 0.1628 | 0.04676 | ||
| Good working environment B3 0.23232 | Risk monitoring map B31 | 0.2821 | 0.06553 | |
| Monitoring and warning of toxics B32 | 0.4359 | 0.10127 | ||
| Occupational disease risk monitoring B33 | 0.2821 | 0.06553 | ||
| Safety management B4 0.23613 | Risk prevention and control objective management B41 | 0.1691 | 0.03994 | |
| Risk identification and control B42 | 0.2279 | 0.05382 | ||
| Risk investigation and management B43 | 0.2353 | 0.05556 | ||
| Emergency management B44 | 0.1838 | 0.04341 | ||
| Training learning assessment B45 | 0.1838 | 0.04341 | ||
| Evaluation Indicator | Grade of the Evaluation | Results | |
|---|---|---|---|
| Index layer | Personnel on-job management B11 | 6.37 | good |
| Behavior safety observation B12 | 3.14 | poor | |
| Personnel safety training B13 | 5.87 | ordinary | |
| Risk control of hazardous operations B14 | 5.47 | ordinary | |
| Monitoring and early warning of major hazard sources B21 | 5.14 | ordinary | |
| Monitoring and warning of high-risk processes B22 | 5.28 | ordinary | |
| Video surveillance of vital parts B23 | 8.03 | very good | |
| Inherent facility risk management B24 | 7.06 | good | |
| Risk monitoring map B31 | 7.51 | good | |
| Monitoring and warning of toxics B32 | 4.84 | ordinary | |
| Occupational disease risk monitoring B33 | 8.36 | very good | |
| Risk prevention and control objective management B41 | 6.23 | good | |
| Risk identification and control B42 | 7.31 | good | |
| Risk investigation and management B43 | 5.73 | general | |
| Emergency management B44 | 5.97 | general | |
| Training learning assessment B45 | 6.43 | good | |
| Element factor | Unsafe behavior of people /B1 | 5.27 | general |
| Unsafe state of things /B2 | 6.25 | good | |
| Poor operating environment /B3 | 6.59 | good | |
| Safety Management /B4 | 6.34 | good |
Publisher’s Note: MDPI stays neutral with regard to jurisdictional claims in published maps and institutional affiliations. |
© 2022 by the authors. Licensee MDPI, Basel, Switzerland. This article is an open access article distributed under the terms and conditions of the Creative Commons Attribution (CC BY) license (https://creativecommons.org/licenses/by/4.0/).
Share and Cite
Yuan, X.; Wang, B.; Guan, X.; Wang, Y.; Chemsi, O.; Zhang, J.; Chen, X. Construction of Safety-Management Platform for Chemical Enterprises Based on the Immune System Model. Appl. Sci. 2022, 12, 5522. https://doi.org/10.3390/app12115522
Yuan X, Wang B, Guan X, Wang Y, Chemsi O, Zhang J, Chen X. Construction of Safety-Management Platform for Chemical Enterprises Based on the Immune System Model. Applied Sciences. 2022; 12(11):5522. https://doi.org/10.3390/app12115522
Chicago/Turabian StyleYuan, Xiongjun, Bingjie Wang, Xin Guan, Yuqin Wang, Othmane Chemsi, Jiaxuan Zhang, and Xiaoyu Chen. 2022. "Construction of Safety-Management Platform for Chemical Enterprises Based on the Immune System Model" Applied Sciences 12, no. 11: 5522. https://doi.org/10.3390/app12115522
APA StyleYuan, X., Wang, B., Guan, X., Wang, Y., Chemsi, O., Zhang, J., & Chen, X. (2022). Construction of Safety-Management Platform for Chemical Enterprises Based on the Immune System Model. Applied Sciences, 12(11), 5522. https://doi.org/10.3390/app12115522