
LiverNet: Diagnosis of Liver Tumors in Human CT Images

 , , ,
, , ,  , ,
, ,
Abstract
:1. Introduction
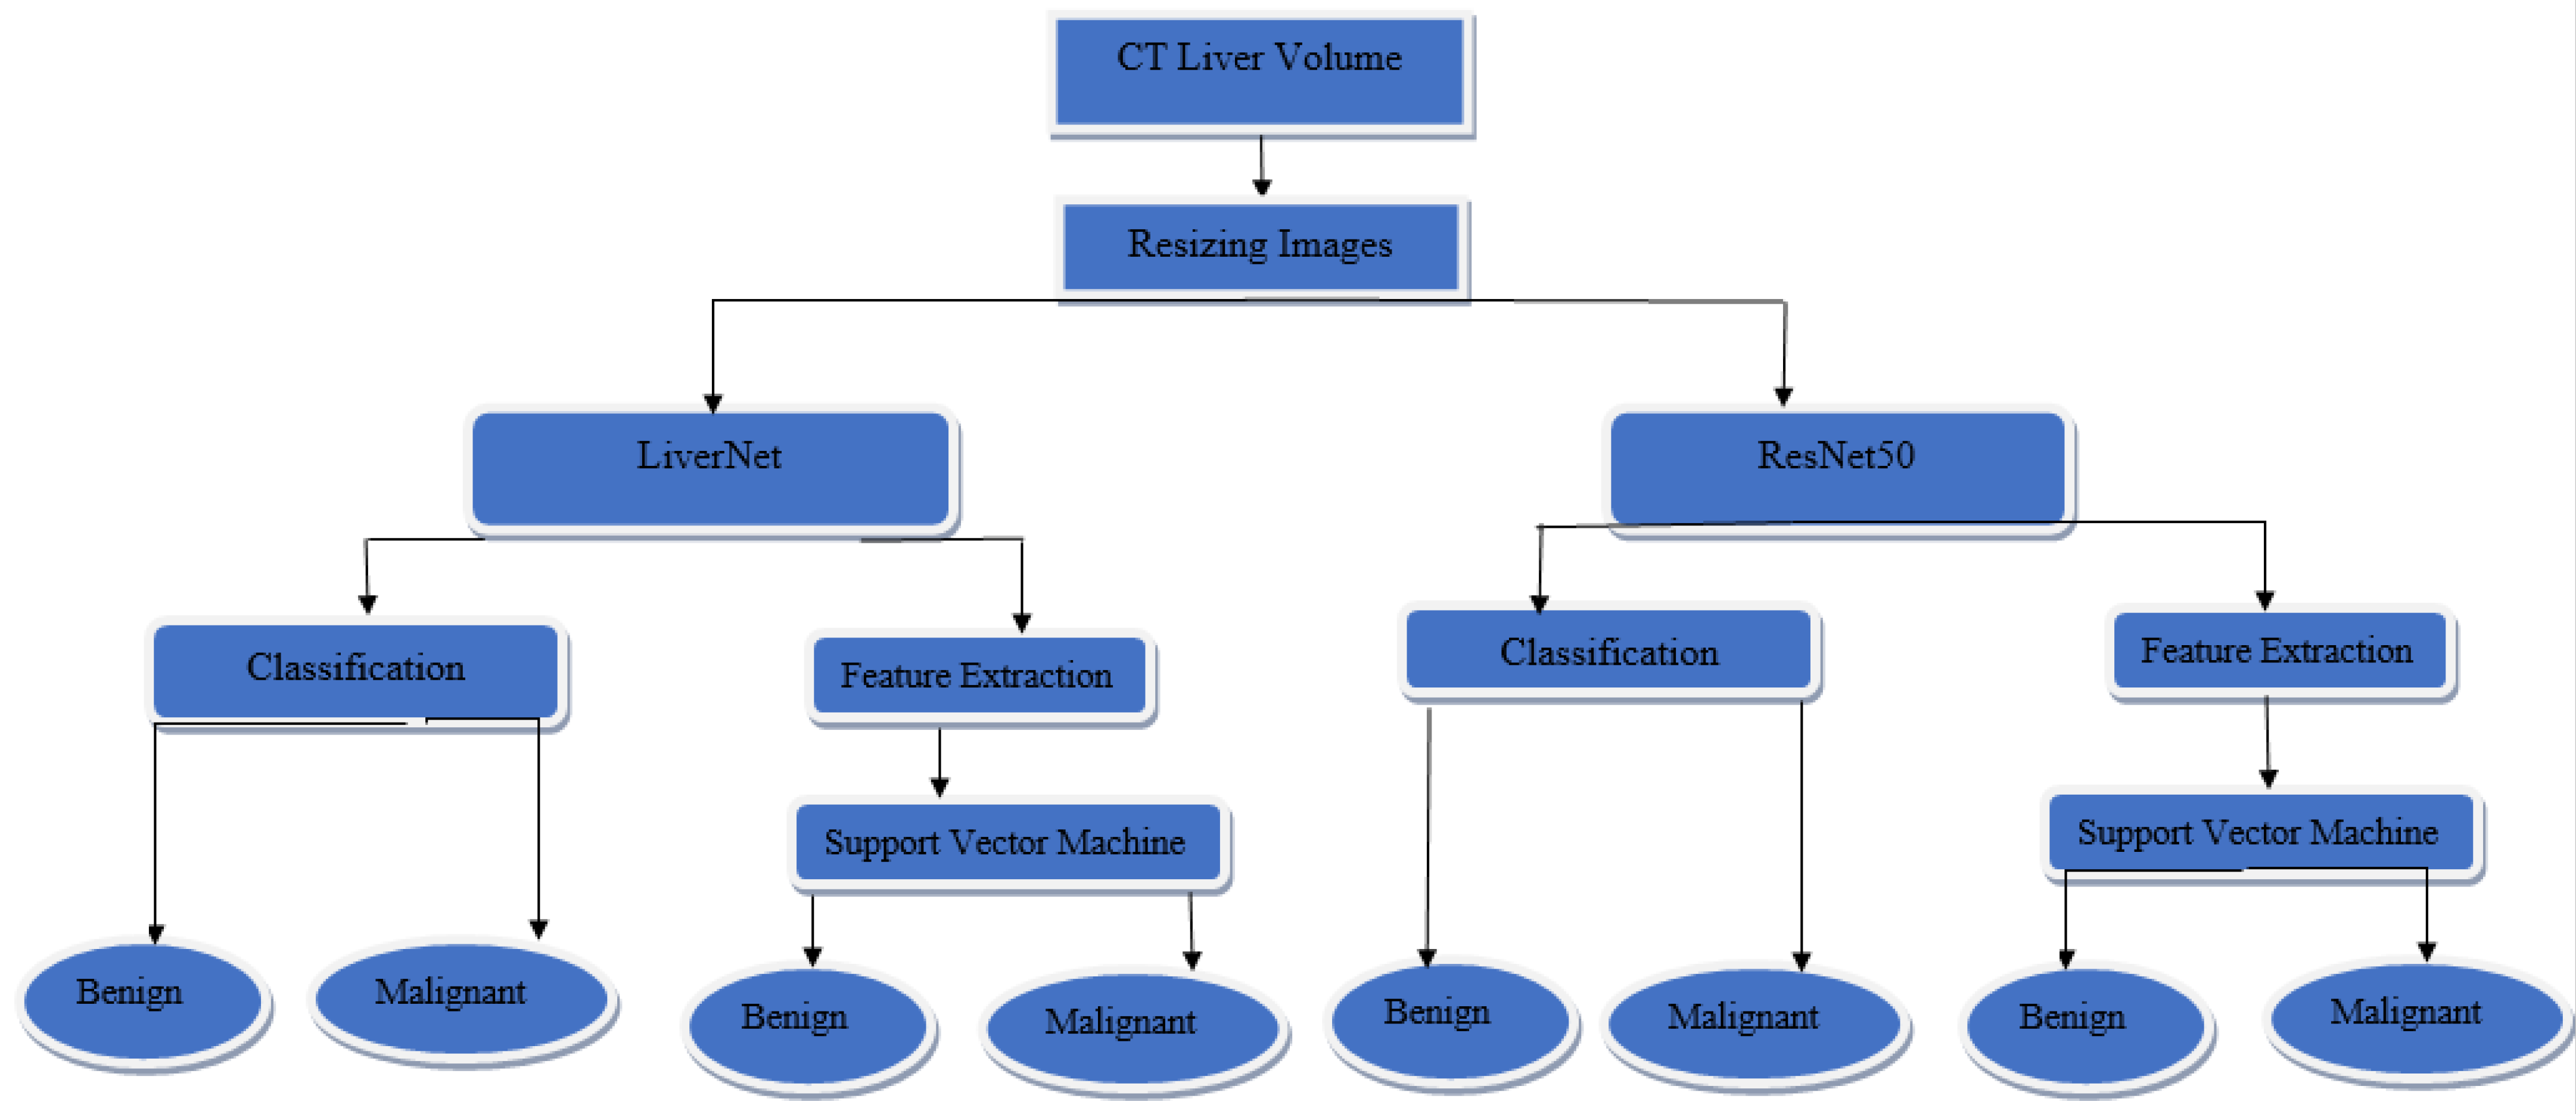
2. Materials and Methods
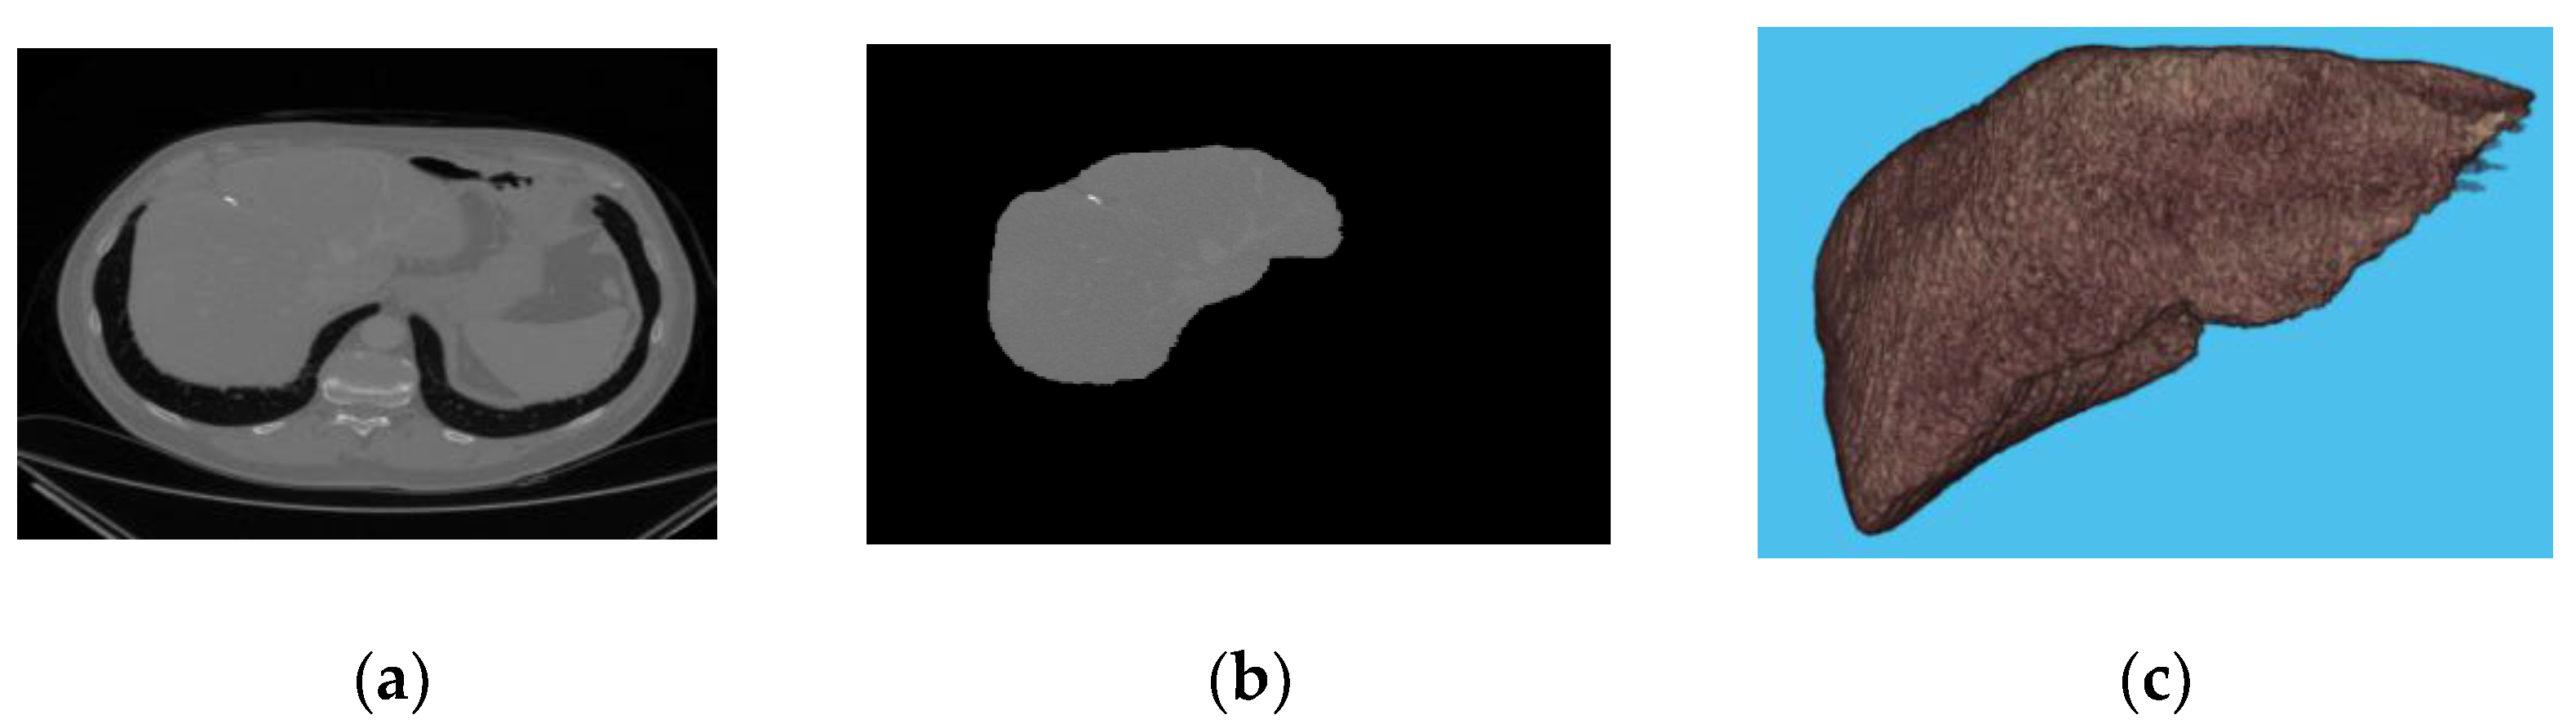
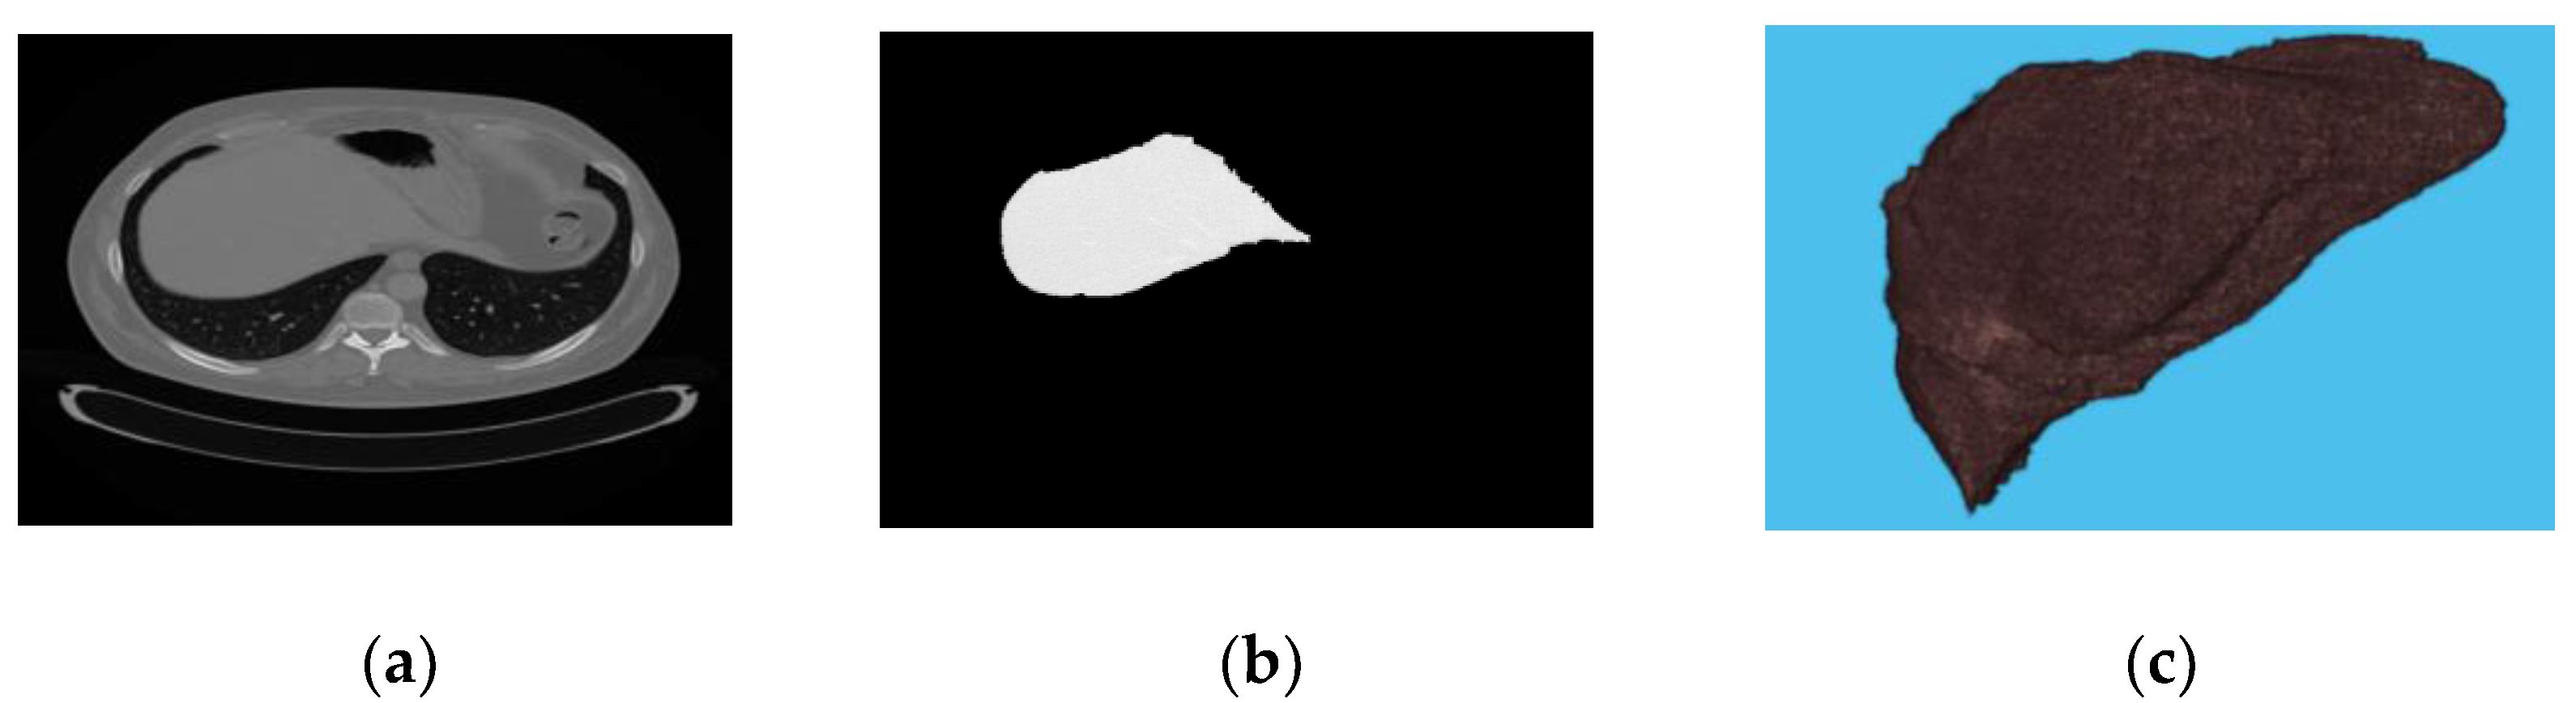
2.1. Dataset
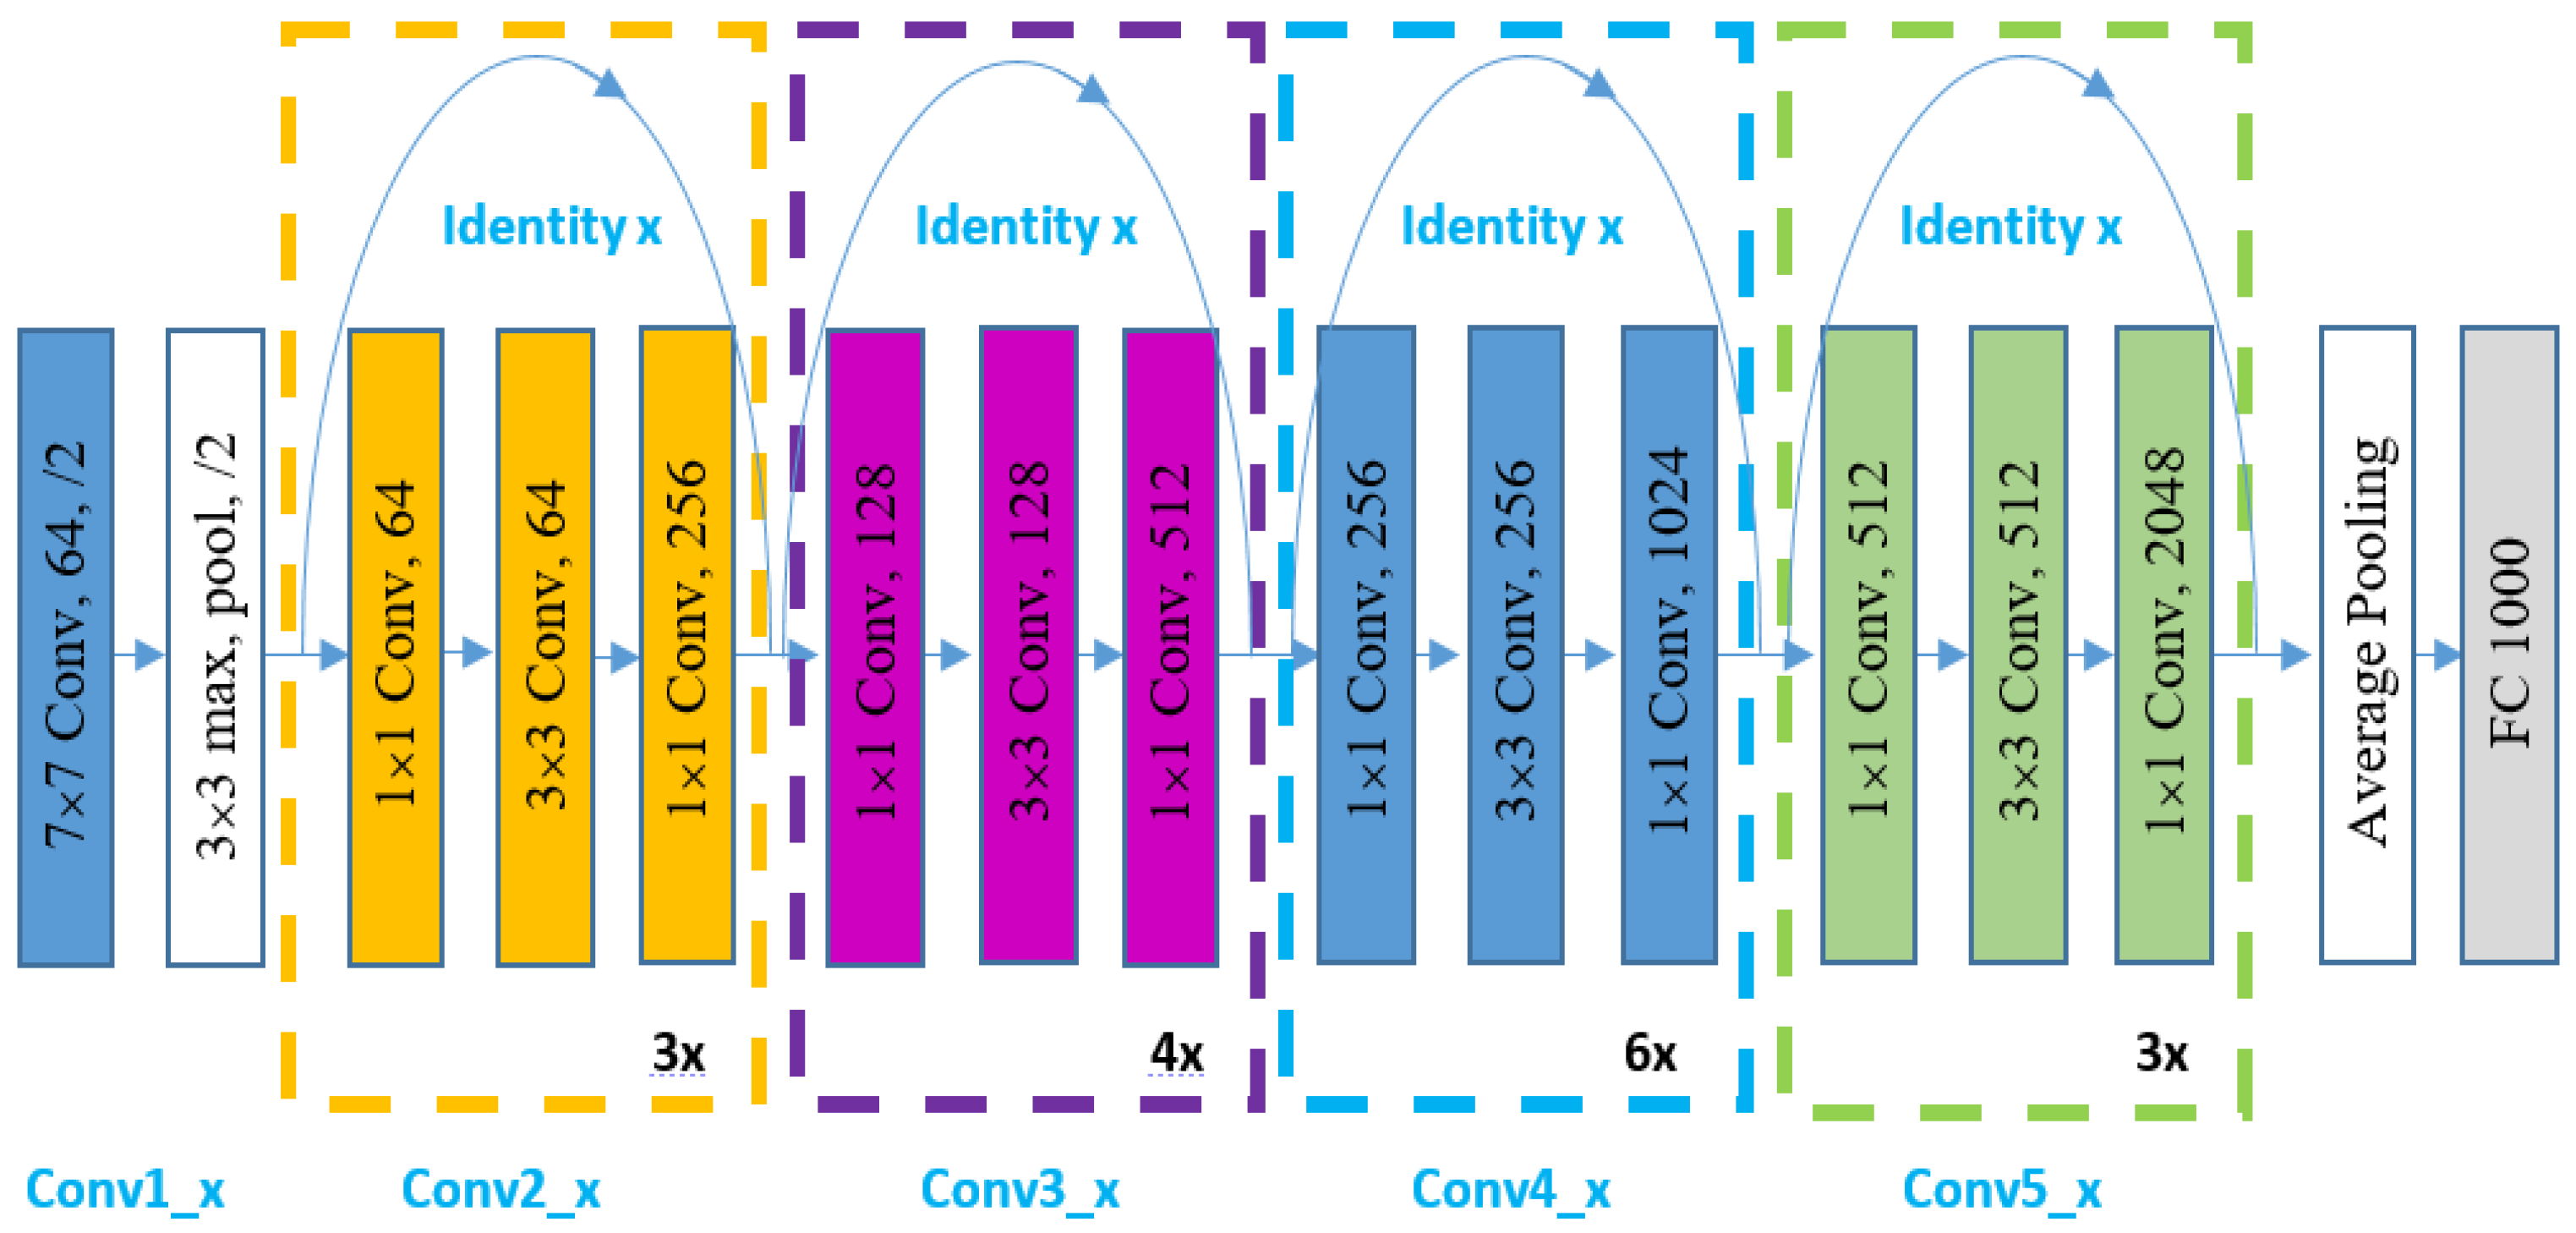
2.2. Deep Learning
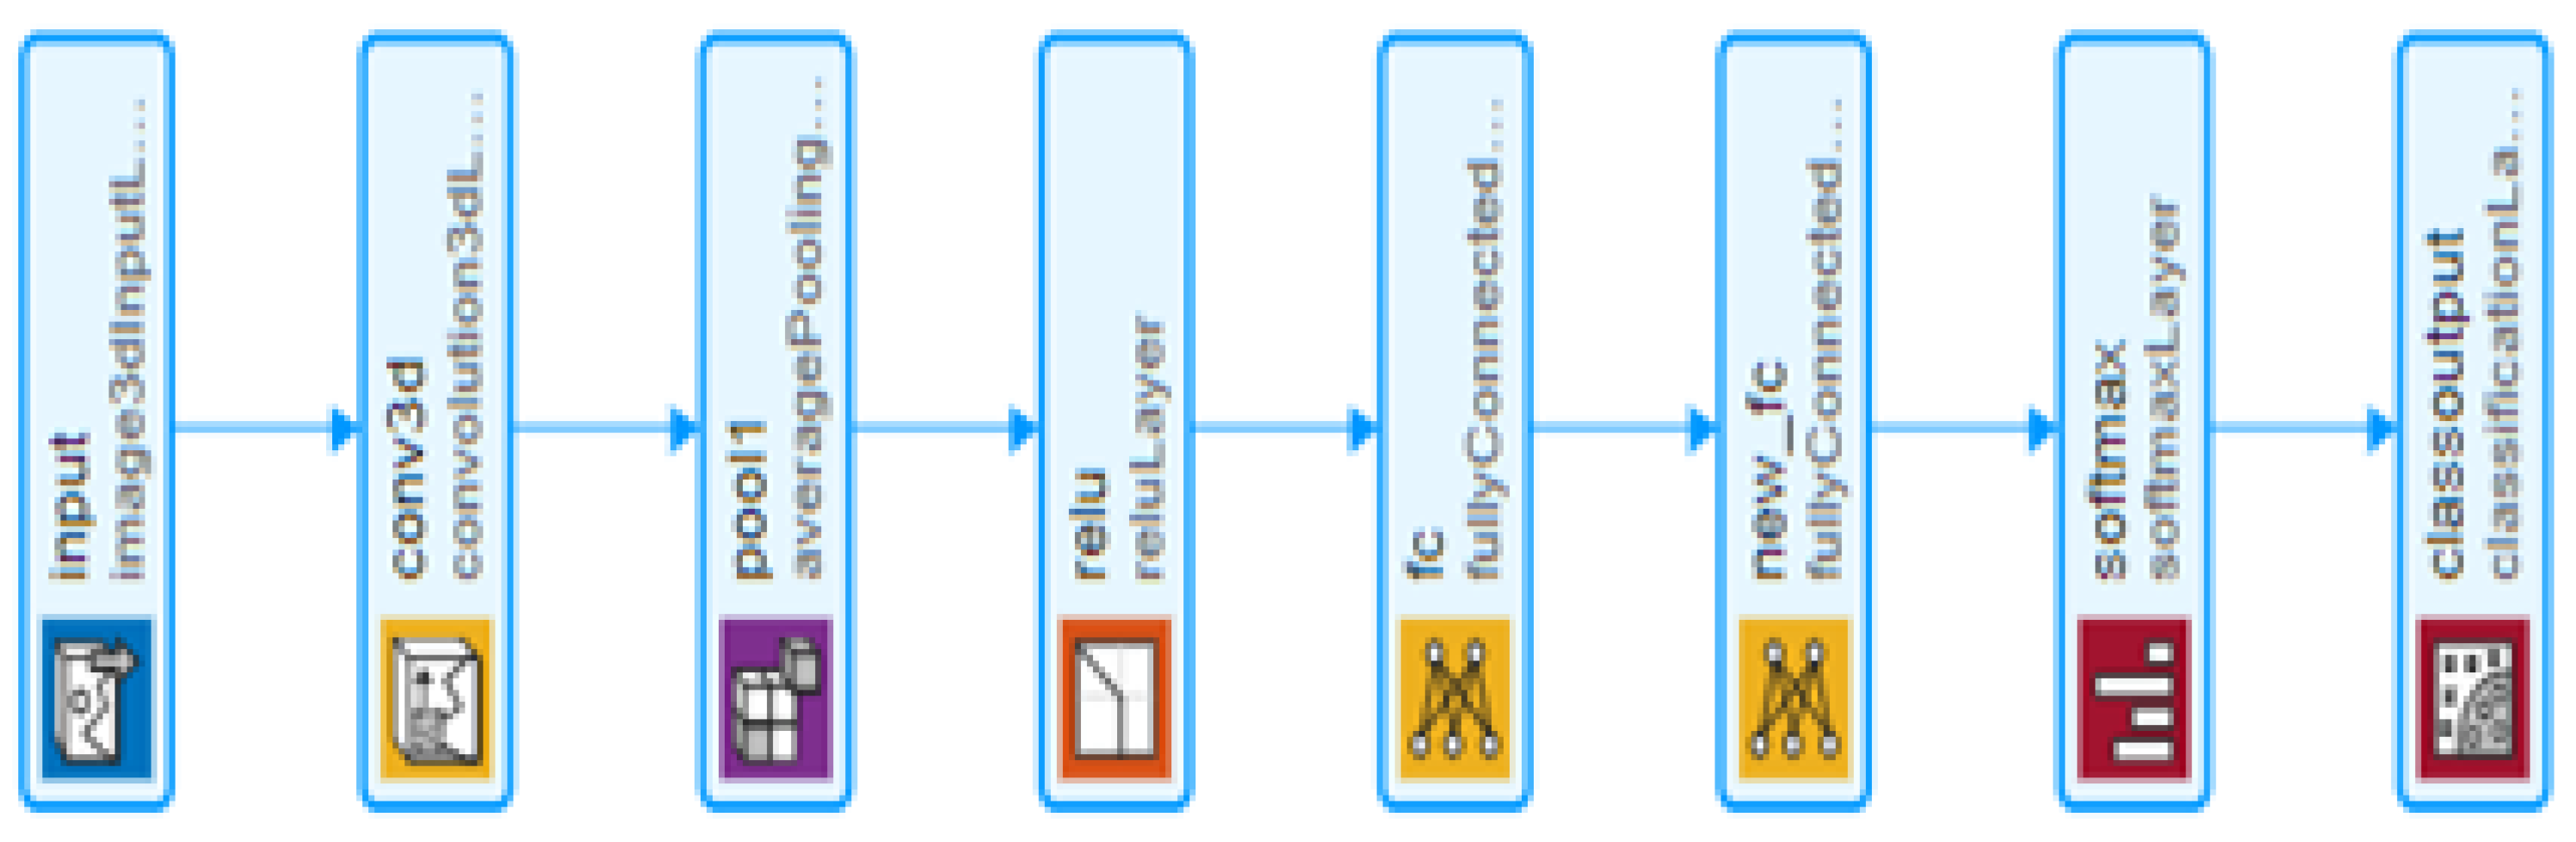
LiverNet
2.3. Classification
3. Results and Discussion
4. Conclusions
Author Contributions
Funding
Data Availability Statement
Acknowledgments
Conflicts of Interest
References
- Al Sadeque, Z.; Khan, T.I.; Hossain, Q.D.; Turaba, M.Y. Automated detection and classification of liver cancer from CT Images using HOG-SVM model. In Proceedings of the 2019 5th International Conference on Advances in Electrical Engineering (ICAEE 2019), Dhaka, Bangladesh, 26–28 September 2019; pp. 21–26. [Google Scholar]
- Ba Alawi, A.E.; Saeed, A.Y.A.; Radman, B.M.N.; Alzekri, B.T. A Comparative Study on Liver Tumor Detection Using CT Images. In Lecture Notes on Data Engineering and Communications Technologies; Springer: Cham, Switzerland, 2021; Volume 72, pp. 129–137. [Google Scholar]
- Shanila, N.; Vinod Kumar, R.S.; Abin, N.A. Feature extraction and performance evaluation of classification algorithms for liver tumor diagnosis of abdominal computed tomography images. J. Adv. Res. Dyn. Control Syst. 2020, 12, 82–90. [Google Scholar] [CrossRef]
- Selvathi, D.; Malini, C.; Shanmugavalli, P. Automatic segmentation and classification of liver tumor in CT images using adaptive hybrid technique and Contourlet based ELM classifier. In Proceedings of the 2013 International Conference on Recent Trends in Information Technology (ICRTIT 2013), Dubai, United Arab Emirates, 11–12 December 2013; pp. 250–256. [Google Scholar]
- Masuda, Y.; Tateyama, T.; Xiong, W.; Zhou, J.; Wakamiya, M.; Kanasaki, S.; Furukawa, A.; Chen, Y.W. Liver tumor detection in CT images by adaptive contrast enhancement and the EM/MPM algorithm. In Proceedings of the International Conference on Image Processing (ICIP), Brussels, Belguim, 11–14 September 2011; pp. 1421–1424. [Google Scholar]
- Hasegawa, R.; Iwamoto, Y.; Han, X.; Lin, L.; Hu, H.; Cai, X.; Chen, Y.W. Automatic Detection and Segmentation of Liver Tumors in Multi- phase CT Images by Phase Attention Mask R-CNN. In Proceedings of the Digest of Technical Papers—IEEE International Conference on Consumer Electronics, Penghu, Taiwan, 15–17 September 2021. [Google Scholar]
- Salman, O.S.; Klein, R. Automatic Detection and Segmentation of Liver Tumors in Computed Tomography Images: Methods and Limitations. In Intelligent Computing; Lecture Notes in Networks and Systems; Springer: Cham, Switzerland, 2021; Volume 285, pp. 17–35. [Google Scholar]
- Das, A.; Panda, S.S.; Sabut, S. Detection of liver tumor in CT images using watershed and hidden markov random field expectation maximization algorithm. In Computational Intelligence, Communications, and Business Analytics; Springer: Singapore, 2017; Volume 776, pp. 411–419. [Google Scholar]
- Todoroki, Y.; Han, X.H.; Iwamoto, Y.; Lin, L.; Hu, H.; Chen, Y.W. Detection of liver tumor candidates from CT images using deep convolutional neural networks. In International Conference on Innovation in Medicine and Healthcare; Springer: Cham, Switzerland, 2018; Volume 71, pp. 140–145. [Google Scholar]
- Devi, R.M.; Seenivasagam, V. Automatic segmentation and classification of liver tumor from CT image using feature difference and SVM based classifier-soft computing technique. Soft Comput. 2020, 24, 18591–18598. [Google Scholar] [CrossRef]
- Krishan, A.; Mittal, D. Ensembled liver cancer detection and classification using CT images. Proc. Inst. Mech. Eng. Part H J. Eng. Med. 2021, 235, 232–244. [Google Scholar] [CrossRef] [PubMed]
- Mao, J.; Song, Y.; Liu, Z. CT image classification of liver tumors based on multi-scale and deep feature extraction. J. Image Graph. 2021, 26, 1704–1715. [Google Scholar] [CrossRef]
- Das, A.; Acharya, U.R.; Panda, S.S.; Sabut, S. Deep learning based liver cancer detection using watershed transform and Gaussian mixture model techniques. Cogn. Syst. Res. 2019, 54, 165–175. [Google Scholar] [CrossRef]
- Yasaka, K.; Akai, H.; Abe, O.; Kiryu, S. Deep learning with convolutional neural network for differentiation of liver masses at dynamic contrast-enhanced CT: A preliminary study. Radiology 2018, 286, 887–896. [Google Scholar] [CrossRef] [PubMed] [Green Version]
- Kakkar, P.; Nagpal, S.; Nanda, N. Automatic liver segmentation in CT images using improvised techniques. In International Conference on Smart Health; Lecture Notes in Computer Science; Springer: Cham, Switzerland, 2018; Volume 10983 LNCS, pp. 41–52. [Google Scholar]
- Ghoniem, R.M. A Novel Bio-Inspired Deep Learning Approach for Liver Cancer Diagnosis. Information 2020, 11, 80. [Google Scholar] [CrossRef] [Green Version]
- Aslam, M.S.; Younas, M.; Sarwar, M.U.; Shah, M.A.; Khan, A.; Uddin, M.I.; Ahmad, S.; Firdausi, M.; Zaindin, M. Liver-Tumor detection using CNN ResUNet. Comput. Mater. Contin. 2021, 67, 1899–1914. [Google Scholar] [CrossRef]
- Zhou, J.; Wang, W.; Lei, B.; Ge, W.; Huang, Y.; Zhang, L.; Yan, Y.; Zhou, D.; Ding, Y.; Wu, J.; et al. Automatic Detection and Classification of Focal Liver Lesions Based on Deep Convolutional Neural Networks: A Preliminary Study. Front. Oncol. 2021, 10, 581210. [Google Scholar] [CrossRef] [PubMed]
- Al-Saeed, Y.; Gab-Allah, W.A.; Soliman, H.; Abulkhair, M.F.; Shalash, W.M.; Elmogy, M. Efficient Computer Aided Diagnosis System for Hepatic Tumors Using Computed Tomography Scans. Comput. Mater. Contin. 2022, 71, 4871–4894. [Google Scholar] [CrossRef]
- Hussain, M.; Saher, N.; Qadri, S. Computer Vision Approach for Liver Tumor Classification Using CT Dataset. Appl. Artif. Intell. 2022, 1–23. [Google Scholar] [CrossRef]
- Selvathi, D.; Priyadarsini, S.; Malini, C.; Shanmugavalli, P. Performance analysis of multi resolution transforms with kernel classifiers for liver tumor detection using CT images. Int. J. Appl. Eng. Res. 2014, 9, 30935–30952. [Google Scholar]
- Krishan, A.; Mittal, D. Effective segmentation and classification of tumor on liver MRI and CT images using multi-kernel K-means clustering. Biomed. Technol. 2019, 301–313. [Google Scholar] [CrossRef] [PubMed]
- Soler, L.; Hostettler, A.; Agnus, V.; Charnoz, A.; Fasquel, J.; Moreau, J.; Osswald, A.; Bouhadjar, M.; Marescaux, J. 3D Image Reconstruction for Comparison of Algorithm Database: A Patient Specific Anatomical and Medical Image Database; Tech Report; IRCAD: Strasbourg, France, 2010. [Google Scholar]
- He, K.; Zhang, X.; Ren, S.; Sun, J. Deep residual learning for image recognition. In Proceedings of the IEEE Computer Society Conference on Computer Vision and Pattern Recognition, Las Vegas, NV, USA, 27–30 June 2016; pp. 770–778. [Google Scholar]
- Poudel, S.; Kim, Y.J.; Vo, D.M.; Lee, S.W. Colorectal Disease Classification Using Efficiently Scaled Dilation in Convolutional Neural Network. IEEE Access 2020, 8, 99227–99238. [Google Scholar] [CrossRef]
- Ullah, W.; Ullah, A.; Haq, I.U.; Muhammad, K.; Sajjad, M.; Baik, S.W. CNN features with bi-directional LSTM for real-time anomaly detection in surveillance networks. Multimed. Tools Appl. 2021, 80, 16979–16995. [Google Scholar] [CrossRef]
- Wu, H.; Xin, M.; Fang, W.; Hu, H.M.; Hu, Z. Multi-Level Feature Network with Multi-Loss for Person Re-Identification. IEEE Access 2019, 7, 91052–91062. [Google Scholar] [CrossRef]
- Chen, J.; Zhou, M.; Zhang, D.; Huang, H.; Zhang, F. Quantification of water inflow in rock tunnel faces via convolutional neural network approach. Autom. Constr. 2021, 123, 103526. [Google Scholar] [CrossRef]
- Alqudah, A.; Alqudah, A.M.; Alquran, H.; Al-zoubi, H.R.; Al-qodah, M.; Al-khassaweneh, M.A. Recognition of handwritten arabic and hindi numerals using convolutional neural networks. Appl. Sci. 2021, 11, 1573. [Google Scholar] [CrossRef]
- Alqudah, A.M.; Alquran, H.; Abu-Qasmieh, I.; Al-Badarneh, A. Employing image processing techniques and artificial intelligence for automated eye diagnosis using digital eye fundus images. J. Biomim. Biomater. Biomed. Eng. 2018, 39, 40–56. [Google Scholar] [CrossRef]


| Volume# | Radiologist Label | Volume# | Radiologist Label | Volume# | Radiologist Label | Volume# | Radiologist Label | Volume# | Radiologist Label |
|---|---|---|---|---|---|---|---|---|---|
| 1 | malignant | 27 | malignant | 53 | malignant | 79 | malignant | 105 | benign |
| 2 | malignant | 28 | malignant | 54 | Normal | 80 | malignant | 106 | benign |
| 3 | malignant | 29 | malignant | 55 | malignant | 81 | malignant | 107 | malignant |
| 4 | malignant | 30 | malignant | 56 | malignant | 82 | benign | 108 | malignant |
| 5 | malignant | 31 | malignant | 57 | benign | 83 | malignant | 109 | malignant |
| 6 | benign | 32 | malignant | 58 | benign | 84 | malignant | 110 | benign |
| 7 | malignant | 33 | Normal | 59 | malignant | 85 | benign | 111 | malignant |
| 8 | malignant | 34 | malignant | 60 | benign | 86 | benign | 112 | benign |
| 9 | malignant | 35 | benign | 61 | malignant | 87 | malignant | 113 | benign |
| 10 | malignant | 36 | malignant | 62 | benign | 88 | benign | 114 | malignant |
| 11 | malignant | 37 | benign | 63 | benign | 89 | malignant | 115 | malignant |
| 12 | malignant | 38 | malignant | 64 | benign | 90 | benign | 116 | malignant |
| 13 | benign | 39 | Normal | 65 | malignant | 91 | benign | 117 | benign |
| 14 | malignant | 40 | malignant | 66 | benign | 92 | malignant | 118 | malignant |
| 15 | malignant | 41 | malignant | 67 | malignant | 93 | malignant | 119 | malignant |
| 16 | benign | 42 | benign | 68 | malignant | 94 | malignant | 120 | malignant |
| 17 | malignant | 43 | benign | 69 | malignant | 95 | malignant | 121 | benign |
| 18 | malignant | 44 | benign | 70 | malignant | 96 | malignant | 122 | benign |
| 19 | malignant | 45 | benign | 71 | malignant | 97 | malignant | 123 | benign |
| 20 | malignant | 46 | malignant | 72 | benign | 98 | benign | 124 | malignant |
| 21 | malignant | 47 | malignant | 73 | benign | 99 | malignant | 125 | malignant |
| 22 | malignant | 48 | benign | 74 | malignant | 100 | malignant | 126 | malignant |
| 23 | malignant | 49 | malignant | 75 | malignant | 101 | malignant | 127 | benign |
| 24 | malignant | 50 | malignant | 76 | malignant | 102 | malignant | 128 | benign |
| 25 | benign | 51 | benign | 77 | benign | 103 | malignant | 129 | malignant |
| 26 | Normal | 52 | malignant | 78 | malignant | 104 | benign | 130 | malignant |
| Benign | Malignant | Total | |
|---|---|---|---|
| Number of volume images before augmentation | 39 | 85 | 124 |
| Number of volume images after augmentation | 78 | 85 | 163 |
| Layer | Information |
|---|---|
| Input Layer | Size [223 × 223 × 147] |
| Conv_1 | Number of Filters 6 Kernel size 5 × 5 × 5 Stride 2 × 2 × 2 Padding 0 |
| Pooling Layer | Type Average Pooling Kernel size 2 × 2 × 2 Stride 2 × 2 × 2 Padding 0 |
| Activation Layer | ReLU |
| Fully-connected Layer | 10 neurons |
| Fully-connected Layer | 2 neurons |
| Softmax Layer | |
| Classification Layer |
| Net Work | Train | Test |
|---|---|---|
| ResNet50 | 123 min | 32 s |
| Proposed model | 89 min | 22 s |
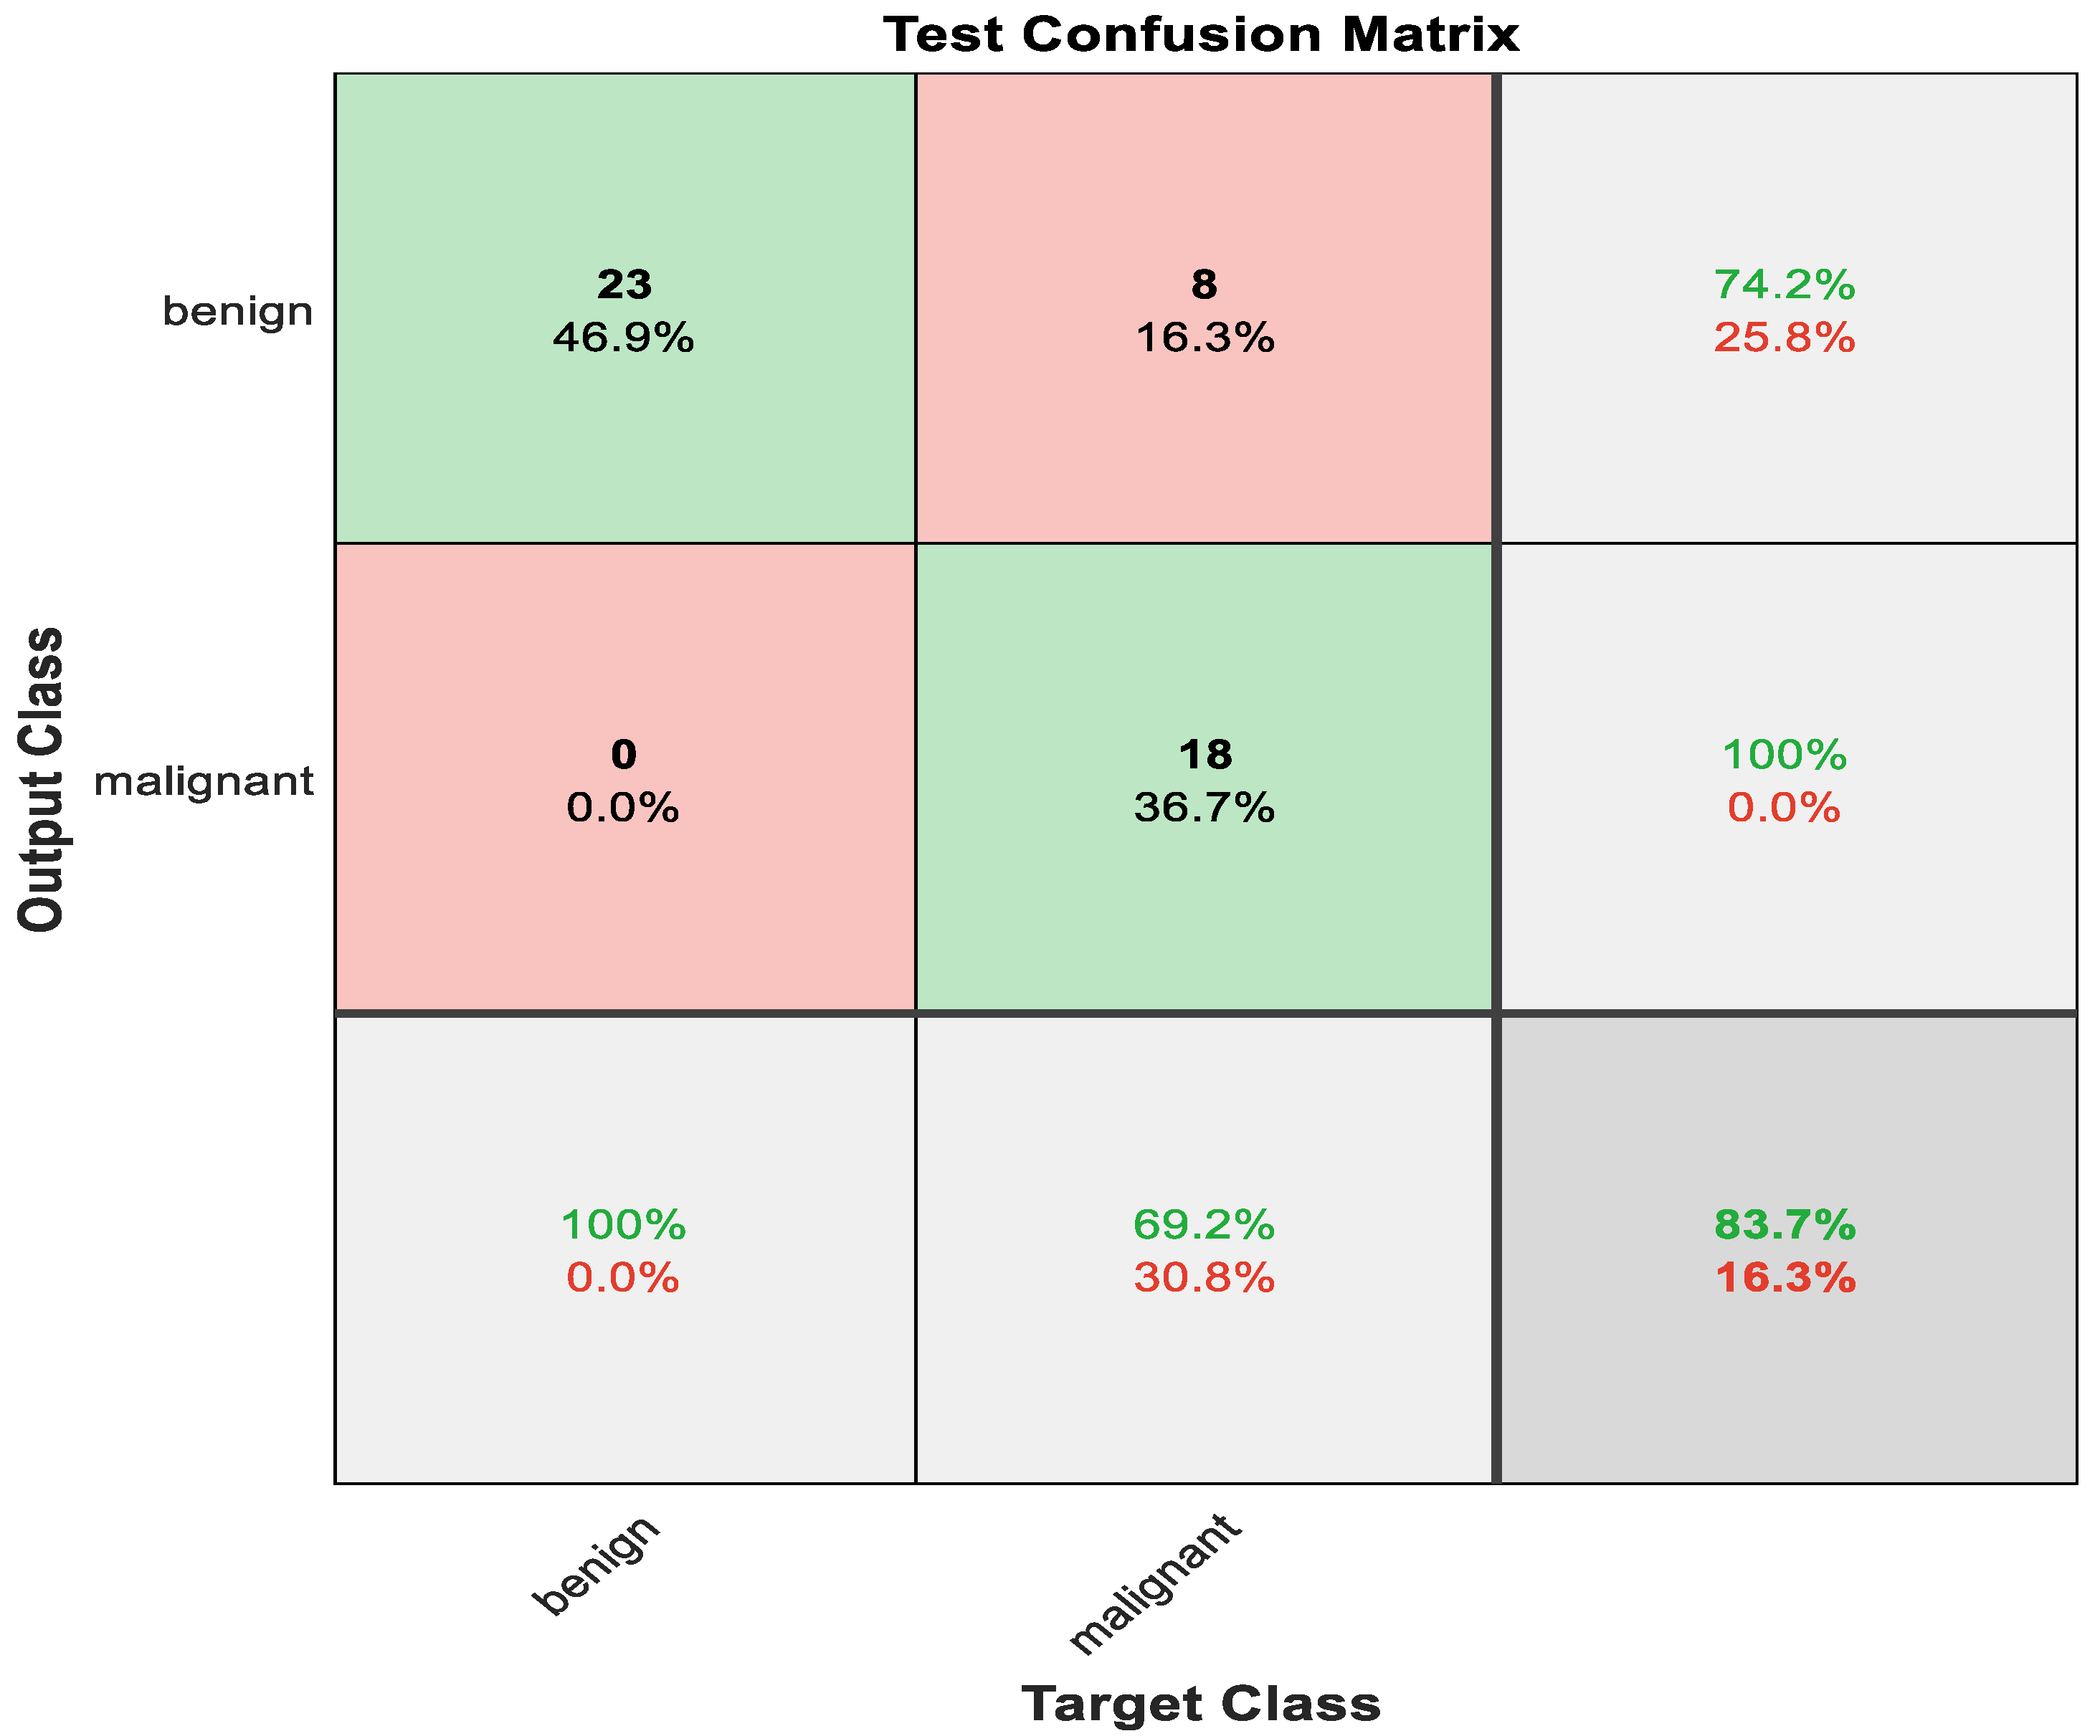
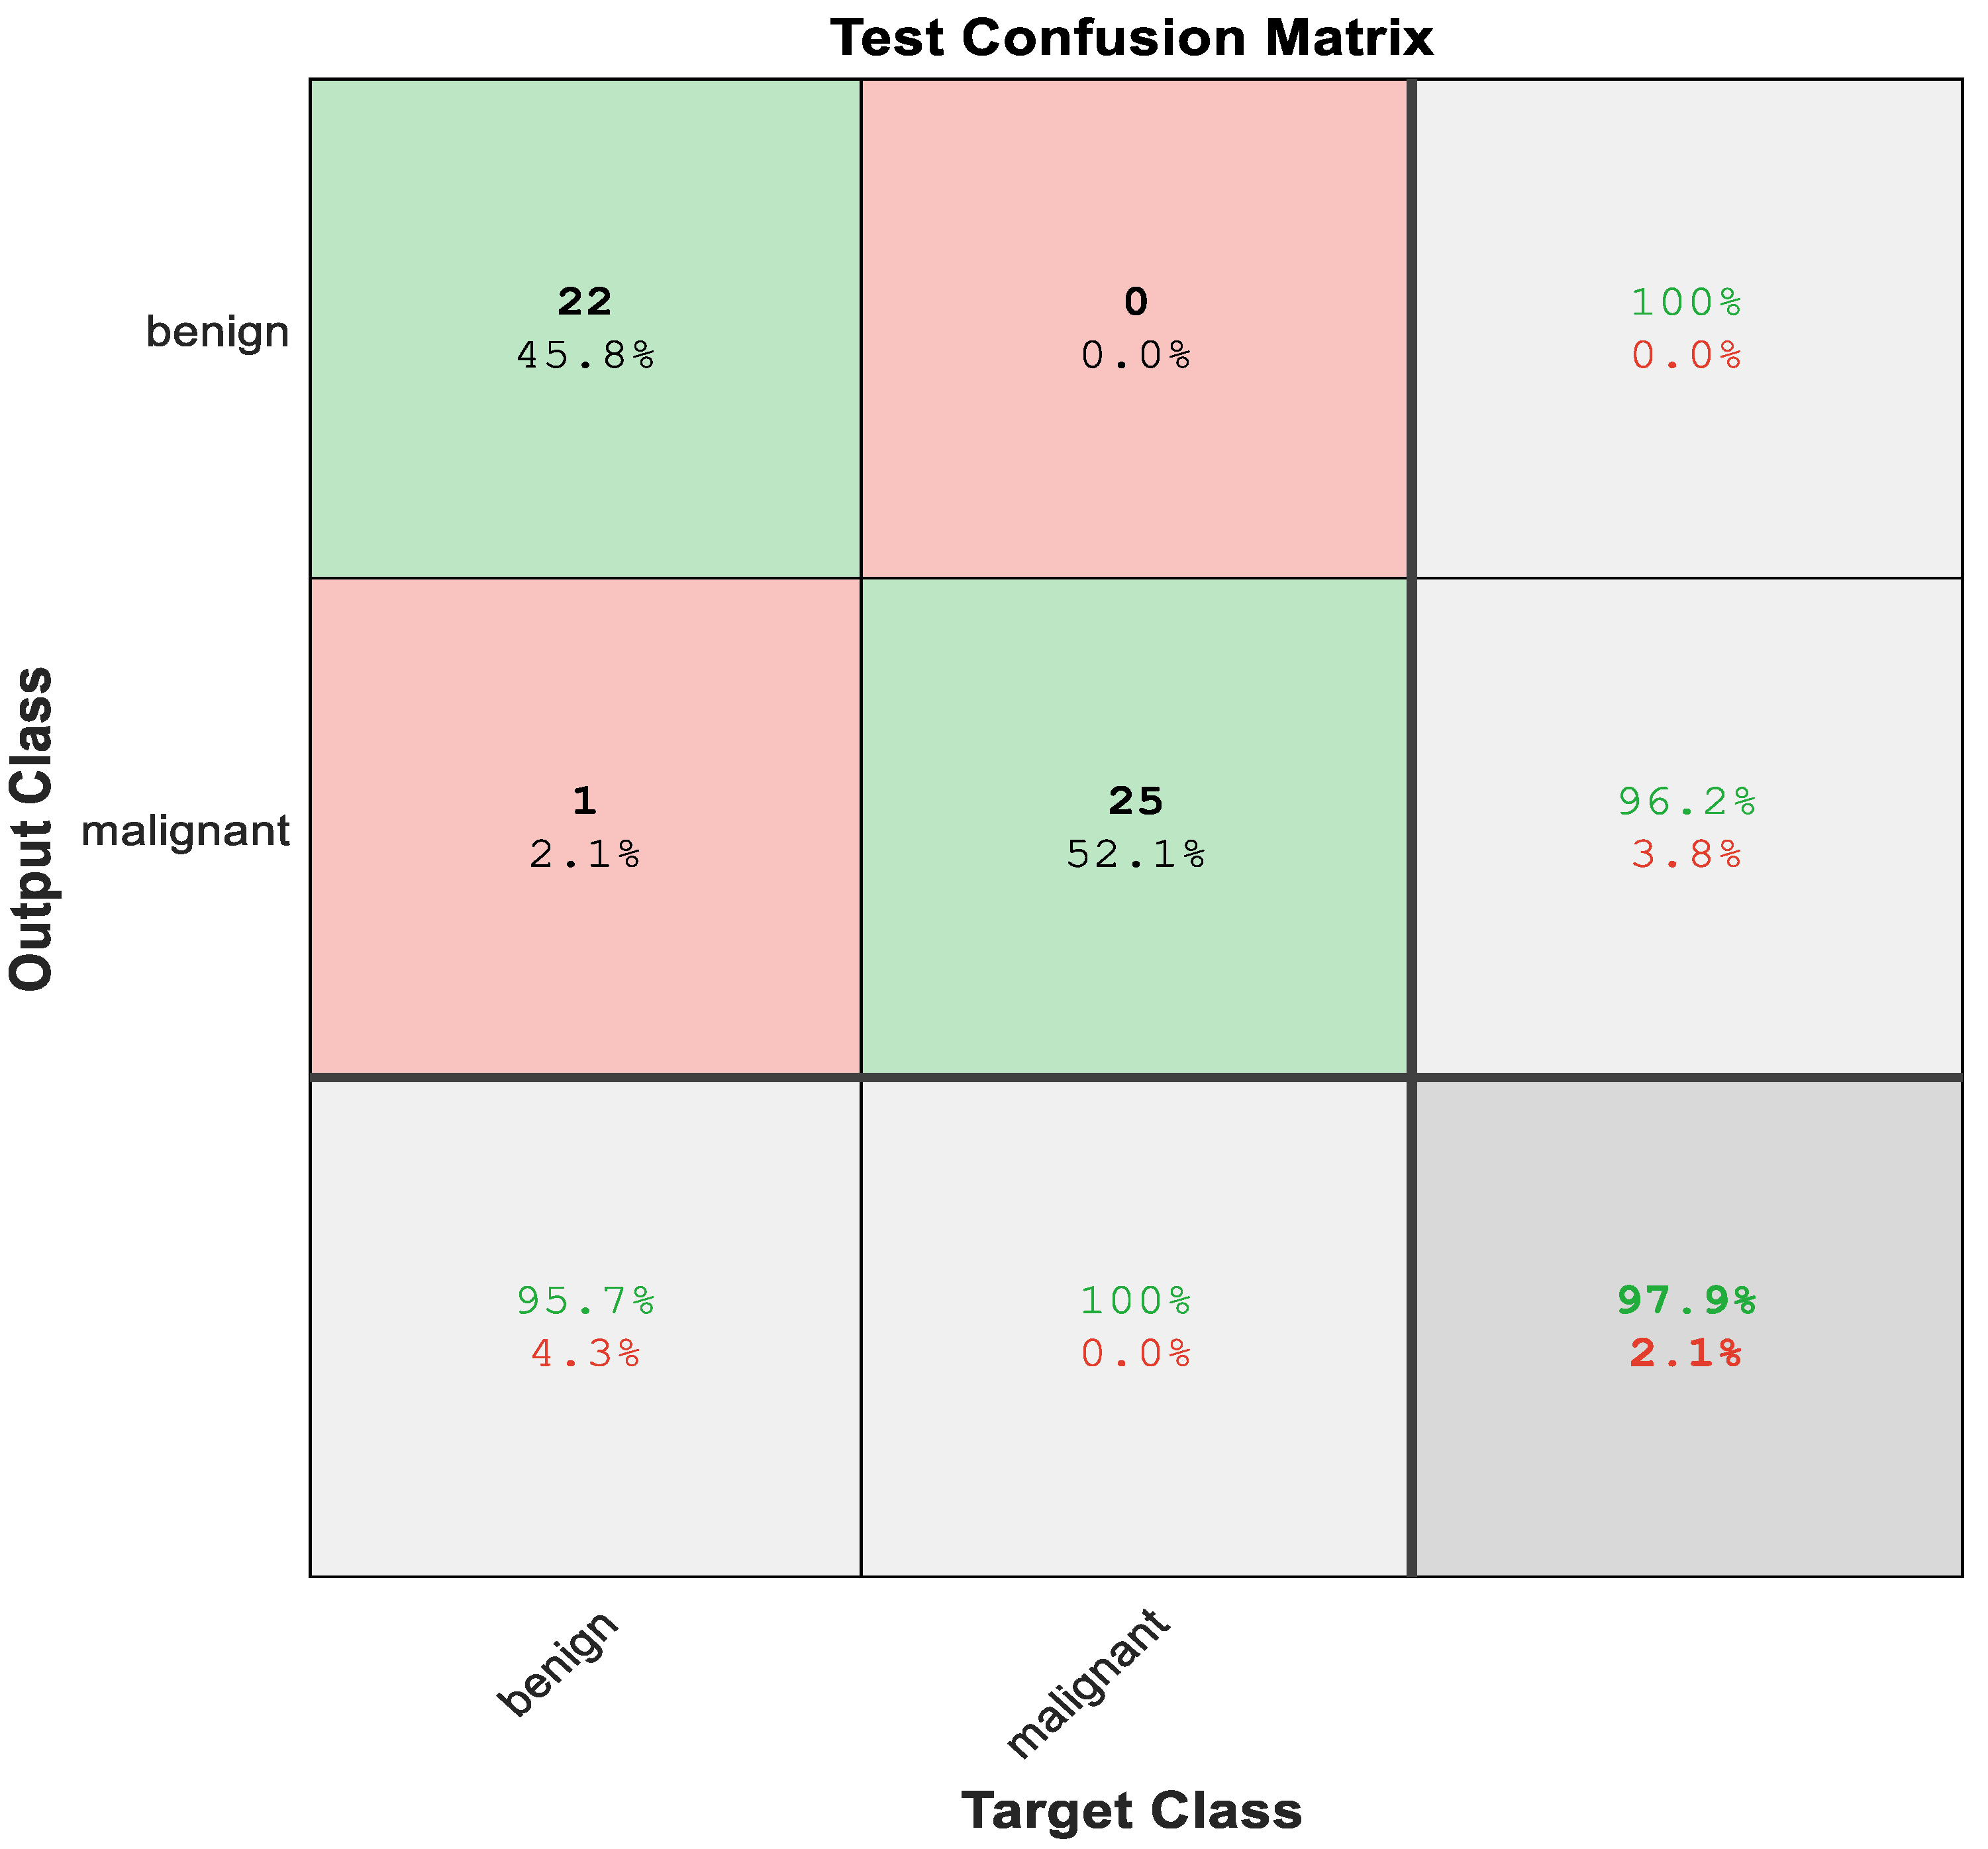
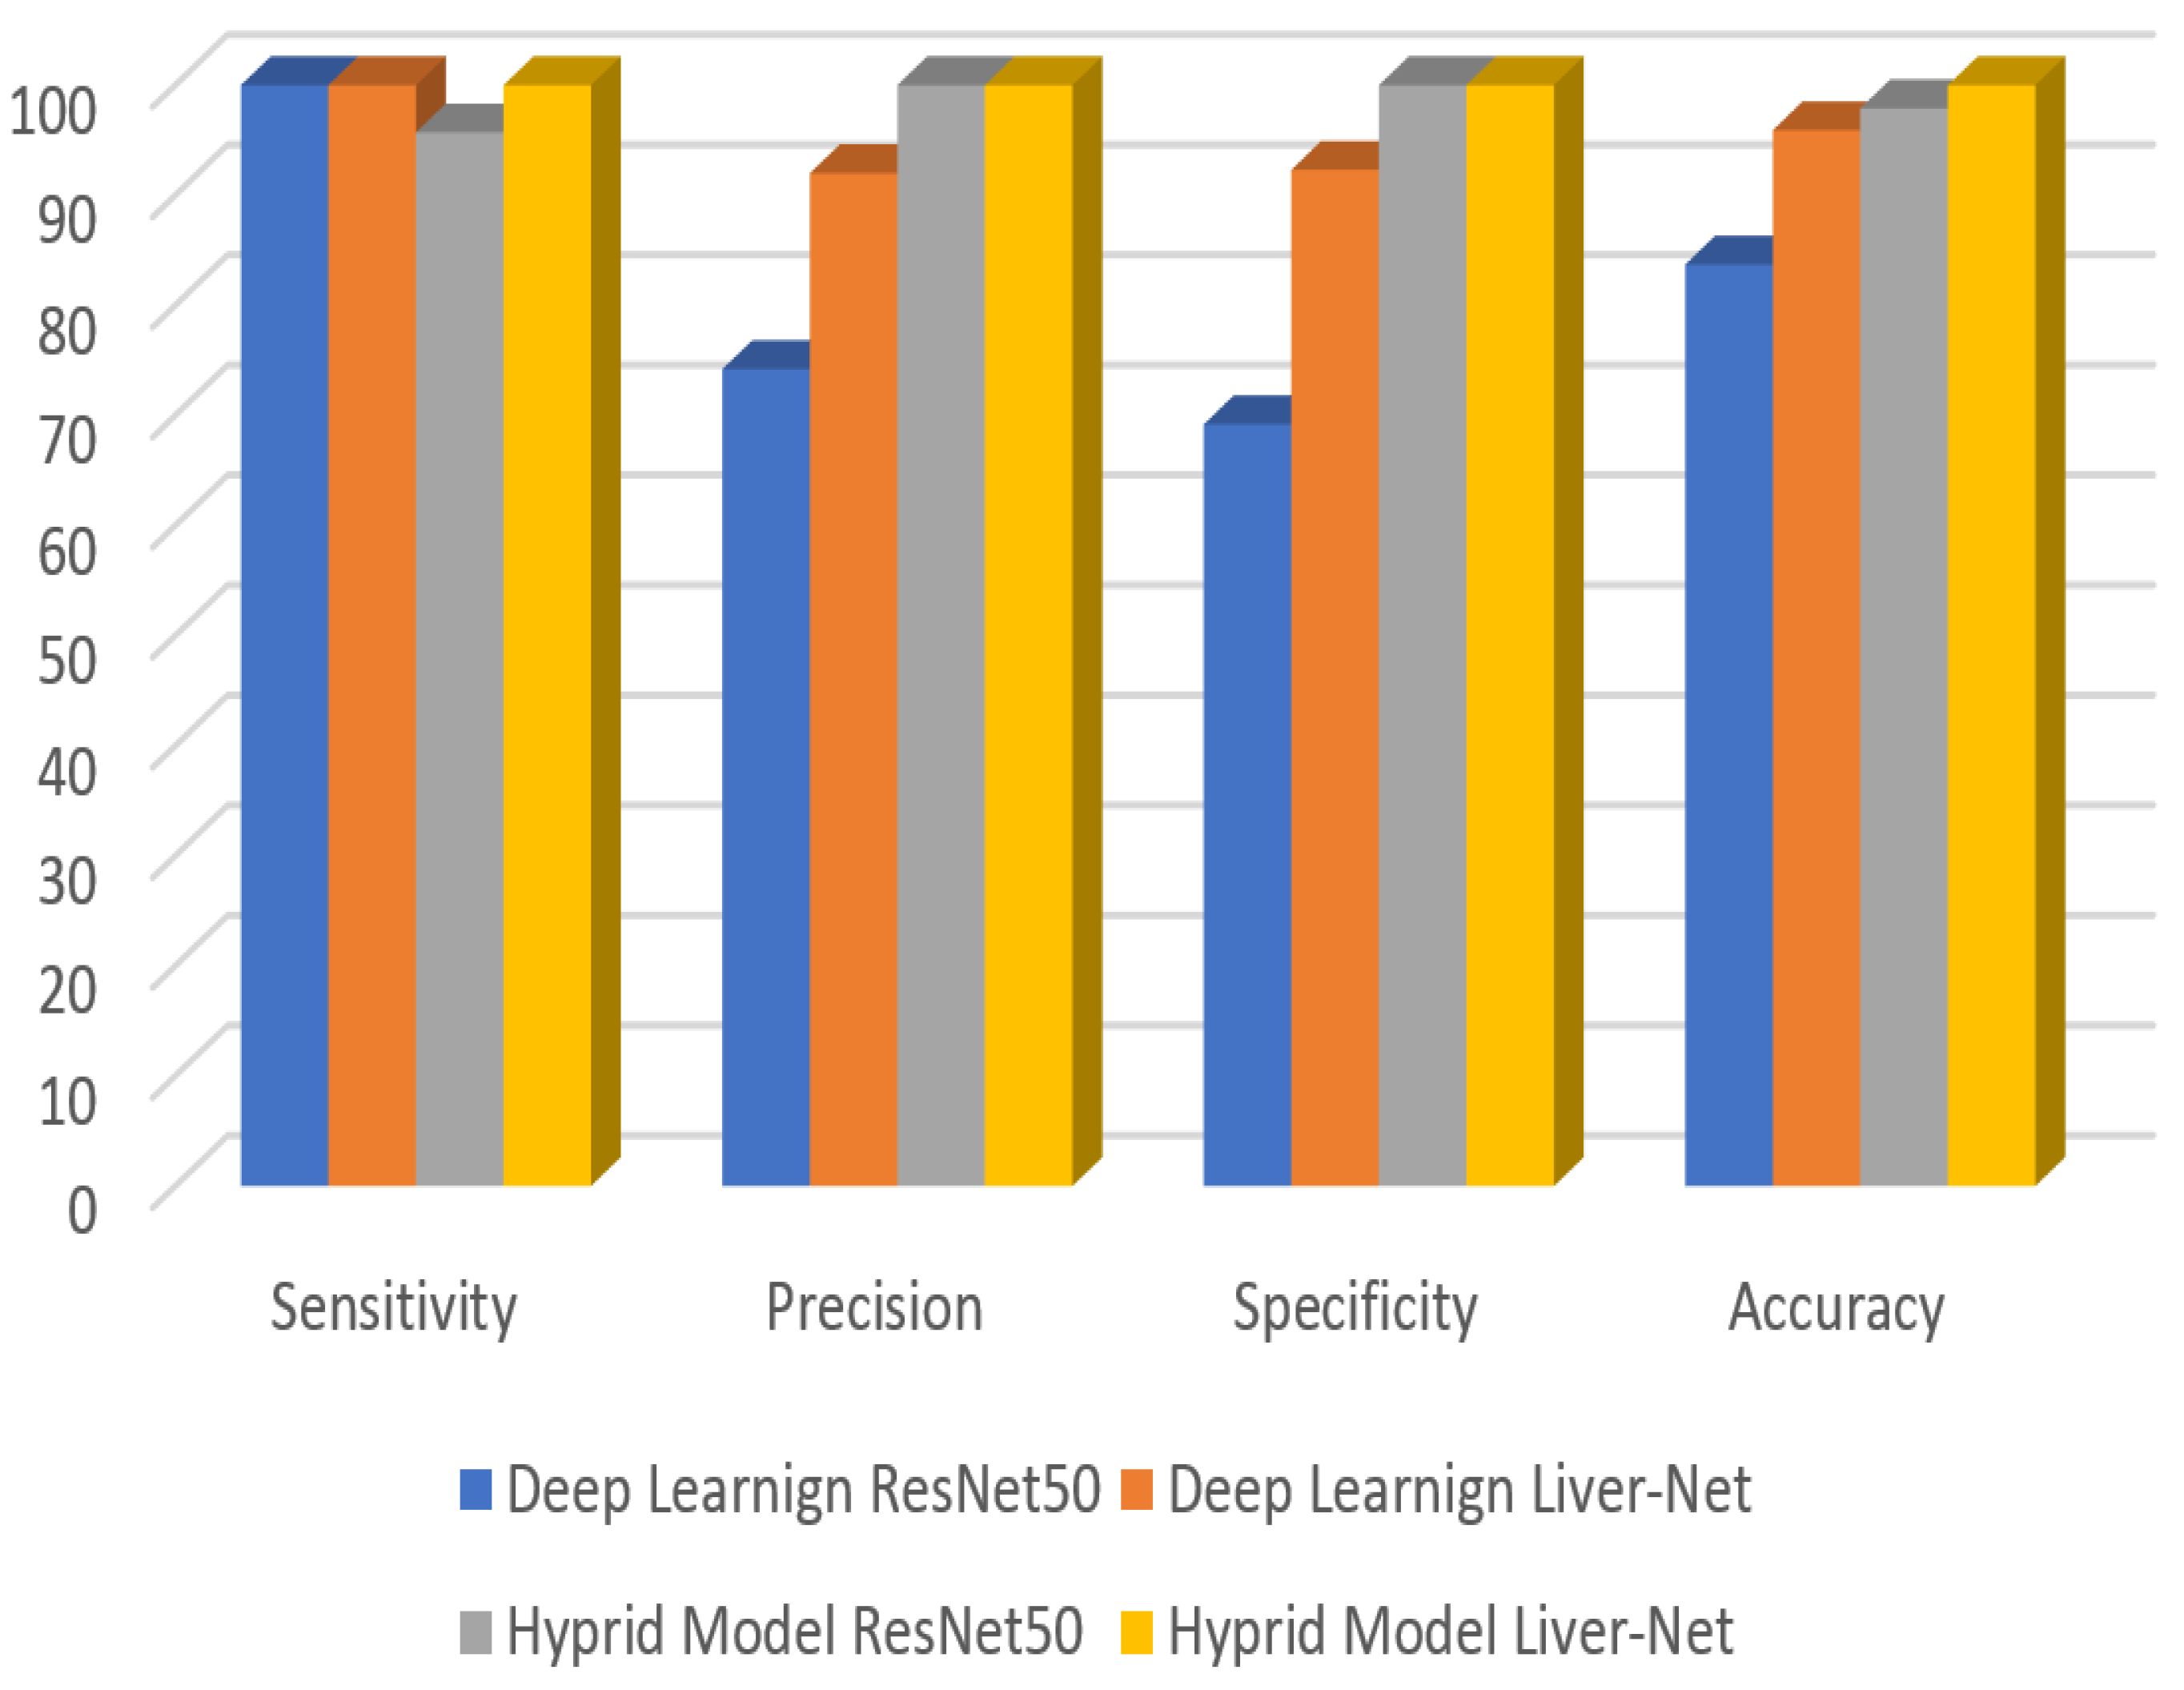
| Method | Sensitivity | Precision | Specificity | Accuracy | |
|---|---|---|---|---|---|
| Deep Learning | ResNet50 | 100 | 74.2 | 69.2 | 83.7 |
| LiverNet | 100 | 92 | 92.3 | 95.9 | |
| Hybrid Model | ResNet50 | 95.7 | 100 | 100 | 97.9 |
| LiverNet | 100 | 100 | 100 | 100 |
Publisher’s Note: MDPI stays neutral with regard to jurisdictional claims in published maps and institutional affiliations. |
© 2022 by the authors. Licensee MDPI, Basel, Switzerland. This article is an open access article distributed under the terms and conditions of the Creative Commons Attribution (CC BY) license (https://creativecommons.org/licenses/by/4.0/).
Share and Cite
Alawneh, K.; Alquran, H.; Alsalatie, M.; Mustafa, W.A.; Al-Issa, Y.; Alqudah, A.; Badarneh, A. LiverNet: Diagnosis of Liver Tumors in Human CT Images. Appl. Sci. 2022, 12, 5501. https://doi.org/10.3390/app12115501
Alawneh K, Alquran H, Alsalatie M, Mustafa WA, Al-Issa Y, Alqudah A, Badarneh A. LiverNet: Diagnosis of Liver Tumors in Human CT Images. Applied Sciences. 2022; 12(11):5501. https://doi.org/10.3390/app12115501
Chicago/Turabian StyleAlawneh, Khaled, Hiam Alquran, Mohammed Alsalatie, Wan Azani Mustafa, Yazan Al-Issa, Amin Alqudah, and Alaa Badarneh. 2022. "LiverNet: Diagnosis of Liver Tumors in Human CT Images" Applied Sciences 12, no. 11: 5501. https://doi.org/10.3390/app12115501
APA StyleAlawneh, K., Alquran, H., Alsalatie, M., Mustafa, W. A., Al-Issa, Y., Alqudah, A., & Badarneh, A. (2022). LiverNet: Diagnosis of Liver Tumors in Human CT Images. Applied Sciences, 12(11), 5501. https://doi.org/10.3390/app12115501