1. Introduction
Safety-critical intelligent automotive systems such as autonomous driving systems, advanced driver assistant systems, and driver-by-wire systems require stringent dependability while the systems are in operation. Therefore, safety and reliability issues must be addressed in the development of safety-critical systems. When the vehicle control functions are implemented by electronic control systems, functional safety issues become so critical that such systems should be developed with strict safety requirements. Furthermore, safety issues should be considered with the highest priority during the whole lifecycle of a safety-critical system. To carry out such safety-oriented system development, the functional safety standard, ISO-26262, was established [
1].
ISO-26262 was first published in 2011, specific to the application sector of electrical and/or electronic (E/E) systems within road vehicles. The primary purpose of this standard is to conduct a safety life cycle for electronic systems. ISO-26262 has been accepted worldwide as the technical “state-of-the-art” for safety-critical automotive systems [
2]. In ISO-26262, a safety life cycle includes the concept phase, product development phase, and the production and operation planning phase. During the safety life cycle, considered issues cover initialization of the product concept, specification establishment, product design, and pre-production tests. All these issues put emphasis on functional safety consideration. At the product development phase, the V-model [
3] is adopted as the primary design, verification, and validation flow. This phase is further divided into three different levels: System level, hardware level, and software level. For these levels, functional safety requirements are verified and validated through failure mode and effect analysis (FMEA), fault tree analysis (FTA), and safety-related metrics.
The ISO-26262 standard adopts the ASILs (Automotive Safety Integrity Levels) to measure whether the developed systems have achieved the demanded safety level or not. There are four ASILs defined in the standard—from A to D, where ASIL A defines the lowest and ASIL D defines the highest safety level. More strict requirements need to be fulfilled if a higher ASIL is specified.
In this study, based on the ISO-26262 functional safety standard, we propose a safety-oriented hardware architecture exploration framework for safety-critical automotive systems. The proposed framework integrates the hardware architecture exploration algorithms with the FTA-based weak-point analysis to quickly find an efficient system solution that complies with the ISO-26262 ASIL requirement as well as the hardware overhead constraint. We employ the autonomous emergency braking (AEB) system to demonstrate the effectiveness of the proposed design framework. The AEB system integrates the brake-by-wire system proposed in [
4] with automotive radar sensors and a speed sensor to implement a front-vehicle collision avoidance system.
The paper is organized as follows.
Section 2 discusses the related works and
Section 3 introduces the ISO-26262 hardware architecture metrics. The safety-oriented system hardware exploration framework a including fault tree analysis with vulnerability identification, safety mechanism deployment, and hardware overhead constraint conformation is proposed in
Section 4. A case study demonstration is illustrated in
Section 5. Conclusions and future works appear in
Section 6.
2. Related Works
To implement the safety-oriented system architecture exploration framework, there are two infrastructural technical bases; one is the safety analysis and the other is the safety improvement. In this section, related works for these two technical bases are discussed and compared to our proposed framework.
In [
5], an accurate and well-explained practical guide to the specific techniques appropriate for PMHF (probabilistic metric for hardware failure) calculation using FTA was proposed. This paper presented a structured and systematic quantitative FTA while showing various schemes for calculating the PMHF considering both single-point faults and dual-point latent faults. In [
6], the author performed quantitative assessments of ISO-26262 hardware architecture metrics by means of a fault tree analysis. A custom coverage gate was firstly proposed to represent the diagnostic coverage related to a safety mechanism. The advantage of introducing the coverage gate is to reduce the complexity of fault tree construction. The author of [
7] presented generalized formulas for the calculation of PMHF in non-redundant and redundant subsystems using observable parameters, such as the failure rate of a mission function and a safety mechanism, the diagnostic coverages of the primary and secondary safety mechanisms, and the diagnostic period of the secondary safety mechanisms to expand the scope of the application according to ISO 26262. A mixed model based on FTA and the Markov chain was proposed in [
8] to evaluate random hardware failures of the whole-redundancy system in ISO 26262. The mixed model presented in [
8] tried to solve the problem of calculating the PMHF in the whole-redundancy system, whose fault tree only contains several dynamic logic gates.
Another study [
9] illustrated the application of hardware reliability calculation procedures according to the ISO 26262 standard. This paper described computational procedures with the derivation and explanation of mathematical formulas for various hardware architectures of electronic systems. The described formulas consider the impact of multiple failures and the impact of self-tests, but the formulas are relatively simple. The research in [
10] aimed to provide a framework for quantitative FTAs, while considering periodic inspections and repairs, which are the key assumption of the standard. The framework is based on models of the Markov stochastic process and the PMHF equations derived from those models. Further research [
11] considered the design-phase safety analysis of vehicle guidance systems. The proposed approach constructed dynamic fault trees (DFTs) to model a variety of safety concepts and E/E architectures for drive automation. Our previous work [
12] proposed an FTA-based weak-point analysis methodology for the safety-critical automotive systems, but only the safety metric, PMHF, was considered.
On the other hand, previous literature [
13,
14,
15,
16,
17,
18,
19,
20,
21,
22,
23] has demonstrated how to accomplish safety improvement through architecture exploration, which take both the overall system safety and hardware overhead as the design metrics. Reference [
13] was a survey paper that collected and compared the published literatures addressing the safety-oriented system architecture exploration in recent years. According to [
13], combined with our survey results, we find that recent studies [
14,
15,
16,
17,
18,
19,
20,
21,
22,
23] have proposed the feasible solutions for safety-aware hardware cost-optimization techniques. The main idea of [
14,
15,
16,
17] is to identify the removable hardware elements in an existing system hardware architecture so the system safety and operation performance requirements can still be met. For example, a processor core is removable if the tasks allocated to this processor can be ported to other processors without violating the safety and timing requirements. Therefore, the hardware overhead can be reduced after removing these identified hardware elements. However, the proposed techniques [
14,
15,
16,
17] can only meet the requirement of one single safety-related design metric. Thus, these techniques are not feasible for systems with more than one safety-related design metric to be fulfilled.
The core concept of references [
18,
19,
20,
21,
22,
23] is very similar. The proposed hardware architecture exploration frameworks in these studies tried to satisfy the system safety requirements in compliance with the target ASIL first and then reduce the hardware overhead through the ASIL decomposition, which is a technique adopted in ISO-26262 for cost-effective considerations. After applying ASIL decomposition, hardware elements or subsystems with a higher ASIL can be decomposed into hardware elements with lower design complexity, and the required ASIL can be lowered accordingly. In such a way, the overall hardware overhead can be effectively reduced. Furthermore, verification and testing efforts can also be reduced due to the lowered ASIL. However, these papers only considered the ideal case, i.e., the ASIL decomposition is feasible. For real automotive systems, ASIL decomposition may not allow the hardware elements to be in hardcore form when they are provided by the suppliers. Thus, the proposed methodology in [
18,
19,
20,
21,
22,
23] would be limited to only the systems that the ASIL decomposition allows. To avoid such a limitation, the proposed hardware architecture exploration framework in this study does not adopt ASIL decomposition as the main scheme for hardware overhead reduction.
Compared to the previous works, the advantages of the proposed architecture exploration framework in this study primarily concern the following two aspects:
- (1)
Complying with more safety-related design metrics.
The safety-aware architecture exploration methodologies proposed in the literature tend to only comply with an overall system reliability or PMHF safety metric requirement. However, PMHF is only one of the three safety metrics required in ISO-26262. In fact, two other specific safety-related design metrics, the single-point fault metric (SPFM) and latent-fault metric (LFM), also play important roles in safety-critical design, especially when ISO-26262 is the primary safety norm to be complied with. Thus, we should consider SPFM, LFM, and PMHF metrics holistically. Otherwise, the developed safety-critical system could still contain unknown safety vulnerability, which could lead to reliability and safety problems and violate the requirements of ISO-26262. For example, if multiple-point faults in a system are not considered, then latent faults could exist in such a system. Therefore, specific safety-related design metrics such as SPFM and LFM representing the fault-tolerant capabilities of single-point faults and multiple-point faults are required to be defined and fulfilled. In this study, the proposed safety-oriented system architecture exploration framework is highly customized for ISO-26262. We specify the three safety-related design metrics, SPFM, LFM, and PMHF, requested by ISO-26262 as the primary targets to be achieved for safety-critical automotive systems. Thus, the proposed framework can assure that the obtained system architecture can fulfill the safety requirements for single-point and multiple-point fault tolerance as well as overall system reliability and safety.
- (2)
Satisfying safety-related design metrics and hardware overhead constraints simultaneously in a very limited number of design iterations.
In addition to the safety-related design metrics required by ISO-26262, the proposed system architecture exploration framework also takes hardware overhead into account. Thus, there are four design metrics to be satisfied so that the high-design-complexity problem, as encountered in previous works [
13,
14,
15,
16,
17,
18,
19,
20,
21,
22,
23], arises to be resolved. In this work, we show that the proposed hardware architecture exploration framework only requires a very limited number of design iterations to achieve a system hardware architecture that simultaneously satisfies the three safety-related design metrics and hardware overhead constraints through a real safety-critical automotive system demonstration.
3. ISO-26262 Hardware Architecture Metrics
Failure mode, effect, and diagnostic analysis (FMEDA) is a systematic analysis technique to obtain subsystem/product level failure rates, failure modes, and diagnostic capability. The main purpose of FMEDA in ISO-26262 is to evaluate hardware architecture metrics and safety goal violations due to random hardware failures and provide sufficient information to improve safety gaps if the required hardware safety level is not fulfilled. The hardware architecture metrics include the single-point fault metric (SPFM), latent-fault metric (LFM), and probabilistic metric for hardware failure (PMHF). SPFM reflects the robustness of the item to single-point and residual faults by either coverage from safety mechanisms or design (primarily safe faults). A high SPFM implies that the proportion of single-point faults and residual faults in the hardware of the item is low. LFM reflects the robustness of the item to latent faults by either coverage of faults in safety mechanisms or by the driver recognizing that the fault exists before the violation of the safety goal, or by design (primarily safe faults). A high latent-fault metric implies that the proportion of latent faults in the hardware is low. Finally, PMHF is a probabilistic metric for evaluating the violation of the considered safety goal due to random hardware failure.
Table 1 lists the target values for SPFM, LFM, and PMHF under different ASILs. It is worth noting that there is no target value for ASIL A.
To acquire PMHF, SPFM, and LFM,
λS,
λSPF,
λRF, and
λDPF,L, which represent the failure rates associated with a safe fault, single-point fault (SPF), residual fault (RF), and latent dual-point fault (DPF), have to be derived in advance.
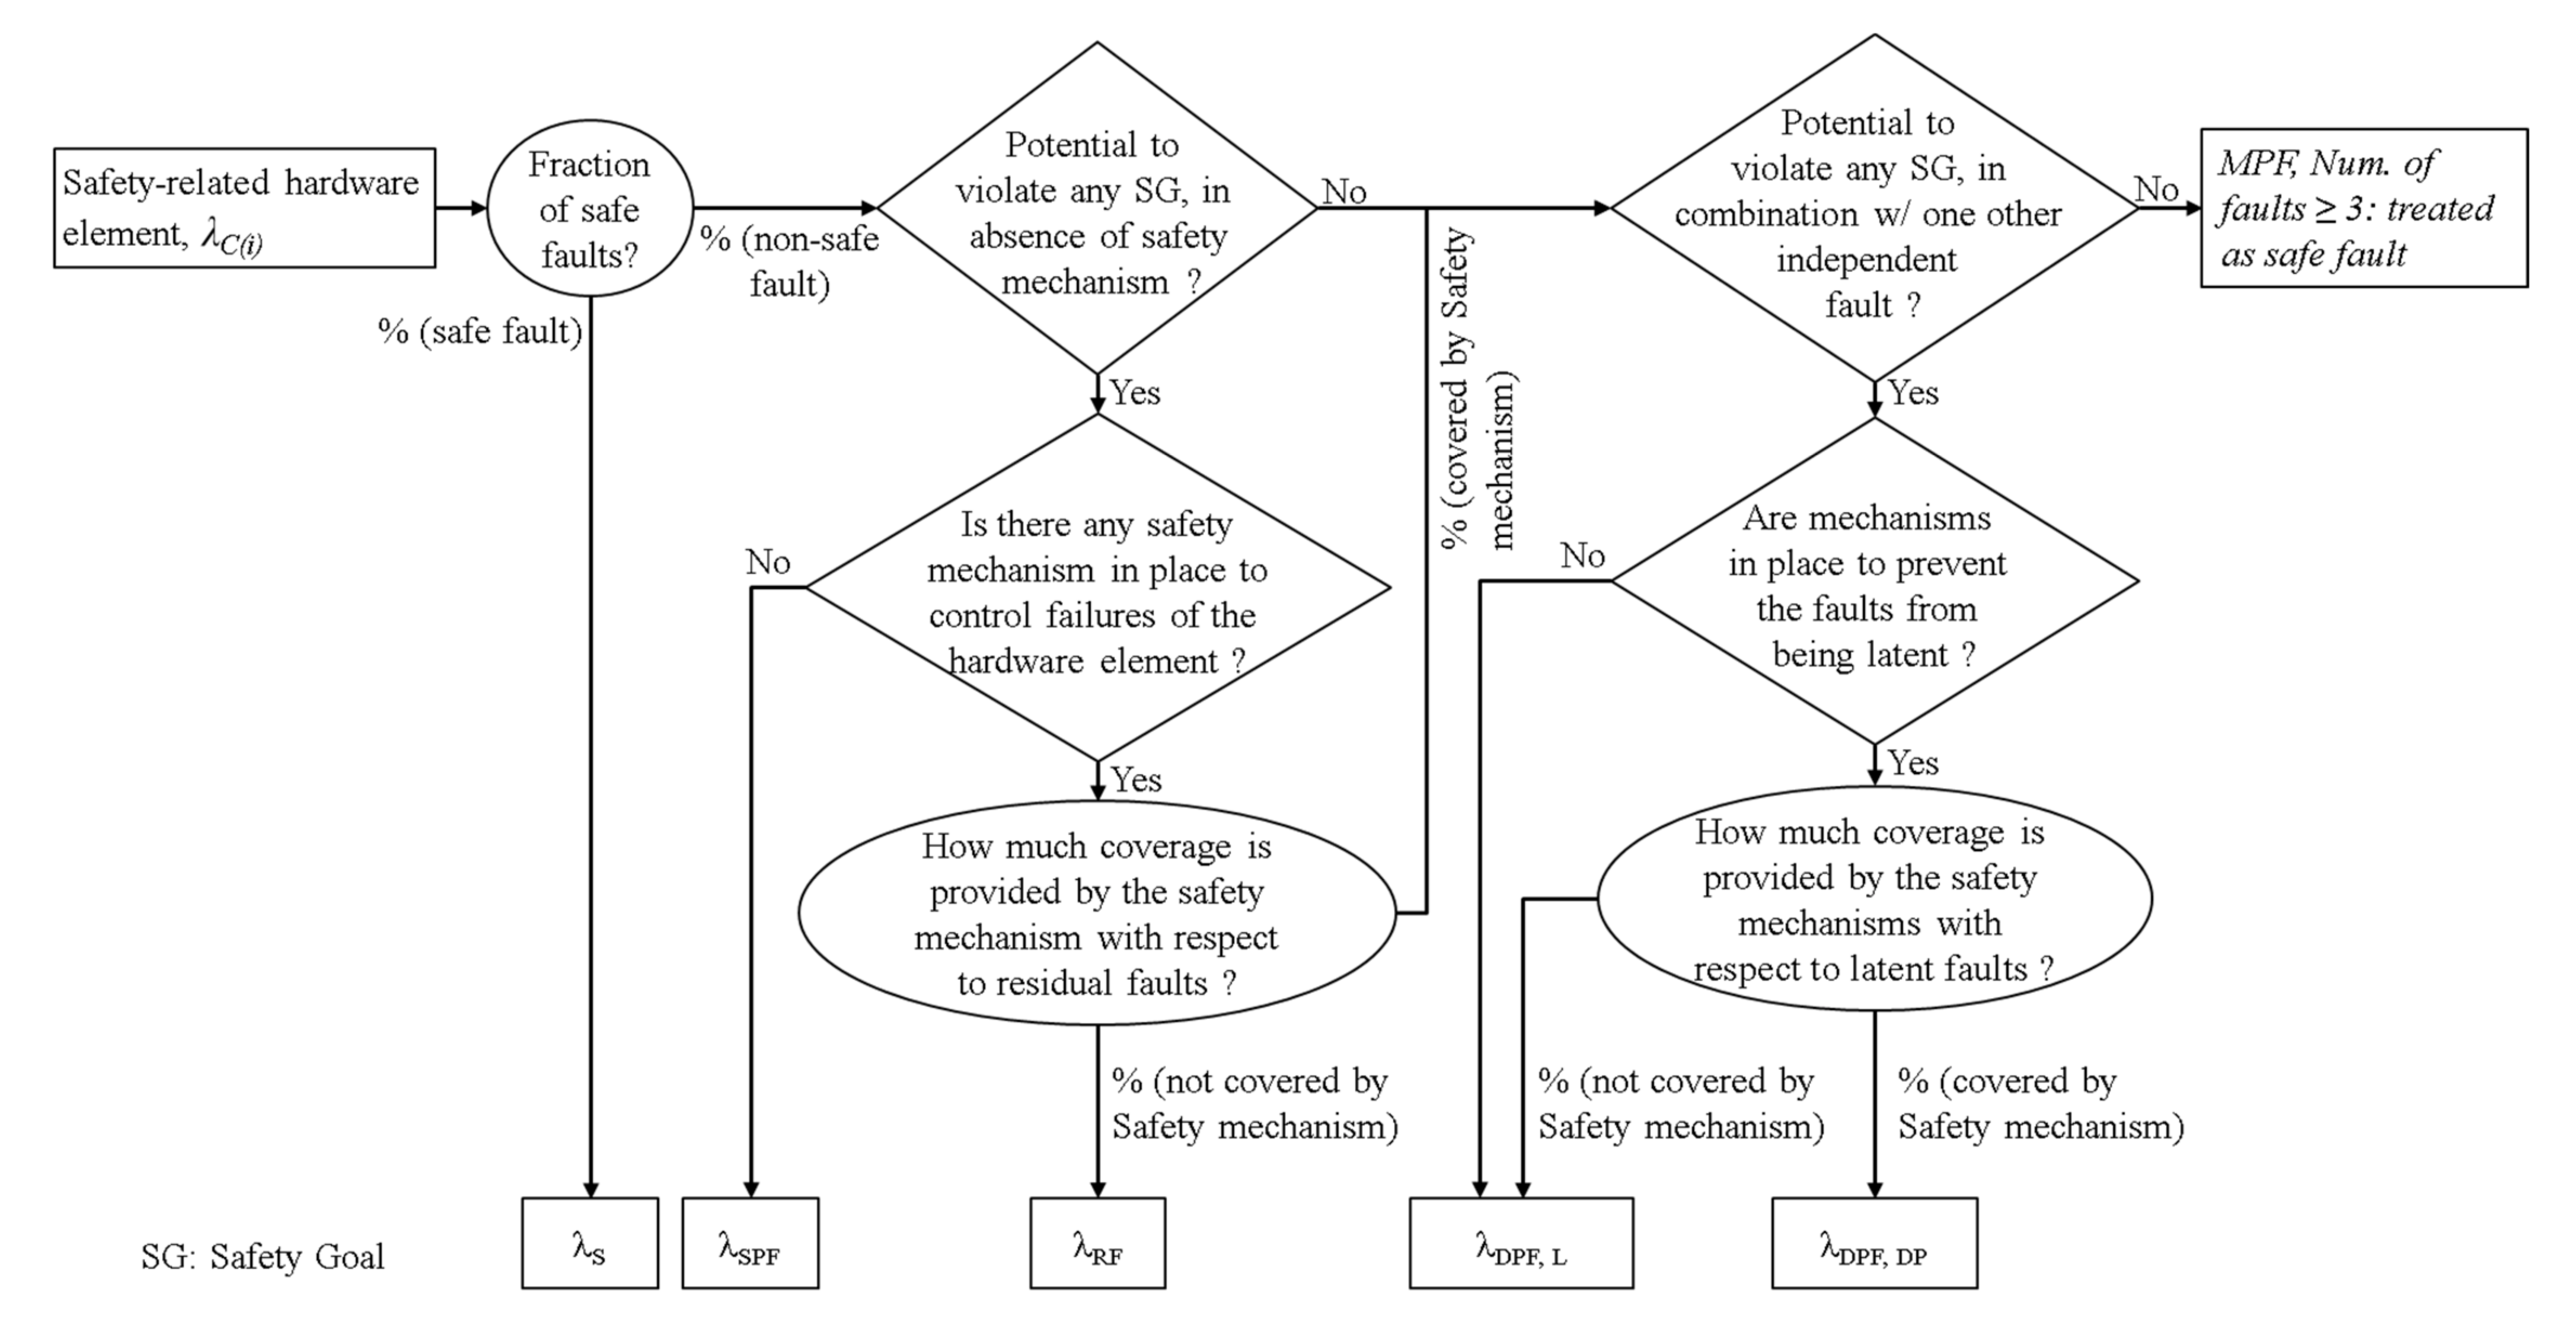
Figure 1 shows the failure rate calculation process according to ISO-26262, where
λC(i) is the failure rate of the
ith safety-related component
C(i) and assumes the system has
n number of safety-related elements.
For a safety-related hardware element,
C(i), its faults consist of safe and non-safe faults. The safe faults will not cause a safety goal violation. Therefore, only the non-safe faults could cause a safety goal violation and contribute to the
λSPF if there is no safety mechanism to protect the faults. If there is a safety mechanism to prevent the faults of
C(i) from causing a safety goal violation, then the faults not covered by the safety mechanism are identified as residual faults of
C(i), and the corresponding failure rate,
, can be derived from the following expression (1)
where
and
are the failure rate and the diagnostic coverage with respect to the residual faults of
C(i).
In
Figure 1, the faults of
C(i) that have no potential to directly cause the system to violate the safety goals are identified as multiple-point faults. There are two sources of the multiple-point faults; the first one is attributed to the single-point faults covered by the safety mechanism, and the second one is from faults that can cause the system to violate the safety goals only when the fault in
C(i) combines with one or more other independent faults. Because the probability of violation of the safety goal contributed to by three or more faults is low enough, we treat them as safe faults in this study. Thus, only the latent dual-point faults (DPF) are considered, which can be calculated by the following expression (2)
where
is the diagnostic coverage of
C(i) with respect to latent dual-point faults.
4. Safety-Oriented System Hardware Architecture Exploration Framework
In this study, we propose a safety-oriented system hardware architecture exploration framework whose goal is to achieve a system hardware architecture that complies with the ISO-26262 safety metrics and the hardware overhead constraint simultaneously.
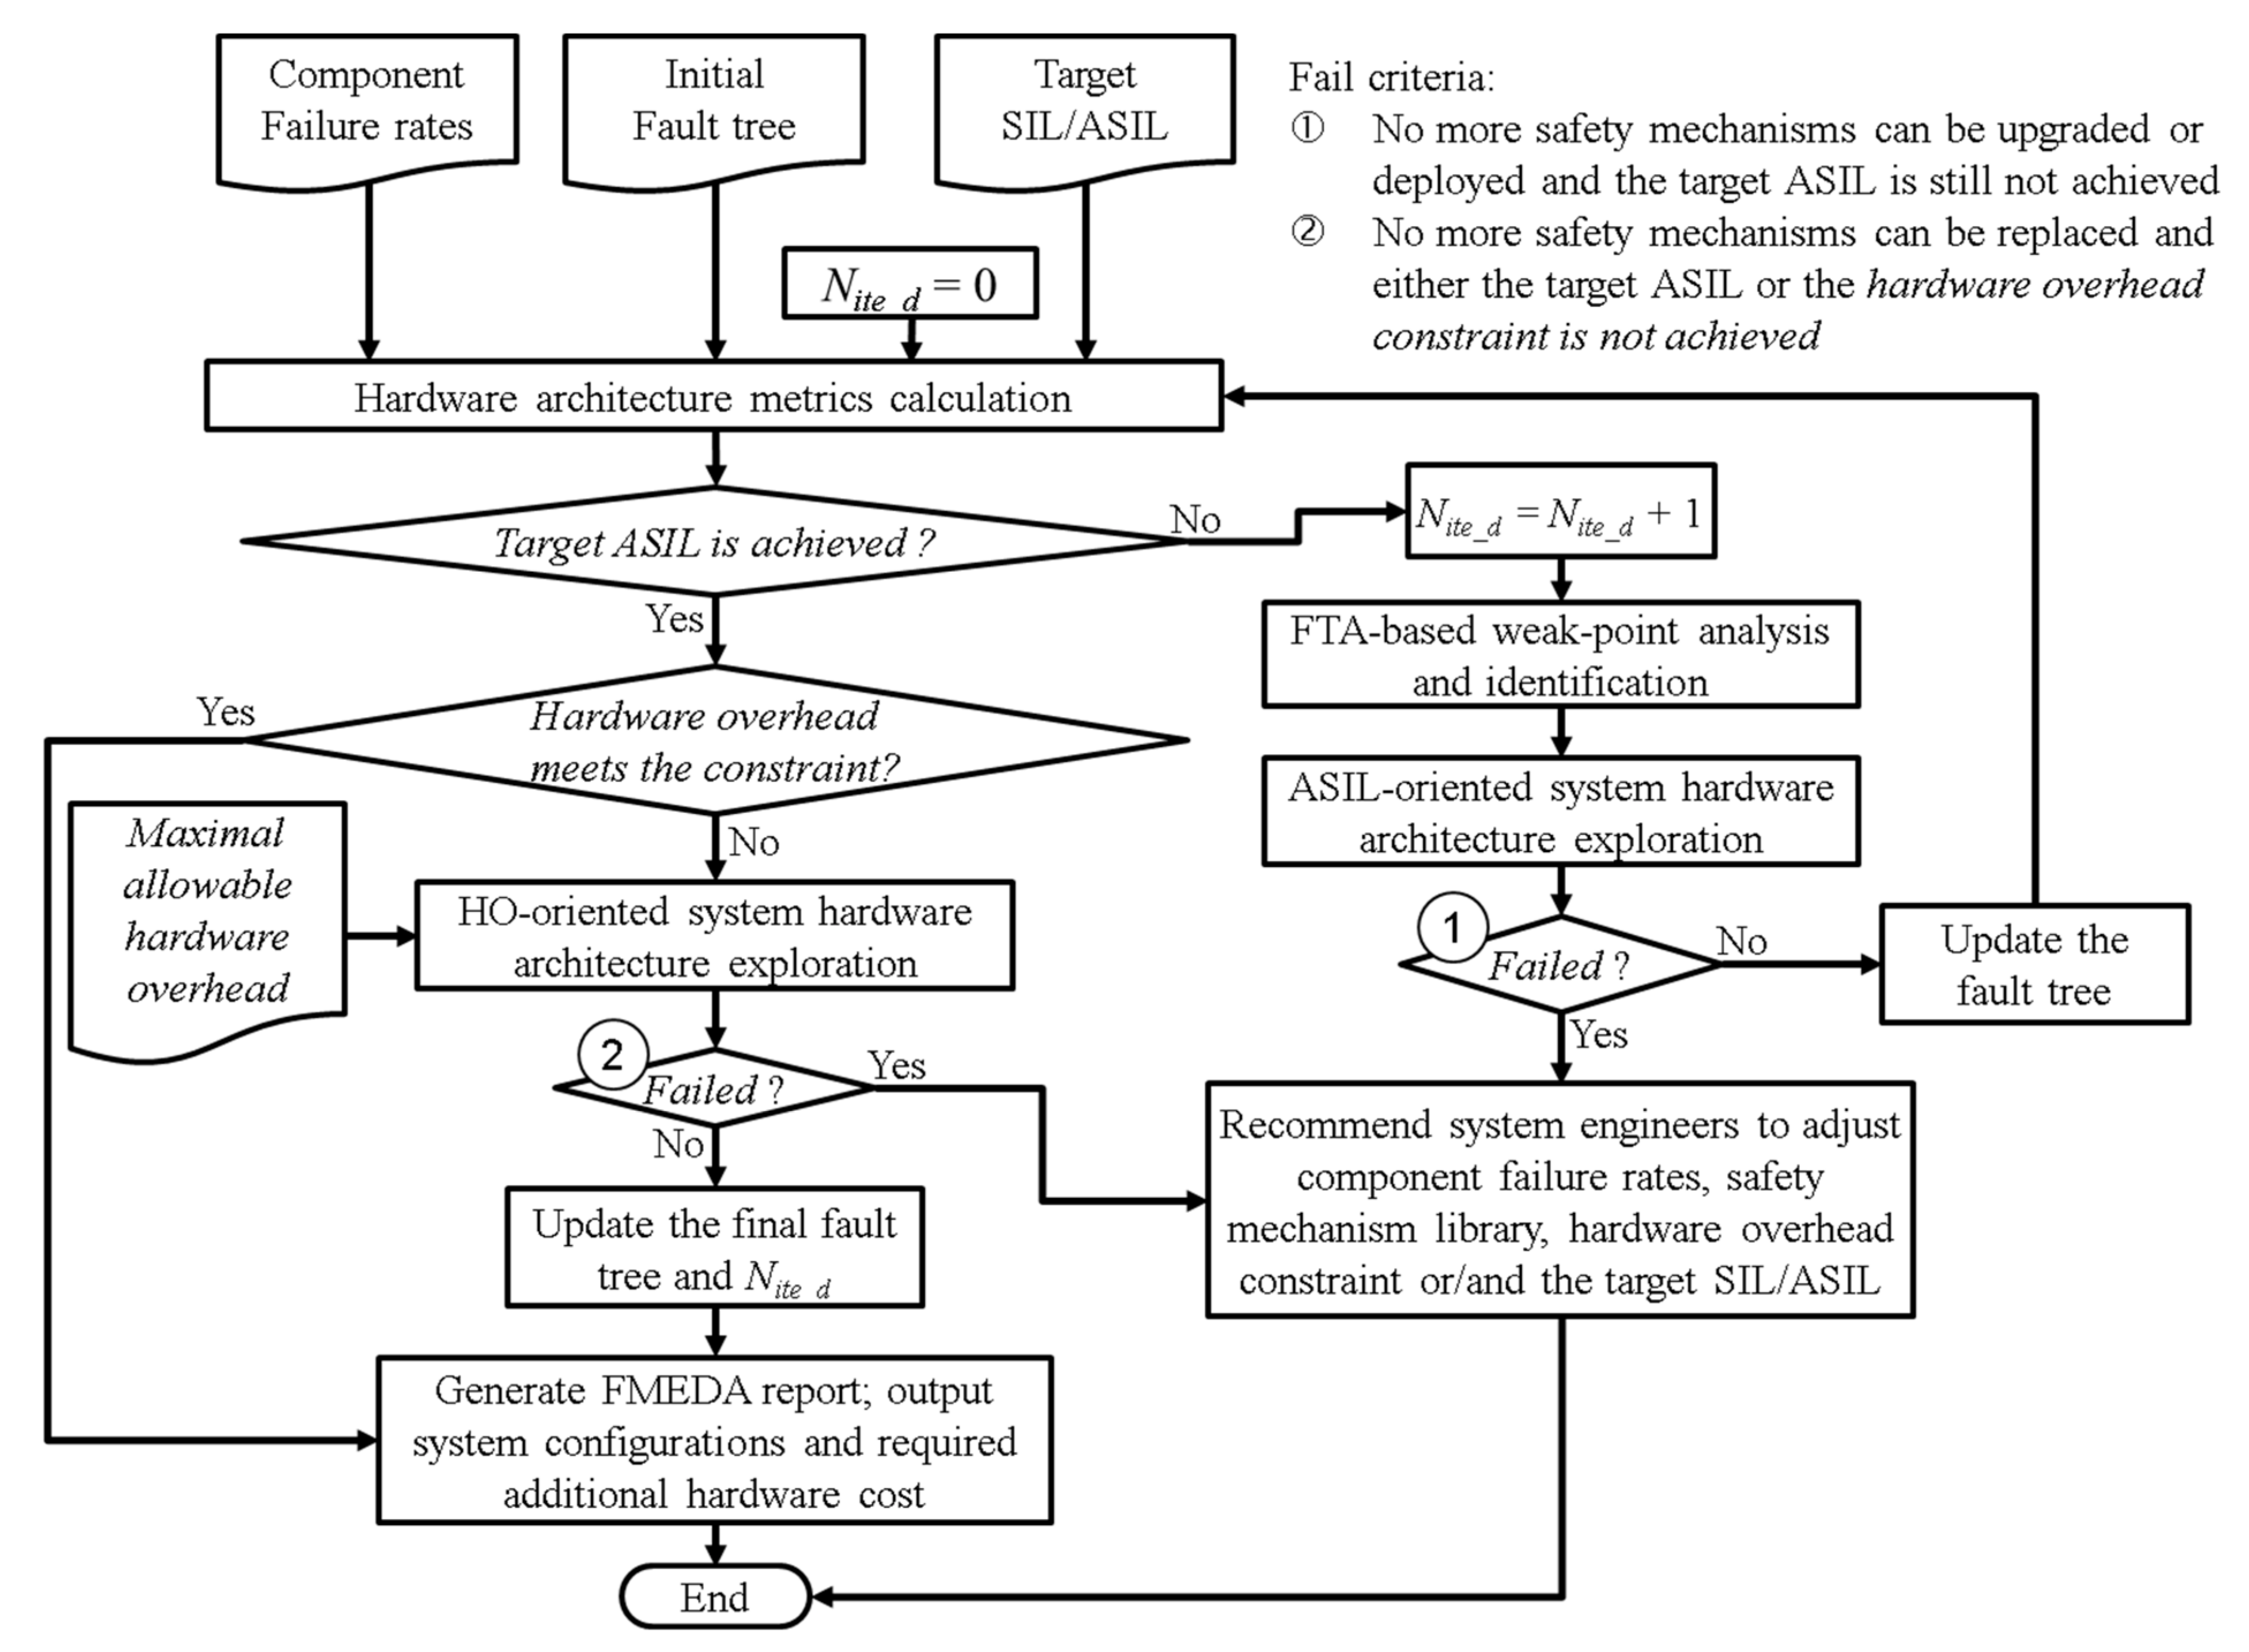
Figure 2 exhibits the overall flow of the proposed framework.
First, the ISO-26262 safety metrics are calculated for the initial system hardware architecture provided by the system engineers and compared to the target values to determine whether the target ASIL is achieved or not. If the target ASIL cannot be achieved, the safety-oriented system architecture exploration is performed to effectively apply appropriate safety mechanisms to reduce the whole system’s failure rates. Such system architecture exploration is repeated until all the safety metrics can be satisfied. After that, the system hardware architecture that meets the ASIL goal but fails to satisfy the hardware overhead constraint is used to further explore the final solution that satisfies the safety metrics and hardware overhead constraint simultaneously. The reason we consider the safety metrics and hardware overhead constraint sequentially is due to the complexity problem. The idea of our architecture exploration methodology is first to discover a feasible solution that meets the safety metrics, and then use that solution to adjust its hardware architecture to satisfy the safety metrics and hardware overhead constraint simultaneously. To address the issues of safety metrics and the hardware overhead constraint separately, our architecture exploration methodology can tackle the complexity problem well.
The safety-oriented system architecture exploration framework comprises the following three phases:
- i.
FTA-based weak-point analysis.
In this phase, we apply the well-known and widely adopted safety analysis methodology, fault tree analysis, to identify all the hardware elements that cause the safety metrics to be unachievable. Furthermore, we can utilize the quantitative FTA to evaluate the failure probabilities for the MCS (Minimal Cut Set) and determine the MCSs, which are the weak points of the system, by comparing their failure probabilities to the target failure probability for the required ASIL. The details for this analysis are illustrated in
Section 4.2.
- ii.
ASIL-oriented hardware architecture exploration algorithm.
In last phase, the hardware elements identified as weak points have been listed. Thus, the safety mechanisms need to be deployed to those hardware elements to reduce their failure rates. The issue for this phase is proposing an effective measure to evaluate the extent of failure rates reductions that are required to achieve the target ASIL goal and then recognize which safety mechanisms are sufficient for the identified hardware elements. The proposed ASIL-oriented hardware architecture exploration, which is introduced in
Section 4.3.2, can aptly address the safety issue to be solved.
- iii.
HO-oriented hardware architecture exploration algorithm.
In phase ii, the safety mechanisms are used to reach the target ASIL goal without considering the cost of hardware overhead induced from the deployed safety mechanisms. Thus, the additional hardware overhead could cause the overall system hardware cost to exceed the acceptable upper bound. To address this issue, we propose a hardware overhead (HO)-oriented hardware architecture exploration methodology. Through this methodology, the system hardware architecture with safety mechanism deployment derived from the previous phase is analyzed to recognize the bottleneck when the additional hardware overhead exceeds the constraint specified by the system engineers. Accordingly, the system hardware is adjusted to meet the safety metrics and hardware overhead constraint simultaneously. More details can be found in
Section 4.3.3.
After the safety-oriented system architecture exploration is accomplished and both the safety metrics and hardware overhead constraint are conformed, the final system hardware architecture can be obtained with additional hardware costs invested. Besides, the corresponding FMEDA report is also generated to provide more detailed information for the designers. The effectiveness of the proposed framework is demonstrated with an autonomous emergency braking system design as described in
Section 5.
In the following subsections, we will introduce the proposed safety-oriented system hardware architecture exploration framework and illustrate the details of the exploration process through a simple example.
4.1. Problem Formulation
Before the problem can be formalized, the following notations are defined first:
n: The number of safety-related hardware elements in the system;
C(i): The ith safety-related component, where 1 ≤ i ≤ n;
λC(i): Failure rate of the ith safety-related component;
λS, λSPF, λRF, and λDPF,L: The failure rates associated with a safe fault, single-point fault (SPF), residual fault (RF), and latent dual-point fault (DPF), respectively;
SPFMtar, LFMtar, and PMHFtar: The target values for SPFM, LFM, and PMHF in accordance with the target ASIL;
The target failure probability for achieving SPFMtar, LFMtar, and PMHFtar safety metrics at mission time t;
SPFMite_d, LFMite_d, and PMHFite_d: The values of SPFM, LFM, and PMHF in the dth design iteration, where d ≥ 0.
With the notations defined above, the main goal of the safety-oriented system hardware architecture exploration framework can be formalized as:
Based on
Table 1, the target values of
PMHFtar,
SPFMtar and
LFMtar can be determined according to the target ASIL. For example, if the target ASIL B is selected, then th
PMHFtar,
SPFMtar, and
LFMtar are specified as 10
−7 h
−1, 90%, and 60%, respectively. On the other hand,
PMHFite_d,
SPFMite_d, and
LFMite_d can be derived from the following formulae provided by ISO-26262 for the hardware architecture metrics calculation.
PMHFite_d can be calculated by the following expression (3)
Next,
SPFMite_d can be computed by the following expression (4)
where
represents the total failure rates of all safety-related hardware elements and can be calculated by
(assuming all failures are independent and follow the exponential distribution).
Moreover, the following expression can be derived from the safety requirement
SPFMite_d ≥ SPFMtar.
Lastly, the calculation of
LFMite_d is based on the following expression (6)
Similarly, the following expression can be derived from the safety requirement
LFMite_d ≥
LFMtar.
The failure rates
λS,
λSPF,
λRF, and
λDPF,L in expressions (3)–(7) can be derived from the process as exhibited in
Figure 1 and expressions (1) and (2) as shown in
Section 3.
4.2. FTA-Based Weak-Point Analysis
After PMHFite_d, SPFMite_d, and LFMite_d, are acquired, we can compare them with the target values to check whether the functional safety requirements can be fulfilled. When any requirement is violated, the current system hardware architecture should be analyzed to identify the main contributors to the safety goal violation. We term such an analysis as the weak-point analysis. The weak-point analysis should provide the precise basis to guide the deployment of a feasible safety mechanism for the vulnerable components so that all target values of the hardware architecture metrics can be achieved in an efficient and cost-effective manner.
In this study, we propose an effective weak-point analysis methodology based on fault tree analysis (FTA). FTA has been widely adopted as the primary system-level reliability modeling for decades. Besides, in ISO-26262, FTA is also recommended as the primary system-level safety analysis methodology. However, the concrete measures are not disclosed. To address this hiatus, we intend to illustrate how to locate the safety vulnerability in the system through the FTA approach. Before explaining the proposed FTA measures, the following notations need to be defined in advance:
FPMCS(t): The failure probability for an MCS at mission time t;
: The failure probability associated with the residual faults for a hardware element C(i) at mission time t;
: The failure probability associated with the latent dual-point faults for a hardware element C(i) at mission time t;
: The target failure rate to be achieved for satisfying the SPFM requirement with respect to the target ASIL;
: The target failure rate to be achieved for satisfying the LFM requirement with respect to the target ASIL;
: The target failure probability at mission time t to be achieved for satisfying the PMHF requirement with respect to the target ASIL;
: The target failure probability at mission time t to be achieved for satisfying the SPFM requirement with respect to the target ASIL;
: The target failure probability at mission time t to be achieved for satisfying the LFM requirement with respect to the target ASIL;
GapPMHF(MCSk): The quantified gap between the failure probability for the kth MCS in the system hardware and the at mission time t;
GapSPFM(MCSk): The quantified gap between the failure probability for the kth MCS in the system hardware and the at mission time t;
GapLFM(MCSk): The quantified gap between the failure probability for the kth MCS in the system hardware and the at mission time t.
First, we take the system to be analyzed as the input and construct the corresponding fault tree according to the system hardware architecture. The process of constructing a fault tree is out of this paper’s scope but has been comprehensively illustrated in previous literature [
5,
6,
7,
8,
9,
10,
11,
12,
24,
25,
26,
27,
28] either from the system preliminary hardware architecture or from the system-level simulation models. Thus, the details of fault tree construction are omitted in this study. After the fault tree is constructed, the FTA can be performed to list all the MCSs for the fault tree. Next, we classify all the listed MCSs into the following two types:
Single-point failure (SPF): MCS contains a single safety-related hardware element represented as {C(i)}.
- ■
The failure probability of the MCS belonging to SPF is calculated by the following expression
where
is the failure probability of the safety-related hardware element
C(i) at mission time
t.
Dual-point failure (DPF): MCS contains two hardware elements and id further classified into two kinds of constitution.
- ■
MCS consists of the safety-related hardware element and the safety mechanism to protect this safety-related hardware element, represented as {C(i), SMC(i)}.
The failure probability of such an MCS is computed by the following expression
where
and
where
and
represent the diagnostic coverage (DC) of safety mechanisms with regard to the residual faults and latent dual-point faults.
- ■
Any two safety-related hardware elements could lead to the safety goal violation only when these two hardware elements fail at the same time, represented as {C(i), C(j)}.
The failure probability of such an MCS is calculated by the following expression
With the above expressions (8)–(12), we can calculate the failure probability for each MCS. An MCS is marked as the safety vulnerability if this MCS’s failure probability is greater than or equal to , , or . For such an MCS, the safety mechanism must be deployed or upgraded (if existed) to reduce the failure rate of the hardware element(s) in this MCS. Otherwise, the requirements for achieving the target ASIL goal could never be fulfilled. We call such an MCS the MBP (Must-Be-Protected) weak points. There are MBPPMHF, MBPSPFM, and MBPLFM associated with the safety metrics of PMHF, SPFM, and LFM, respectively. On the contrary, an MCS is termed POD (Protected-On-Demand) if the failure probability is lower than , , and Similarly, an MCS could belong to the PODPMHF, PODSPFM, or PODLFM. It is worth noting that the requirements for reaching the target ASIL may still not be achieved even though all the listed MCS belong to the POD. Under these circumstances, we need to determine the most critical weak point and then deploy or upgrade the safety mechanism to the addressed hardware element so that the most effective failure rate reduction for the whole system can be assured.
For each MCS, the quantified gaps between and , and and are calculated through the following steps:
- a.
Calculate the and :
According to expression (5), we know that
SPFMtar can be achieved only when the total failure rates associated with the single-point faults and residual faults are less than
. Thus, the
can be specified by
Similarly, according to expression (7), the
can also be specified by
- b.
Calculate
,
, and
with the following expressions
- c.
Calculate GapPMHF(MCSk), GapSPFM(MCSk), and GapLFM(MCSk) for the kth MCS with the following expressions
Subsequently, the MCSk can be marked as the MBP or POD by the following criteria:
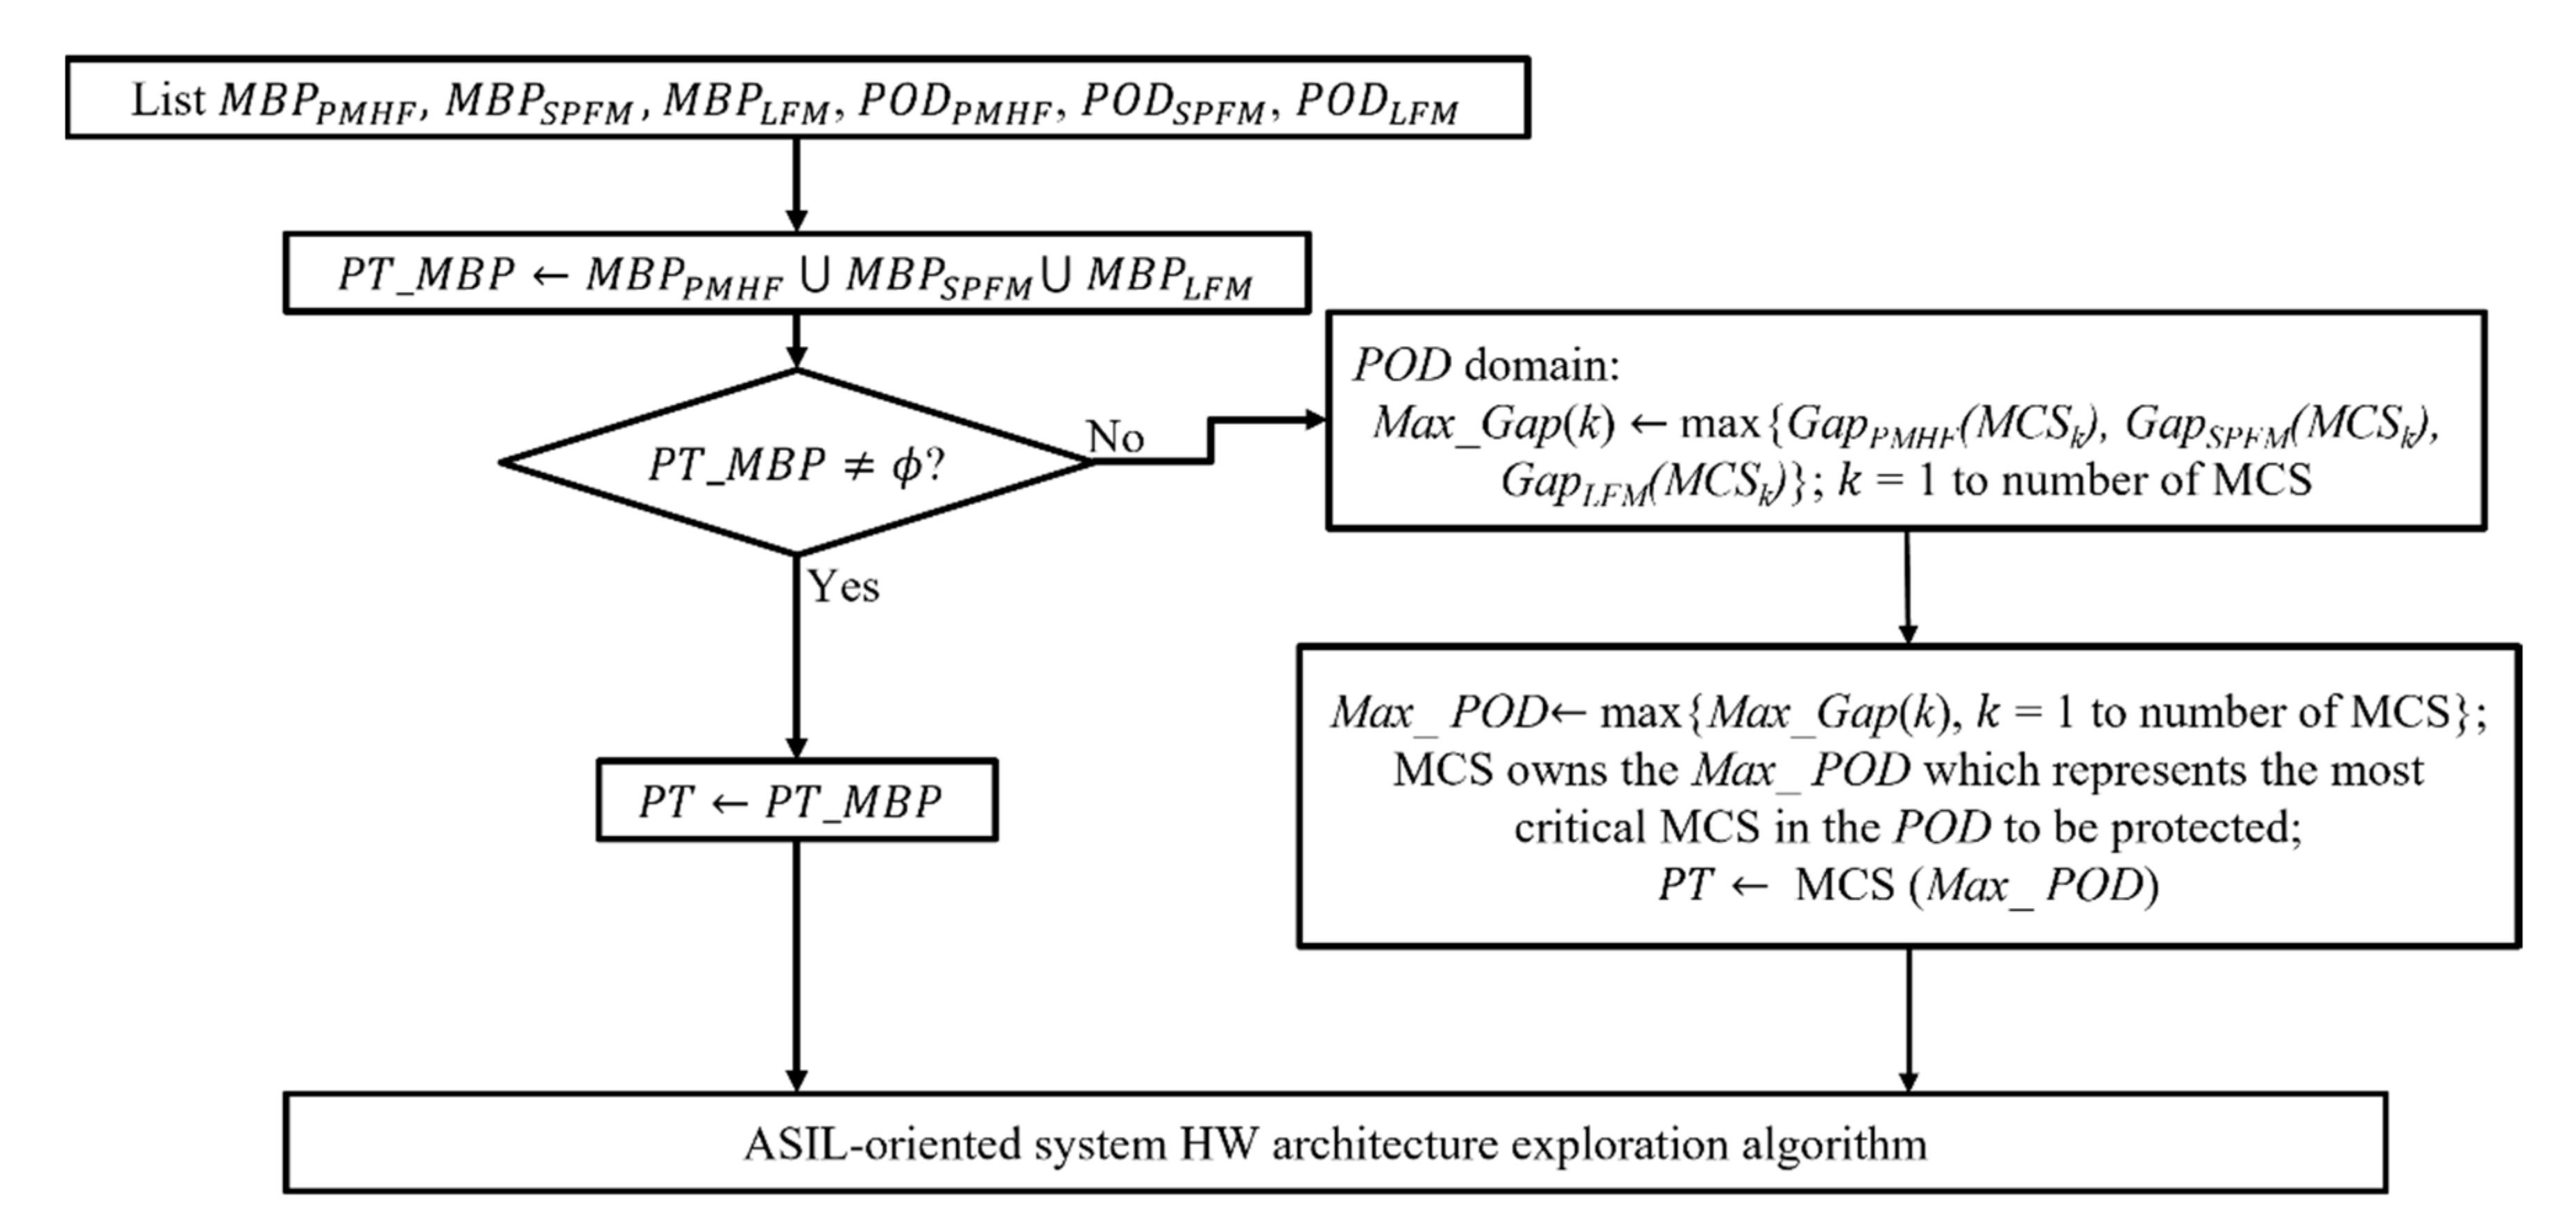
The process regarding the FTA-based weak-point analysis is exhibited in
Figure 3. All the hardware elements in the MBP weak points are required to lower their failure rates by safety mechanism deployment until there are no hardware elements marked as MBP weak points. Therefore, we specify a set named
PT_MBP, which is the union of
MBPPMHF,
MBPSPFM, and
MBPLFM to contain all the MBP weak points. If
PT_MBP is not an empty set, then all the hardware elements in
PT_MBP are required to employ the appropriate safety mechanisms to diminish the failure rates. On the other hand, if the
PT_MBP becomes an empty set, then all the MCSs belong to the POD. If the target ASIL is still not achieved, the MCS with the highest
Gapx(MCSk), where
x can be
PMHF,
SPFM, or
LFM, is selected, and the hardware elements contained in this MCS are assigned to set
PT for
POD. The elements in set
PT for
POD are the targets to conduct the safety mechanism deployment or enhancement. For safety mechanism deployment or improvement, we develop an ASIL-oriented system hardware architecture exploration algorithm to effectively apply safety mechanisms to achieve the safety requirements for the target ASIL goal. This algorithm will be introduced in the next subsection.
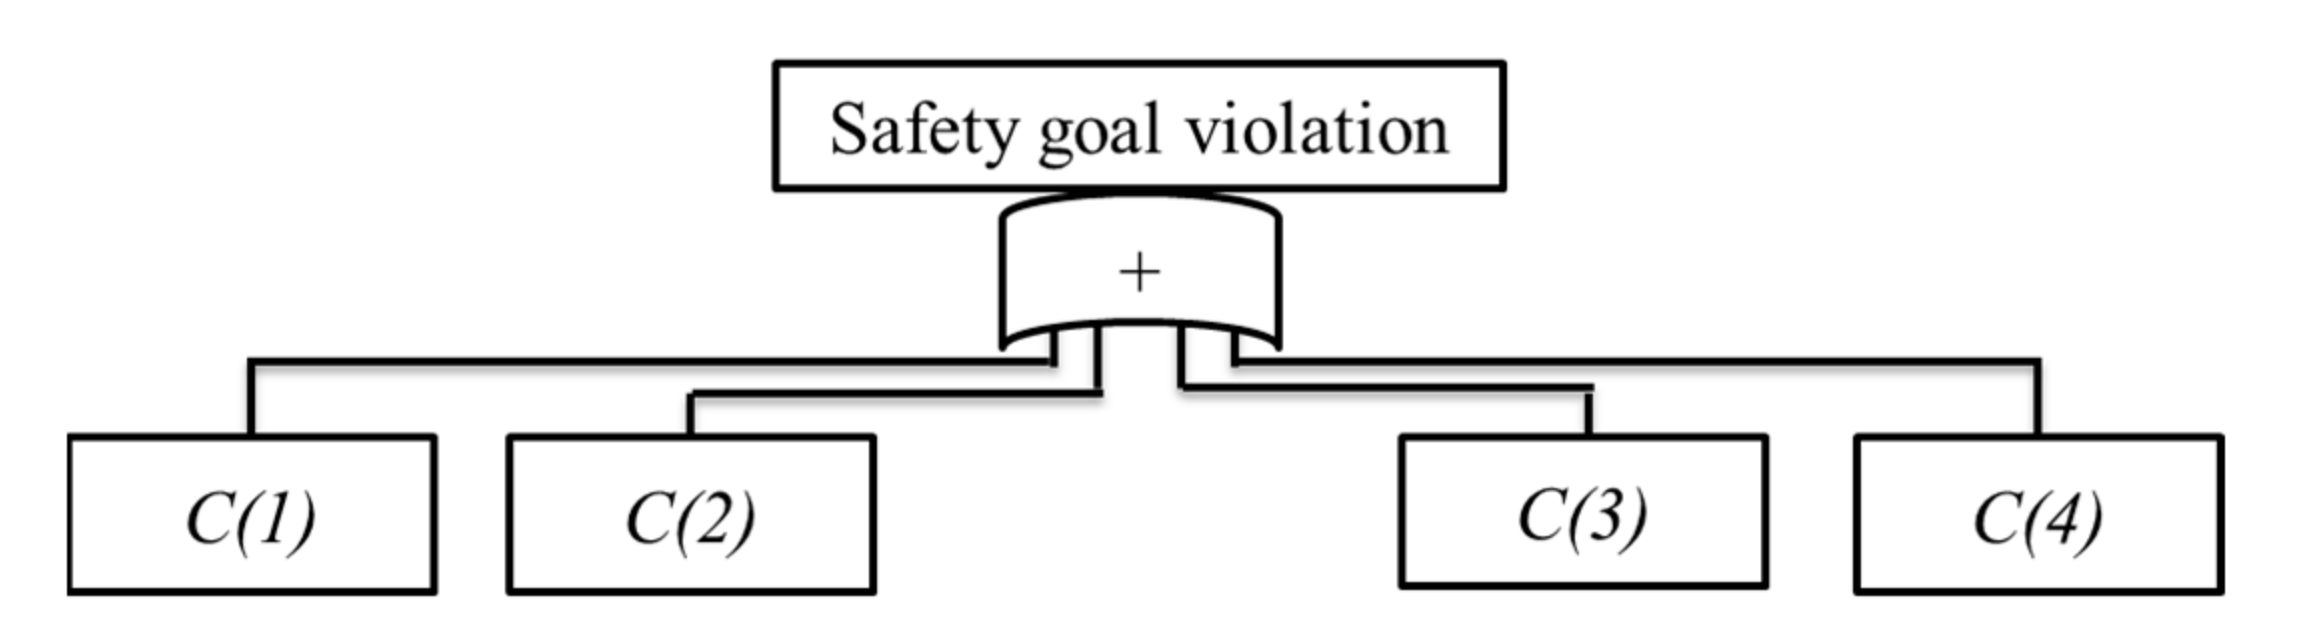
Before we depict the FTA-based weak-point analysis methodology, a simple example is used to explain the idea of the methodology. In this example, we assume that there are five hardware elements in the system. Furthermore, all five hardware elements are not protected by any safety mechanism initially.
Table 2 shows the original failure rates for these five elements and
Figure 4 shows the constructed fault tree for this simple system.
We point out that the hardware element
C(5) does not appear in the constructed fault tree in
Figure 4 because all of
C(5)’s faults have no chance of causing a safety goal violation as shown in
Table 2. In this example, we assume that the target ASIL is B. Therefore, the
SPFMtar = 90%,
LFMtar = 60%, and
PMHFtar = 10
−7 h
−1 according to
Table 1.
First, the failure rates as seen below are computed following the process of
Figure 1.
(no hardware elements are applied to the safety mechanism).
Then the target failure probabilities at a mission time o five thousand hours can be calculated according to expressions (13)–(17) as shown below.
All the MCSs can be identified according to the fault tree in
Figure 4, and the failure probabilities for all MCSs can also be computed as shown in
Table 3.
Consequently, we can mark each MCS as MBP or POD based on the calculated
GapPMHF(MCSk),
GapSPFM(MCSk), and
GapLFM(MCSk) according to expressions (18)–(20), and the results are shown in
Table 4.
The results in
Table 4 show that MBP weak points exist in the system. Therefore, the protection target set
PT is specified by the union of
MBPPMHF,
MBPSPFM, and
MBPLFM, i.e.,
PT_MBP = {
C(3),
C(4)}. In the next subsection, we will illustrate how to apply appropriate safety mechanisms to the hardware elements in
PT after we depict the proposed ASIL-oriented system hardware architecture exploration algorithm.
4.3. System Hardware Architecture Exploration with Safety and Hardware Overhead Consideration
The proposed system hardware architecture exploration is performed for two aspects: Safety and hardware overhead. For the former, the system hardware architecture needs to contain sufficient safety mechanism protection so that the safety metrics for the target ASIL can be achieved; for the latter, the additionally increased hardware overhead attributed to safety mechanism deployment needs to comply with the constraint specified by the system engineers. To fulfill the safety and hardware overhead requirements, we firstly propose an effective ASIL-oriented system hardware architecture exploration algorithm to determine a solution that meets the safety requirements, and then use a Hardware Overhead (HO)-oriented hardware architecture exploration algorithm to adjust the hardware architecture solution derived from the ASIL-oriented system hardware architecture exploration algorithm to satisfy the safety metrics and hardware overhead constraint simultaneously. These two algorithms will be introduced in
Section 4.3.2 and
Section 4.3.3, respectively. Furthermore, we will demonstrate how to perform these two algorithms for a system with the simple example already shown in
Section 4.2.
In this work, the deployed safety mechanisms are categorized into three different levels, which are “High”, “Medium”, and “Low” and represent the diagnostic coverage (DC) estimated to be at least 99%, 90%, and 60%, respectively. Such categorized levels are adopted in ISO-26262. System engineers can also specify their required DC percentages for these three levels. If a hardware element belongs to the MCSk marked as an MBP weak point and the GapPMHF(MCSk), GapSPFM(MCSk), and GapLFM(MCSk) cannot be reduced to be lower than 1, even when the safety mechanism (SM) with “High” DC is used to protect the element, then the target ASIL goal will never be fulfilled. Thus, system engineers should replace the hardware element with a superior one with a lower inherent failure rate or adjust the target ASIL.
4.3.1. Safety Mechanism Library
There are different types of hardware elements in a system, such as microcontroller units, storages, sensors, and actuators. The specific safety mechanisms for each type of hardware element should be deployed to assure the effectiveness in terms of the diagnostic coverage and corresponding hardware overhead. If there exists a database that collects all the feasible safety mechanisms with the information of DC and hardware overhead for each type of hardware element, then we can rapidly discover the most appropriate safety mechanism to be employed. In this study, we call such a database the safety mechanism library. For safety-related hardware elements, a specific safety mechanism library can be established. Moreover, the safety mechanism library is formalized and then can be used in the succeeding ASIL-oriented and HO-oriented system hardware architecture exploration algorithms.
It is worth noting that there are two feasible fault-tolerant design concepts to prevent the dual-point faults from becoming latent. The first one is to deploy a safety mechanism with a self-checking capability and the other is to adopt two-layered safety mechanisms, which means that there is a first-layer safety mechanism for the hardware element protection and a second-layer safety mechanism to detect the first-layer safety mechanism’s faults. In this study, we assume that all the deployed safety mechanisms are developed with self-checking features to monitor the safety mechanism itself, and therefore, no second-layer safety mechanism is required.
The notations for the formalized safety mechanism library are defined below.
SMxyz(PT(e)): The deployed safety mechanism for the protection target PT(e), the eth element in the set PT, where x,y,z ∈ {L, M, H};
- ■
x, y represents the level of the and of the deployed SM for PT(e), respectively, where
- ▶
L means diagnostic coverage = 60%//Low diagnostic coverage.
- ▶
M means diagnostic coverage = 90%//Medium diagnostic coverage.
- ▶
H means diagnostic coverage = 99%//High diagnostic coverage.
- ■
z is for the hardware overhead of PT(e) contributed from the deployed SM for PT(e).
- ▶
The percentages of hardware overhead for L(Low), M(Medium), and H(High) are assumed to be known and specified by the system engineers.
Then, the formalized safety mechanism library can be defined in the following:
SM_Lib(PT(e)): The safety mechanism library for the PT(e); the safety mechanisms of an element can be represented by a set that contains all feasible safety mechanisms such as {SMLLL, SMMMM, SMHHH} or {SMLML, SMMHH, SMHHM} or {SMMHM, SMHHH} depending on the hardware element type. SM_Lib(PT(e)) collects the sets of safety mechanism for all hardware elements in the PT(e).
4.3.2. ASIL-Oriented Hardware Architecture Exploration Algorithm
In
Section 4.2, we have pointed out that
GapPMHF(MCSk),
GapSPFM(MCSk), and
GapLFM(MCSk) must all be lower than 1 to eliminate the gaps between current and target failure probabilities so that the three hardware architecture metrics could be achieved. As seen from
Figure 3,
Max_Gap(k) represents the maximum gap among
GapPMHF(MCSk),
GapSPFM(MCSk), and
GapLFM(MCSk) for the
MCSk. In the following, we assume
MCSk contains the hardware element
C(i). Therefore, the reduced failure probabilities obtained from the safety mechanism deployment shall comply with the following condition:
where
is the original failure probability of
MCSk attributed to the hardware element
C(i)’s failures without any safety mechanism protection, and
is the failure probability due to residual faults attributed to the hardware element
C(i) under the safety mechanism protection. Then, the
can be obtained according to the linearity between the
and
Max_Gap(k) as described below.
- •
If = 2.5, the expression (21) can be rewritten as . Next, we let and . Thus, we can acquire the expression , which means that the must be greater than 60%. Therefore, we can conclude that the “Low” safety mechanism is sufficient to eliminate the gaps if Max_Gap(k) < 2.5.
- •
Similarly, if 2.5 ≤ Max_Gap(k) < 10, then we can induce the = 90%, i.e., “Medium” safety mechanism to be sufficient and = 99%, i.e., “High” safety mechanism deployment for the case Max_Gap(k) .
Once the
is decided, the
becomes nonzero. Therefore, the current
can be expressed as
and all the
GapPMHF(MCSk),
GapSPFM(MCSk) and
GapLFM(MCSk) need to be updated to reflect such changes. The updated
GapPMHF(MCSk),
GapSPFM(MCSk), and
GapLFM(MCSk) here are used to determine the
. Accordingly,
should be excluded when updating the gaps so that the
assignment can assure that the derived
can be lower than
,
, and
. The updated gaps are computed with the following expressions (22)–(24):
where
with
.
Next, we reassign Max_Gap(k) with the largest one among the updated GapPMHF(MCSk), GapSPFM(MCSk), and GapLFM(MCSk). Consequently, can be assigned according to the same derivation method for deciding as shown above.
The proposed ASIL-oriented system hardware architecture exploration algorithm is written by pseudo-codes as shown below.
In Algorithm 1, if the element has been assigned the safety mechanisms at previous iterations and selected again as the target to improve its diagnostic coverage, then the following criteria are adopted to guide the upgrade of the DC of safety mechanism for the target element to be protected. The criteria are based on the aspects of the effectiveness of failure rate reduction and the increased hardware overhead. We note that the protection of the hardware element for single-point and dual-point faults is based on the concept of a safety mechanism with self-checking. In general, the self-checking scheme employed to cope with the dual-point faults will be considered first, because we do not need to change the safety mechanism for single-point faults and enjoy the lower hardware overhead increase as well as the higher failure rate reduction. As we know, the failure rate of residual faults decreases while the DC of safety mechanism to tackle the single-point faults increases, but meanwhile, the failure rate of latent dual-point faults could increase due to the fact that more single-point faults covered by the safety mechanism could possibly become the latent dual-point faults. According to the reasons stated above, the self-checking scheme used to protect the safety mechanism is first considered to be enhanced if the hardware element has deployed the safety mechanisms and selected the protection target again.
| Algorithm 1: ASIL-oriented system hardware architecture exploration |
| 1: Function SM_Deploy(PT) |
| 2: for e = 1 to n do //n is the number of the elements in the set (PT)// |
| 3: { flag ← 0; SM-status ← ‘false’; |
| 4: if () then //No protection for single-point faults and dual-point faults |
| 5: { GapSM_D ← Max(GapPMHF(PT(e)), GapSPFM(PT(e)), GapLFM(PT(e))); //apply the Max_Gap for PT(e)// |
| 6: SM_Sel(PT(e), GapSM_D, “RF”); |
| 7: Update GapPMHF(PT(e)), GapSPFM(PT(e)) and GapLFM(PT(e)) with expressions (22)–(24); |
| 8: GapSM_D ← Max(GapPMHF(PT(e)), GapSPFM(PT(e)), GapLFM(PT(e))); |
| 9: SM_Sel(PT(e), GapSM_D, “DPF,L”); flag ← 1; } |
10: if ( and ) then //there is a protection of single-
point faults but no protection for latent dual-point faults// |
| 11: { Update GapPMHF(PT(e)), GapSPFM(PT(e)) and GapLFM(PT(e)) with expressions (22)–(24); |
| 12: GapSM_D ← Max(GapPMHF(PT(e)), GapSPFM(PT(e)), GapLFM(PT(e))); |
| 13: SM_Sel(PT(e), GapSM_D, “DPF,L”);} |
14: if ( and ) then //the considered
element has been assigned the safety mechanisms at previous iterations and
selected again as target to improve its diagnostic coverage// |
15: { if ( and ) then upgrade
to the next higher level of DC; SM-status ← ‘true’;
//as mentioned before, the protection of hardware element for single-
point and dual-point faults is based on the concept of safety mechanism
with self-checking. Therefore, considering the effectiveness of failure rate
reduction and the increased hardware overhead, when DC of latent dual-
point faults is not at the highest level and less than or equal to the DC of
single-point faults, the is upgraded to the next higher level
of DC// |
| 16: if (SM-status = ‘false’ and ) then upgrade to the next higher level of DC; |
| 17: if ( and ) then |
18: { if PT(e) PT_MBP then return(failed); //MBP cannot be eliminated using
available SM_Lib, and therefore, fail to find a solution// |
| 19: else MCS with the second most critical Max_Gap among all POD; call SM_Deploy(PT); }} |
| 20: } |
| 21: if (PMHFite_d ≥ PMHFtar or SPFMite_d < SPFMtar or LFMite_d < LFMtar) then |
22: if (all safety-related hardware elements have been applied with SMHHz) then
return(failed); //the target ASIL not achieved, but the highest DC of safety
mechanism has been employed for all safety-related hardware elements, then
the algorithm fails to disciver a feasible solution to satisfy the ASIL goal// |
| 23: End SM_Deploy; |
| 24: Function SM_Sel(PT(e), GapSM_D, type) |
| 25: switch GapSM_D do |
| 26: case ≥ 10 do//DC: High |
27: if (type = RF) then else //SM_Lib
always provides a high DC of safety mechanism for each hardware
element in the set PT// |
| 28: case < 10 && ≥ 2.5 do //DC: Medium |
| 29: if (type = “RF”) then |
30: if (there exists SMMyz inSM_Lib(PT(e))) then else
//check whether medium DC of safety mechanism
for the target element to be protected is available or not in the
SM_Lib. If not, the high DC of safety mechanism is used instead.// |
| 31: if (type = “DPF,L”) then |
| 32: if (there exists SMxMz inSM_Lib(PT(e))) then |
| 33: else |
| 34: case < 2.5 do //DC: Low |
| 35: if (type = “RF”) then |
| 36: { if (there exists SMLyz inSM_Lib(PT(e))) then |
| 37: else if (there exists SMMyz inSM_Lib(PT(e))) then |
| 38: else } |
| 39: if (type = “DPF,L”) then |
| 40: { if (there exists SMxLz inSM_Lib(PT(e))) then |
| 41: else if (there exists SMxMz inSM_Lib(PT(e))) then |
| 42: else } |
| 43: End SM_Sel; |
In this work, we assume that SM_Lib will provide the ‘High’ level of DC of the safety mechanism for each hardware element in the set PT. For the cases to select the safety mechanism of ‘Medium’ and ‘Low’ DC, we need to determine whether the demanded safety mechanisms exist in the SMxyz(PT(e)). The safety mechanism with a higher level of DC will be deployed if the demanded safety mechanism cannot be found in the SM_Lib(PT(e)).
Next, we will demonstrate how to perform Algorithm 1 with the simple example presented in
Section 4.2 where the set of protection targets is
PT = {
C(3),
C(4)}. For the sake of simplicity, we use the same safety mechanism set {SM
LLL, SM
LML, SM
MMM, SM
MHM, SM
HHH} for all hardware elements in the
SM_Lib.
For
C(3) and
C(4) hardware elements, there is no safety mechanism deployed, so
= 0. Besides, from
Table 4, the
Max_Gap for
C(3) and
C(4) can be acquired. Thus, the deployed safety mechanisms can be determined as shown in
Table 5 where the deployed safety mechanism for hardware element
C(3) is represented by
SMMyM, which means that the
= 90% with “Medium” hardware overhead and
is still unspecified. The meaning of SM
HyH can be explained in a similar way. After safety mechanism deployment to avoid single-point faults, the
GapSM_D for
C(3) and
C(4) need to be updated following the aforementioned process with expressions (22)–(24). Then the
for
C(3) and
C(4) can be decided according to the updated
GapSM_D as illustrated in
Table 6.
Then, the hardware architecture metrics can be updated in accordance with the deployed safety mechanisms as stated in the following:
Compared to the
PMHFtar,
SPFMtar, and
LFMtar for target ASIL B, we can conclude that only
LFMtar has been achieved and
PMHFite_d and
SPFMite_d still violate the target values. Thus, another design iteration is required to perform the weak-point analysis and exploration algorithm again to deploy and/or upgrade the safety mechanisms. The results of the weak-point analysis for the updated hardware architecture are shown in
Table 7.
From
Table 7, we can observe that all the MBPs have been resolved. The results show that the proposed exploration algorithm improves the system hardware architecture’s failure rates in an efficient fashion. However, the target ASIL is still not achieved even though no MBP exists. Thus, the most critical weak point among all MCSs marked as POD should be identified further. According to
Table 7, {
C(1)} is the most critical POD weak point. Then, Algorithm 1 is performed to assign an appropriate safety mechanism to
C(1) according to its
GapSM_D. As a result, the
and
for
C(1) are both decided to be 60%. Furthermore, the updated hardware architecture metrics are
SPFMite_d = 92.24%,
LFMite_d = 96.06%, and
PMHFite_d =
, respectively. The results demonstrate that the
PMHFite_d is still greater than the target value and, hence, another design iteration is required. The process for the next design iteration is similar to iteration 1 and 2, and the changes of
and
for each hardware element in the following design iterations are summarized in
Table 8.
After performing the six design iterations, the updated hardware architecture metrics are SPFMite_d = 95.69%, LFMite_d = 97.8%, and PMHFite_d = . As a result, all the target values for achieving ASIL B have been satisfied. The deployed safety mechanisms for the hardware element C(1)–C(4) are SMMMM, SMLLL, SMMHM, and SMHHH, respectively.
Because the increased hardware overhead for the deployed safety mechanisms is not examined in Algorithm 1, the overall hardware overhead for the whole system could violate the specified constraint. If the constraint is violated, the proposed HO-oriented hardware architecture exploration process should be activated. The corresponding details are depicted in the next subsection.
4.3.3. HO-Oriented Hardware Architecture Exploration Algorithm
As aforementioned, the HO-oriented hardware architecture exploration algorithm will be performed if the hardware overhead constraint is not met. The main purpose of this algorithm is to explore whether there are other safety mechanism deployment solutions with lower hardware overhead than the one assigned by the ASIL-oriented hardware architecture exploration algorithm. During such design space exploration, there will be four possible outcomes, which are:
- a.
Both the safety metrics and hardware overhead constraint are met.
- b.
The safety metrics are satisfied but the hardware overhead constraint is not.
- c.
The hardware overhead constraint is met but the safety metrics are not.
- d.
Neither the hardware overhead constraint nor the safety metrics are satisfied.
Outcome a indicates that a feasible system hardware architecture has been found and the FMEDA report will also be generated. For outcome b, a new round of system hardware architecture exploration is required to search for another possible solution with lower overall hardware overhead. To assure that the overall hardware overhead can be effectively reduced, our strategy is to replace the safety mechanism, which contributes the highest hardware overhead among all deployed safety mechanisms, with a safety mechanism with lower DC and lower hardware overhead. However, such a replacement is not allowed if the replacement will cause the element to become MBP again. In such a case, the element with the next highest hardware overhead in the overhead ranking will be selected as the target to be adjusted. Moreover, if outcome c occurs, the element deploying the safety mechanism with the lowest hardware overhead in the overhead ranking will be chosen to be replaced by the safety mechanism with a higher level of DC. Undoubtedly, the safety mechanism with better DC will lead to higher hardware overhead and has the potential to lead the outcome to turn into c or d. Therefore, the outcomes could alternatively repeat between b, c, and d until all the possible safety mechanism replacements have been examined. If so, it means that no feasible system hardware architecture can meet the hardware overhead constraint and the safety requirements simultaneously. Thus, the system engineers should review whether the specified constraint is reasonable for the target ASIL. For outcome d, we tend to meet the hardware overhead constraint first and then the safety metrics because satisfying the hardware overhead constraint is the primary goal in the current design phase.
We organize the concepts described above into an algorithm, which is shown in Algorithm 2. The following notations and expressions are defined next:
PT_d: The set containing the hardware elements with safety mechanism deployment in the system hardware architecture derived from the Algorithm 1.
no_d: The number of elements in the set PT_d.
ite_d: The number of search iterations performed.
HO_Maxsys: The maximal allowable system hardware overhead in percentage.
HO_Totalite_d: Total system hardware overhead due to safety mechanism deployment.
| Algorithm 2: HO-oriented system hardware architecture exploration |
1: PT_d ← set of all hardware elements with safety mechanism deployment in the
system hardware architecture derived from the Algorithm 1; ite_d ← 0; |
| 2: Rank all the elements in PT_d by the hardware overhead in unit from high to low; Calculate HO_Totalite_d for PT_d; |
| 4: pdown ← 1; pup ← no_d; SM_HO(HO_Totalite_d, down)//Select the first hardware element in PT_d as the target to adjust |
| 5: Function SM_HO(HO_Totalite_d, strategy) |
6: while (pup ≥ pdown) //check if pup < pdown then stop the search; it means that the design
space has been comprehensively explored and no
solution can be found when pup < pdown occurs.// |
| 7: { if (strategy = down) and (downgrade the is allowable) then |
| 8: downgrade to reduce ; |
| 9: else if (strategy = up) and (upgrade the is feasible) then |
| 10: upgrade to improve or or both; |
| 11: else//both SM downgrade and upgrade are not allowable. In this case, the other candidate will be selected. |
| 12: { if (strategy = down) then pdown ← pdown + 1; SM_HO(HO_Totalite_d, down); //Try next element |
| 13: else pup ← pup − 1; SM_HO(HO_Totalite_d, up) //Try previous one element.} |
| 14: ite_d ← ite_d + 1; update HO_Totalite_d and ASIL metrics; |
| 15: if (HO_Totalite_d ≤ HO_Maxsys) and (Target ASIL has been achieved) then |
16: { return (a feasible solution has ben discovered; all the adjusted elements with
revised SM and overall system hardware overhead); terminate the
Algorithm 2; //a cost-effective solution to meet the hardware overhead
constraint and ASIL safety goal is obtained//} |
| 17: if (HO_Totalite_d > HO_Maxsys) and (Target ASIL has been achieved) then |
| 18: { if (downgrade the is feasible) then SM_HO(HO_Totalite_d, down);//Try same element again. |
| 19: else pdown = pdown + 1; SM_HO(HO_Totalite_d, down); //Try next element.} |
| 20: if (HO_Totalite_d ≤ HO_Maxsys) and (Target ASIL is not achieved) then |
| 21: { if (upgrade the ) is feasible) then SM_HO(HO_Totalite_d, up)//Try same element again. |
| 22: else pup = pup − 1; SM_HO(HO_Totalite_d, up) //try previous one element.} |
23: if (HO_Totalite_d > HO_Maxsys) and (Target ASIL is not achieved) then //both hardware
overhead and ASIL metrics are violated. In this case, try to meet hardware
overhead constraint first// |
| 24: { if (downgrade the is feasible) then SM_HO(HO_Totalite_d, down); //Try same element again. |
| 25: else pdown = pdown + 1; SM_HO(HO_Totalite_d, down); //Try next element.} |
| 26: } |
| 27: return (failed); //pup < pdown occurs. |
| 28: End function; |
In the following, we will illustrate how to perform Algorithm 2 with the example presented earlier. Before performing Algorithm 2, the hardware overhead of existing safety mechanisms for each hardware element are provided by the system engineers as shown in the
Table 9. Here, the hardware overhead constraint
HO_Maxsys is set up for 15%.
Next,
for
PT_d = {{
C(1),
SMC(1)}, {
C(2),
SMC(2)}, {
C(3),
SMC(3)}, {
C(4),
SMC(4)}} derived from Algorithm 1 can be computed, and the results are summarized in
Table 10.
According to
Table 9 and
Table 10, the overall hardware overhead can be computed as follows:
As a result, the current HO_Totalite_d is greater than HO_Maxsys, and therefore, Algorithm 2 is activated to adjust the system hardware architecture acquired from Algorithm 1. First, the set PT_d is specified to contain all the safety-related hardware elements that are protected by safety mechanisms, and then all the elements in PT_d are sorted according to the increased hardware overhead due to the deployed safety mechanisms. It is evident that PT_d = {C(4), C(3), C(1), C(2)}. Then we declare two pointers, pdown and pup where pdown points to the hardware element with the highest , i.e., C(4), and pup points to the hardware element with the lowest , i.e., C(2).
Subsequently, the safety mechanism of
C(4),
SMHHH(C(4)), is selected as the candidate to be downgraded for the hardware overhead reduction. However, the downgraded safety mechanism could allow
C(4) to become MBP again. Therefore, the downgrade of the safety mechanism for
C(4) is not allowable and hence we need to let
pdown point to the hardware element with the next highest
, i.e.,
C(3). Unfortunately, the downgrade of
C(3)’s safety mechanism is also not allowable so the next candidate
C(1) is selected. At this time, the downgrade of
SMMMM(C(1)) is allowable and feasible because
C(1) is kept as POD with the downgraded safety mechanism. Consequently,
SMMMM(C(1)) is replaced by
SMLML(C(1)). In accordance with this replacement, all the considered design metrics
HO_Totalite_d,
SPFMite_d,
LFMite_dˆ, and
PMHFite_d need to be updated.
Clearly, the exceeds although HO_Totalite_d has met the hardware overhead constraint. Therefore, another design iteration is activated to explore the potential solution.
In the next design iteration, the hardware element
C(2) pointed by
pup is selected as the upgraded candidate for its deployed safety mechanism. Apparently, the upgrade of
SMLLL(C(2)) is feasible because there exists a safety mechanism with a higher level of DC. Thus,
SMLLL(C(2)) is replaced by
SMMMM(C(2)). It is worth noting that the replacement of
SMLLL(C(2)) by
SMLML(C(2)) cannot resolve the
violation situation. For this reason,
SMLML(C(2)) is not applied. Again, we need to update the corresponding
HO_Totalite_d,
SPFMite_d,
LFMite_d, and
PMHFite_d.
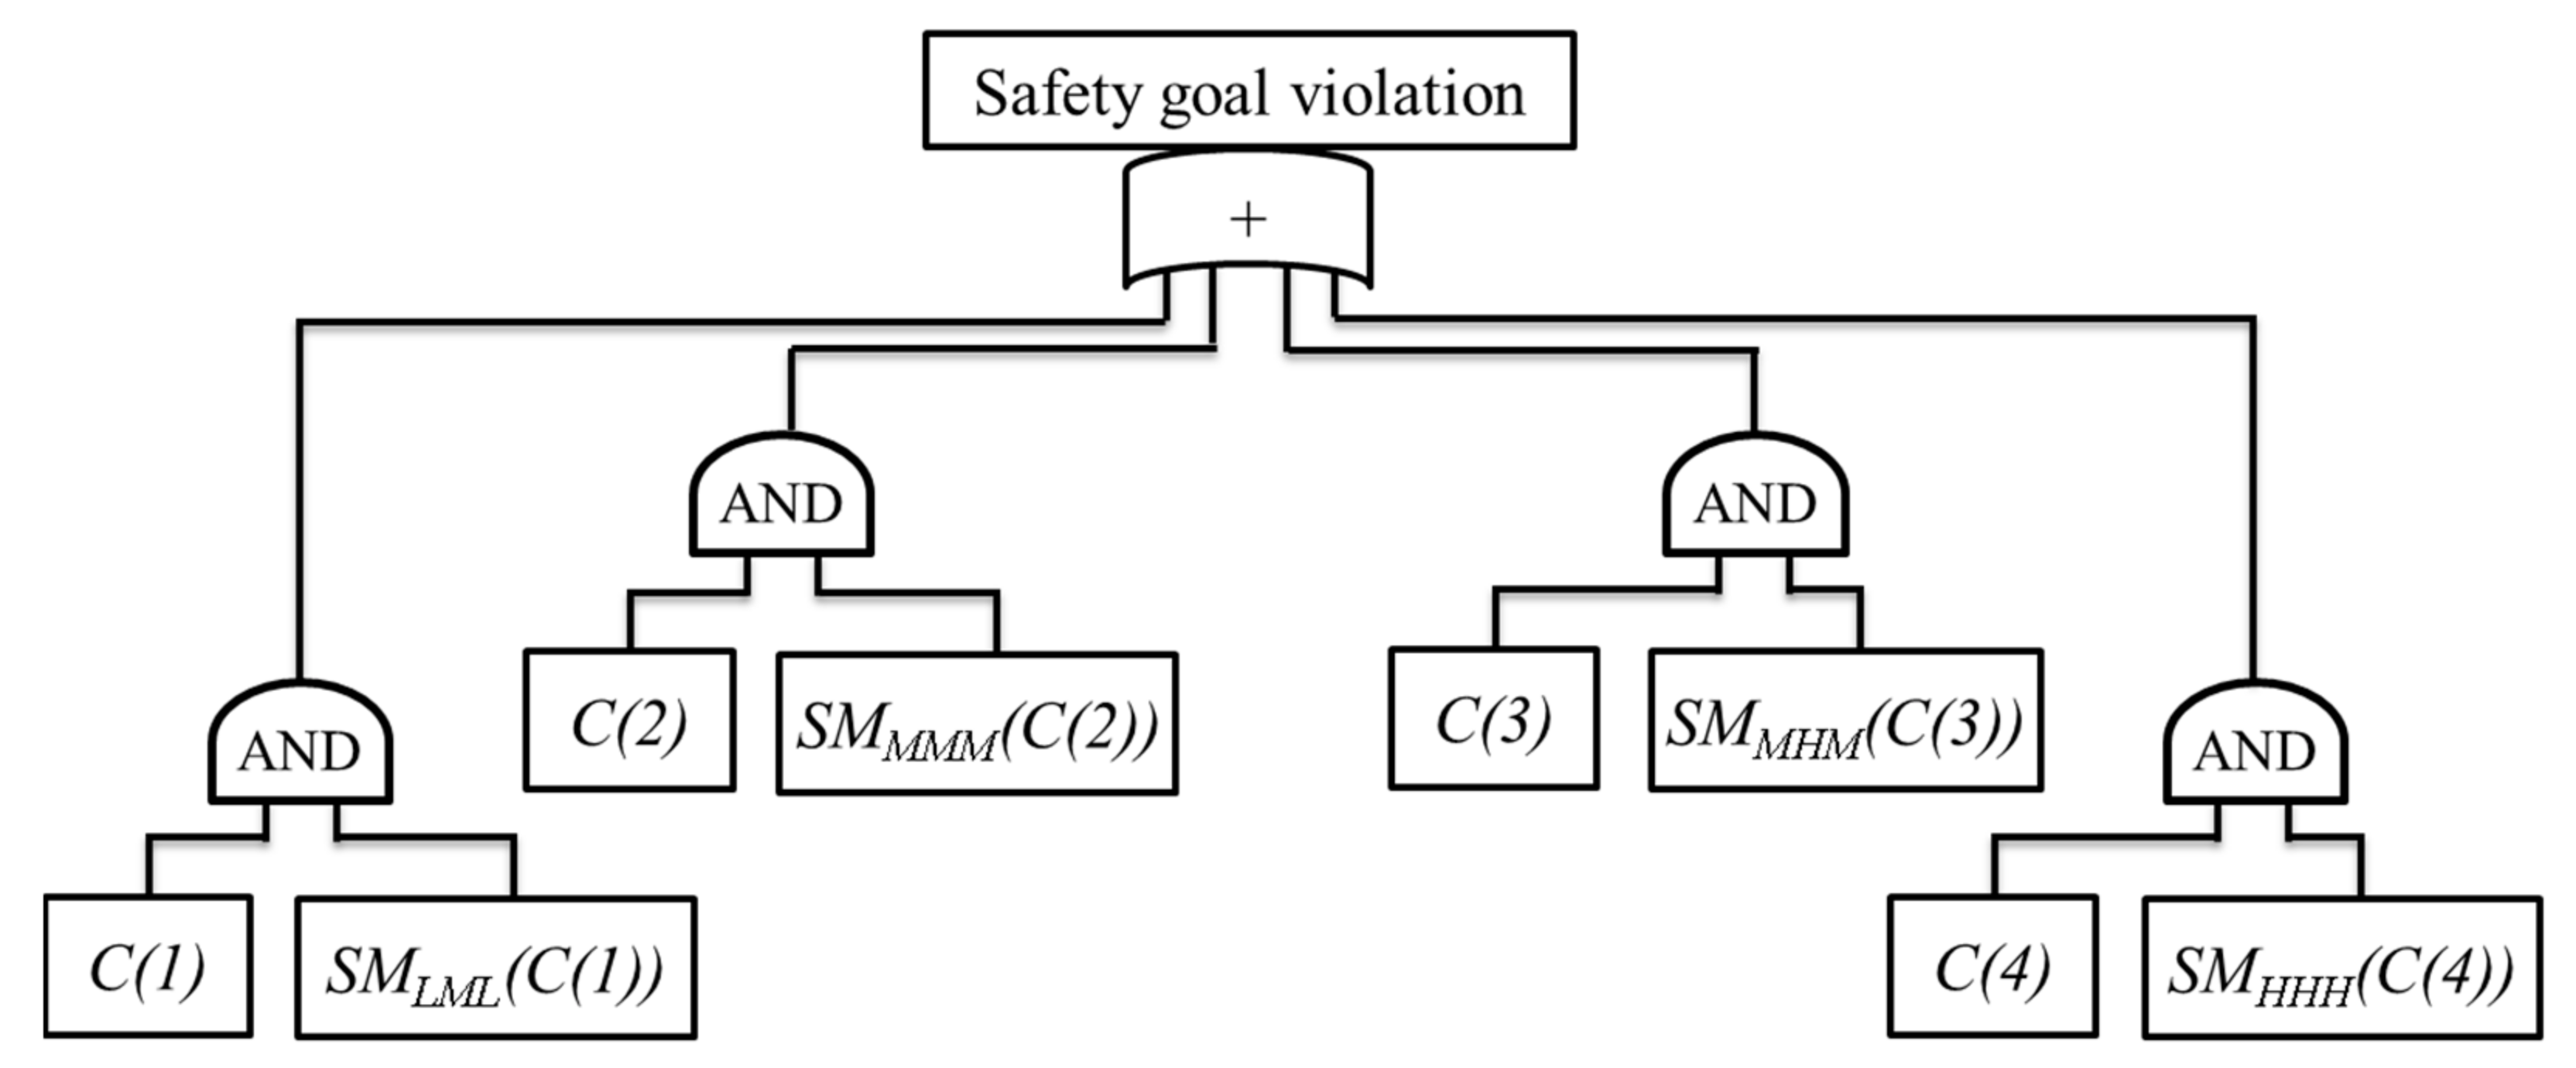
The results show that all the hardware architecture metrics and the hardware overhead constraint have been satisfied. Thus, the fault tree can be updated with the results of the safety mechanism deployment as exhibited in
Figure 5.
With this simple example, we have demonstrated that the proposed safety-oriented system hardware architecture exploration framework can simultaneously deal with four design metrics (three safety metrics and one hardware overhead constraint) with two exploration algorithms. The framework can deliver a system hardware architecture that conforms to the safety and hardware overhead requirements in a very limited number of design iterations. In the following section, to concretely demonstrate the effectiveness of the proposed framework, we employ a safety-critical AEB (Autonomous Emergency Braking) system adopted in the real automotive industry to exemplify how to apply the proposed framework to such a safety-related system design.
5. Case Study—An Autonomous Emergency Braking System
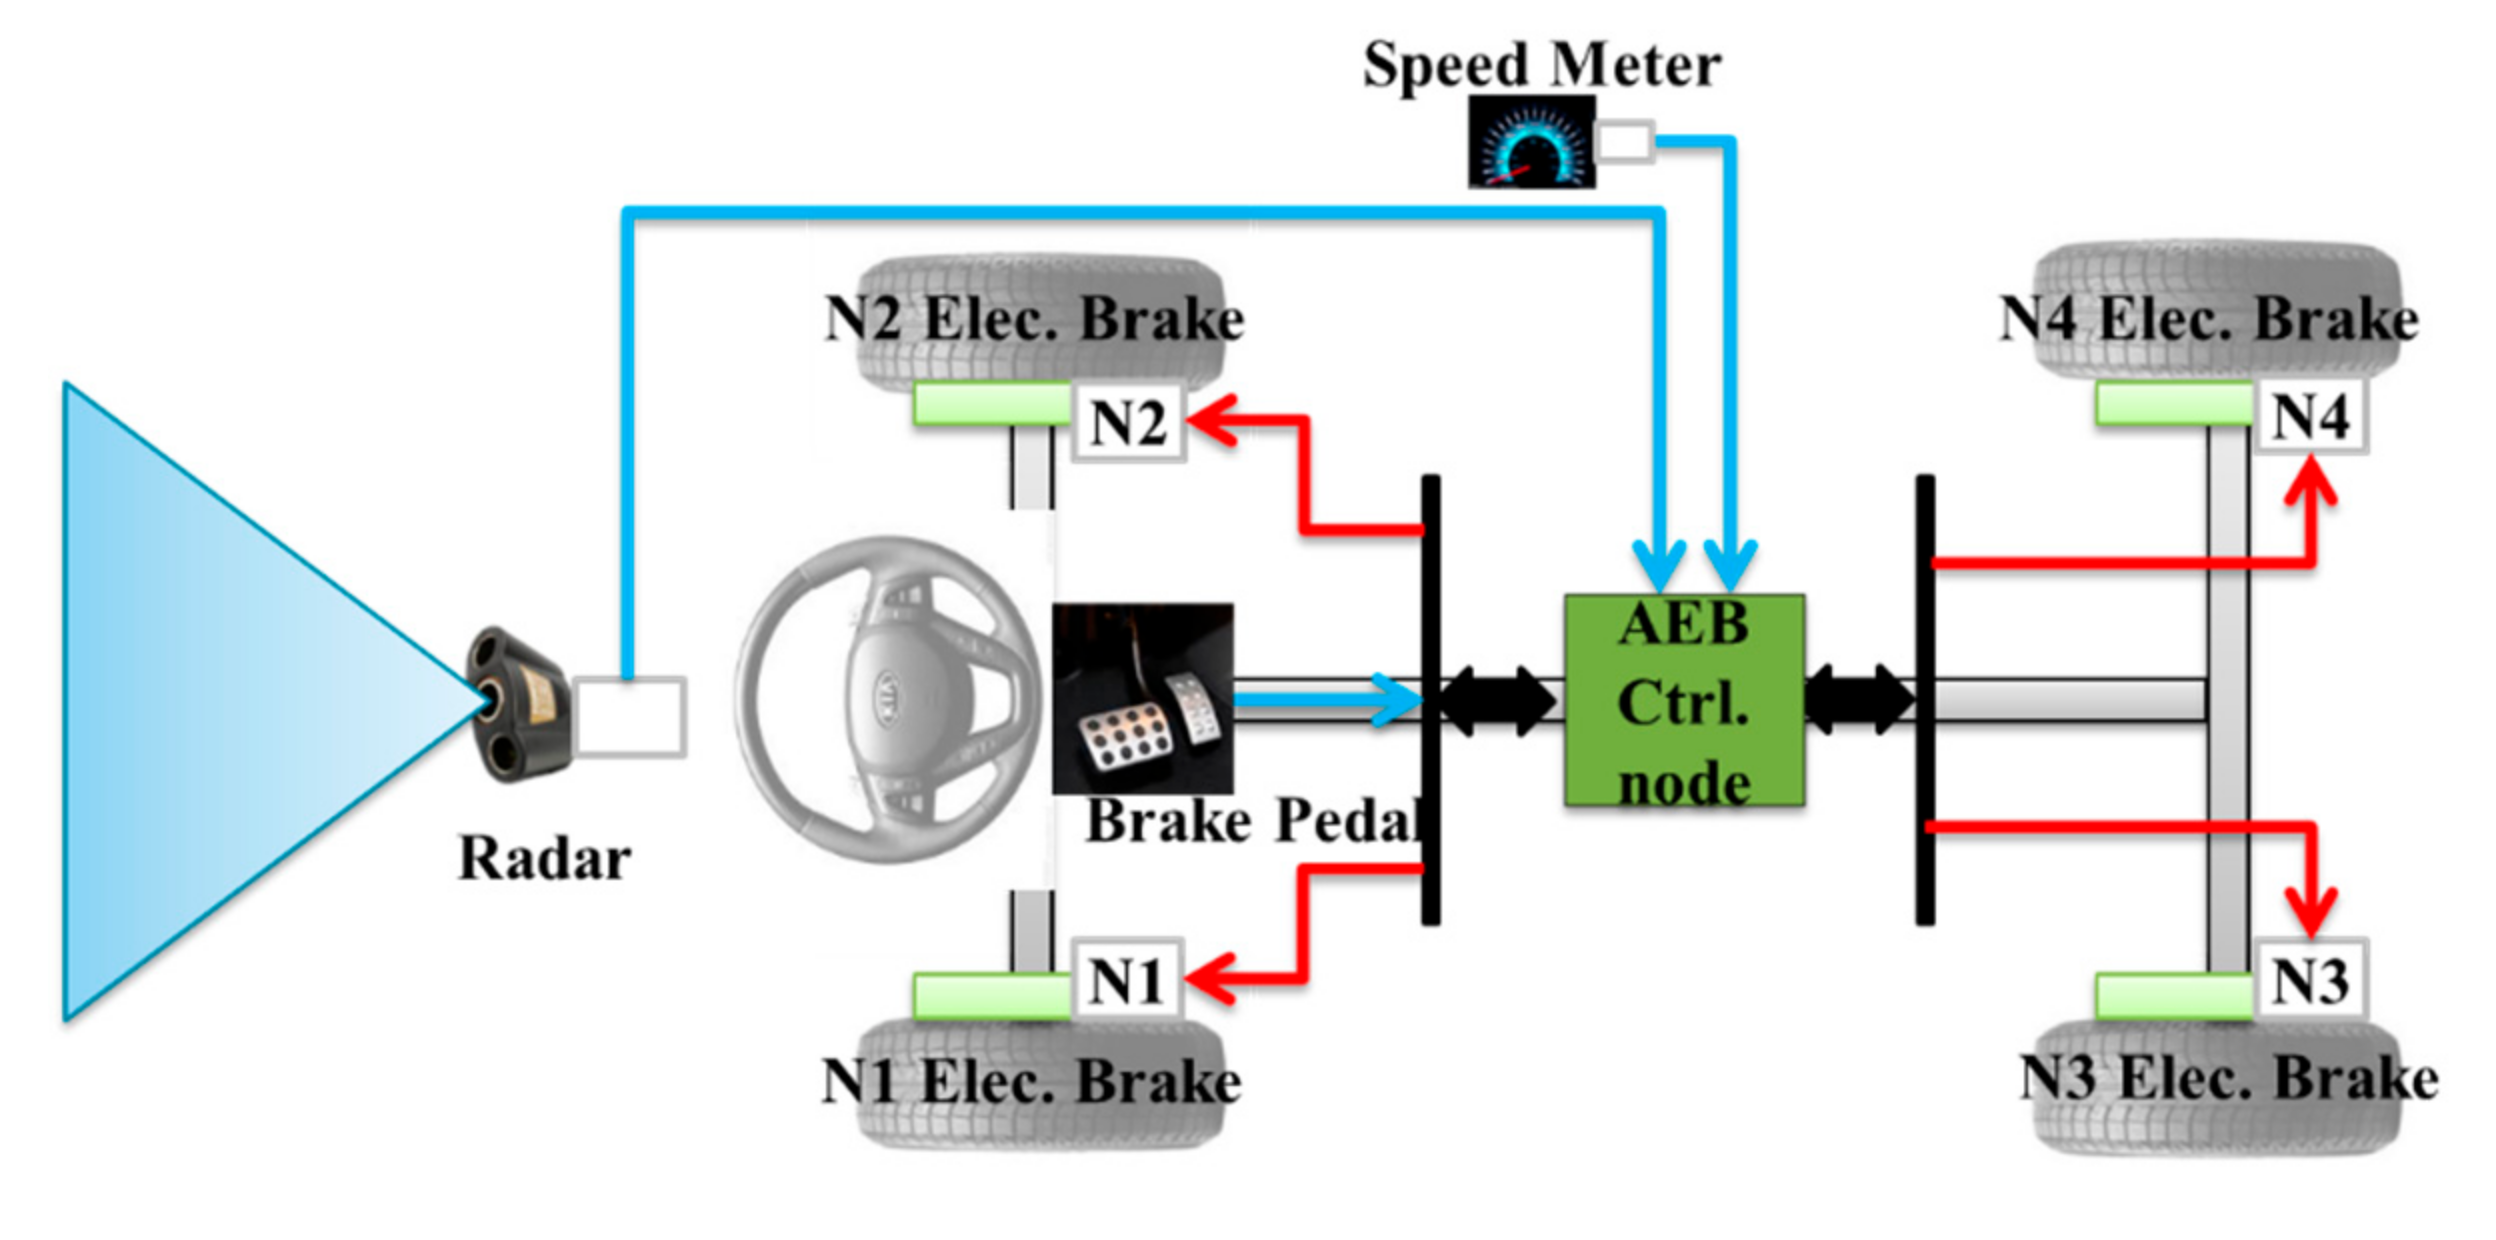
Figure 6 shows the functional block diagram of the AEB system [
4]. The primary function of the AEB system is to warn drivers about emergent situations and autonomously brake vehicles to avoid a serious collision if drivers do not react to the warning signal.
For implementing the warning and autonomous braking function, radar will continuously monitor the distance between the subject vehicle and the front vehicle and provide the distance information to the central AEB control node. Once the AEB control node is aware that the current distance falls into the dangerous range and a collision could happen under the relative vehicle speed, the AEB control node will first send a warning message (a sound or flashlight) to warn the driver. If the driver does not react to the warning message and the situation becomes more severe, the AEB control node will inform the electric braking units to immediately perform the braking action to avoid the serious collision.
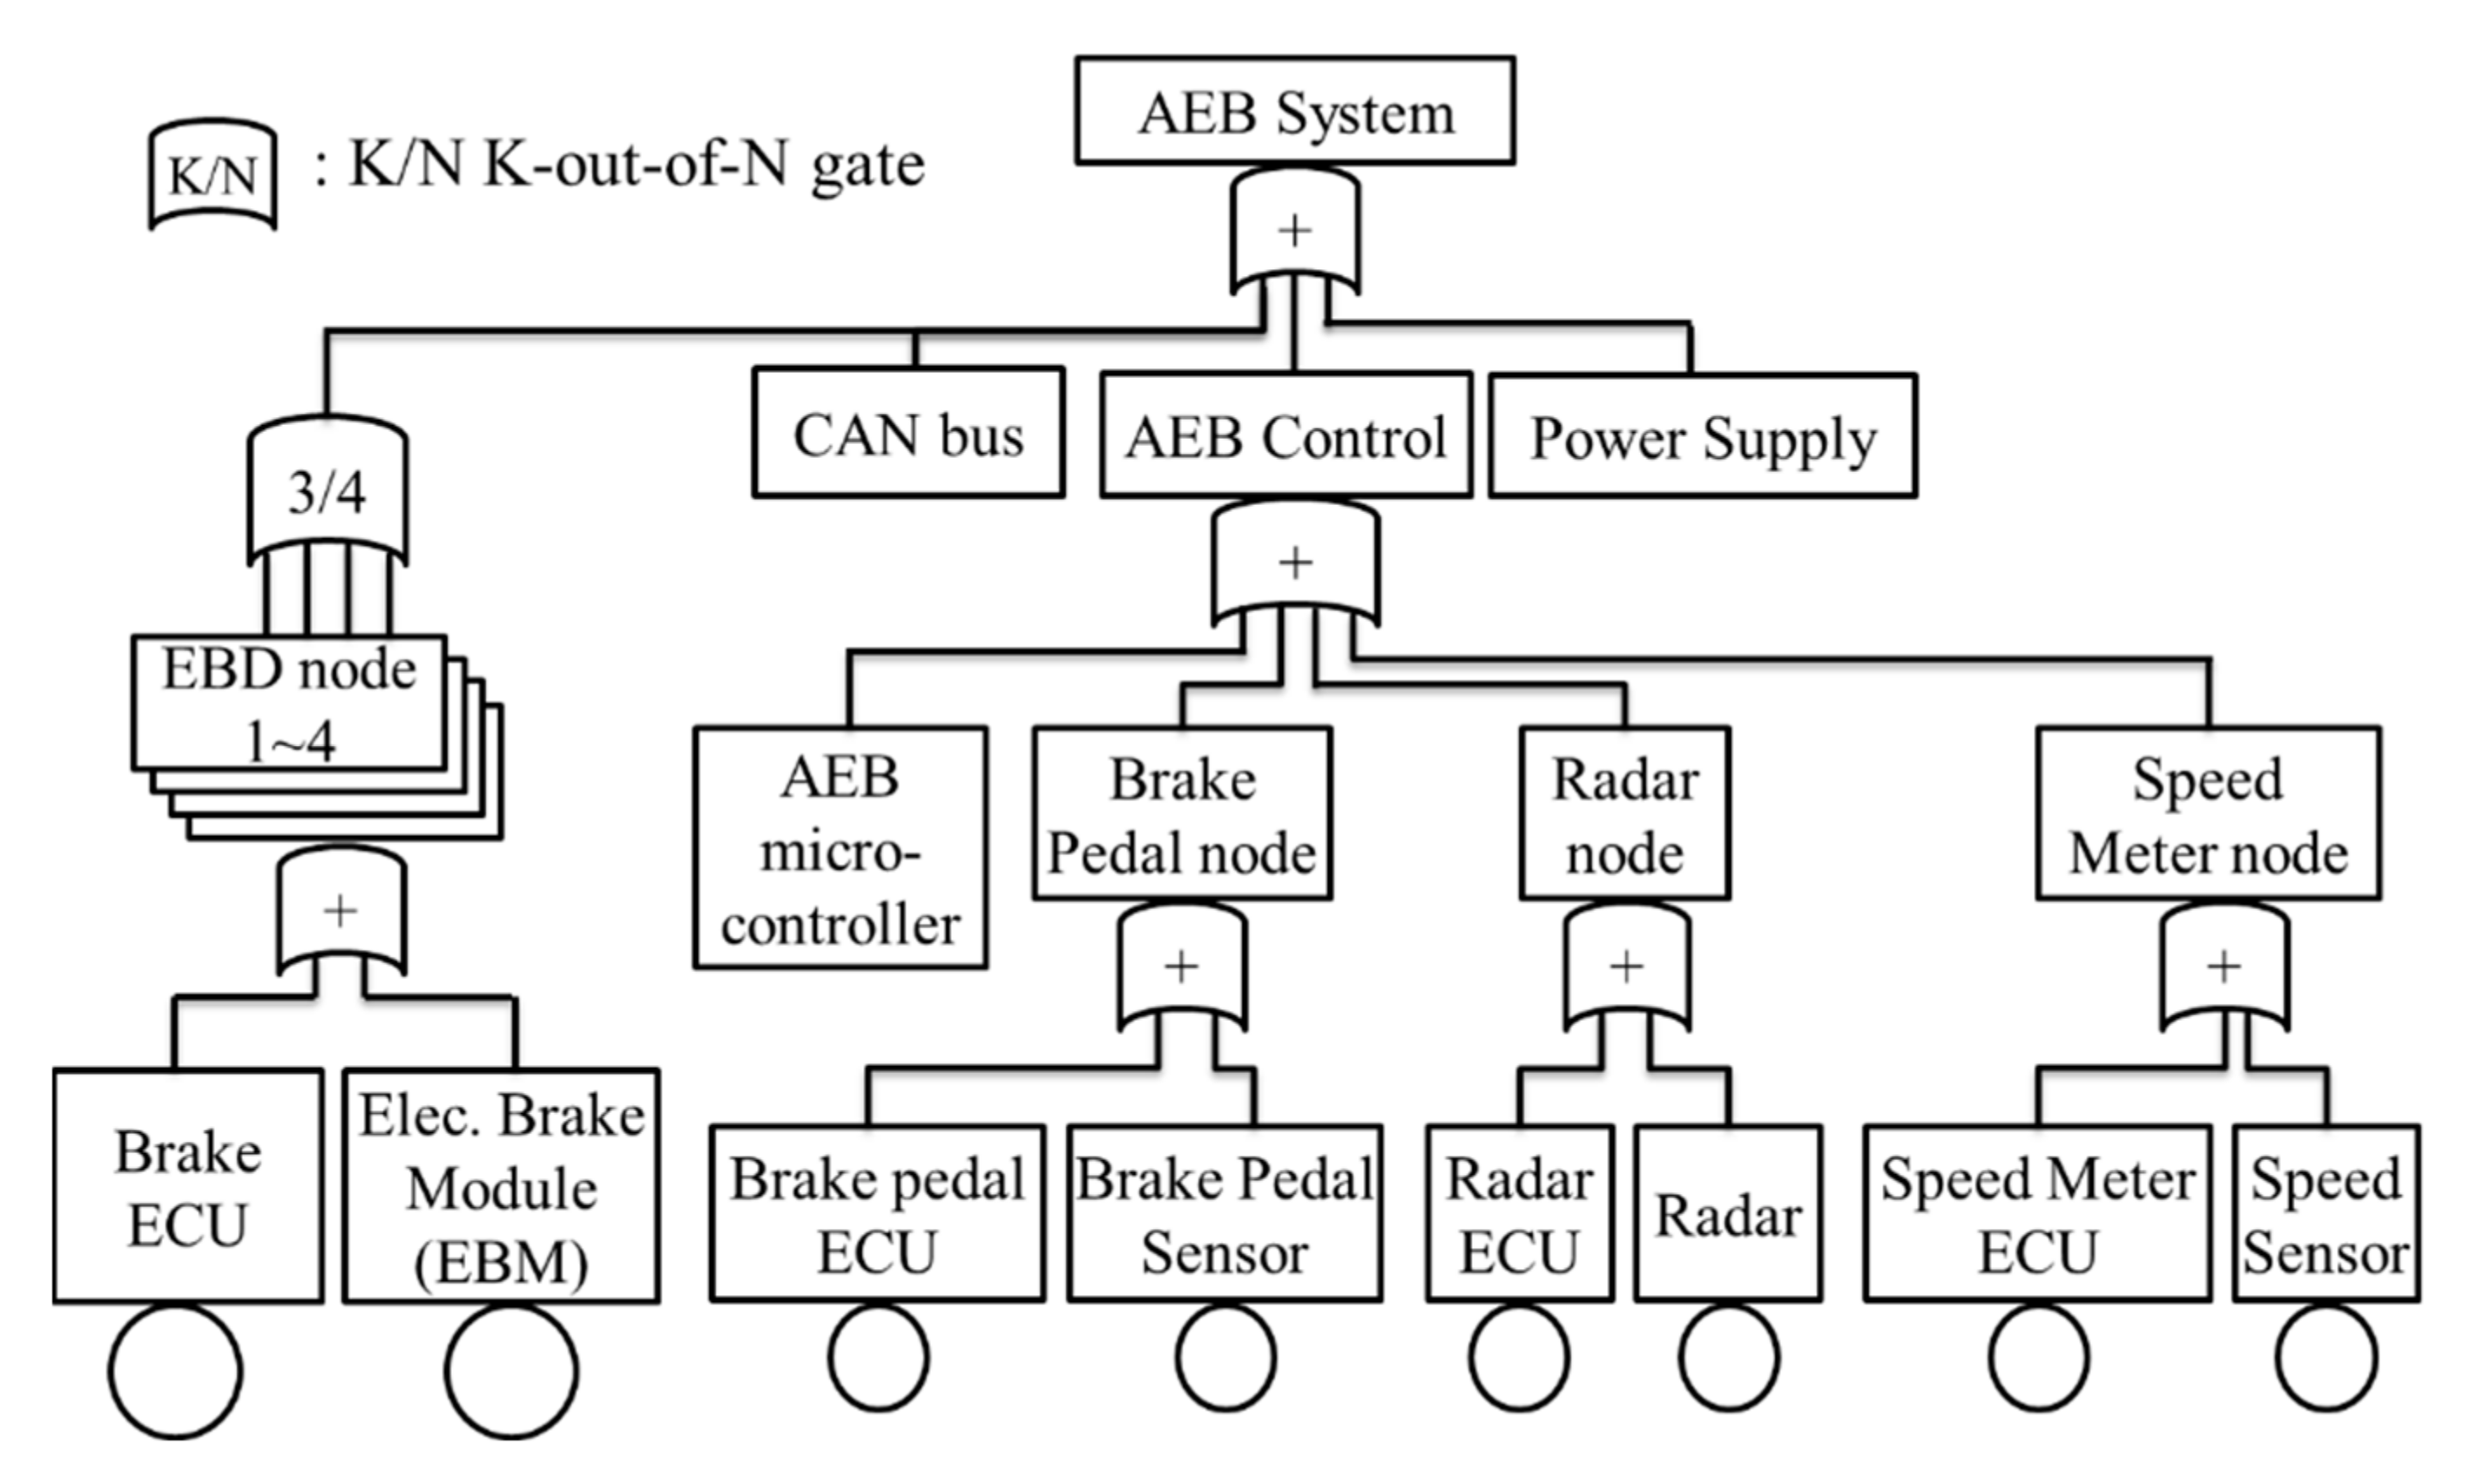
Figure 7 shows the hardware architecture of the AEB system. The CAN bus is adopted as an in-vehicle communication backbone. According to the designer’s requirements, other advanced in-vehicle communication protocols such as FlexRay or automotive Ethernet can also be employed.
The braking function of the AEB system is implemented with fail-operational consideration. Once any one among four EBD nodes (whether the Brake ECU or the EBM, Electric Brake Module) is diagnosed as having failed, the AEB control node will stop sending the braking force to the failed EBD node. Under the circumstances, braking forces are redistributed to the remaining three working EBD nodes. Therefore, the AEB system can tolerate one failed EBD node with degraded braking performance.
Figure 8 illustrates the fault tree constructed from the hardware architecture as shown in
Figure 6. The K-out-of-N (or K/N) gate reflects the fail-operational design concept 3/4 (3-out-of-4) gate for four EBD nodes. It means that the failure of one EBD node will not lead to the AEB system failure.
One thing should be pointed out, and that is the concept of safety mechanism library presented in
Section 4.3.1 is developed only for demonstrating the idea of the proposed safety framework. However, the variety of safety mechanisms or fault-tolerant techniques in the real world is more diverse than the safety mechanisms defined in
Section 4.3.1. Therefore, in addition to the safety mechanisms described in
Section 4.3.1, we also employ other types of safety mechanisms in the case study to concretely demonstrate our safety framework with more diverse safety mechanisms in the design of safety-critical automotive systems.
There are two kinds of safety mechanisms used in the case study, which do not belong to the safety mechanism library depicted in
Section 4.3.1. The first one is the aforementioned k-out-of-n design applied at the system level instead of the element level for the EBD nodes. The advantage of implementing the element protection at the system level is that the additional safety mechanism for each individual hardware element is not required but needs to develop the error detection scheme to monitor the healthy status of EBD nodes. Here, we assume that an error detection has been embedded in each of the EBD nodes. Moreover, the corresponding design and verification complexity are raised as well. Besides, an issue arises regarding such a design, and that is how one can evaluate the failure rates for the hardware elements, i.e., Brake ECUs and EBM in this case study, under the protection of the K/N fault-tolerant design. In fact, the failure rates of each individual hardware element cannot be evaluated through the proposed expressions (1) and (2) because the effectiveness of the K/N fault-tolerant design cannot be directly represented by the diagnostic coverage
and
. Instead, only an overall failure rate for the whole K/N-formed subsystem constituted by the four EBD nodes can be evaluated. The detailed steps for the evaluation are illustrated as follows.
- (1)
Let λB_ECU, λEBM, and λEBD be the failure rates of the Brake ECU, EBM, and EBD nodes (which represents any one of EBD nodes 1-4) and then λEBD = λB_ECU + λEBM because either the failed Brake ECU or failed EBM would lead to the failure of the EBD node.
- (2)
Let
RK/N(t) be the reliability of the K/N-formed subsystem estimated at mission time
t and then the
RK/N(t) can be computed through expression (27) as shown below [
29,
30].
- (3)
Let
λK/N_Sub be the failure rate of the K/N-formed subsystem and then the
λK/N_Sub can be acquired by the following expression (28).
The second type of safety mechanism is the hardware duplication. To protect the selected hardware element with duplication, a duplication of the original hardware element is required. Next, the original and the duplicated hardware elements are formed as a pair, and each output of the paired hardware elements is compared to check the consistency through a comparator. Any inconsistency means that there must be at least one faulty element in the hardware pair. It is worth noting, in this work, we assume that the duplicated hardware element is implemented with the diversity technique so that the probability of common-cause failure occurring is reduced to be low enough and can be ignored. Thus, the formed hardware element pair combined with the comparator will cause the safety goal violation only when all of them fail concurrently. Such a fault scenario conforms to the three-point faults, which have been classified into a safe fault as mentioned in
Figure 1. Thus, the failure rate of the hardware element deployed with hardware duplication will not be counted when computing the three hardware architecture metrics. However, the hardware overhead required to implement the hardware duplication technique will be 100%.
In this demonstration, we specify ASIL D as the target to be achieved. Thus,
PMHFtar,
SPFMtar, and
LFMtar are required to be 10
−8 h
−1, 99% and 90%, respectively. The hardware element’s failure rates used for the purpose of demonstration are listed in
Table 11. System engineers may specify more realistic component failure rates by applying reliability data books such as SN-29500, IEC-62380/61709, and HDBK-217F, which are widely adopted in the related industry. The percentage of non-safe faults and the applied safety mechanism library for each hardware element can also be found in
Table 11. Besides, the mission time
t is set to be five thousand hours, and the hardware overhead constraint
HO_Maxsys is set to be 40%.
Now we can compute
by applying the specified failure rates and mission time to expressions (27) and (28), respectively. The acquired
is 4.18 × 10
−11.
is approximately −3~−4 order of magnitude compared to the failure rates of other hardware elements, so its effect on the overall system’s failure rate can be ignored. Thus, the
will not be counted in the following hardware architecture metric calculation. In addition, the K/N-formed subsystem, i.e., the four EBD nodes, is also excluded in the FTA-based weak-point analysis. In addition to the K/N-formed subsystem, the identified MCS failure probability, acquired by quantified gaps through expressions (18)–(20) and the corresponding
Max_Gap are summarized in
Table 12.
According to
Table 12, the
PT is assigned as
PT =
PT_MBP = {CAN bus, AEB microcontroller, Brake pedal sensor, Brake pedal ECU, Radar, Radar ECU, Speed sensor, Speed Meter ECU}. Then the ASIL-oriented hardware architecture exploration algorithm is performed. For the sake of saving space, the AEB microcontroller, Brake pedal sensor, Brake pedal ECU, Radar ECU, Speed sensor, and Speed Meter ECU are abbreviated as AEB_MCU, B_SEN, B_PECU, R_ECU, S_SEN, and S_ECU, respectively, in the following demonstration.
Among all MBP weak points, it is evident that the
Max_Gap of the CAN bus and AEB_MCU are much higher than others. Thus, to reduce the failure rates of these two hardware elements more efficiently, we apply the hardware duplication with diversity design to the CAN bus and AEB_MCU to let their faults become safe faults.
Table 13 exhibits the results of the safety mechanism deployment in this design iteration.
After safety mechanism deployment, the hardware architecture metrics are calculated as shown below:
Consequently, only the
still exceeds
and therefore a subsequent design iteration is required. The process of the FTA-based weak-point analysis and ASIL-oriented hardware architecture exploration at subsequent design iterations is very similar to the previous iteration and omitted here. The derived outcomes of safety mechanism deployment are
SMCAN bus =
SMHHH,
SMAEB_MCU =
SMHHH,
SMB_SEN =
SMHHH,
SMB_PECU =
SMMMM,
SMRadar =
SMHHH,
SMR_ECU =
SMMMM,
SMS_SEN =
SMHHH,
SMS_ECU =
SMMMM,
SMPS =
SMLML (PS stands for the power supply) and the corresponding hardware architecture metrics all comply with the target ASIL D requirements, which are SPFM = 99.87%, LFM = 99.89%, and PMHF =
. To reach these results, there are ten design iterations executed. Next, the total hardware overhead needs to be calculated according to the hardware overhead data summarized in
Table 14.
Because the current system hardware overhead does not meet the constraint, the HO-oriented hardware architecture exploration algorithm is activated to solve the hardware overhead problem.
The process of performing the HO-oriented hardware architecture exploration is similar to the previous example presented in
Section 4.3.3. Therefore, we do not repeat the process and directly provide the modified parts, which are summarized as follows:
- ➢
SMS_SEN = SMHHH → SMMHM, SMS_ECU = SMMMM → SMMHM and SMPS = SMLML → SMHHH.
- ➢
HO_Totalite_d(%) < HO_Maxsys.
- ➢
Hardware architecture metrics, which all comply with the target ASIL D requirement are SPFM = 99.83%, LFM = 99.52%, and PMHF = .
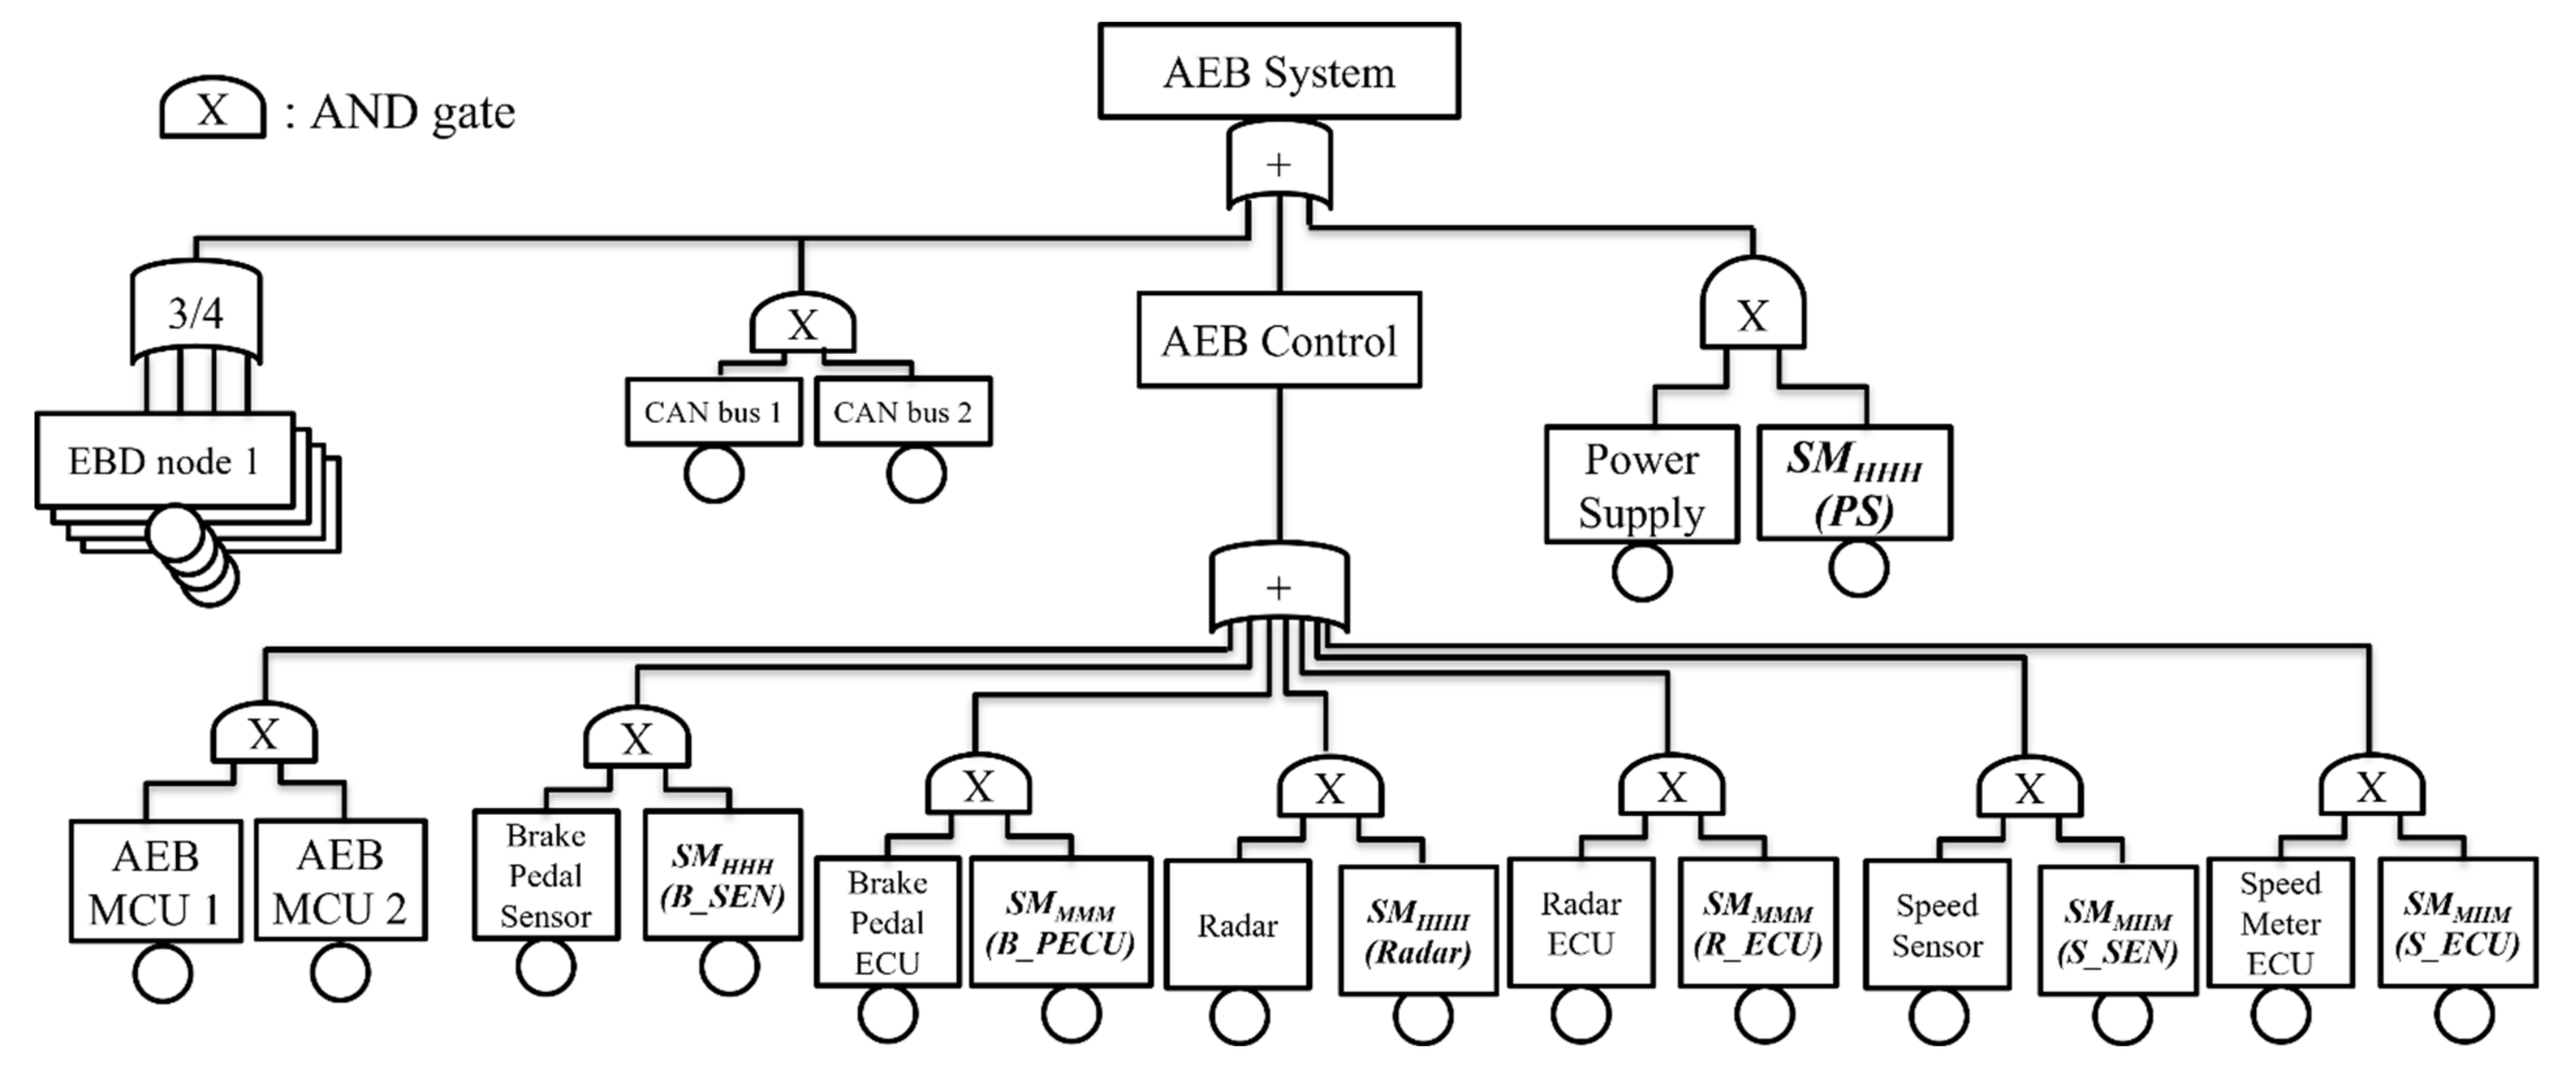
Thus, after a total of thirteen design iterations, including eleven iterations for the ASIL-oriented algorithm and two iterations for the HO-oriented algorithm, the resulting fault tree and the FMEDA report are obtained, as shown in
Figure 9 and
Table 15, respectively.
Through the AEB case study, we have illustrated the proposed safety-oriented system hardware architecture exploration framework for the safety-critical automotive system design. Furthermore, the remarkable performance of the proposed framework has also been demonstrated so only a limited number of design iterations is required to achieve a cost-effective and reliable hardware architecture that complies with the ASIL safety goal and hardware overhead constraint simultaneously.


