1. Introduction
In recent years, as enhancement of the driving experience and comfort of consumers become paramount, the reduction in vibrations in vehicles during engine idling has garnered significant research attention. The vibration during engine idling is transmitted from an operating engine to a passenger while a vehicle is stationary, which significantly influences the buying preference of consumers. The vibrations during engine idling are clearly perceived by passengers, which, when large, negatively impacts the passengers’ impression of the vehicle. Such vibrations are dominated by low-frequency components and differ from those caused by road and wind perturbations during driving. Moreover, because compression-ignition-type diesel engines bear a substantially higher compression ratio than spark-ignition-type gasoline engines, diesel engines exhibit remarkably larger vibrations during engine idling than gasoline engines. Accordingly, various methods have been studied extensively for the reduction in vibration in diesel vehicles during engine idling.
Fundamentally, the vibration occurring during engine idling can be reduced by minimizing the vibration of the engine and transmission, which act as vibration sources during engine idling. To this end, several researchers have reported on related and relevant topics. Zheng et al. [
1] proposed an engine–transmission control approach to improve fuel economy during urban driving and reduce the engine vibrations transmitted to the passenger compartment. Kim and Park [
2] introduced two intelligent control systems to reduce the fluctuations in engine speed in idle conditions, namely an evolutionary computing control based on genetic algorithms and a stochastic control based on the Alopex algorithm. Fu et al. [
3] proposed a hybrid proportional electromagnetic dynamic vibration absorber comprising an electromagnetic actuator and an elastic element to control the engine vibration during idling. Moreover, Shen et al. [
4] presented an experimental study on the first-order vibration improvement of a malfunctioning vehicle in development during the engine idle condition. They analyzed the generation mechanism of the first-order vibration problem during engine idling, and subsequently, experimentally derived the possible vibration excitation source and transfer path.
Recently, several studies have been conducted to reduce the vibration caused by the gear rattle in the transmission during idling [
5,
6,
7,
8,
9]. Shangguan et al. [
5] proposed a nonlinear torsional model of a driveline system to study the gear rattle during idling and advanced a design guideline for the selection of adequate clutch stiffness and damping properties of the clutch to reduce gear rattle. Yucesan and Sezer [
6] employed an analytical model featuring a new time-varying gear mesh stiffness function to investigate the influence of the clutch disk mechanism on the rattle during engine idling. Based on the magnetorheological effect in elastomeric spring elements, Brancati et al. [
7] developed a device housing a flywheel equipped with a torsional vibration damper, which can reduce the gear rattle of the flywheel in a low-speed regime. Chen et al. [
8] conducted a study to reduce the vibration of a dual-mass flywheel torsional damper under multiple working conditions including ignition, idle, startup, and drive conditions.
Excluding the engine and transmission, the vibration of vehicle components situated along the vibration path during engine idling have been minimized in numerous research. Among these studies, the studies related to mount structures have been most actively conducted. Choi and Song [
9] proposed a magnetorheological engine mount for the vibration control of a vehicle and evaluated the vibration at the driver’s position in the time and frequency domains. Azadi et al. [
10] introduced a new engine mount with variable stiffness, which provides superior vibration control over that of a hydro-mount and a passive rubber mount under idling conditions. For vibration attenuation during engine idling, Guo and Zhou [
11] developed a non-linear lumped-parameter model of a semi-active engine mount with air springs. To reduce the steering-wheel jitter of a commercial vehicle during engine idling, He et al. [
12] studied the vibration isolation performance of a powertrain suspension system.
In addition, many researchers have attempted to reduce the vibrations of vehicle parts other than engine mounts during engine idling. Lim et al. [
13] proposed methods for reducing the transmitted vibration forces caused by the mass unbalance of the radiator cooling fan that occurs during vehicle idling. They demonstrated that the force of vibration of the cooling fan can be reduced by increasing the stiffness of the shroud stators and decreasing the stiffness of the rubber mountings. Wang et al. [
14] put forward a half-vehicle suspension model with a double-delay feedback control to improve the vibration performance under idling conditions; the results indicate that the active suspension featuring time-delayed feedback control improved the vibration reduction.
Moreover, researchers have explored various methods to reduce the vibration transmitted to the passenger compartment or the steering wheel during engine idling. Bohn et al. [
15] presented an approach for the active control of a vehicle subjected to harmonic disturbances with time-varying fundamental frequencies. Using this approach, they significantly reduced the sound and vibration levels within the passenger compartment during engine idling. Han et al. [
16] investigated the cause of severe vibration of a vehicle with a four-cylinder engine under engine idling conditions and presented an improved structural design of the vehicle floor to avoid the occurrence of resonance. To reduce the vibration of the steering column during engine idling, Kim and Kim [
17] developed an optimal design process for steering column and supporting systems. To improve the overall performances of an automotive steering system, Wang et al. [
18] studied the performance of the steering system in terms of steering feel, sensitivity, and modality, and reduced the engine vibration at idle condition. Considering the coupling effect of the multi-source vibration transfer paths, He et al. [
19] introduced a multi-point iterative analysis method to reduce the total vibration of the steering wheel at idle speed. To solve the vibration problem of an automotive steering wheel under idling condition, Tang et al. [
20] proposed a multi-node joint vibration control strategy on the basis of the associated vibration path of the steering wheel.
Although several researchers have sufficiently improved the idling engine vibration condition for passenger cars, the vibration from diesel sport utility vehicles (SUVs) remains a matter of dissatisfaction for consumers. To effectively reduce the idling engine vibration of SUVs, a systematic approach, which can clearly analyze the source and transmission path of this vibration using mathematical modeling, is required. In prior studies, researchers have attempted to reduce idling-engine vibrations by targeting specific parts of the vehicle, such as the engine, transmission, mount, body floor, and steering wheel, without considering the entire transmission path of the vibrations. However, not only the aforementioned parts, but also the radiator, intercooler, and front-end module are present in the transmission path of the vibrations; thus, these parts should be considered to reduce the idling engine vibration of diesel SUVs. To the best of the authors’ knowledge, studies on the reduction in idling engine vibration, wherein all the parts on the transmission path of the vibration were considered, have not been attempted as yet; this is a challenging task because of the complexity of the connecting structures and supporting conditions of these parts. Accordingly, in this study, we established a dynamic model including those parts on the transmission path of vibration for a diesel SUV and reduced the idling engine vibration by implementing an optimal design based on the established model. The approach presented in this study can effectively improve the idling vibration of a diesel SUV and reduce the time and cost involved in the development or design stage.
The contents of this paper aimed at the analysis and reduction in the idling engine vibration of a diesel SUV are as follows. In
Section 2, the analysis results of the idling vibration have been presented; an operational deflection shape (ODS) analysis was performed to observe the dynamic deformation of the SUV during engine idling. In addition, an experimental modal analysis was performed for the SUV components related to idling vibration. The experimental and analytical methods to obtain various modeling parameters, including the engine excitation force as well as the stiffness and damping properties of the bushings and hoses, are presented in
Section 3. In
Section 4, a dynamic model to predict idle vibration has been established for the diesel SUV; this model was verified by comparing the computational and experimental results. To identify the major design factors that considerably influence the idling vibration, a parametric study on various design factors was conducted, as presented in
Section 5. Based on the results of this study, an optimal design featuring significant design factors was obtained to reduce the idling vibration, and a design guide for reducing the idling vibration has been proposed. Finally, the results and conclusions of this study have been summarized in
Section 6.
2. Experimental Analysis
The paths through which the idling vibration is transmitted were identified prior to the experimental analysis of the dynamic behavior of a diesel SUV during engine idling. The diesel SUV considered in this study possessed a transverse-mounted four-cylinder engine driven by its front wheels; this SUV produced considerable vibrations that were perceivable by the passenger. Generally, the powertrain (i.e., the engine and transmission) of the transverse engine is placed parallel to the driving axis of the front wheels. To identify the transmission paths, automotive parts related to the transmission of vibrations were selected, and the connecting structures of these parts were analyzed in terms of their dynamics. As shown in
Figure 1, the main components on the transmission paths from the idling engine that generates vibrations to the floor of the driver’s seat are the powertrain, radiator, intercooler, front end module (FEM) carrier, side member, cross member, and the body floor. The
x-,
y-, and
z-axes represent the longitudinal, transverse, and vertical directions of the vehicle, respectively.
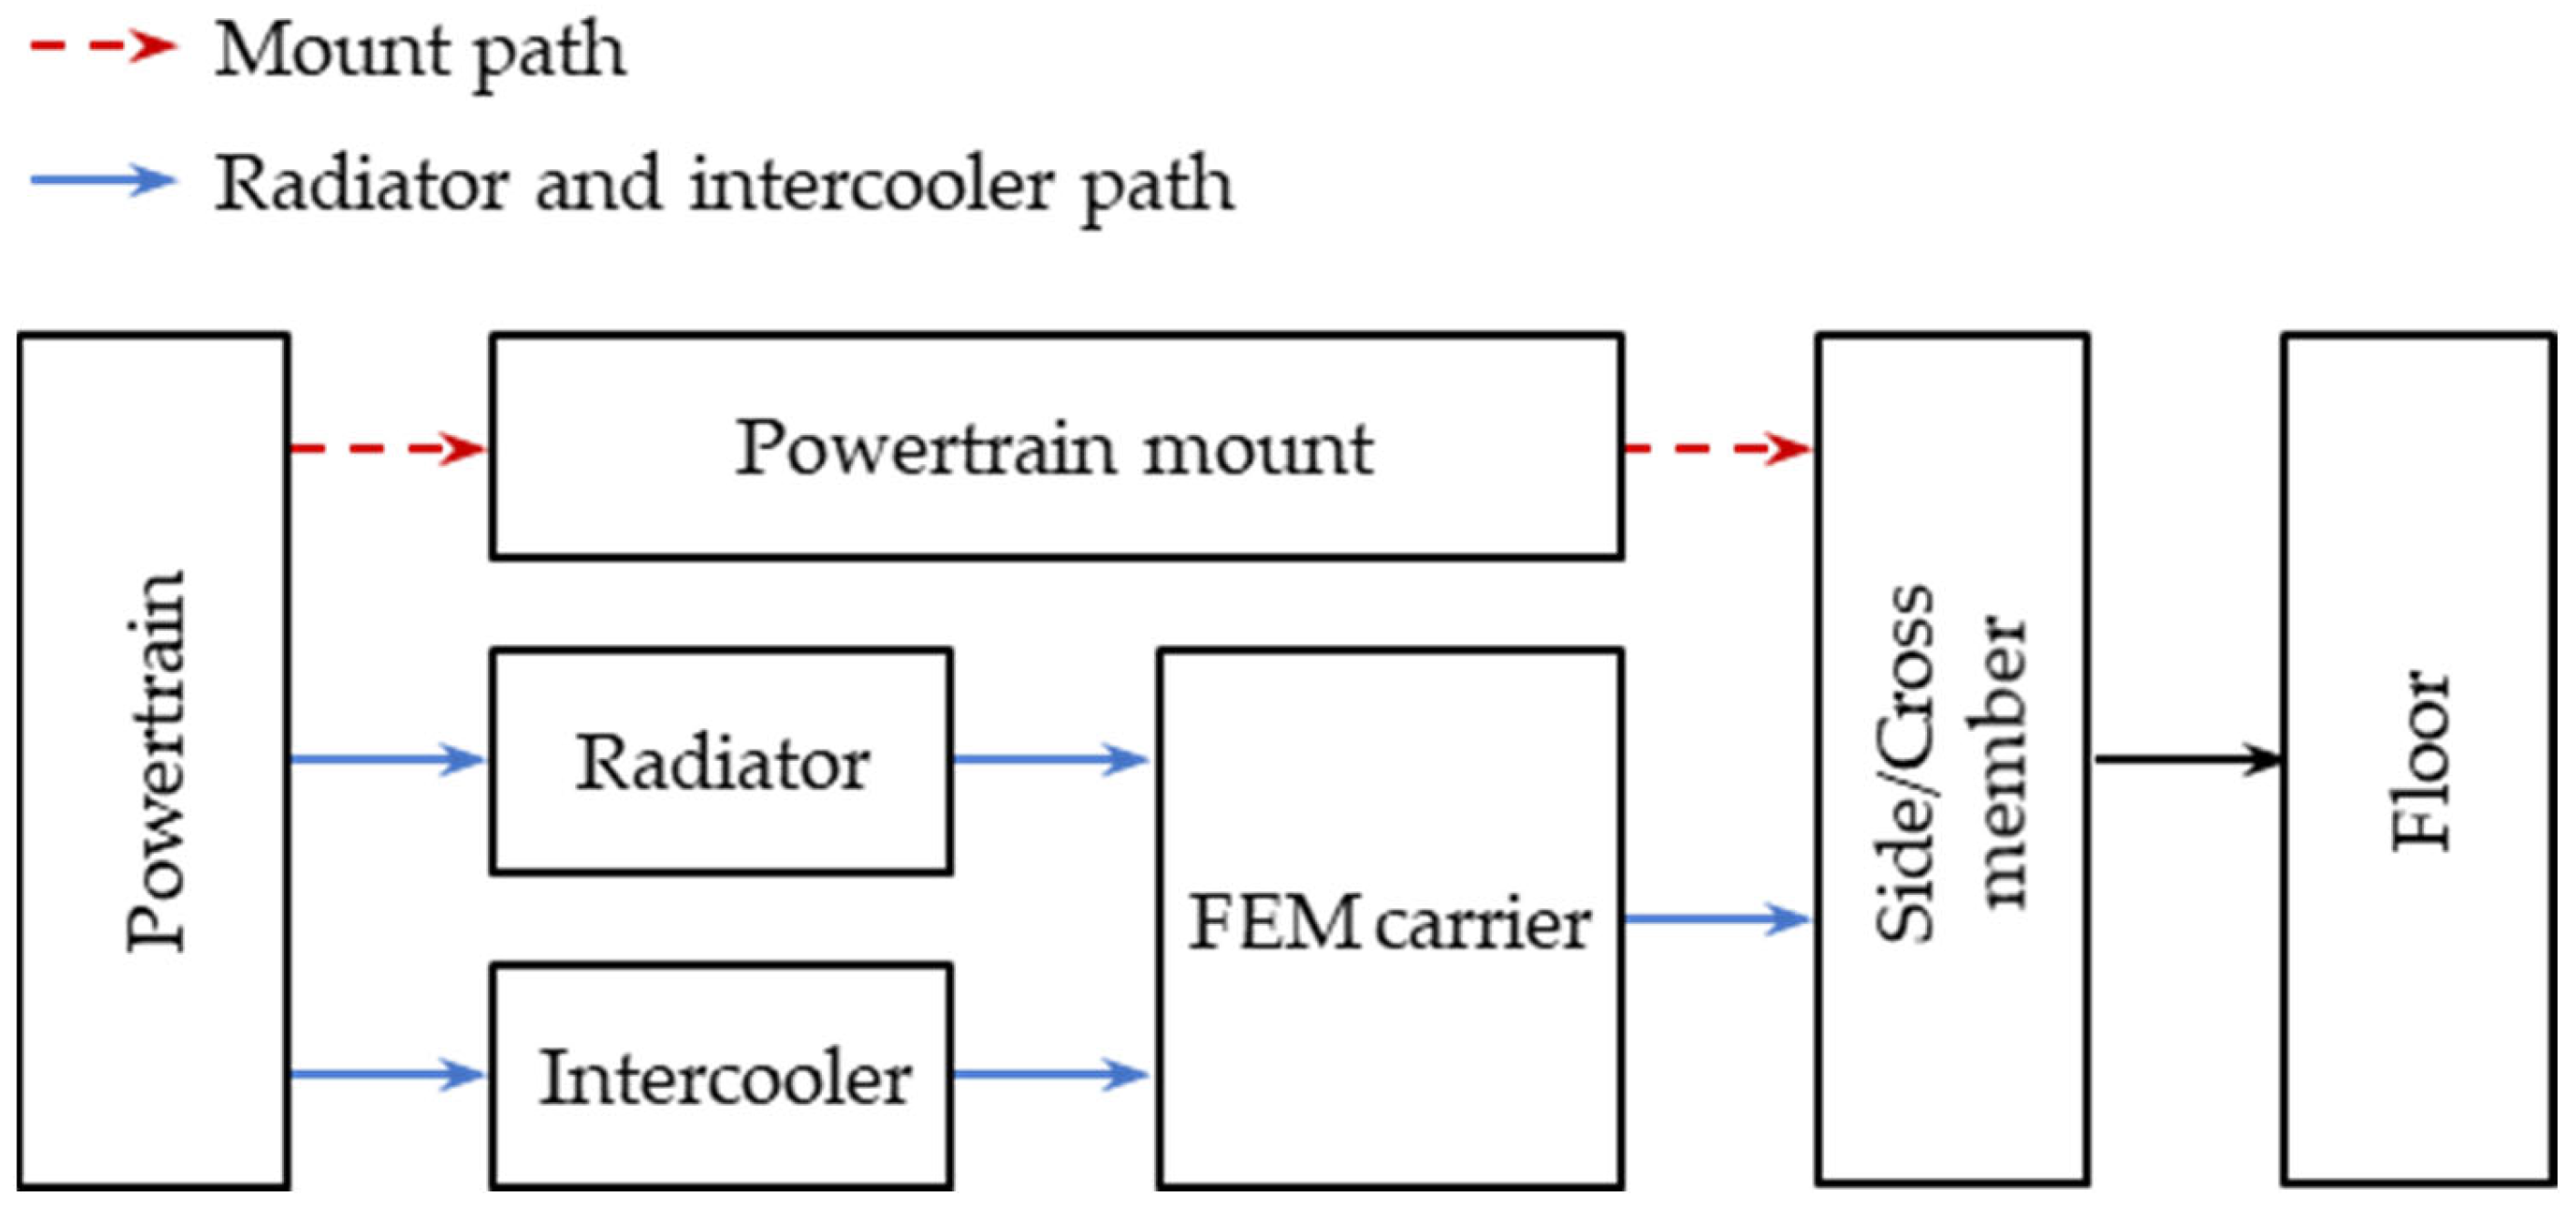
The vibrations produced by the idling engine are mainly transmitted along two paths from the engine to the body floor, as shown in
Figure 2. The first path lies through the mounts of the powertrain, whereas the second path lies through the radiator or intercooler. First, the powertrain mount serves as the path through which the vibration is transmitted sequentially from the powertrain, three mounts, the front side member, and the body floor. The side member structurally supports the powertrain and imparts strength and rigidity to the front body. The powertrain mounts reduce the idling vibrations caused by the explosive force of engine, which are transmitted to the body floor. The powertrain used in this study is supported at three points by an engine mount, a transmission mount, and a roll mount. Herein, the engine and transmission mounts are fixed to the right and left side members, respectively, and the roll mount is fixed to the cross member. The side and cross members are welded and strongly bonded to the body floor.
Furthermore, the radiator/intercooler path consists of the powertrain, a radiator/intercooler, an FEM carrier, a side member, and the body floor. The cooling systems, i.e., the radiator and intercooler, which are located at the front of the powertrain, are connected to the engine through the inlet and outlet hoses. The hoses connecting the radiator and the powertrain are made of rubber, and the hoses connecting the intercooler and the powertrain are composed of plastic and rubber. In particular, the radiator and intercooler are mounted on the FEM carrier with rubber bushings. The radiator is connected to the FEM via two upper and two lower bushings, whereas the intercooler is connected to the FEM via one upper and two lower bushings. The FEM carrier is firmly bolted to the front of the side member.
When the engine is in an idle state, the dynamic behaviors of the powertrain, radiator, intercooler, and body, which are components of a diesel SUV, were investigated through an ODS analysis. The ODS represents the shape of a structure that has been deformed or set into motion by an excitation force, and it is generally used to analyze the shape deformation over time or at a specific frequency. To analyze the vibration of the SUV during engine idling, the dynamic deformation shapes of various vehicle parts at the excitation frequency under idling conditions were obtained through ODS analysis. In this paper, the experimental method for the ODS analysis has been briefly described. Please refer to the concerned study [
21] for more details on the ODS analysis and related experimental method.
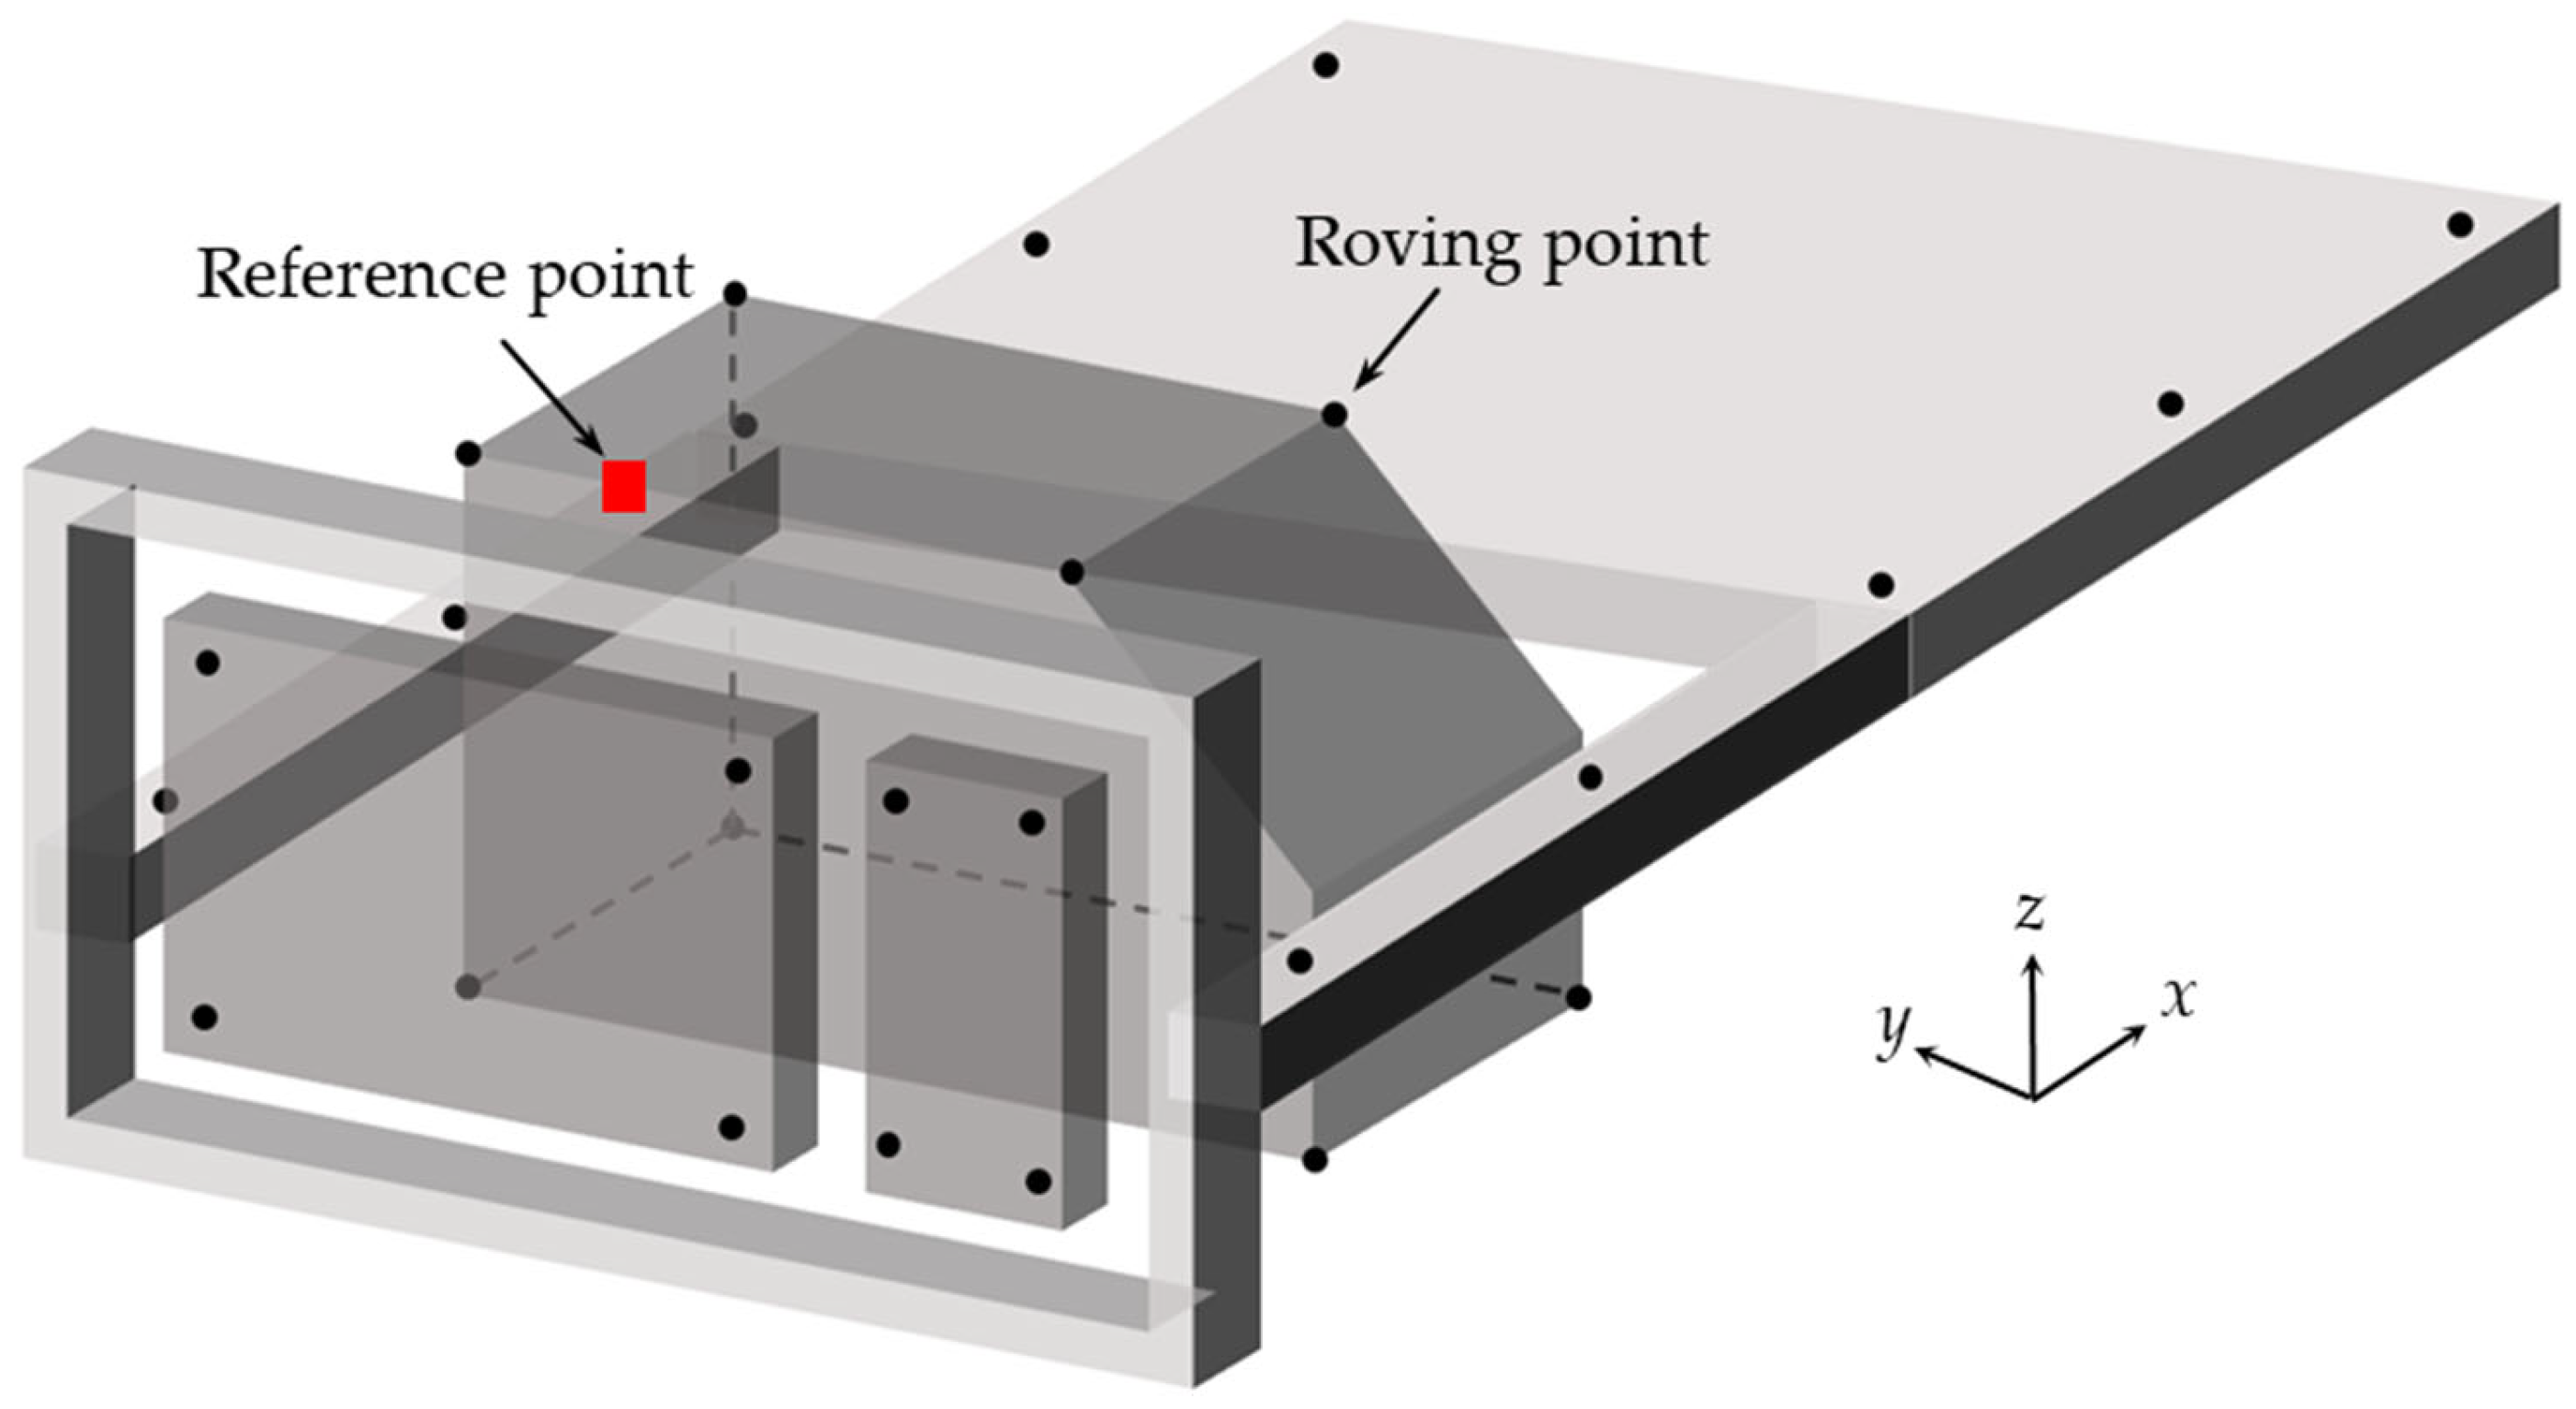
To obtain the ODSs of the components, we used triaxial accelerometers (PCB 356A15) capable of sensing vibration signals in three mutually perpendicular directions. The accelerometers are attached to the measurement points to obtain the ODSs, as shown in
Figure 3, wherein the squared and circled markers represent the measurement points for the reference and roving vibration signals, respectively. The reference signal was measured at the top end of the engine, whereas the roving signals were measured at the designated points to identify the behavior of each component. To obtain the ODS of the powertrain, vibration signals were measured at a total of eight points (four points at the top and four points at the bottom of the powertrain). To acquire the ODSs of the radiator and intercooler, vibration signals were measured at eight points, each with four vertices. Finally, vibration signals were measured at two points on each side member, a total of four points, and six points on the car body floor to analyze the ODSs of the side members and body floor.
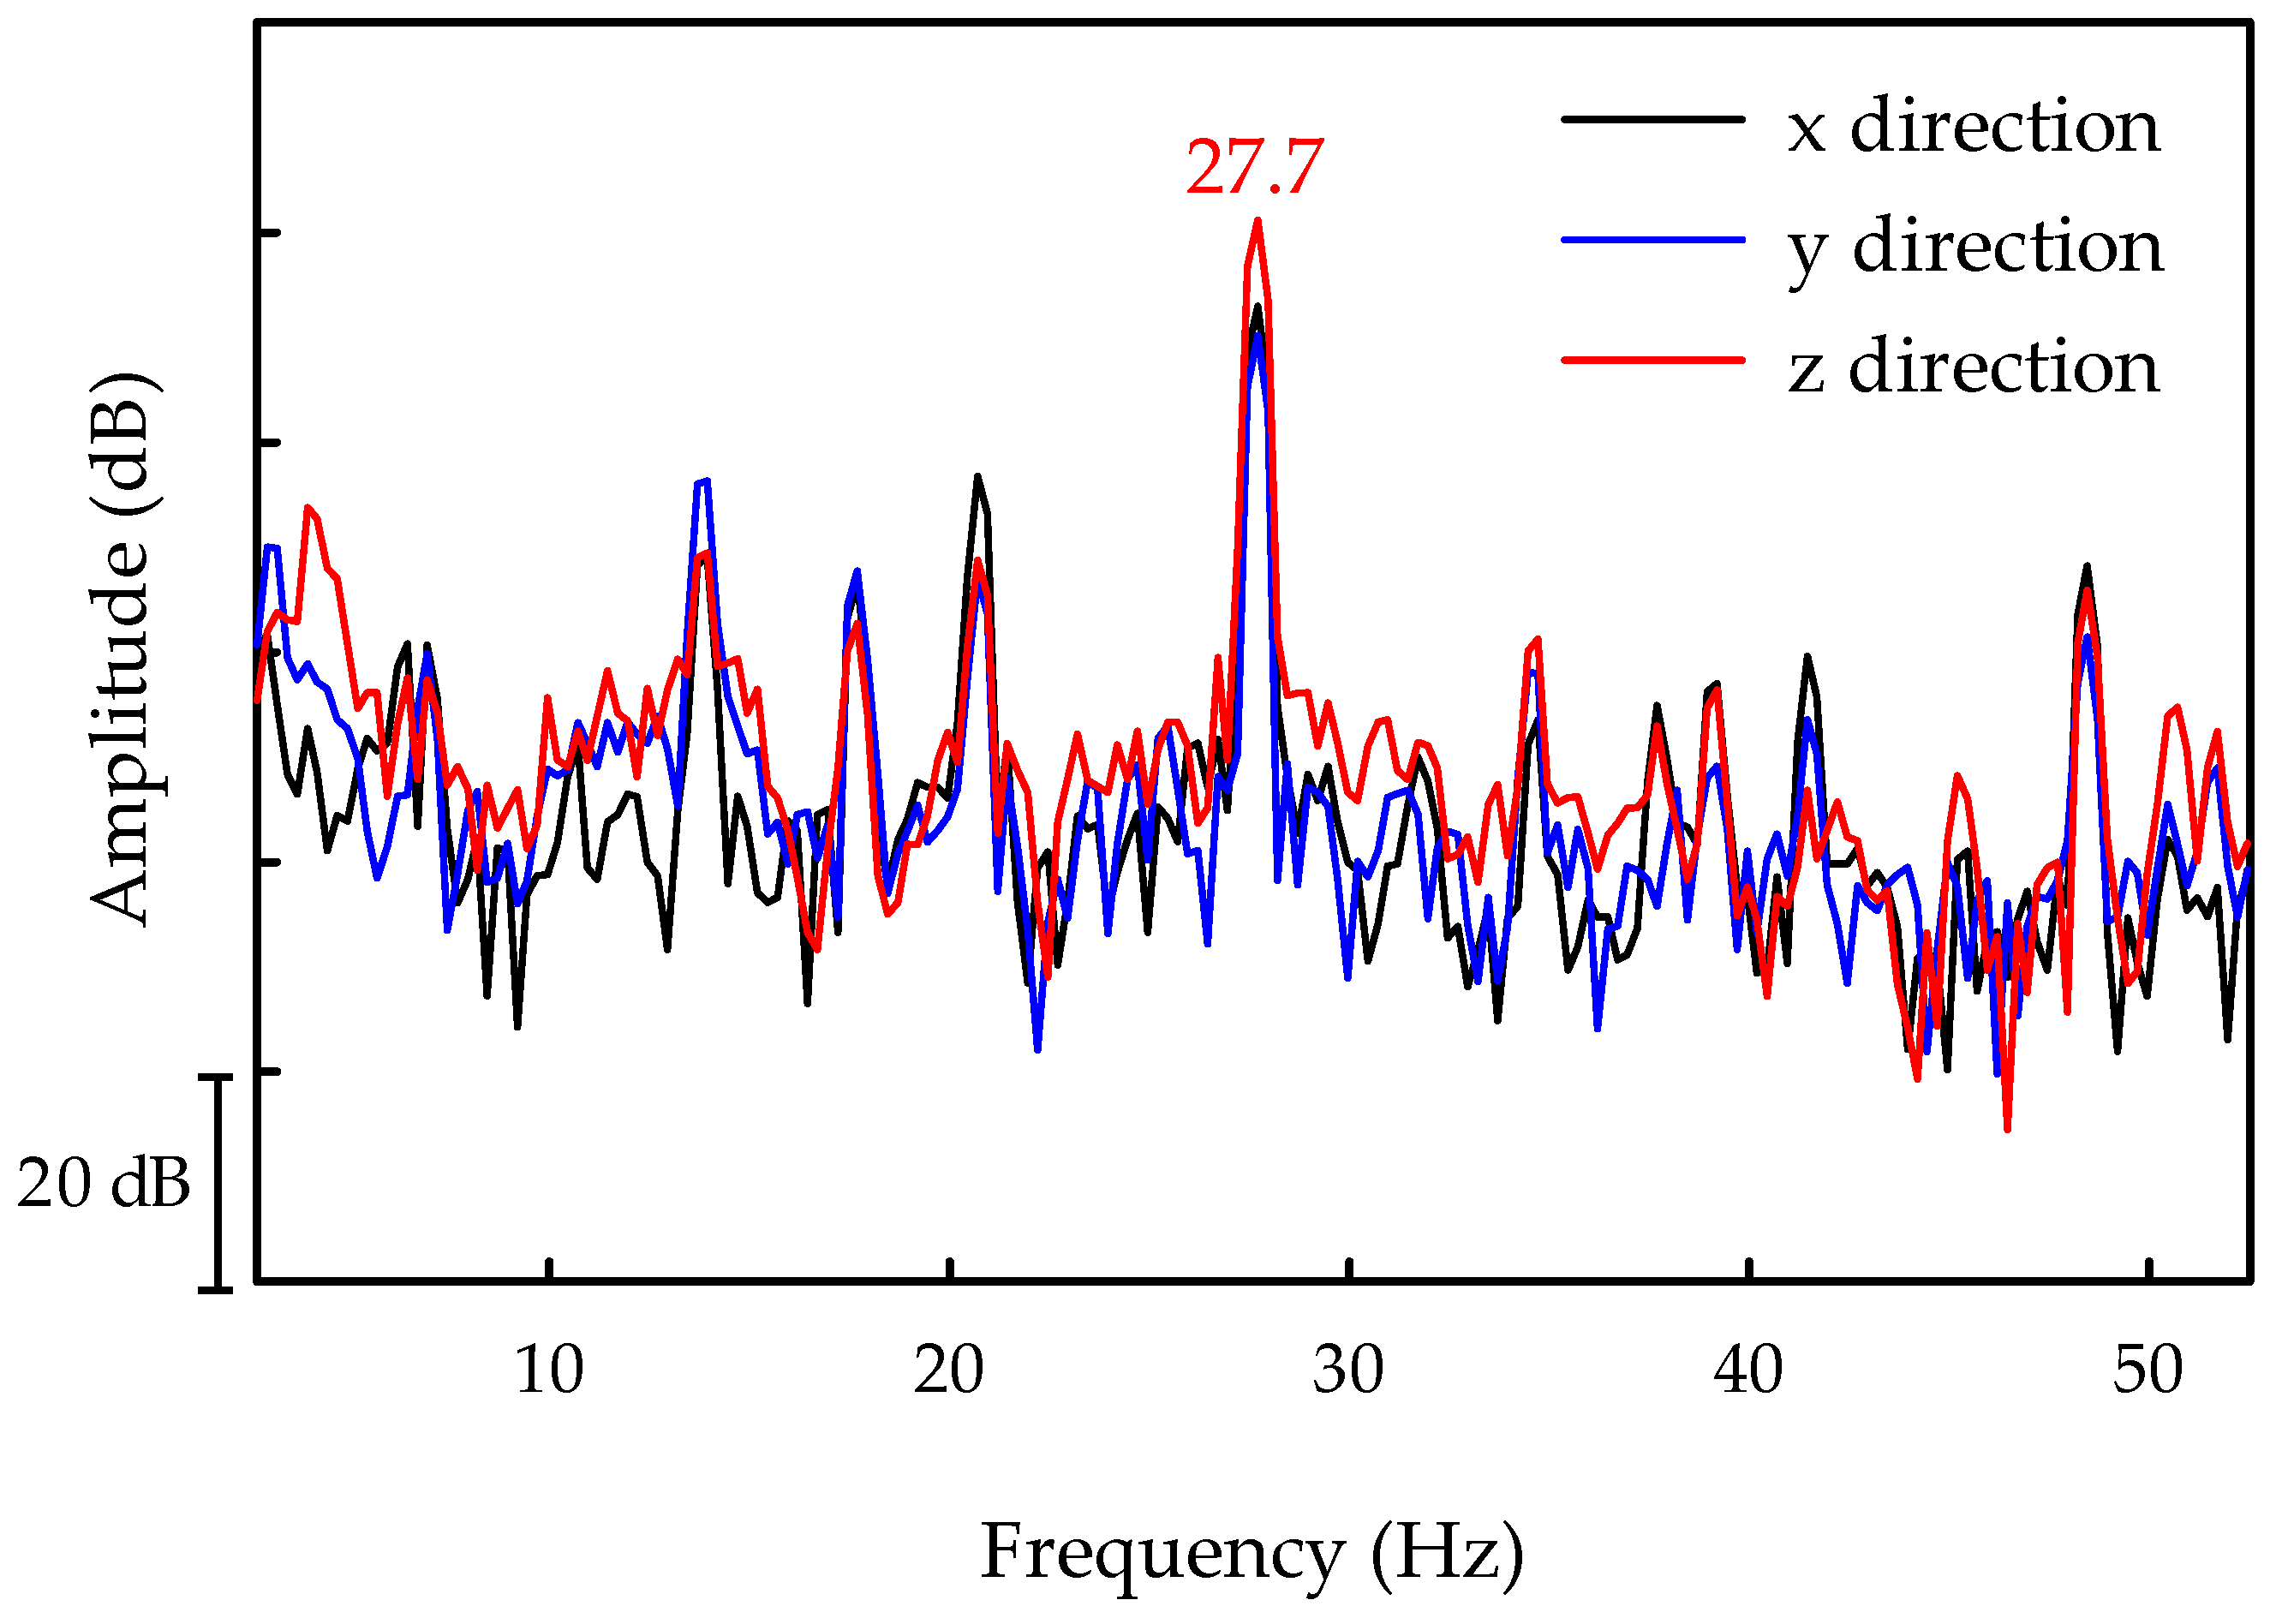
The vibration signals measured by the accelerometers were analyzed by a sound and vibration analyzer (B&K 3560-D) with 60 channels to obtain the ODSs. The amplitudes and phases of auto-spectra and cross-spectra were obtained using the analyzer. Based on these measurements, the ODS frequency response functions of the roving signals with respect to the reference signal were extracted, and subsequently, the ODS of each component was derived. The ODSs were measured for an operating engine speed of 830 rpm in the idle engine state. Considering the four-cylinder diesel engine of the SUV, the excitation frequency emitted by the engine in the idle state was 27.7 Hz. The frequency spectra for vibration signals in the three mutually perpendicular directions at the position of the driver’s seat on the body floor under idling engine conditions are depicted in
Figure 4. As shown in this figure, the spectra exhibit large peaks at the idling frequency of 27.7 Hz. The ODSs of the powertrain, radiator, intercooler, and body floor of the SUV were analyzed at an engine excitation frequency of 27.7 Hz in the idle state (
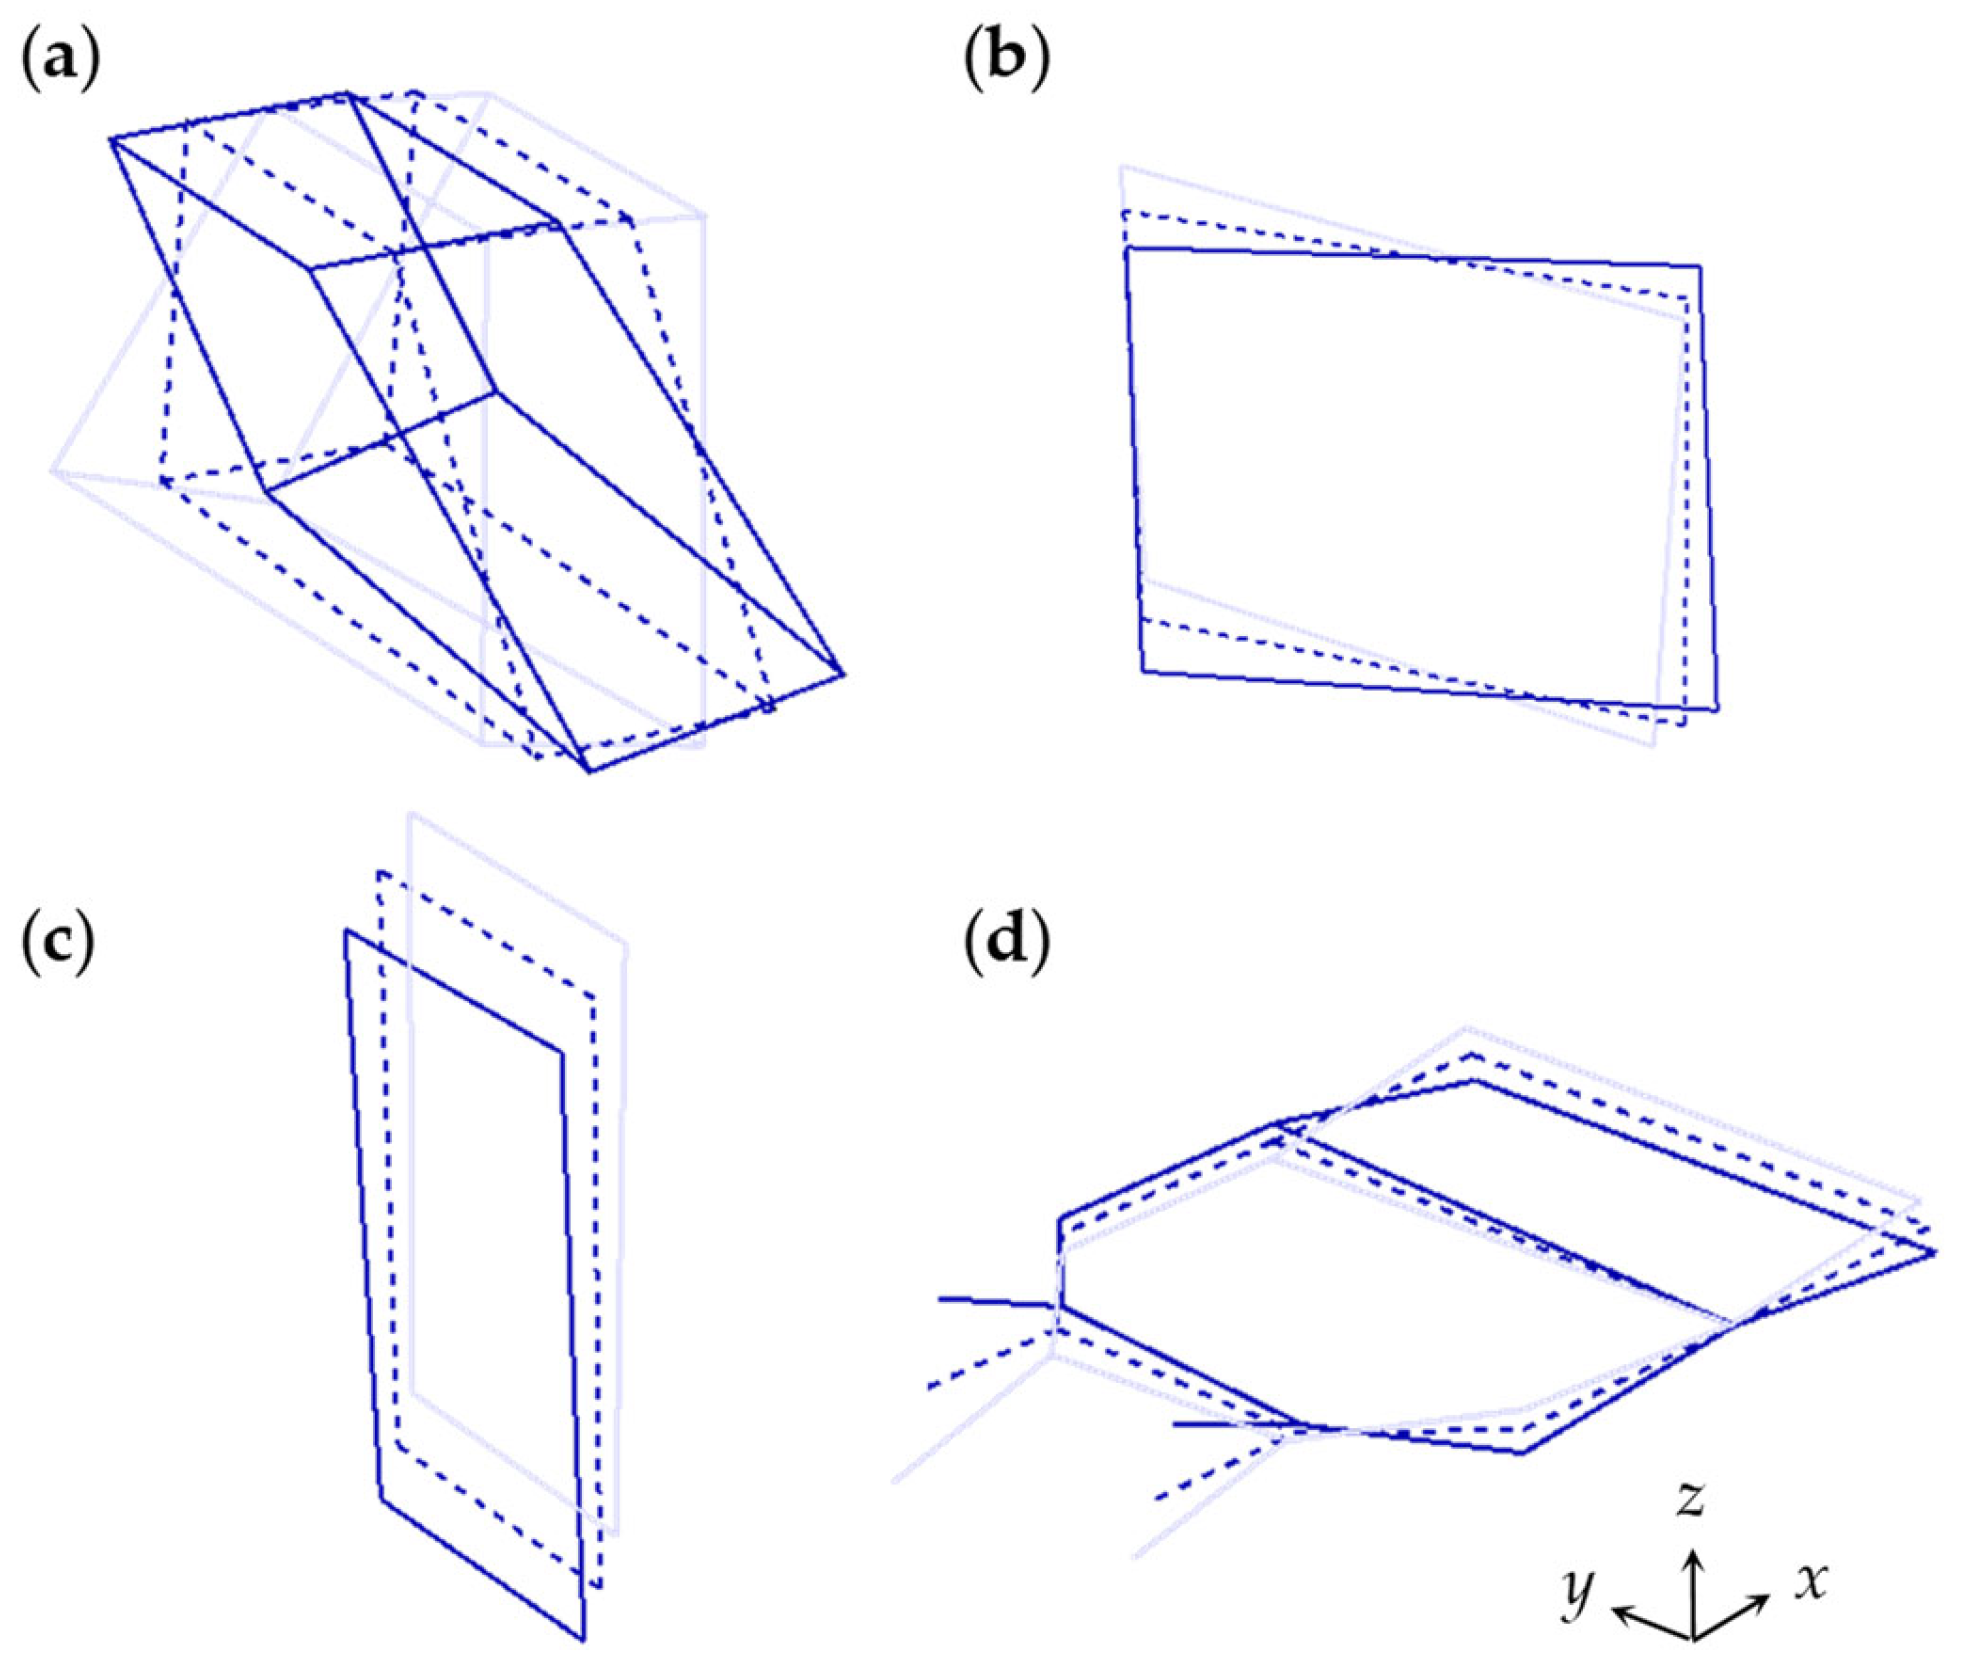
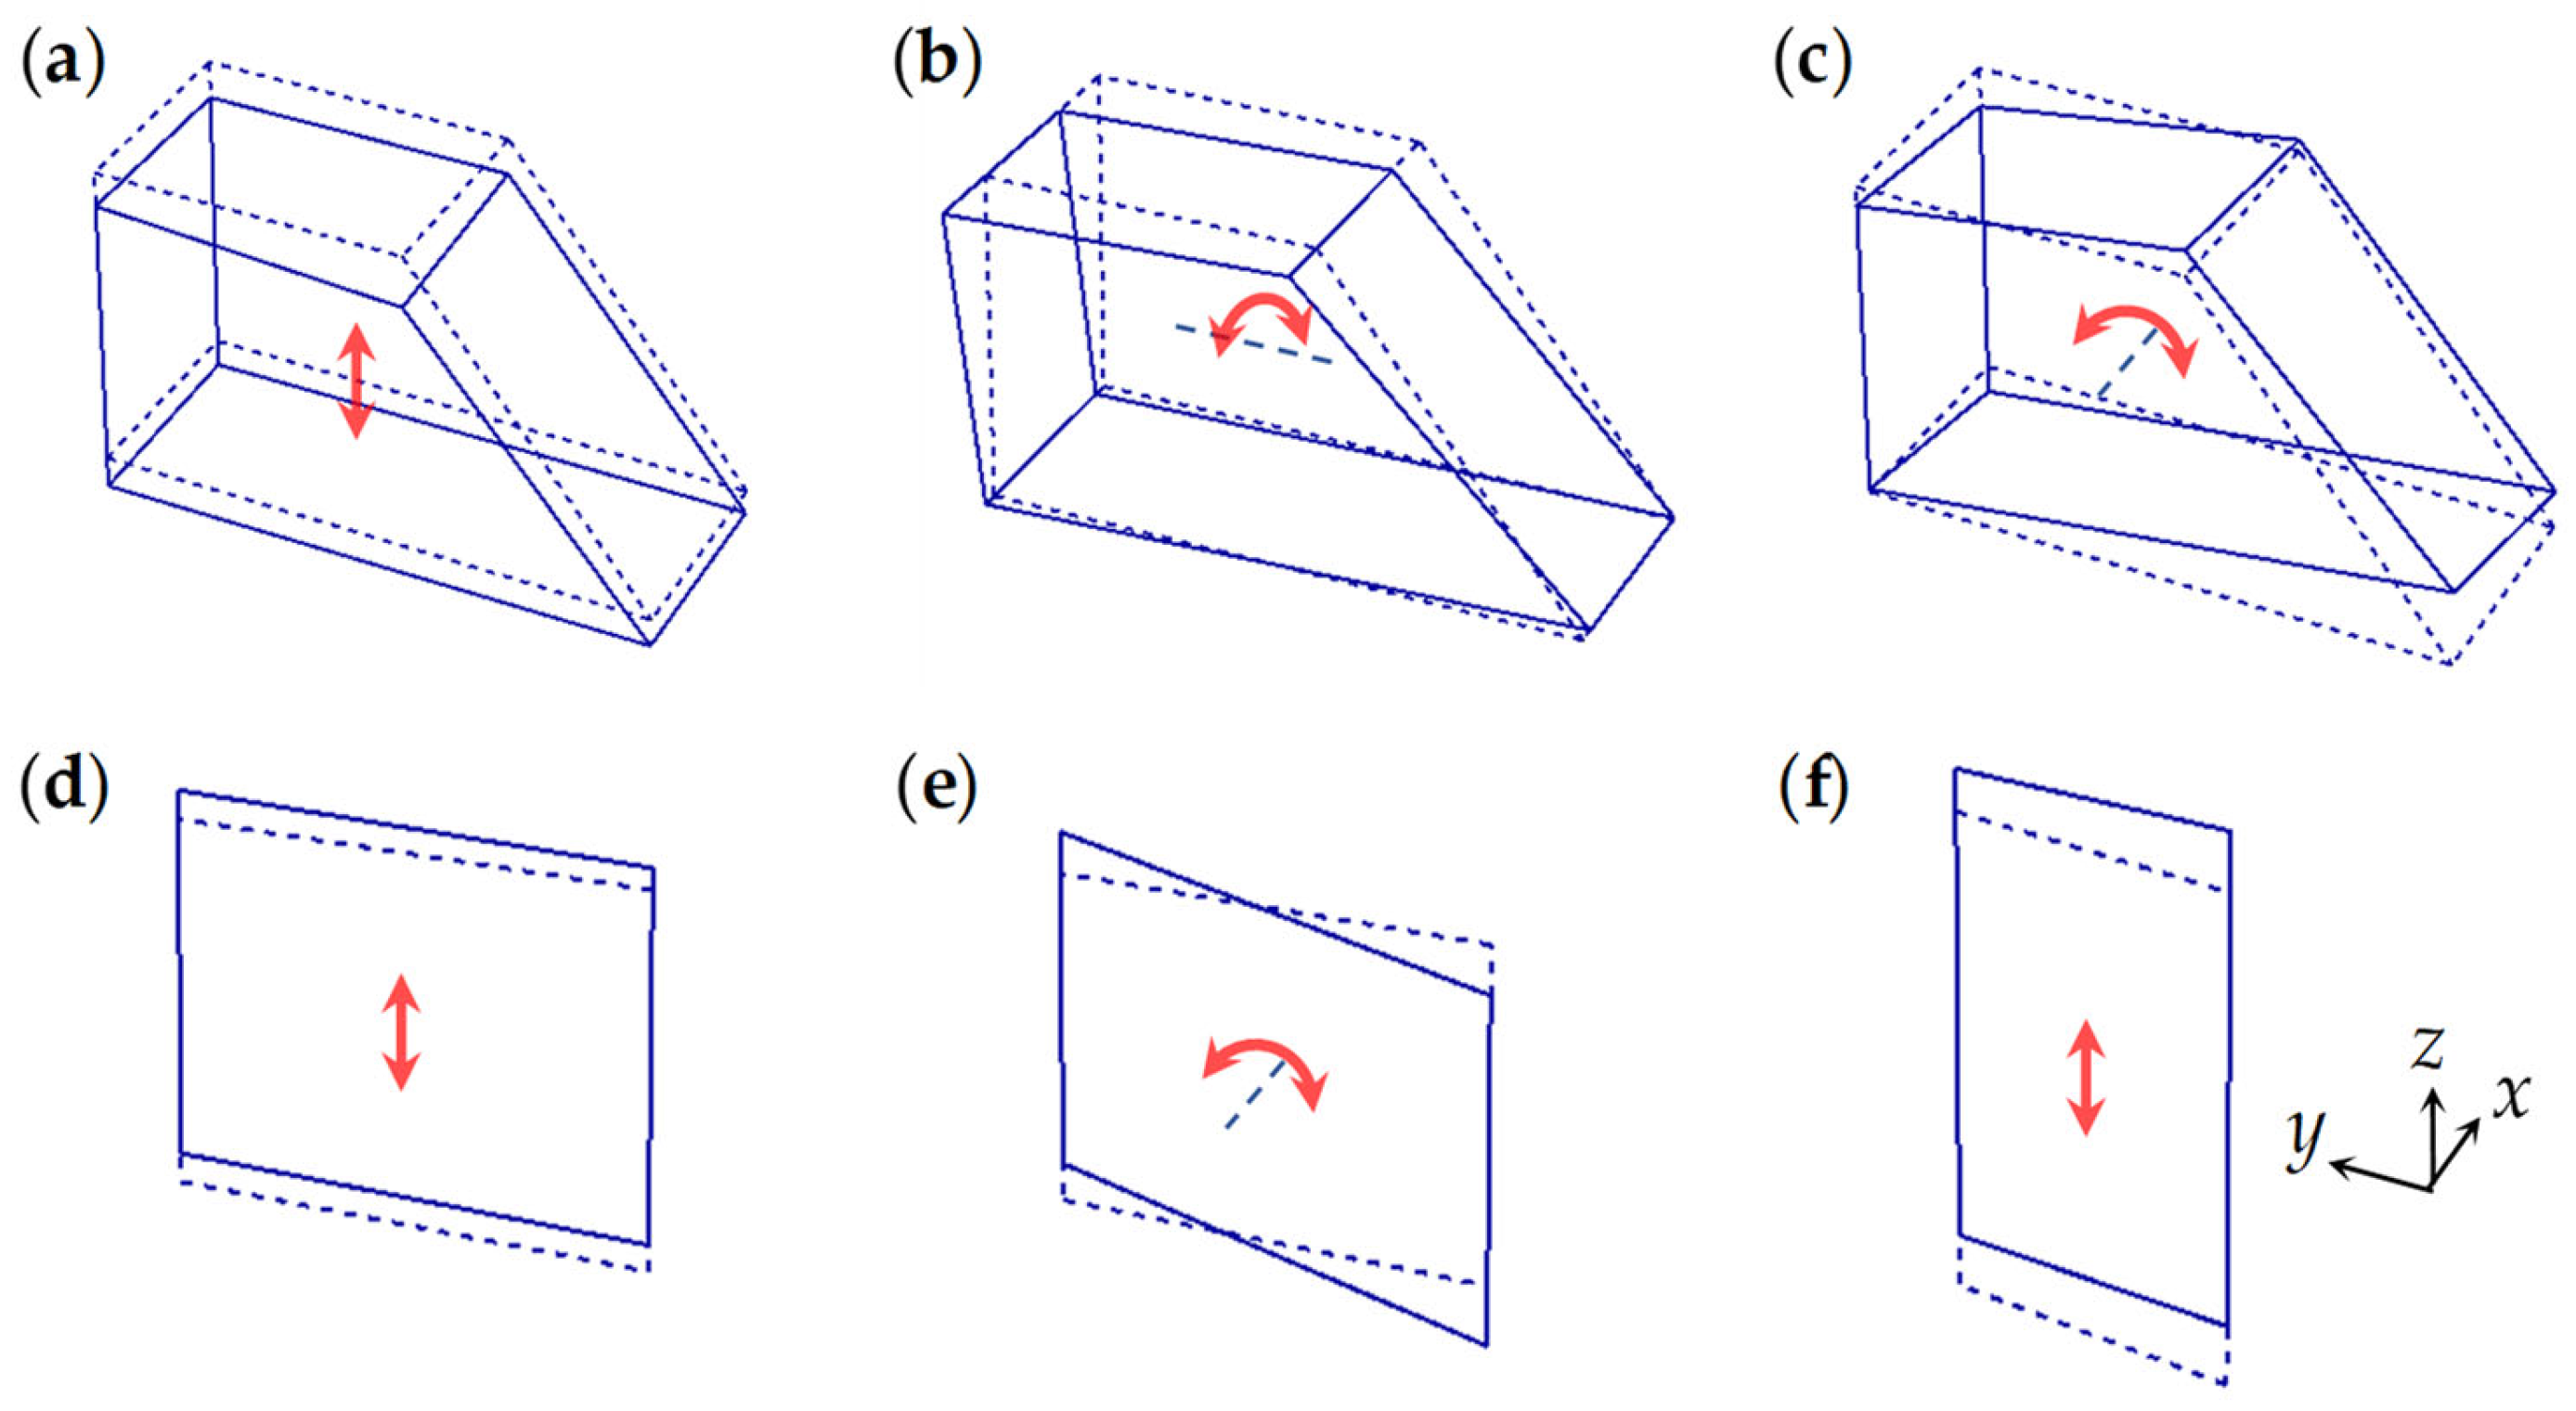
Figure 5). All motions appearing later are described based on the global coordinate system.
First, as shown in
Figure 5a, the ODS of the powertrain exhibits a rotational vibration about the
y-axis, which is generally called the pitch motion. This rotational vibration occurred because the SUV used in this study was driven by a transverse-mounted engine that generated a driving torque about the
y-axis. Moreover, the ODS of the radiator, as illustrated in
Figure 5b, represents the vibration shape in which the rotational motion about the
x-axis and the translational motion in the
x direction are combined. Because the rubber hoses attached to the upper left and lower right sides of the radiator are connected to the engine, the engine excitation force is transmitted through these hoses; accordingly, the combined motion of rotation and translation is represented in the ODS result depicted in
Figure 5b. Conversely, as shown in
Figure 5c, the ODS of the intercooler vibrates in the vertical direction with a slight longitudinal vibration. In other words, the intercooler possesses a vibration shape resembling that of a bounce motion when the engine is in the idle state. Because the hoses between the intercooler and the engine are connected almost symmetrically to the top and bottom of the intercooler, this particular ODS was observed. Finally, the ODS of the vehicle body floor, as illustrated in
Figure 5d, appears in the shape of a combination of bending and torsional deformations. Furthermore, the bending deformation dominates over the torsional deformation. Notably, the ODS of the body floor suggests flexible-body motion, whereas the ODSs of the powertrain, radiator, and intercooler indicate rigid-body motions. Comparing the vibration amplitudes of the ODSs for these four components, the amplitude of the powertrain is the largest, followed by that of the intercooler, radiator, and body floor.
Modal tests were performed to obtain the natural frequencies and mode shapes of the powertrain, radiator, intercooler, and body floor under the condition that all the components are assembled together. The modal tests were conducted on the diesel SUV with all these components assembled; an impact hammer (B&K 8206) was used to apply input excitation, and accelerometers (PCB 356A15) were used to measure the output acceleration signals. Considering that the idle vibrations at the driver’s seat occurred mainly in the vertical direction, vertical excitation was imposed on each component using the impact hammer to extract the natural frequencies and mode shapes related to vertical vibrations. The impact and measurement points for performing modal tests of each component are illustrated in
Figure 6, wherein the red squares and circles represent the impact hammer excitation points and the accelerometer attachment positions, respectively. After obtaining a series of the frequency responses functions for each component using the sound and vibration analyzer, the natural frequencies and associated mode shapes were determined.
In this study, the natural frequencies and mode shapes of the components were chiefly analyzed in the low-frequency region. The vibration modes in the low-frequency region are closely related to the vibration in the idle state. The mode shapes of the powertrain, radiator, and intercooler in the low-frequency region are presented in
Figure 7. The powertrain of the SUV employed in this study is supported by the engine, transmission, and roll mounts. Because these mounts act as springs and dampers and support the powertrain, the powertrain exhibits six rigid-body vibration modes. The powertrain possesses the rigid-body modes corresponding to the natural frequencies of 4.8, 13.0, and 18.5 Hz. The mode for the natural frequencies of 4.8, 13.0, and 18.5 Hz are the bounce (refer to
Figure 7a), pitch (refer to
Figure 7b), and roll modes (refer to
Figure 7c). In the low-frequency region during the idle state, three natural vibration modes of the radiator and intercooler exist, which are related to the ride comfort. These modes comprise the bounce mode of the radiator with a natural frequency of 20.0 Hz (refer to
Figure 7d), the roll mode of the radiator with a natural frequency of 30.3 Hz (refer to
Figure 7e), and the bounce mode of the intercooler with a natural frequency of 29.3 Hz (refer to
Figure 7f).
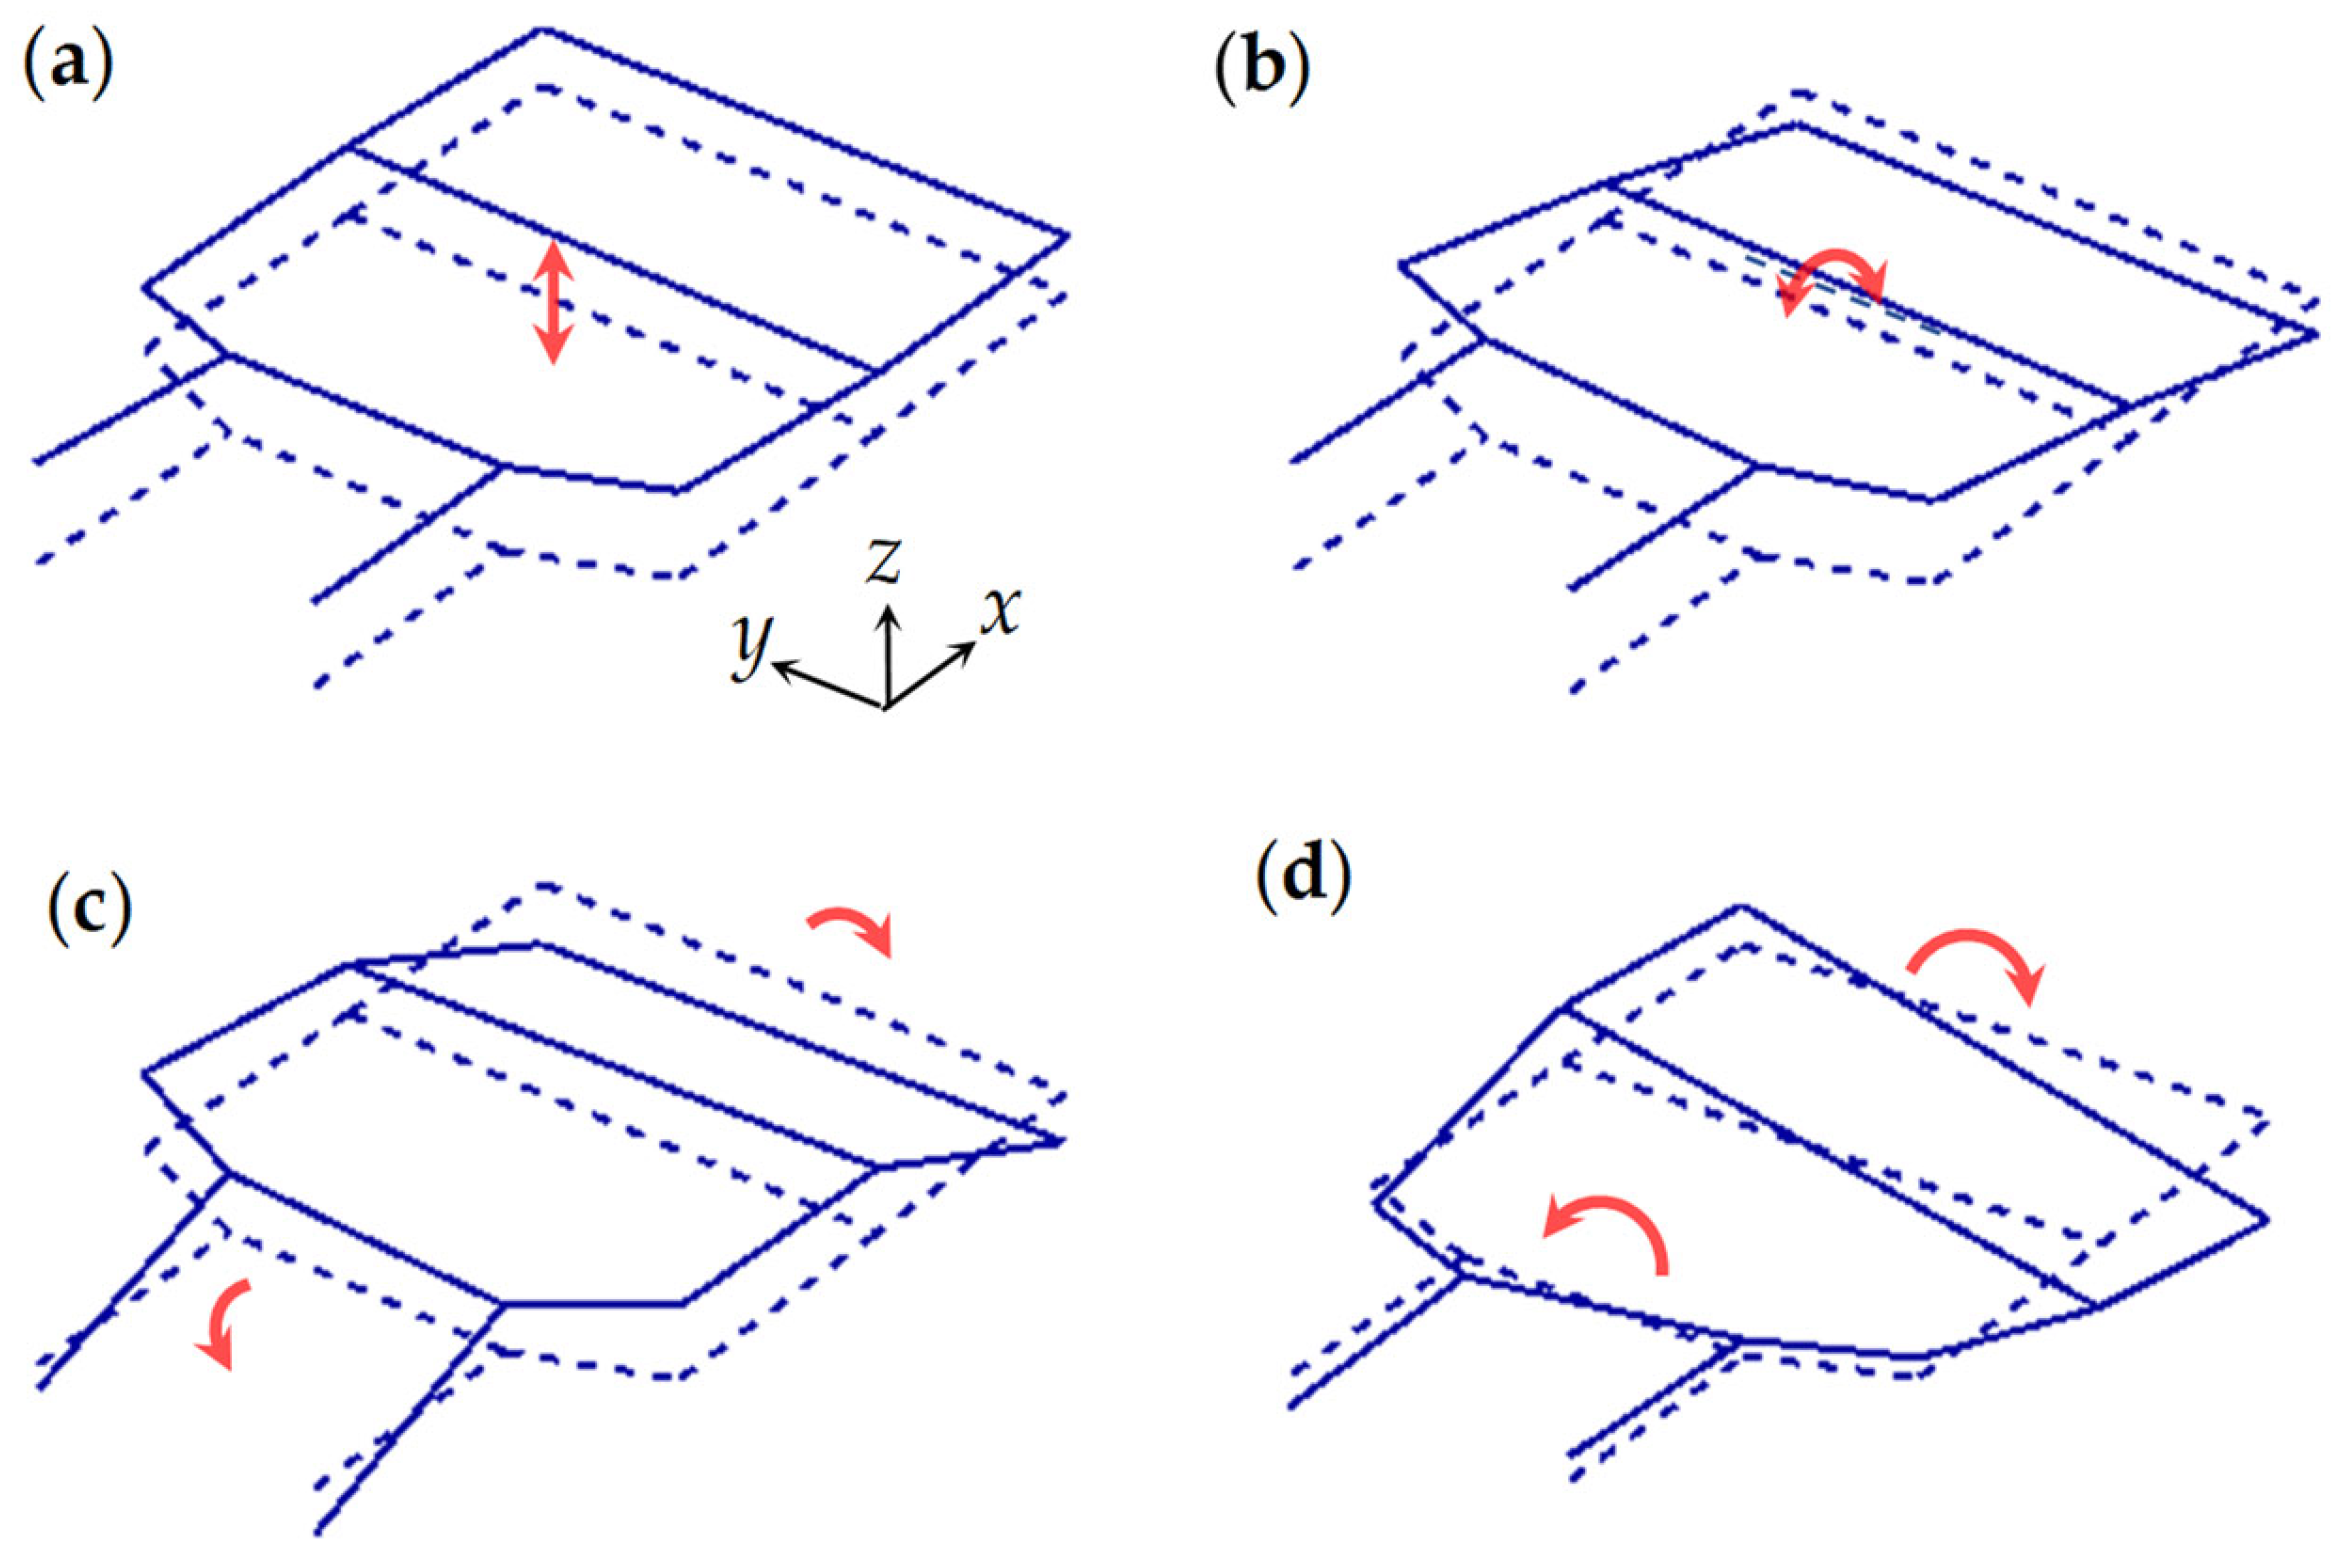
In the low-frequency region, unlike the powertrain, radiator, and intercooler, which solely exhibit rigid-body modes, the body floor possesses not only rigid-body modes but also deformed modes. The mode shapes for the four lowest natural frequencies of the body floor are depicted in
Figure 8. The modes depicted in
Figure 8a,b are rigid-body modes of the body, whereas the modes represented in
Figure 8c,d are deformed modes. In particular, the mode with a natural frequency of 3.2 Hz is the bounce mode of the vehicle body (refer to
Figure 8a), and the mode with a natural frequency of 3.7 Hz is the pitch mode (refer to
Figure 8b). Conversely, the mode with the natural frequency of 23.8 Hz is the bending mode of the vehicle (refer to
Figure 8c), and the mode with the natural frequency of 28.4 Hz is the torsional mode (refer to
Figure 8d). These flexible modes are expected to possess larger natural frequencies than the rigid-body modes.
A comparative study between the ODS and modal test result is crucial for a deeper understanding of the idling vibration produced by the diesel SUV. In general, the ODS of a system is influenced not only by the excitation frequency and direction, but also by the mode shapes corresponding to the natural frequencies proximate to the excitation frequency. Therefore, the direction of the excitation torque (the engine driving torque) and the mode shapes should be analyzed with respect to the natural frequencies proximate to the idling frequency.
The ODSs at the idling frequency of 27.7 Hz (refer to
Figure 5) were compared with the mode shapes (refer to
Figure 7 and
Figure 8). First, the ODS of the powertrain, as illustrated in
Figure 5a, is almost identical to the pitch mode of the powertrain, as depicted in
Figure 7b. However, the natural frequency of this pitch mode, 13.0 Hz, is significantly different from the idle or excitation frequency, 27.7 Hz. Nevertheless, the powertrain possesses an ODS similar to the shape of the pitch mode because the excitation torque of the engine acts in the transverse direction of the vehicle.
Conversely, the ODS of the radiator (refer to
Figure 5b) corresponds to the roll mode of the radiator (refer to
Figure 7e). This roll mode shape was observed in the ODS because the natural frequency of this roll mode, 30.3 Hz, is proximate to the idling frequency, 27.7 Hz. Similarly, the ODS of the intercooler, as depicted in
Figure 5c, resembles the bounce mode of the intercooler, as illustrated in
Figure 7f, featuring a natural frequency of 29.3 Hz, which is proximate to the idling frequency. Finally, the ODS of the body floor displayed in
Figure 5d appears as a combination of the bending and torsional modes of the body floor, which are, respectively, depicted in
Figure 8c,d. These modes contribute to the ODS because the idling frequency (27.7 Hz) lies between the natural frequencies of the bending and torsional modes (23.8 and 28.4 Hz, respectively). Notably, because the excitation torque of the engine is applied to the front-center of the body floor, the bending mode exerts a greater influence on the ODS than the torsional mode.
3. Dynamic Modeling
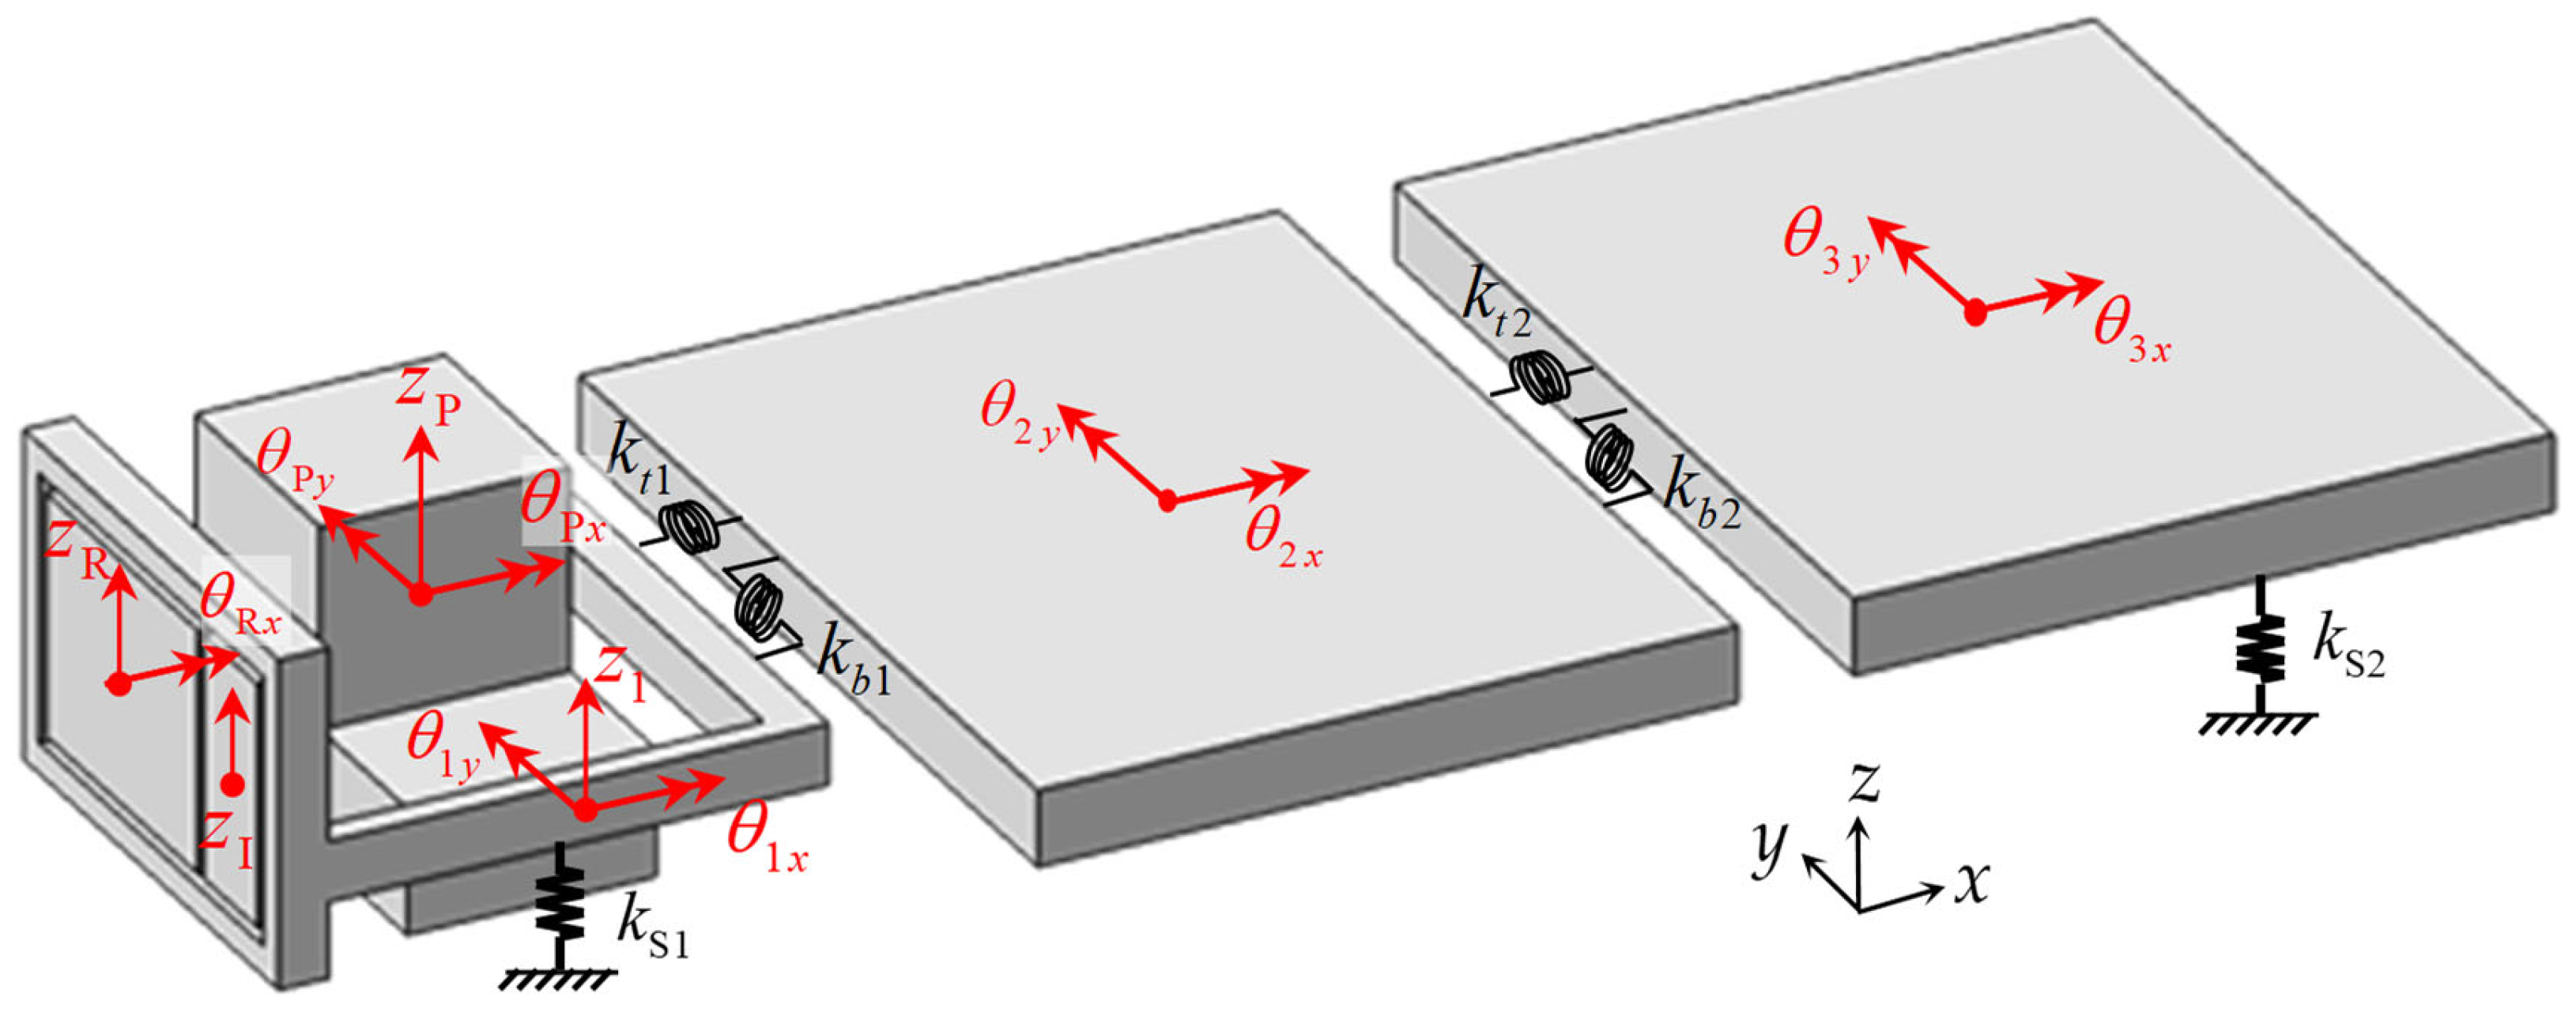
On the basis of the experimental analysis reported in the previous section, a dynamic model for the diesel SUV has been established. To analyze the behavior of the low-frequency region below 30 Hz, the dynamic model presented in this study possesses 13 degrees of freedom, as displayed in
Figure 9. Three degrees of freedom are assigned to the powertrain, two to the radiator, one to the intercooler, and seven to the body floor.
First, as shown in
Figure 7a–c, the vibration modes dominating the behavior of the powertrain in the low-frequency region are the bounce, pitch, and roll modes. Accordingly, three degrees of freedom are accorded to the rigid-body motion of the powertrain, and the generalized coordinates for the bounce, pitch, and roll motions are expressed as
,
, and
, respectively. As depicted in
Figure 7d,e, the radiator exhibits bounce and roll modes in the low-frequency region; therefore, the generalized coordinates
and
for the bounce and roll motions are respectively assigned to the radiator. Similarly, the intercooler possesses a bounce mode solely in the low-frequency region (refer to
Figure 7f); thus, the generalized coordinate
for the bounce motion is assigned to the intercooler.
Conversely, the body floor features rigid-body modes such as bounce and pitch modes (refer to
Figure 8a,b) as well as flexible modes owing to the bending and torsional deformations (refer to
Figure 8c,d) in the low-frequency region. Therefore, both the rigid-body and flexible modes should be considered for the dynamic modeling. Considering these two modes, this study proposes a body floor model comprising three parts: the front, middle, and rear floors, as represented in
Figure 9. The motion of the front floor is described with the generalized coordinates for the bounce, pitch, and roll motions (respectively denoted by
,
, and
), the motion of the middle floor is described with the coordinates for the pitch and roll motions (respectively denoted by
and
), and the motion of the rear floor is described with the coordinates for pitch and roll motions (respectively denoted by
and
). Degrees of freedom were not imposed on the bounce motions of the middle and rear floors because the midpoint of the interface between the front and middle floors and the midpoint of the interface between the middle and rear floors were assumed to be constrained by revolute joints.
The inertia properties, such as masses and mass moments of inertia, are required to construct the dynamic model of the SUV. The masses of relatively small components such as the radiator, intercooler, and powertrain were measured using a scale. However, masses and mass moments of inertia, which are difficult to measure, were analytically extracted using three-dimensional solid computer-aided design models. On the basis of the nodal lines of bending and torsional deformations obtained from the ODS analysis, the body floor was categorized into three segments: the front, middle, and rear floors. The inertia properties used in the dynamic model are summarized in
Table 1.
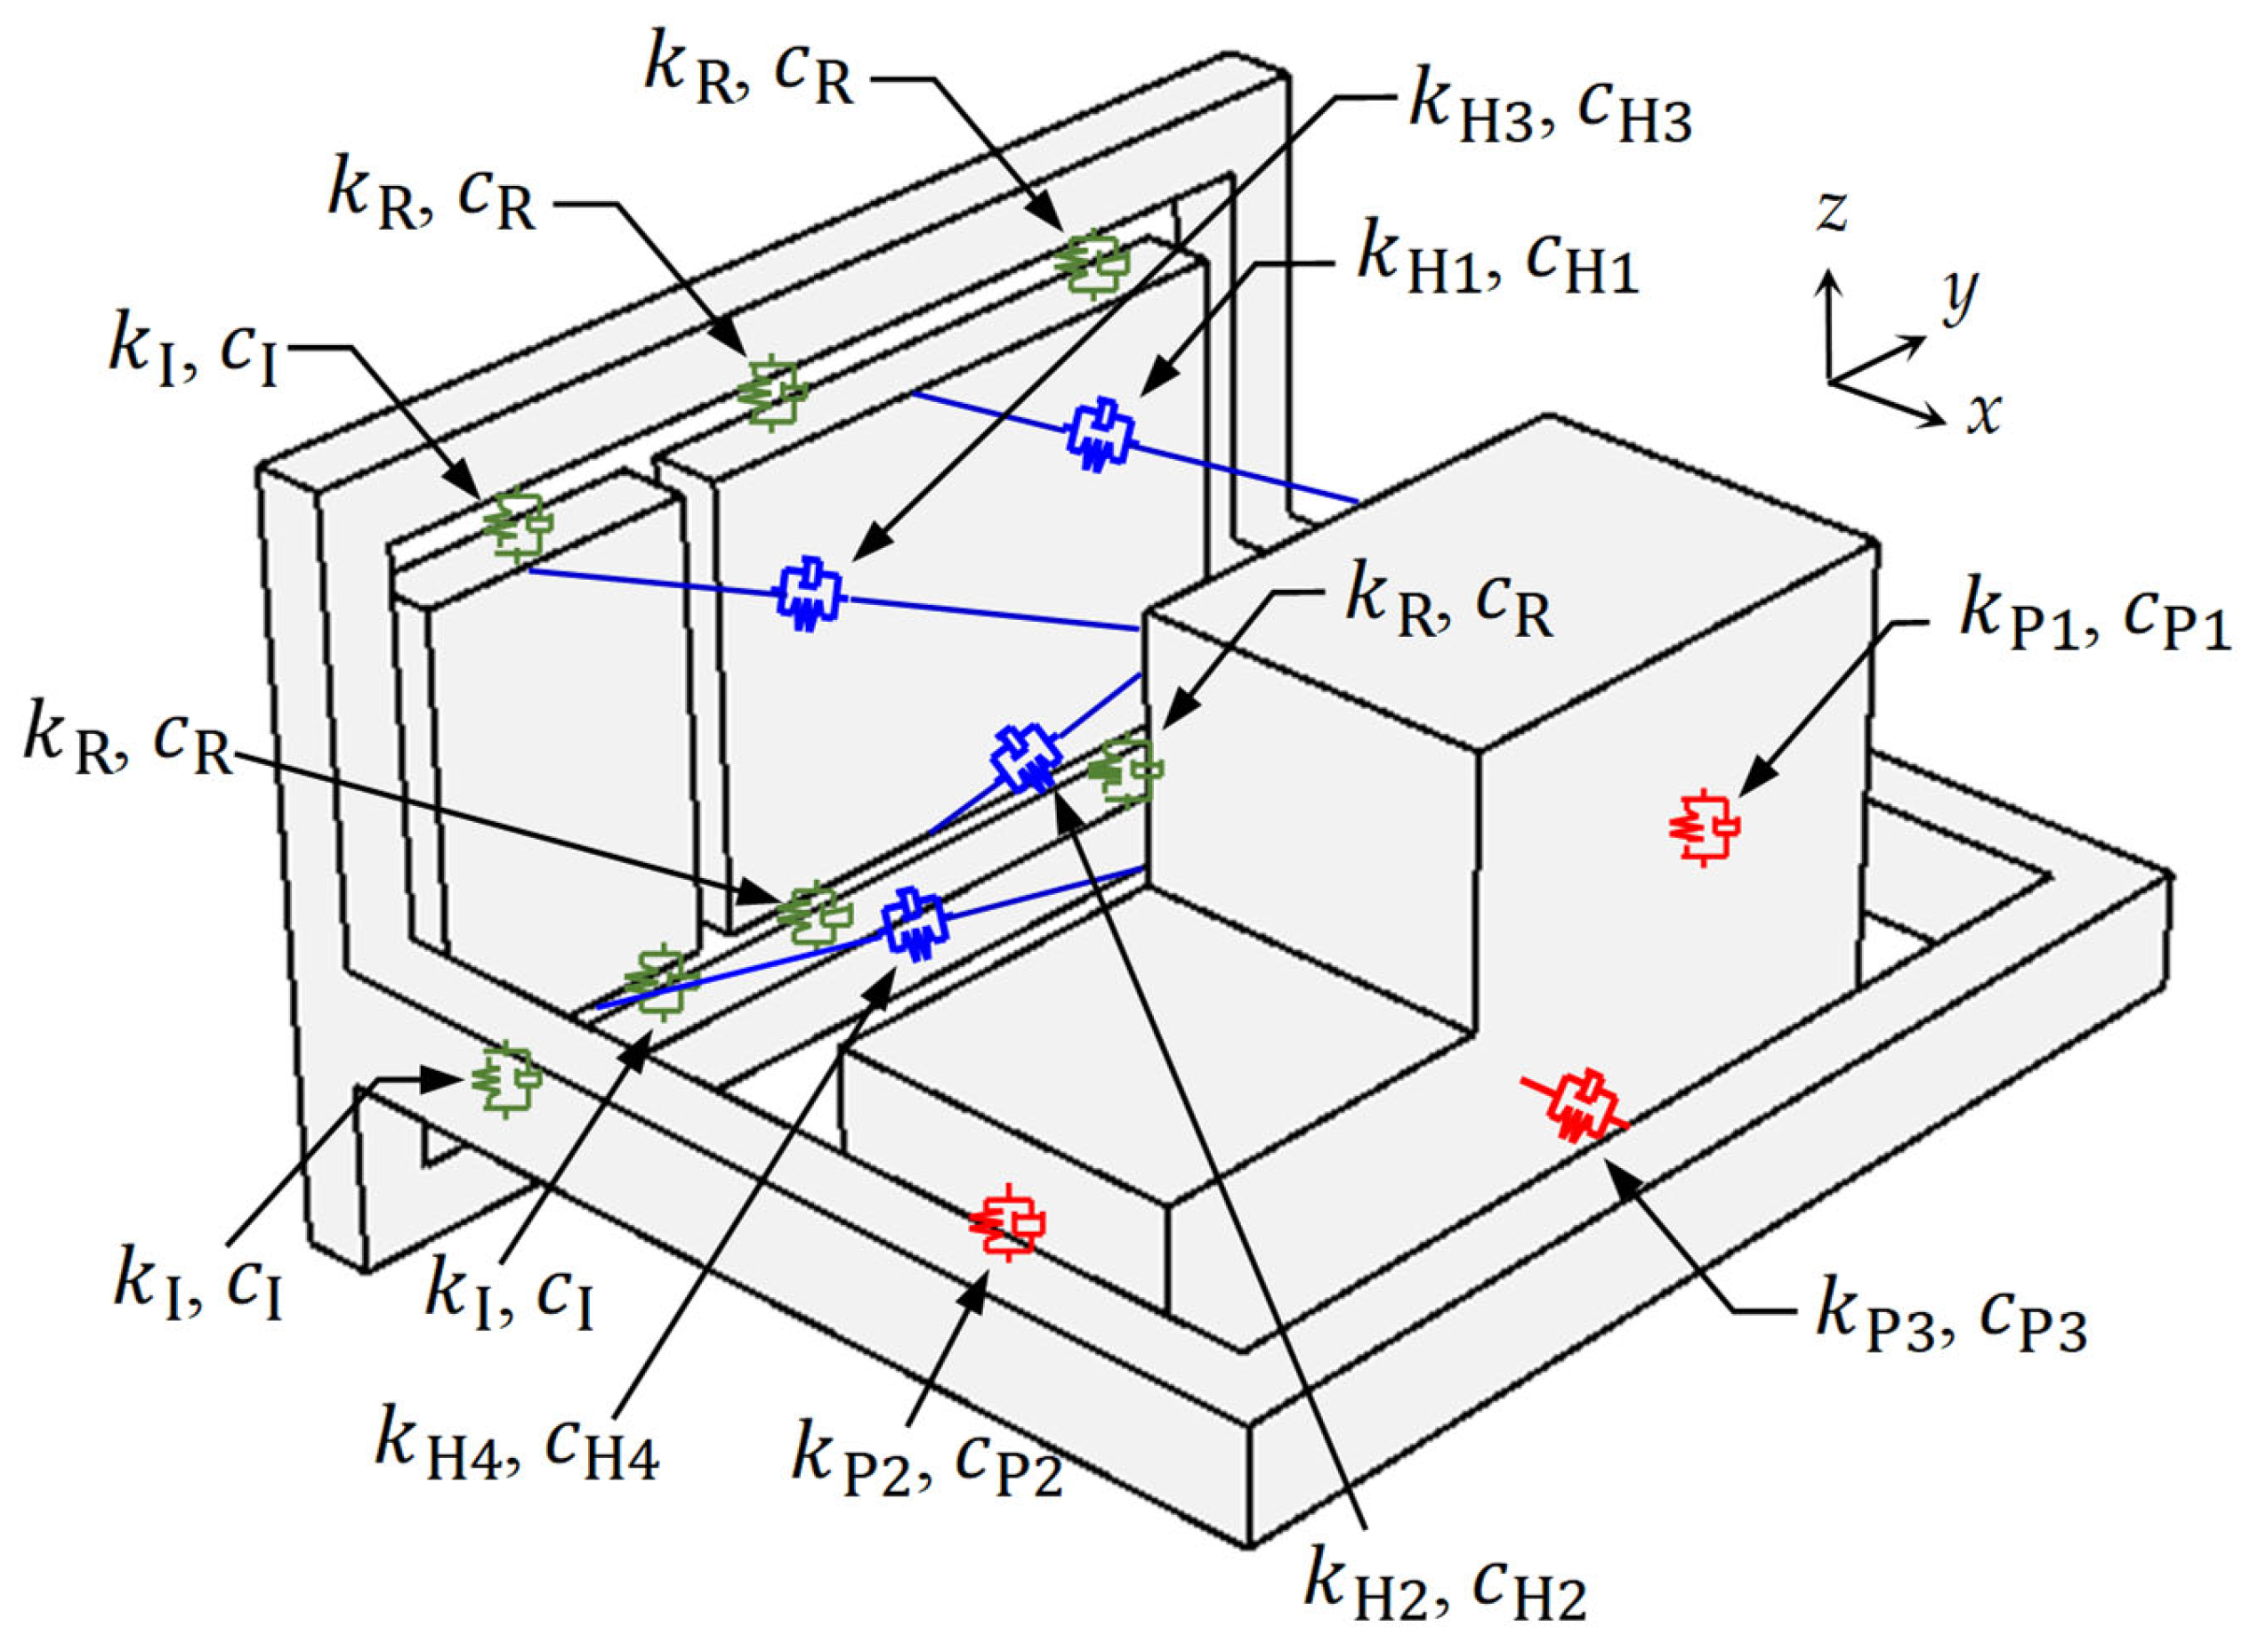
In addition, to establish the dynamic model, the stiffness and damping properties related to the radiator, intercooler, powertrain, and floors should be evaluated. As discussed earlier, the radiator is connected to the front floor via four rubber bushings, and the intercooler is connected to the front floor via three rubber bushings. The radiator and the intercooler are each connected to the powertrain through two rubber hoses. Moreover, the powertrain is supported at three positions by the engine, transmission, and roll mounts. The equivalent springs and dampers of these mounts, bushings and hoses are displayed in
Figure 10. The equivalent stiffness and damping coefficient of the radiator rubber bushing are respectively denoted by
and
, and the stiffness and damping coefficient of the intercooler rubber bushing are respectively represented by
and
. The upper radiator hose exhibits a stiffness of
and damping coefficient of
, whereas the lower radiator hose possesses a stiffness of
and damping coefficient of
. Similarly, the upper intercooler hose demonstrates a stiffness of
and damping coefficient
, whereas the lower intercooler hose exhibits a stiffness of
and damping coefficient of
. Finally, the stiffness and damping coefficient are respectively denoted by
and
for the engine mount, by
and
for the transmission mount, and by
and
for the roll mount.
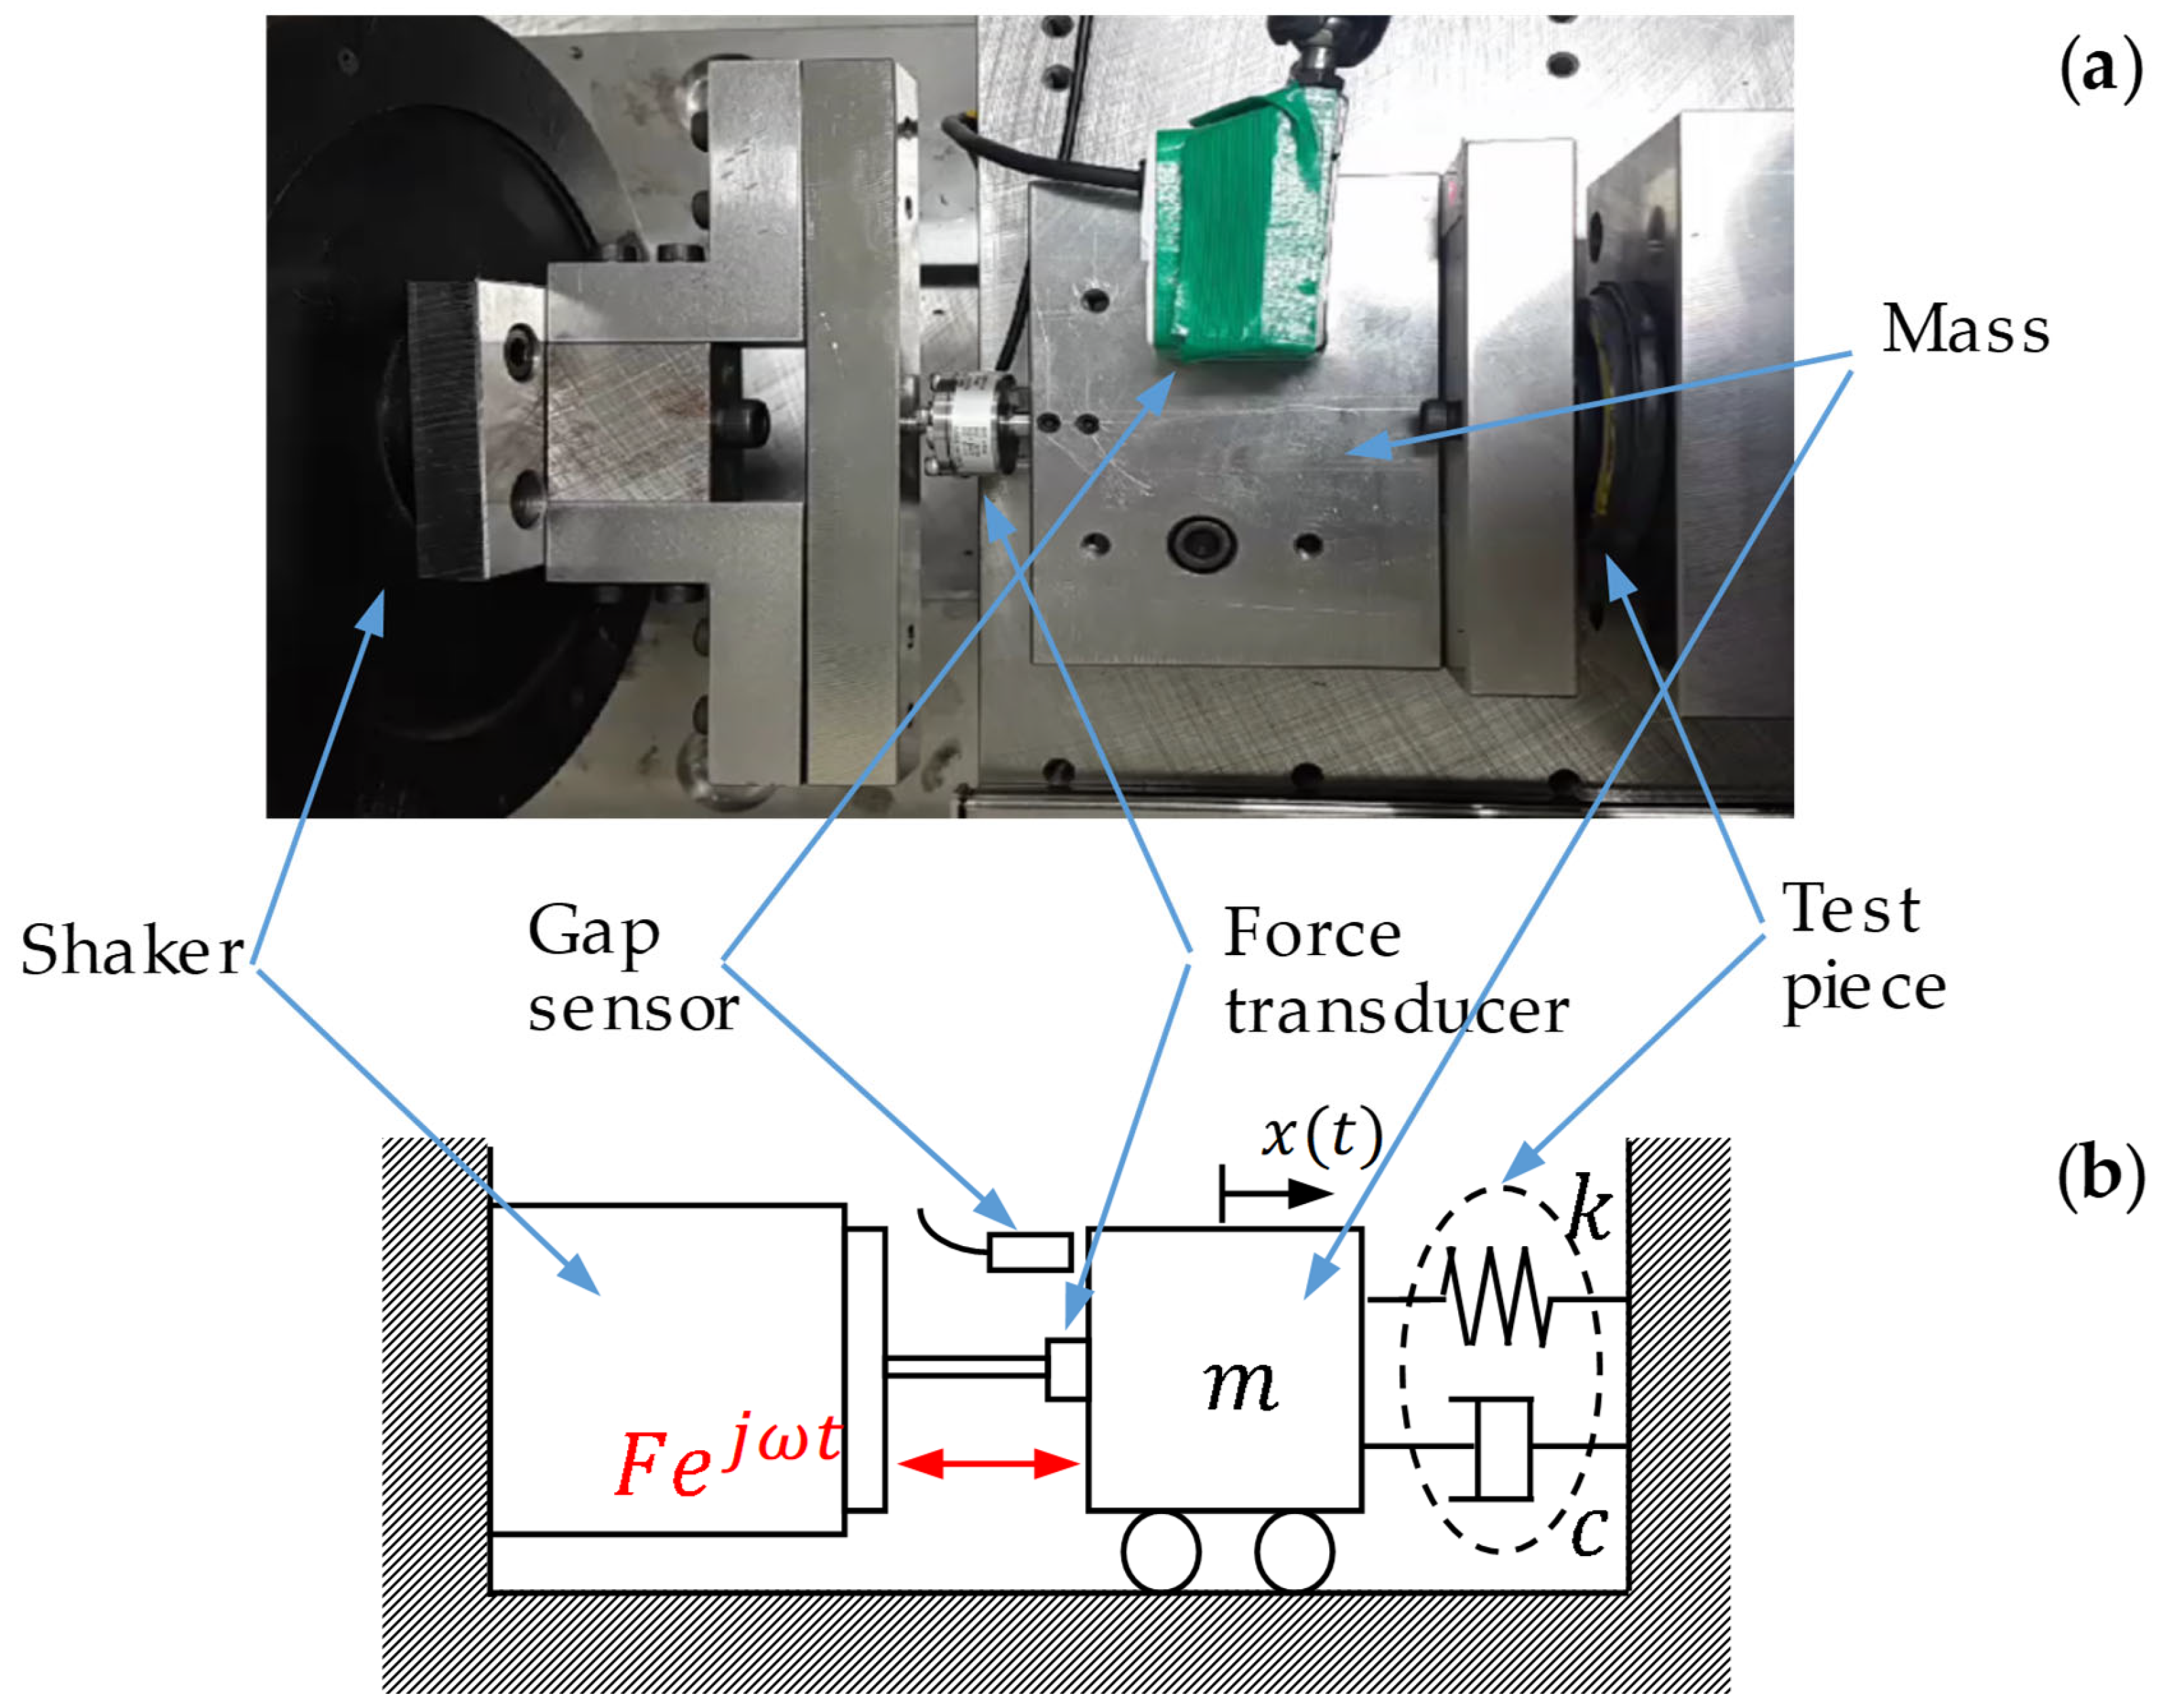
The equivalent stiffnesses and damping coefficients of the mounts, bushings, and hoses were obtained from the experiments by using the measurement setup illustrated in
Figure 11a. Under the given condition that the mount, bushing, or hose, which is the test object, was placed between the mass block and the rigid wall, the mass was excited with a shaker at the idling frequency. As shown in this figure, the excitation force and displacement of the mass were measured with a force transducer and a gap sensor, respectively. The equation of motion for the physical model of the measurement setup, which is illustrated in
Figure 11b, can be expressed as:
where the superposed dot represents differentiation with respect to time;
denotes the displacement of the mass;
represents the mass of the block (0.5 kg);
and
respectively, symbolize the damping coefficient and stiffness of the specimen; and
and
denote the amplitude and frequency of the excitation force, respectively.
Upon assuming
, the dynamic stiffness, defined as the ratio of the excitation force and the displacement, is expressed as follows:
Considering the real and imaginary parts of the experimentally obtained dynamic stiffness, which are denoted by
and
, respectively, the stiffness and damping coefficient for the specimen can be obtained as follows:
The excitation frequency,
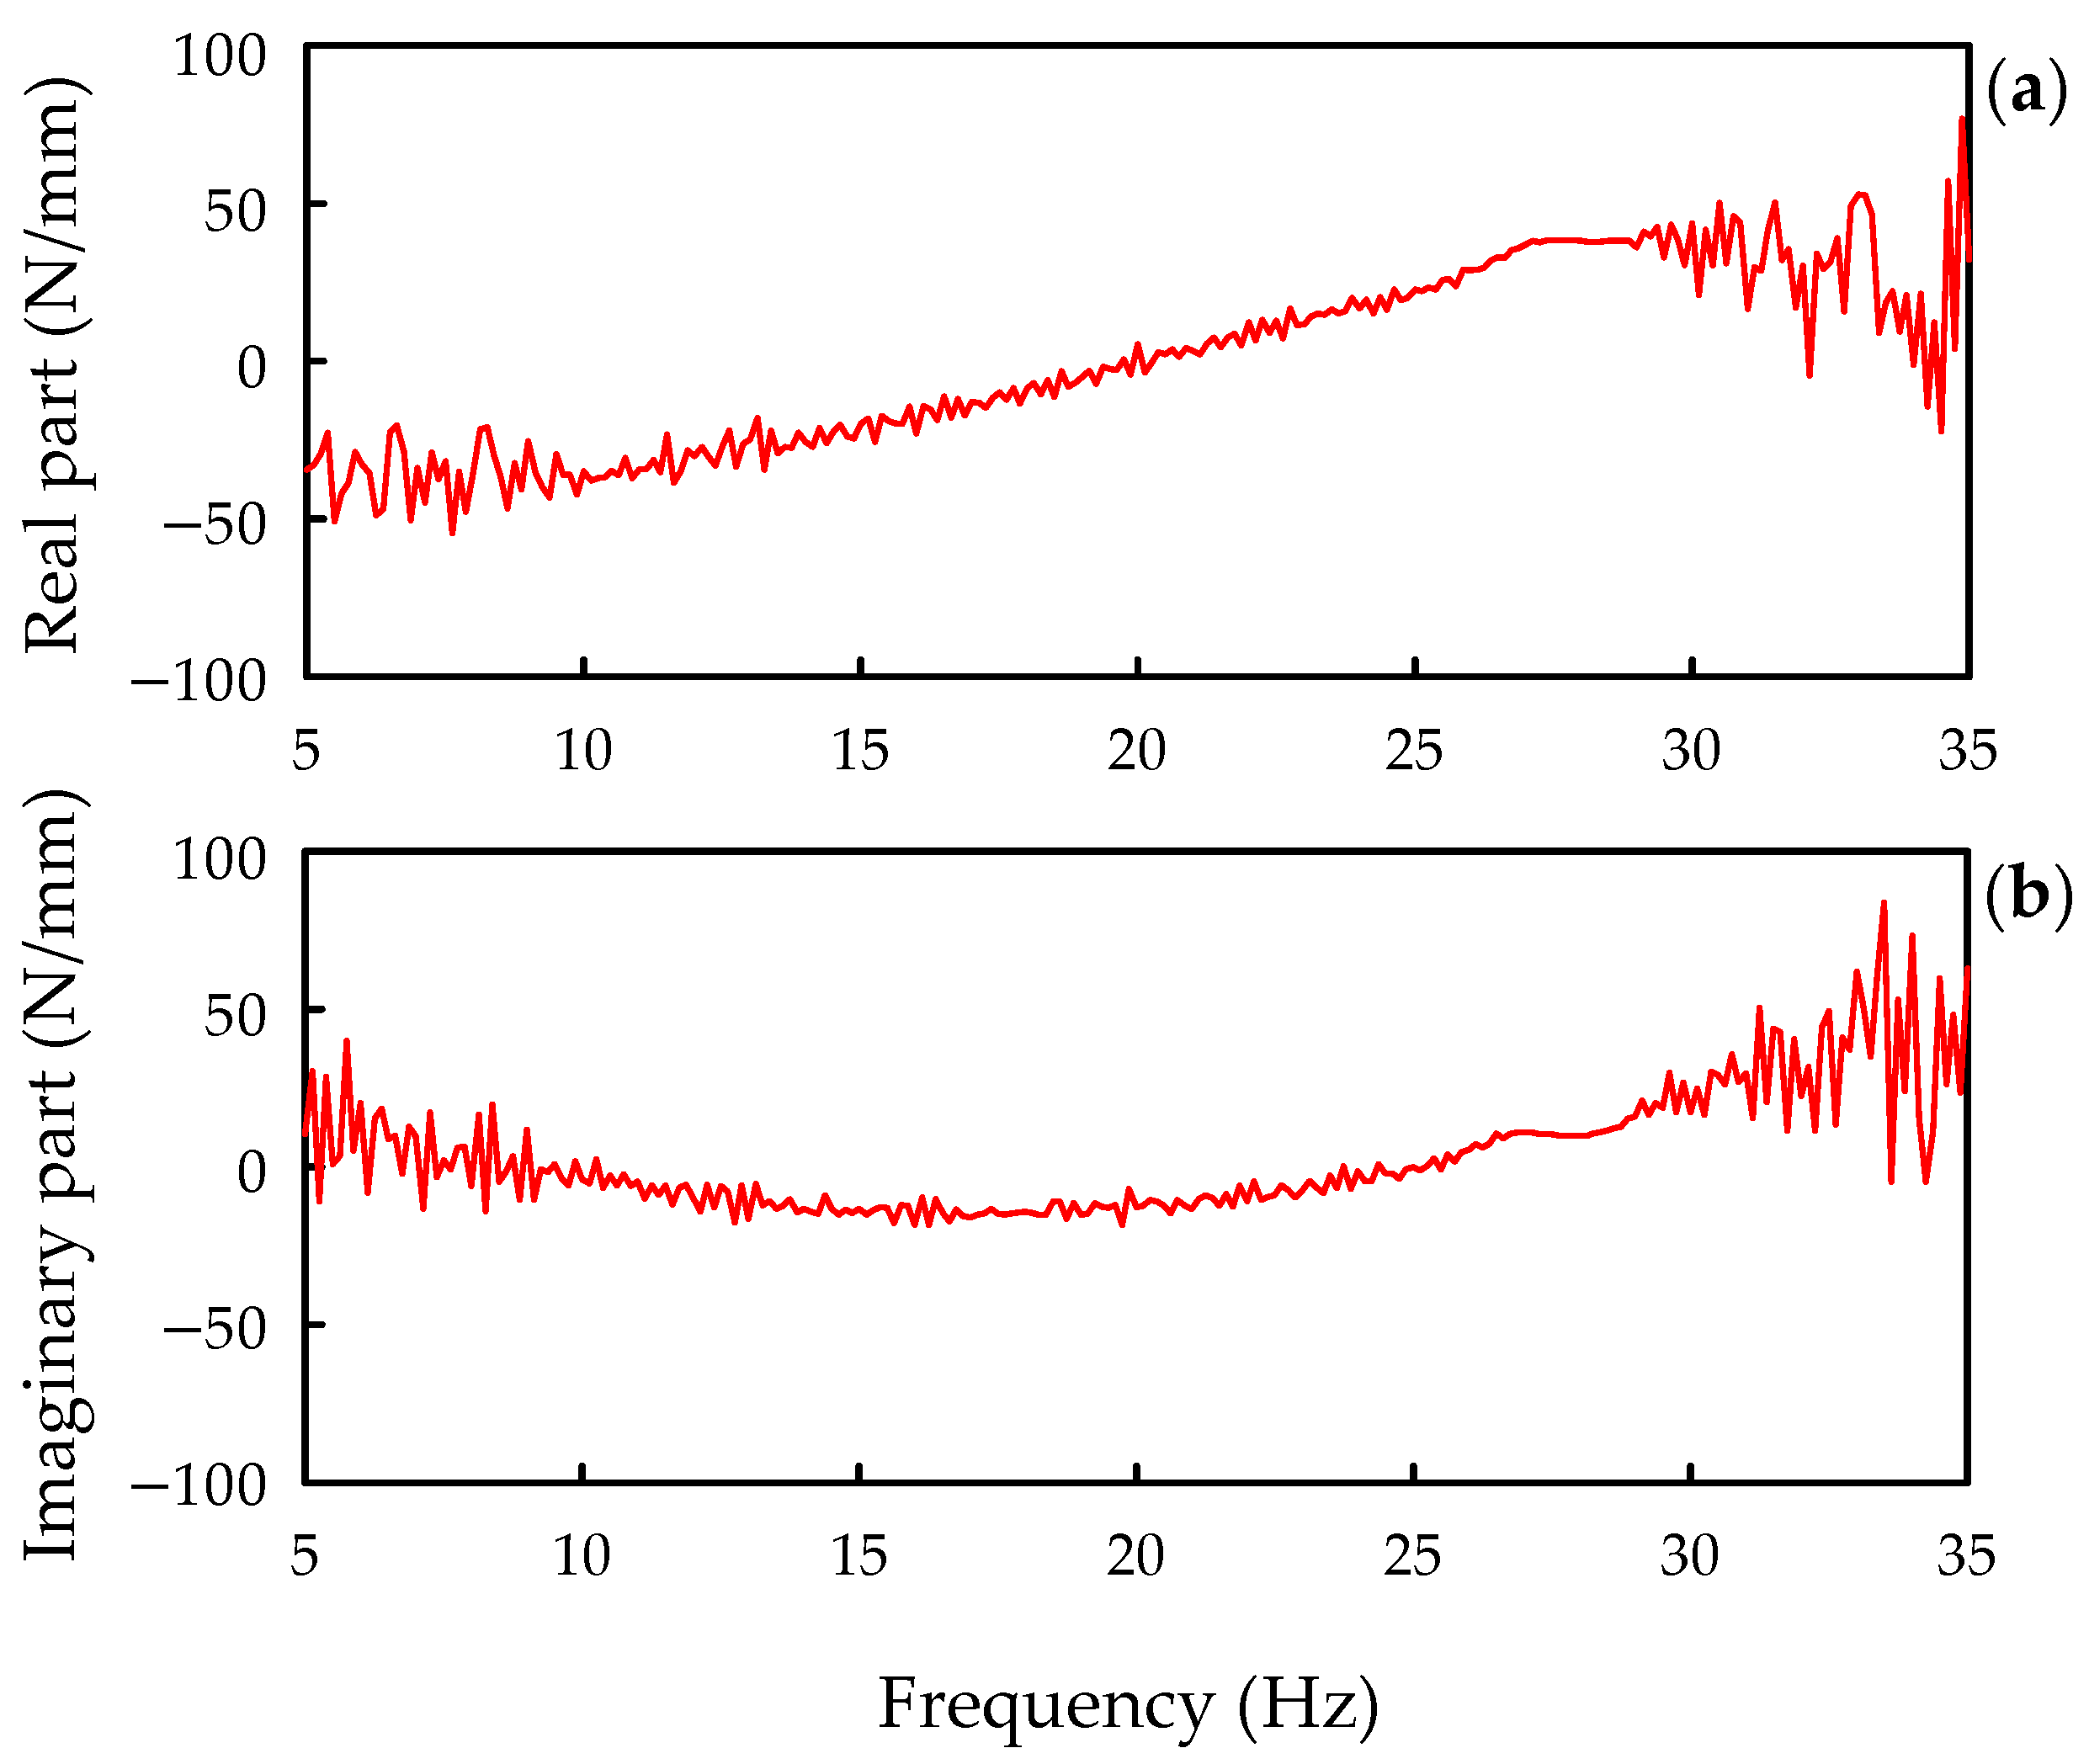
, was selected as the idling frequency of 27.7 Hz. The dynamic stiffness for the rubber bushing of the radiator is presented in
Figure 12, wherein
Figure 12a,b correspond to the real and imaginary parts of the dynamic stiffness, respectively. In this figure, the real and imaginary parts at the idling frequency of 27.7 Hz are respectively denoted by
N/mm and
N/mm. By substituting these values into Equation (3), the equivalent stiffness and damping are respectively calculated as
N/mm and
kg/s. Similarly, the stiffnesses and damping coefficients of bushings and hoses obtained through experiments are summarized in
Table 2.
After independently obtaining the tire stiffness and suspension stiffness, these stiffnesses, which were assumed to be connected in series, were used to derive the equivalent stiffness of the tire and suspension combination. The tire stiffness was measured as per the static load–deflection test proposed by Taylor et al. [
22]. The static load−deflection test determines the vertical load of a tire by measuring the vertical deflection under a vertical load from a regression curve that represents the load as a function of displacement, after which the function is differentiated with the displacement. In the static load–deflection test, the vertical deflection of a tire is measured by varying the vertical load. After expressing the load as a function of deflection, the tire stiffness is obtained by differentiating this function by the deflection at a specific deflection value. Moreover, using the suspension kinematics and compliance test system [
23], the vertical stiffness of the vehicle suspension was determined by measuring the vertical deflection under the applied vertical load. The equivalent vertical stiffnesses of the front and rear suspension/tire combinations obtained from these methods are 28.9 and 31.6 N/mm, respectively.
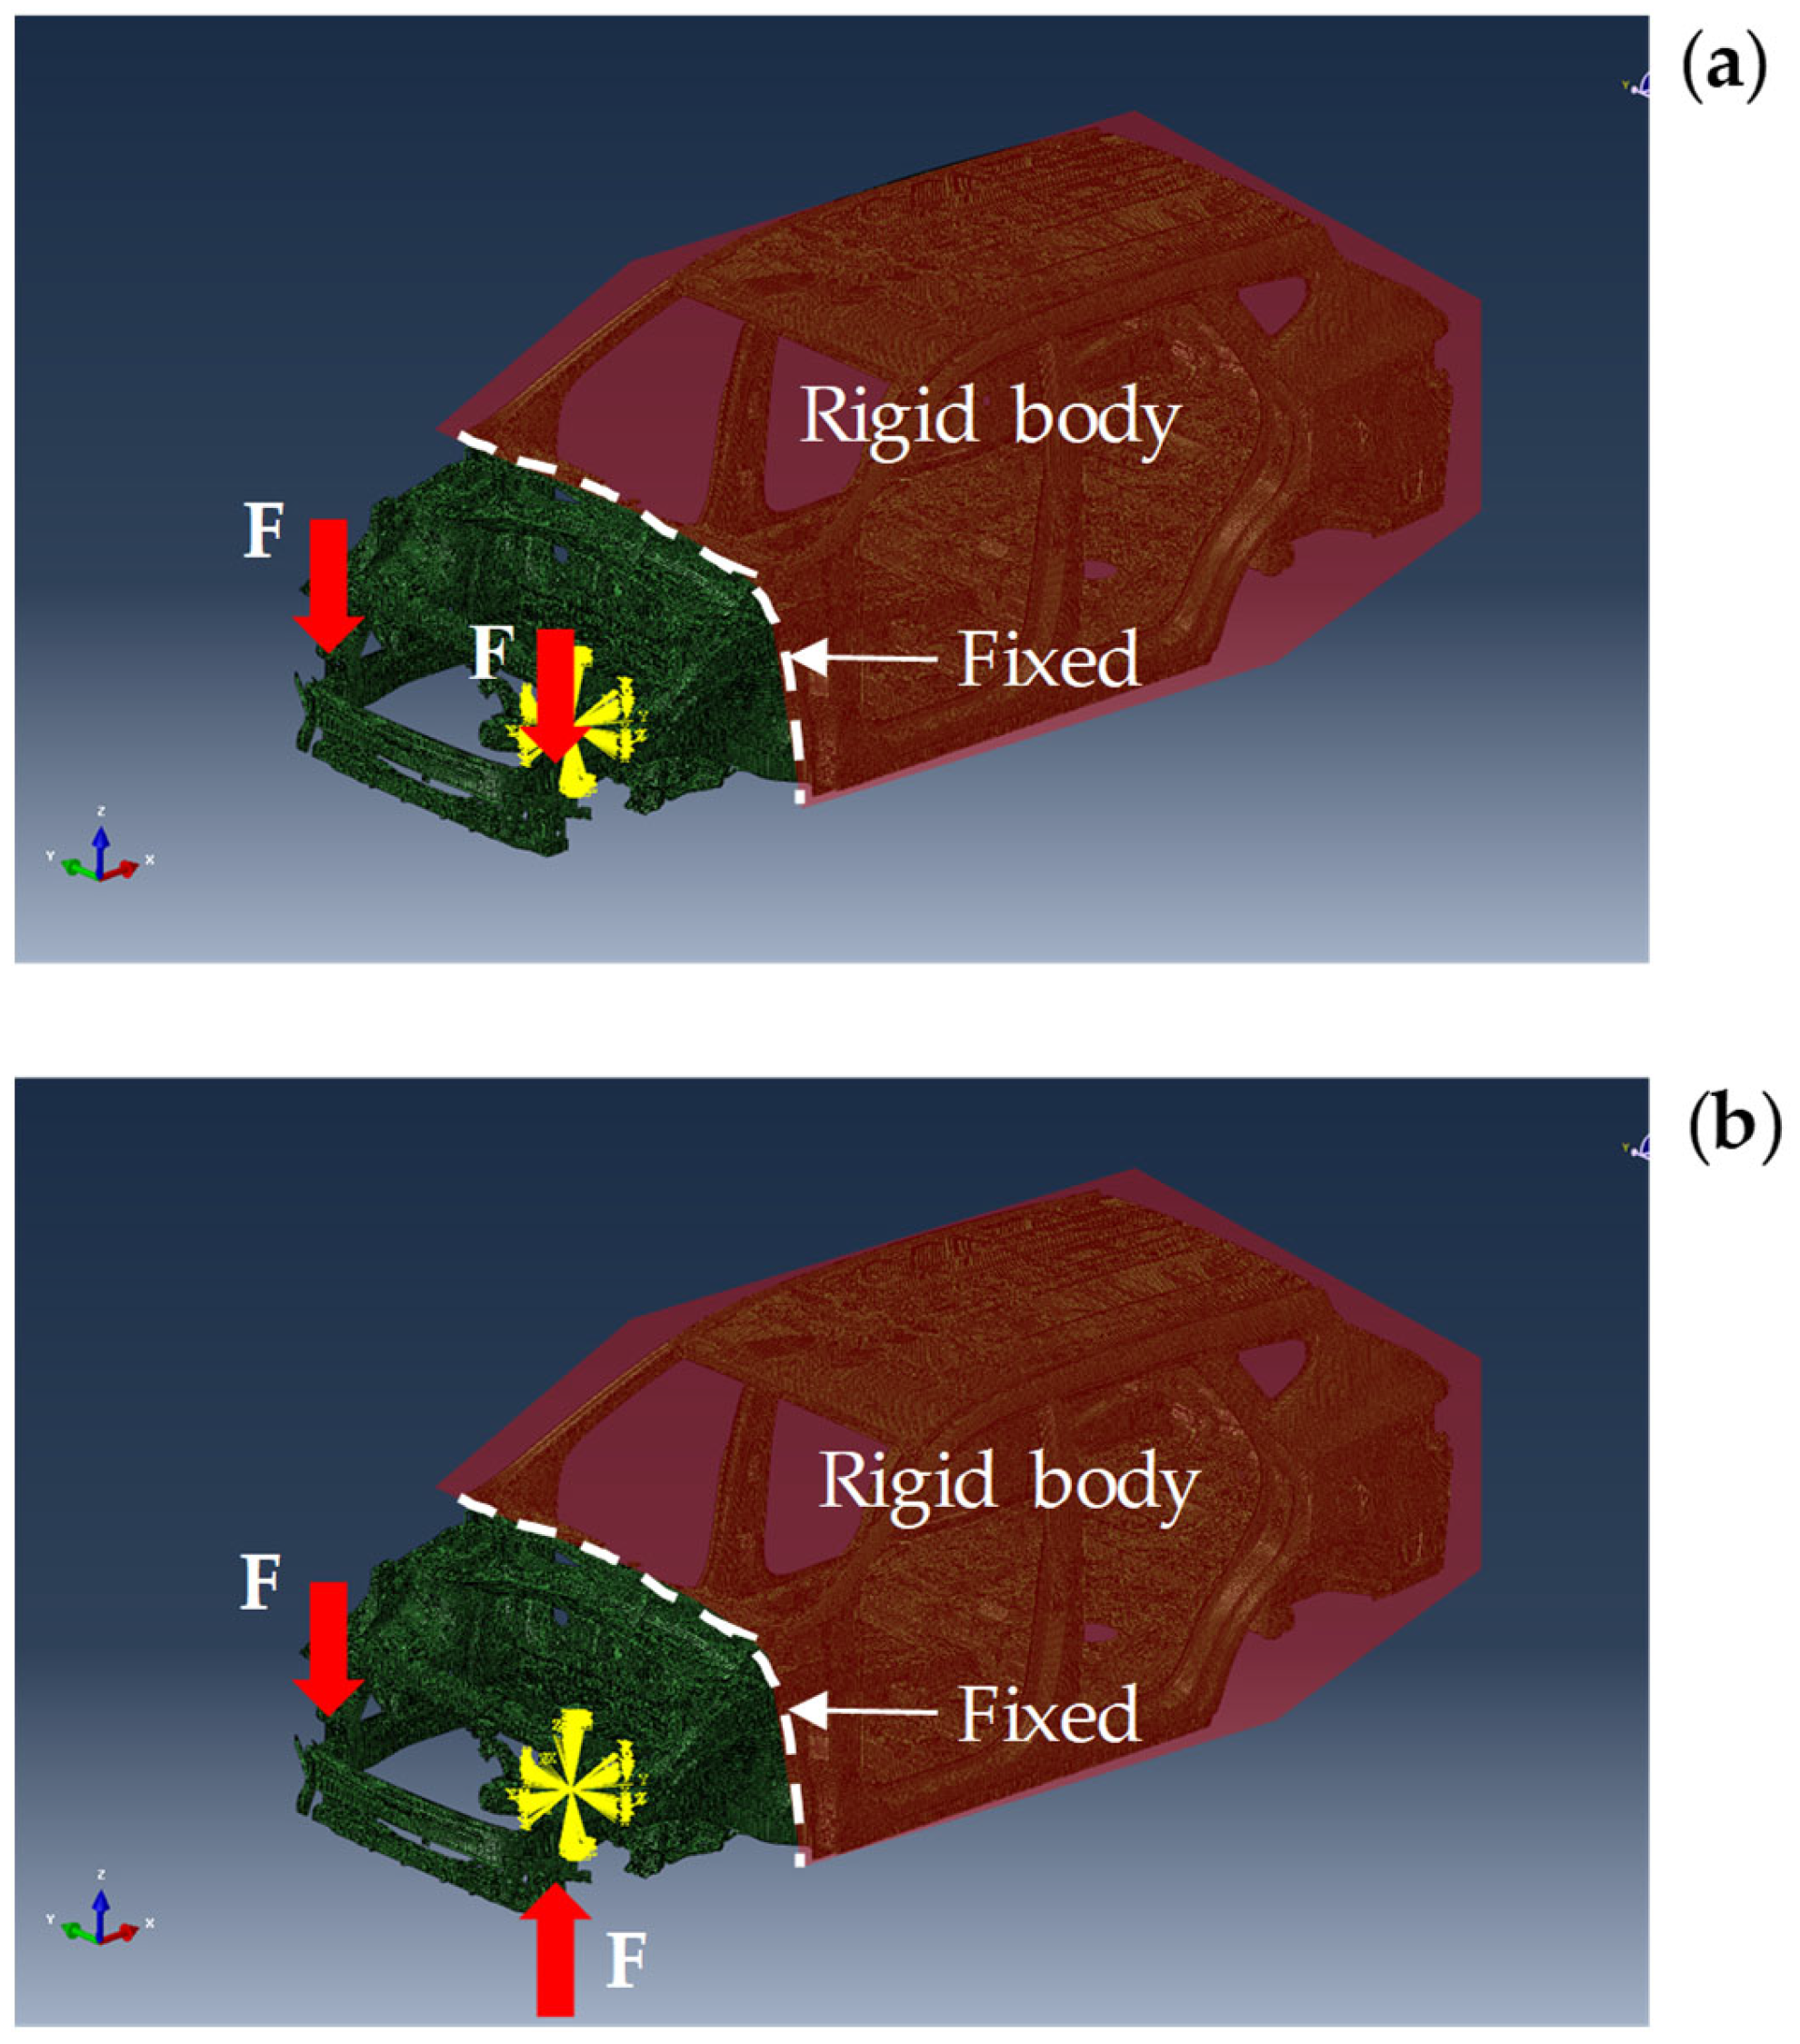
The equivalent bending and torsional stiffnesses between the front, middle, and rear body floors were obtained using a commercial package for finite element analysis. The process of obtaining equivalent stiffness between the front and middle body floors are described herein. As shown in
Figure 13, the front body floor was discretized into finite elements with the commercial package, and the middle and rear floors were modeled as stationary rigid bodies. The boundary between the front and middle body floors was considered to be fixed. The load conditions for obtaining the equivalent bending and torsional stiffnesses between the front and middle floors are displayed in
Figure 13a,b, respectively. To determine the bending stiffness, as shown in
Figure 13a, uniform vertical forces of
N were applied to both ends of the front-end module in the same direction. In addition, to determine the torsional stiffness, as illustrated in
Figure 13b, vertical forces in opposite directions were applied at both ends. The deflections at the front corner of the front-end module for the load conditions, which are depicted in
Figure 13a,b, obtained from the finite element analysis are 5.7 and 0.85 mm, respectively.
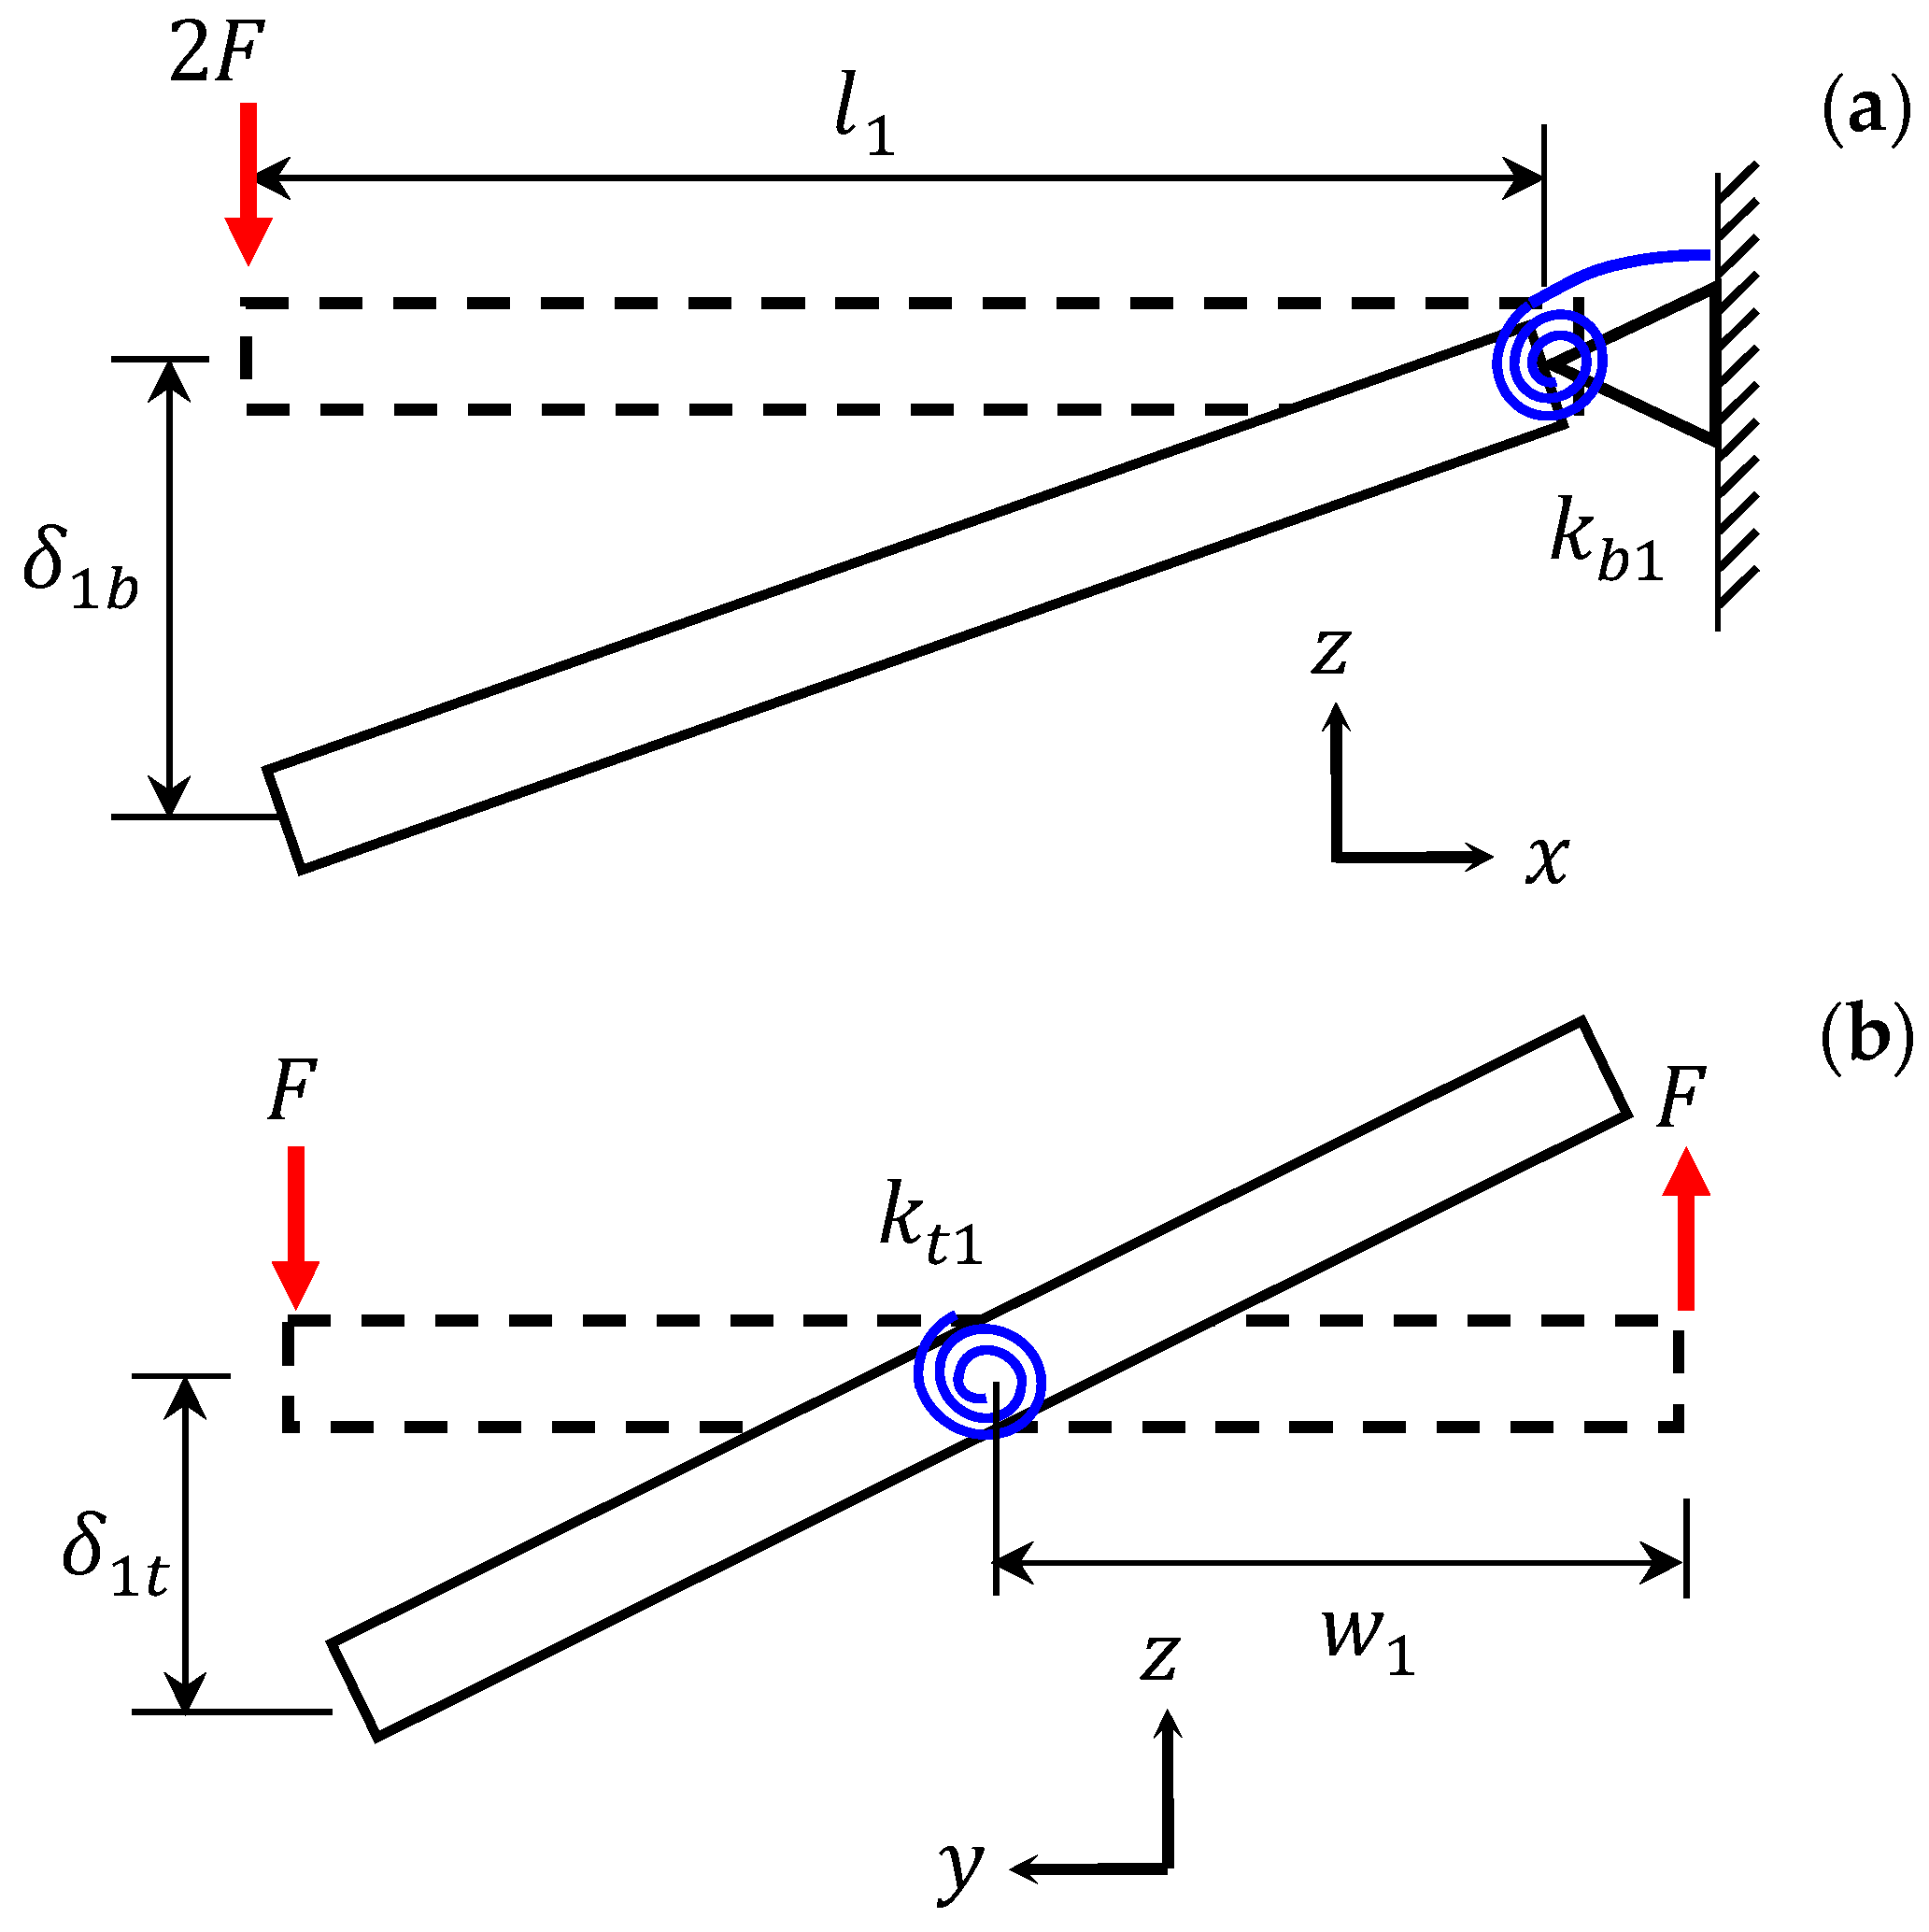
To determine the equivalent stiffnesses, the rigid front body floor illustrated in
Figure 9 has been schematically redrawn in
Figure 14, wherein
Figure 14a features the side view of the SUV, and its front view is displayed in
Figure 14b. As depicted in this figure, the force,
, is the same force of 10 N that was imposed in the finite element analysis, and
and
denote the length of the front floor (907 mm) and the half-width of the vehicle (428.5 mm), respectively. In
Figure 14,
and
respectively symbolize the bending and torsional stiffnesses between the front and middle floors, which are identical to those represented in
Figure 9, and
and
respectively denote the bending and torsional deflections. From the free-body diagrams in
Figure 14, the bending and torsional stiffnesses are obtained as
Substituting the bending and torsion deflections of mm and mm, which were obtained from the finite element analysis, into Equation (4), the bending and torsional stiffnesses between the front and middle floors were calculated as and N/mm, respectively. Similarly, the bending and torsional stiffnesses between the middle and rear body floors were determined as and N/mm.
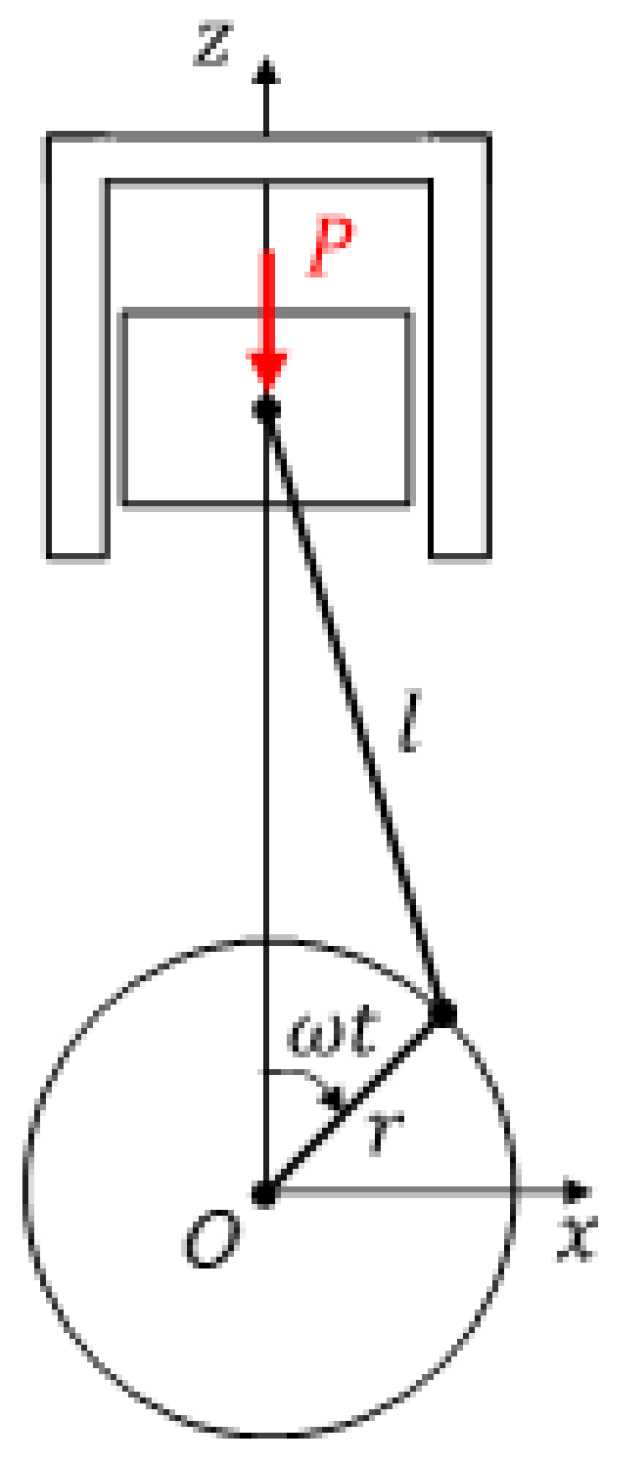
Subsequently, the excitation forces and moments generated from the engine in the powertrain were analyzed. These excitations are induced by the gas pressure resulting from the explosion inside the cylinder as well as the unbalanced inertia force owing to the piston, connecting rod, and crank. Generally, the primary and secondary inertia forces of the engine are negated by the crank and the balance shaft. Furthermore, the excitation forces and the pitch excitation moment are relatively low compared to the roll excitation moment. Therefore, in this study, the roll excitation moment generated by the gas pressure was considered as the main excitation force in the idle state. Considering the explosion mechanism in a cylinder, the piston, connecting rod and crank are illustrated in
Figure 15, wherein
denotes the gas pressure,
represents the length of the connecting rod,
depicts the length of the crank arm, and
symbolizes the angular velocity of the crankshaft. The gas torque,
, owing to the gas pressure at time
is expressed as follows [
24]:
where
denotes the piston area. In case of the four-cylinder diesel engine considered for this study, because the explosions occur with phase differences of 180 degrees in the two pairs of cylinders, the total gas torque,
, generated by the four cylinders is expressed as follows:
The diesel SUV employed in this study possessed a gas pressure of
N/mm
2, connecting rod length of
mm, crank arm length of
mm, and piston area of
mm
2. By substituting these values into Equation (6), the magnitude of the total moment was computed as
Nmm from Equation (6). For the idling frequency of 27.7 Hz, the angular frequency,
, is calculated as 348.09 rad/s. However, as reported in a study, only 1–5% of the total gas torque generally contributes to the vibration excitation torque [
25]. Considering the low engine speed and its stable idle state, 1% of the gas torque presumably contributed to the excitation torque. Therefore, when the engine is in the idle state, the amplitude of the roll excitation moment finally applied to the dynamic model was
Nmm.
4. Derivation of the Equations of Motion
As detailed in this section, the equations of motion for the dynamic model, which were proposed in the previous section, were derived and verified. The equations of motion were derived using Lagrange equations with constraints, which are expressed as follows:
where
(
represent 19 coordinates describing the motions of the dynamic model:
,
,
,
,
,
,
,
,
,
,
,
,
,
,
,
,
,
, and
. In the aforementioned equation,
,
, and
denote the kinetic energy, potential energy, and Rayleigh’s dissipation function, respectively,
symbolizes the generalized nonconservative forces,
represent the constraints, and
depict the Lagrange multipliers. Notably, the coordinates presented herein include 6 coordinates of
,
,
,
,
, and
in addition to the 13 independent generalized coordinates mentioned in
Section 3. To express the kinetic and potential energies more effectively in terms of the coordinates, the additional 6 coordinates were introduced. The constraints related to the additional coordinates are discussed herein.
First, consider the kinetic energy of the dynamic model for the diesel SUV, which can be expressed as
where
i represents the six parts of the SUV: the powertrain, radiator, intercooler, front floor, middle floor, and rear floor,
indicate the masses of these parts,
represents the velocity vectors of the mass centers,
denotes the angular velocity vectors, and
symbolizes the inertia matrices about the mass centers. The first term in the right-hand side of the equation represents the translational kinetic energy, whereas the second term is for the rotational kinetic energy. The velocity vector of mass center and angular velocity vectors for each part were defined in the global coordinate system. The kinetic energy was determined by substituting the velocity and angular velocity vectors and the inertia properties of
Table 1 into Equation (8).
The potential energy and Rayleigh’s dissipation function owing to the stiffness and damping properties of the mounts, bushings, hoses, and body floor connections are expressed as
where subscript
j,
r represent the equivalent translational and rotational springs, respectively,
and
are the equivalent translational and rotational stiffnesses, respectively. Subscript
s represent the equivalent translational dampers,
are the equivalent damping coefficients.
are the stretches of the equivalent translational springs,
are the angular changes of the equivalent torsional springs, and
are the velocity changes in the equivalent dampers. By expressing
,
and
in terms of the 19 coordinates and substituting the equivalent stiffnesses and damping coefficients, which are listed in
Table 2, and the equivalent stiffnesses of floor connections into Equations (9) and (10), the potential energy and Rayleigh’s dissipation function were expressed with these coordinates. Because the kinetic energy, potential energy, and Raleigh’s dissipation function expressed in terms of the 19 coordinates are extremely complex, these expressions have been excluded from this paper. Because the total gas torque expressed in Equation (6) is the sole load applied to the system, the generalized forces can be represented as
The constraints between the front, middle, and rear body floors were analyzed. As discussed earlier, the 19 coordinates are not independent of each other and only 13 coordinates are independent; thus, the proposed dynamic model features 6 constraints. These constraints are illustrated in
Figure 16, wherein
and
symbolize the contact points of the front and middle floors and the middle and rear floors, respectively,
,
and
denote the mass centers of the front, middle and rear floors;
and
represent the position vectors from the reference point
to the points
,
and
,
denotes a vector from point
to point
;
and
depict vectors from point
to points
and
, respectively, and
represents a vector from point
to point
. In this study, the following constraints were implemented in the dynamic model: the interface midpoints of the front and middle floors are connected, and the interface midpoints of the middle and rear floors are connected. In addition, the floors notably exhibit the roll and pitch motions (rotations about the
x- and
y-axes) without the yaw motion (rotation about the z-axis). Under these conditions, the constraint in which the interface midpoints of the front and middle floors are connected can be expressed as
and the constraint in which the interface midpoints of the middle and rear floors are connected can be expressed as
In Equations (12) and (13), the constraint vectors are expressed as
and the rotation matrices are expressed as
The constraints for this dynamic model are represented by
Upon substitution of the kinetic energy, potential energy, Raleigh’s dissipation function, generalized forces, and the constraints into the Lagrange equations, the equations of motion and the constraints can be derived as follows:
where
M denotes the mass matrix,
N represents the nonlinear internal force vector,
q symbolizes the displacement vector,
f depicts the applied load vector,
λ depicts the Lagrange multiplier vector,
g represents the constraint vector, and
A denotes the Jacobian matrix.
can be also expressed as
.
By differentiating Equation (18) twice with respect to time, the following equation is obtained:
All the displacements are assumed to be minimal because
is linearized as
, where
C is the damping matrix and
K is the stiffness matrix. In this case, the nonlinear equations of motion expressed in Equation (17) can be reduced to the following linearized matrix–vector equation:
where
denotes the linearized Jacobian matrix. The linearized version of Equation (23) is expressed as
Notably, M, C, and K are matrices, and is a matrix.
The linearized equations of motion were verified by comparing the analytically computed natural frequencies with the experimentally measured natural frequencies. Because the damping of the system does not have a significant effect on the computation of the natural frequencies, the damping term,
, and the applied load,
were neglected in the computations of the natural frequencies using the model presented in this study. For
and
, where
, the natural frequencies for the equations of motion with constraints were derived from the following eigenvalue problem [
26]:
Equation (26) equation yields the characteristic equation expressed as
In
Table 3, the natural frequencies, which are computed from Equation (25) using the properties detailed in
Section 3, are compared with the natural frequencies obtained from the modal tests, as reported in
Section 2. According to the information listed in this table, the analytically calculated natural frequencies are in agreement with the experimentally measured frequencies.
Subsequently, the mass effects of the radiator and intercooler on the vibration level during engine idling were investigated through a simulation and an experiment, and the proposed dynamic model was verified again by demonstrating that the mass effects exhibit identical tendencies in the simulation as well as the experiment. Prior to verification, the simulation process was considered to obtain the frequency response function for the constrained system, which is defined in Equations (24) and (25). Let the displacement and Lagrange multiplier vectors be
and
, and let the applied load be
; thus, Equations (24) and (25) can be rewritten as follows:
where
. From Equations (28) and (29), the displacement response vector
can be expressed as
, where
is the frequency response function for constrained system expressed as follows.
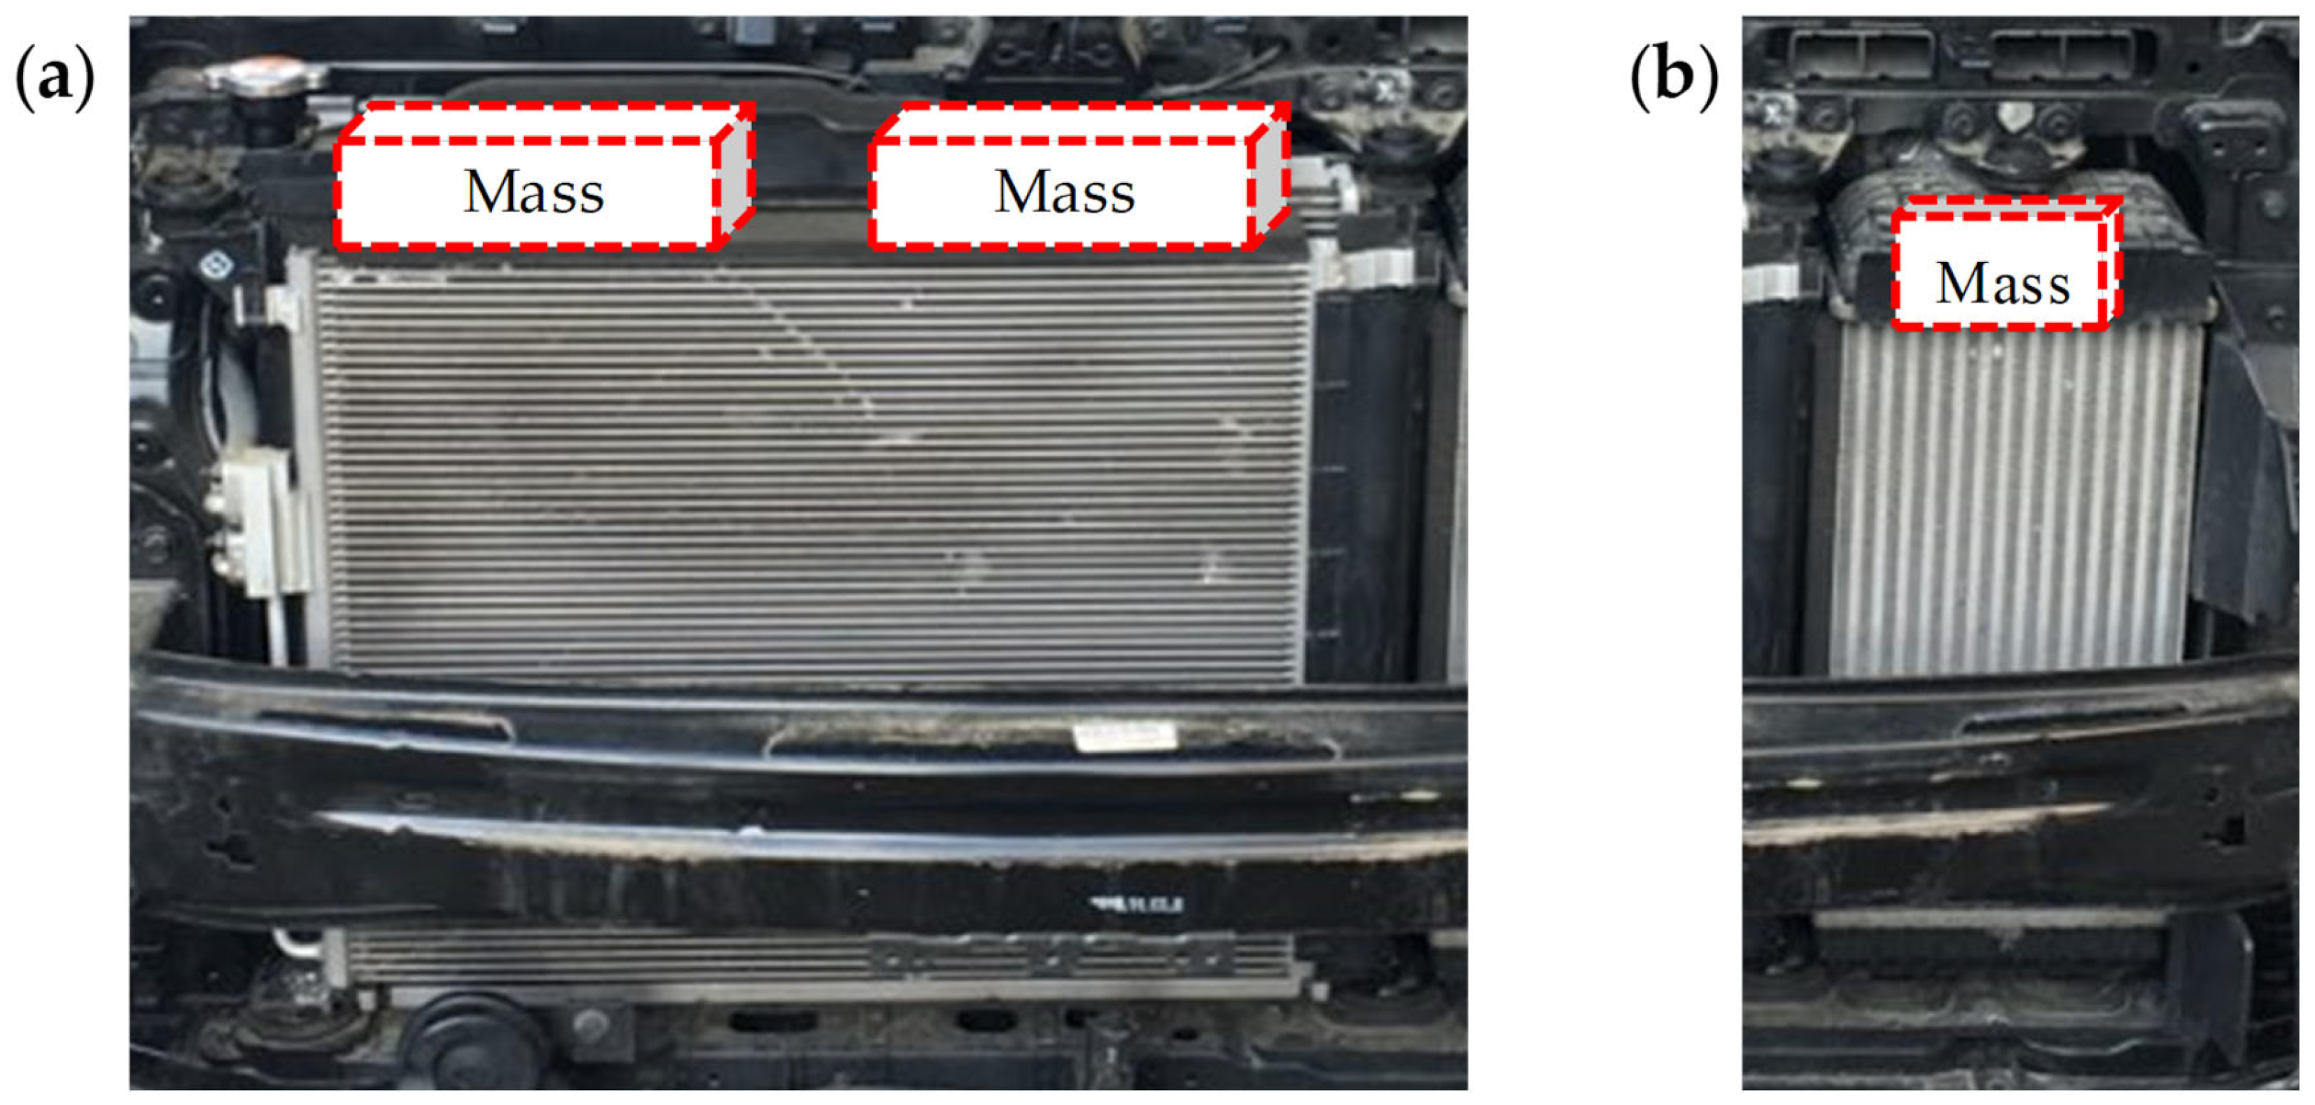
The vibration levels were experimentally measured in the idle engine state by adding mass blocks of various sizes to the radiator or intercooler as illustrated in
Figure 17. The added masses were 1, 2, 3, and 4 kg for the radiator and 0.5, 1.0, 1.5, and 2.0 kg for the intercooler. The vibration levels were measured at the driver’s seat position on the body floor at an engine speed of 830 rpm, i.e., an idling frequency of 27.7 Hz. In addition, using the added blocks in the experiments for the radiator and intercooler, simulations were performed with the dynamic model established in this study. The vibration levels obtained through simulation and experiment for changes in the added mass are listed in
Figure 18 for a comparative study. The decibel (dB) scale in
Figure 18 can be converted to a linear scale (m/s
2). Denoting the accelerations in the dB and linear scales by
and
, the relationship between
and
is given by
. Although the vibration levels of the simulation and the experiment are slightly different, the trends of the overall increasing and decreasing levels are notably similar. As described earlier, the dynamic model established in this study was verified by comparing the natural frequencies and vibration levels obtained from the simulation and experiment.
5. Design Optimization for the Idle Vibration Reduction
The design was optimized using the verified dynamic model to reduce the vibration during engine idling. To formulate the optimal design, the vibration level during engine idling at the position of the driver’s seat on the body floor was selected as an objective function, and the physical properties related to the radiator and intercooler were regarded as the design variables. Prior to design optimization, the effects of the design variables on the vibration level on the driver’s seat were analyzed. Using these variables, the design was optimized to minimize the vibration during the idle engine state. According to the results, the idling vibration level obtained from the optimal design was reduced compared to the level of the present design. Furthermore, the mechanism for reducing the vibration in the idle engine state was analyzed, and a design guideline to reduce the vibration was suggested.
The design variables considered in the design optimization stage to minimize the vibration level during engine idling comprise the masses of the radiator and intercooler, the stiffnesses of the rubber bushings, and the stiffnesses of the hoses. These attributes were selected as the design variables because they facilitate design changes without the requirement of considerable structural changes to the vehicle. The present values and the lower and upper limits of the design variables are listed in
Table 4. The lower and upper design limits for the masses of the radiator and intercooler were set to 80% and 120% of the present values, respectively. Conversely, the lower design limits for the stiffnesses of the rubber bushings and hoses were selected as 50% of the present values, and the upper limits were selected as 200% of the present value. Compared to substantially changing the masses of the radiator and intercooler, which is a challenging task, changing the stiffnesses of the bushings and hoses is relatively feasible; thus, the aforementioned lower and upper limits were selected. Moreover, considering that the enhancement of the stiffnesses of the bushings and hoses is more convenient to execute than their reduction, their lower and upper limits were set to 50 and 200% of the present values.
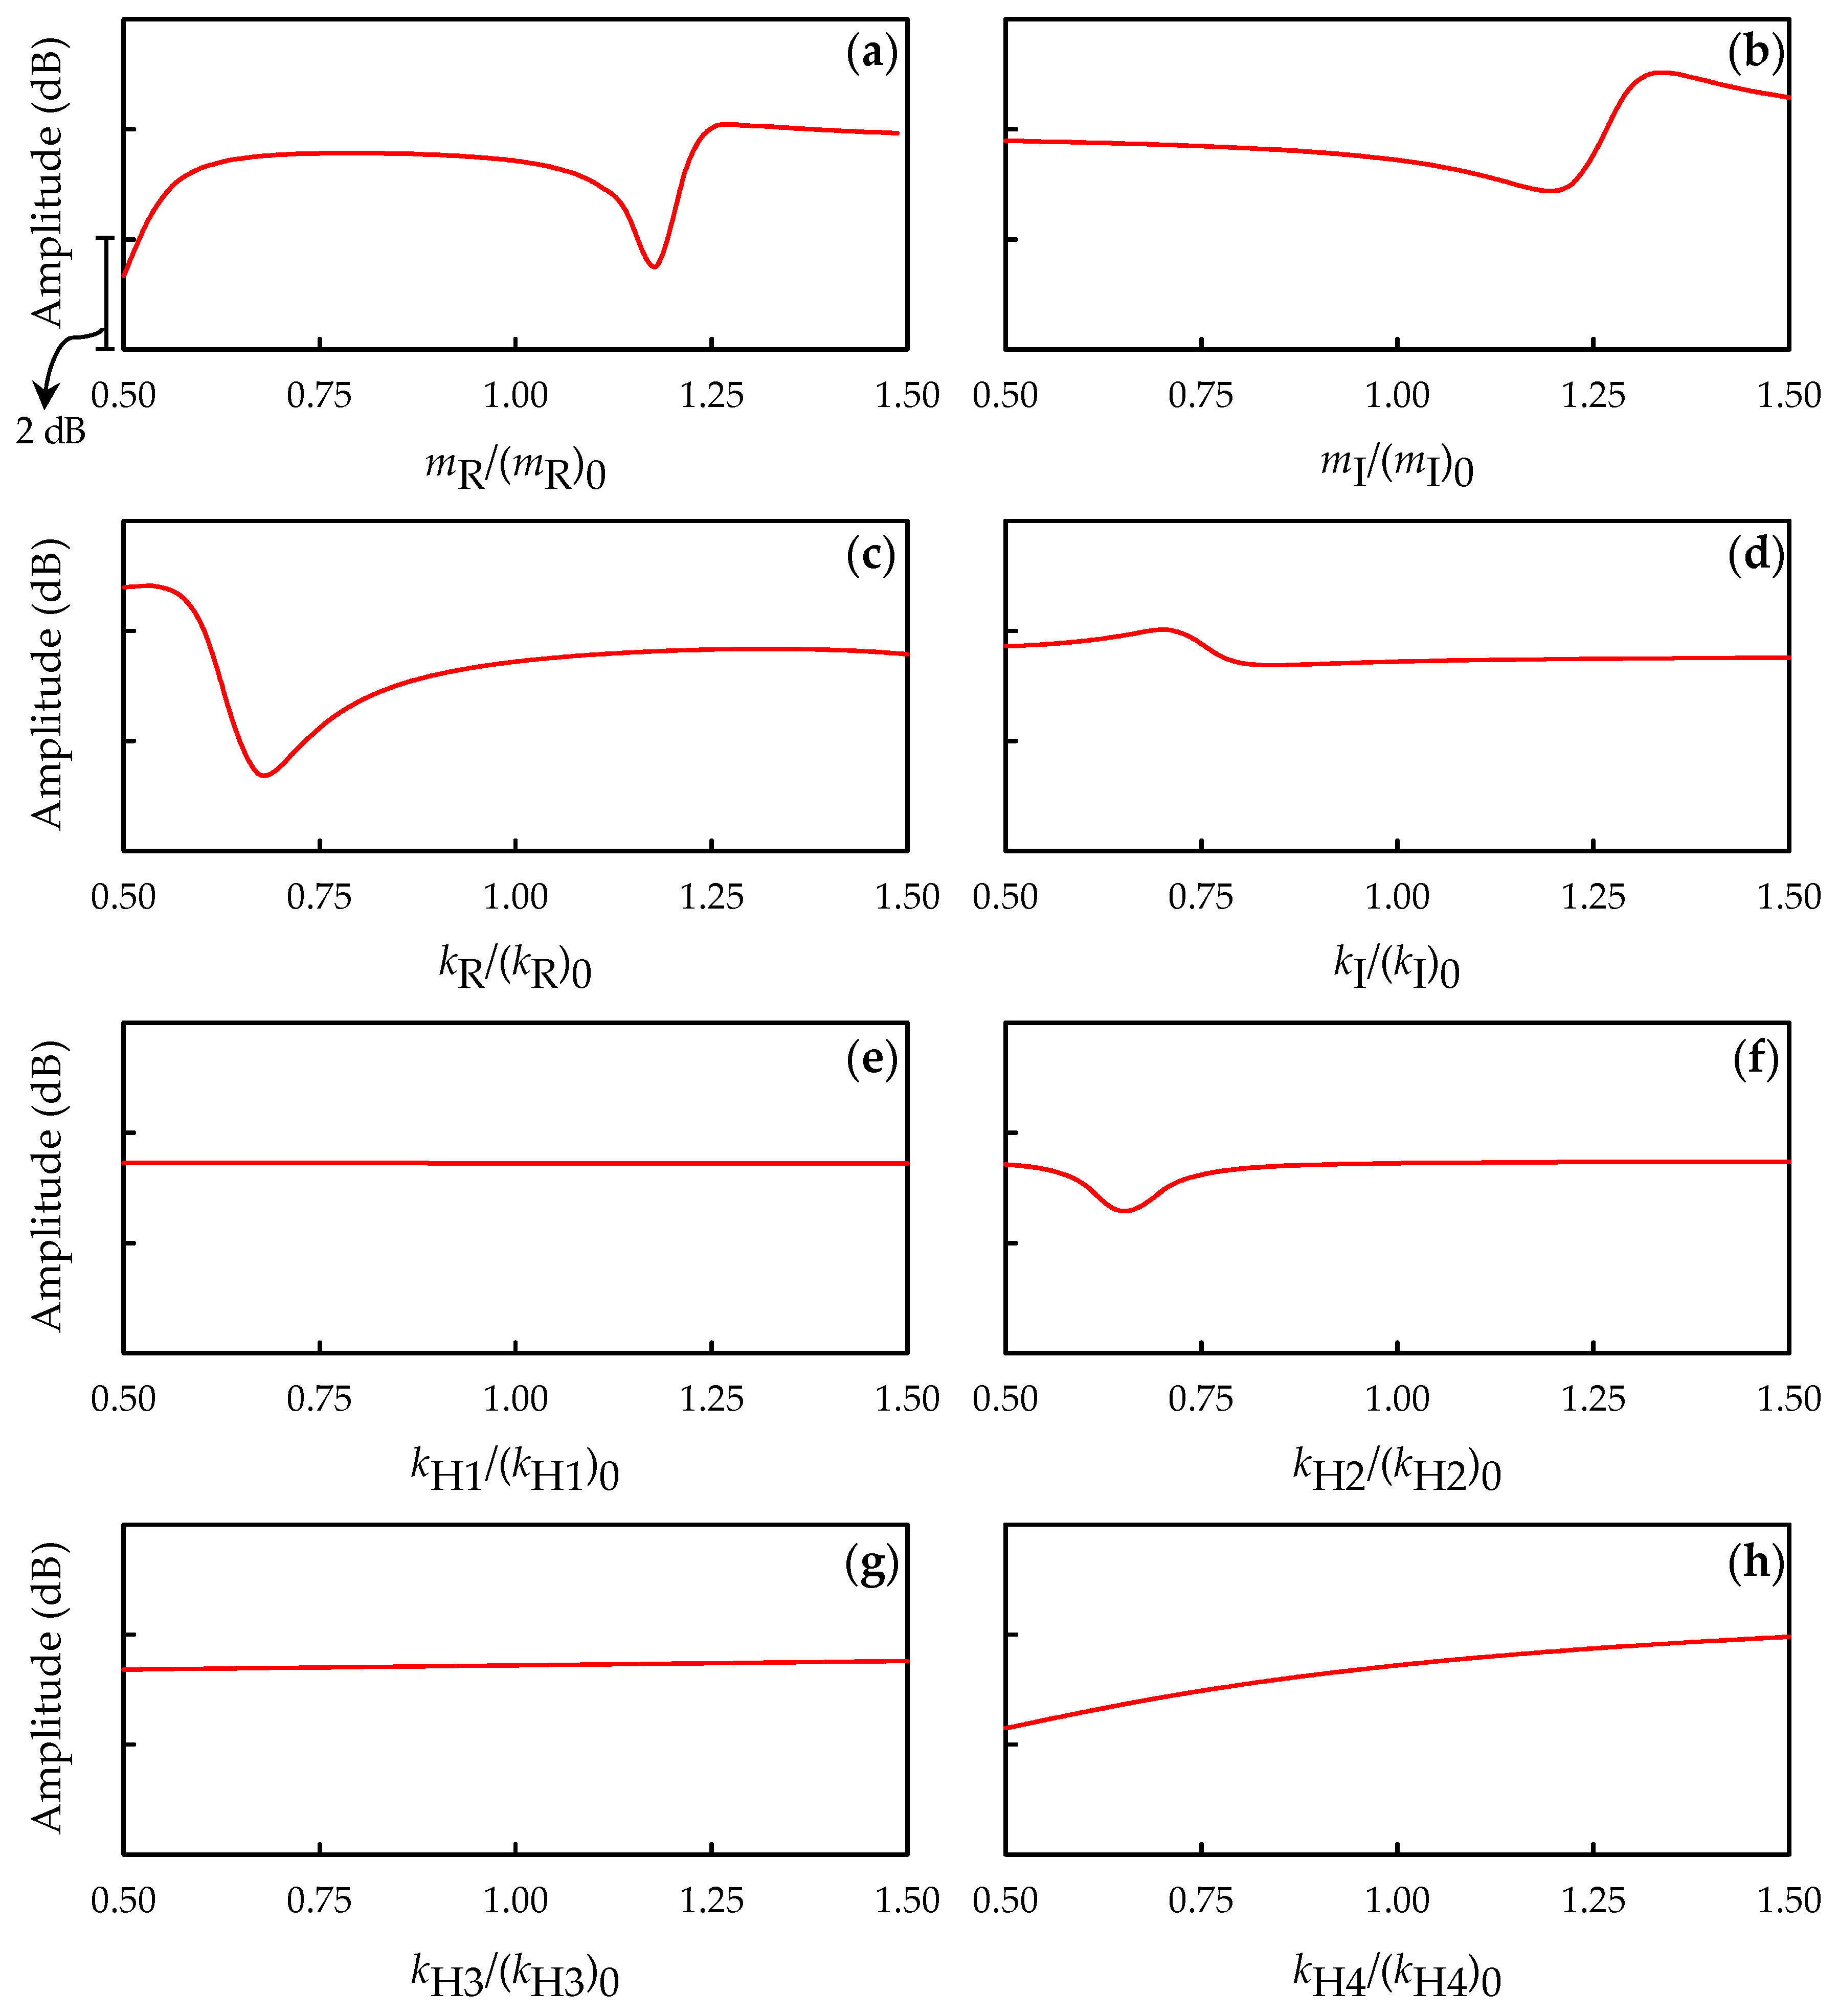
A parametric study was conducted to investigate the influence of the aforementioned design variables on the objective function, i.e., the vibration level on the driver’s seat during engine idling. The variations in value of the objective function were observed while altering a design variable value between the lower and upper limits for all variables, excluding the corresponding variable, set at their present values. The results of the parametric study for the eight design variables, which are listed in
Table 4, are illustrated in
Figure 19. All the variables are normalized with respect to their present values indicated by the subscript “0”; the changes in the idle vibration level are displayed for the normalized values from 0.5 to 1.5. As depicted in the figure, the idle vibration level is considerably affected by the radiator mass (refer to
Figure 19a), the intercooler mass (refer to
Figure 19b), the rubber bushing stiffness of the radiator (refer to
Figure 19c), and the lower hose stiffness of the intercooler (
Figure 19h). However, the idle vibrations are relatively less affected by the rubber bushing stiffness of the intercooler (refer to
Figure 19d), the upper hose stiffness of the radiator (
Figure 19e), the lower hose stiffness of the radiator (
Figure 19f), and the upper hose stiffness of the intercooler (
Figure 19g).
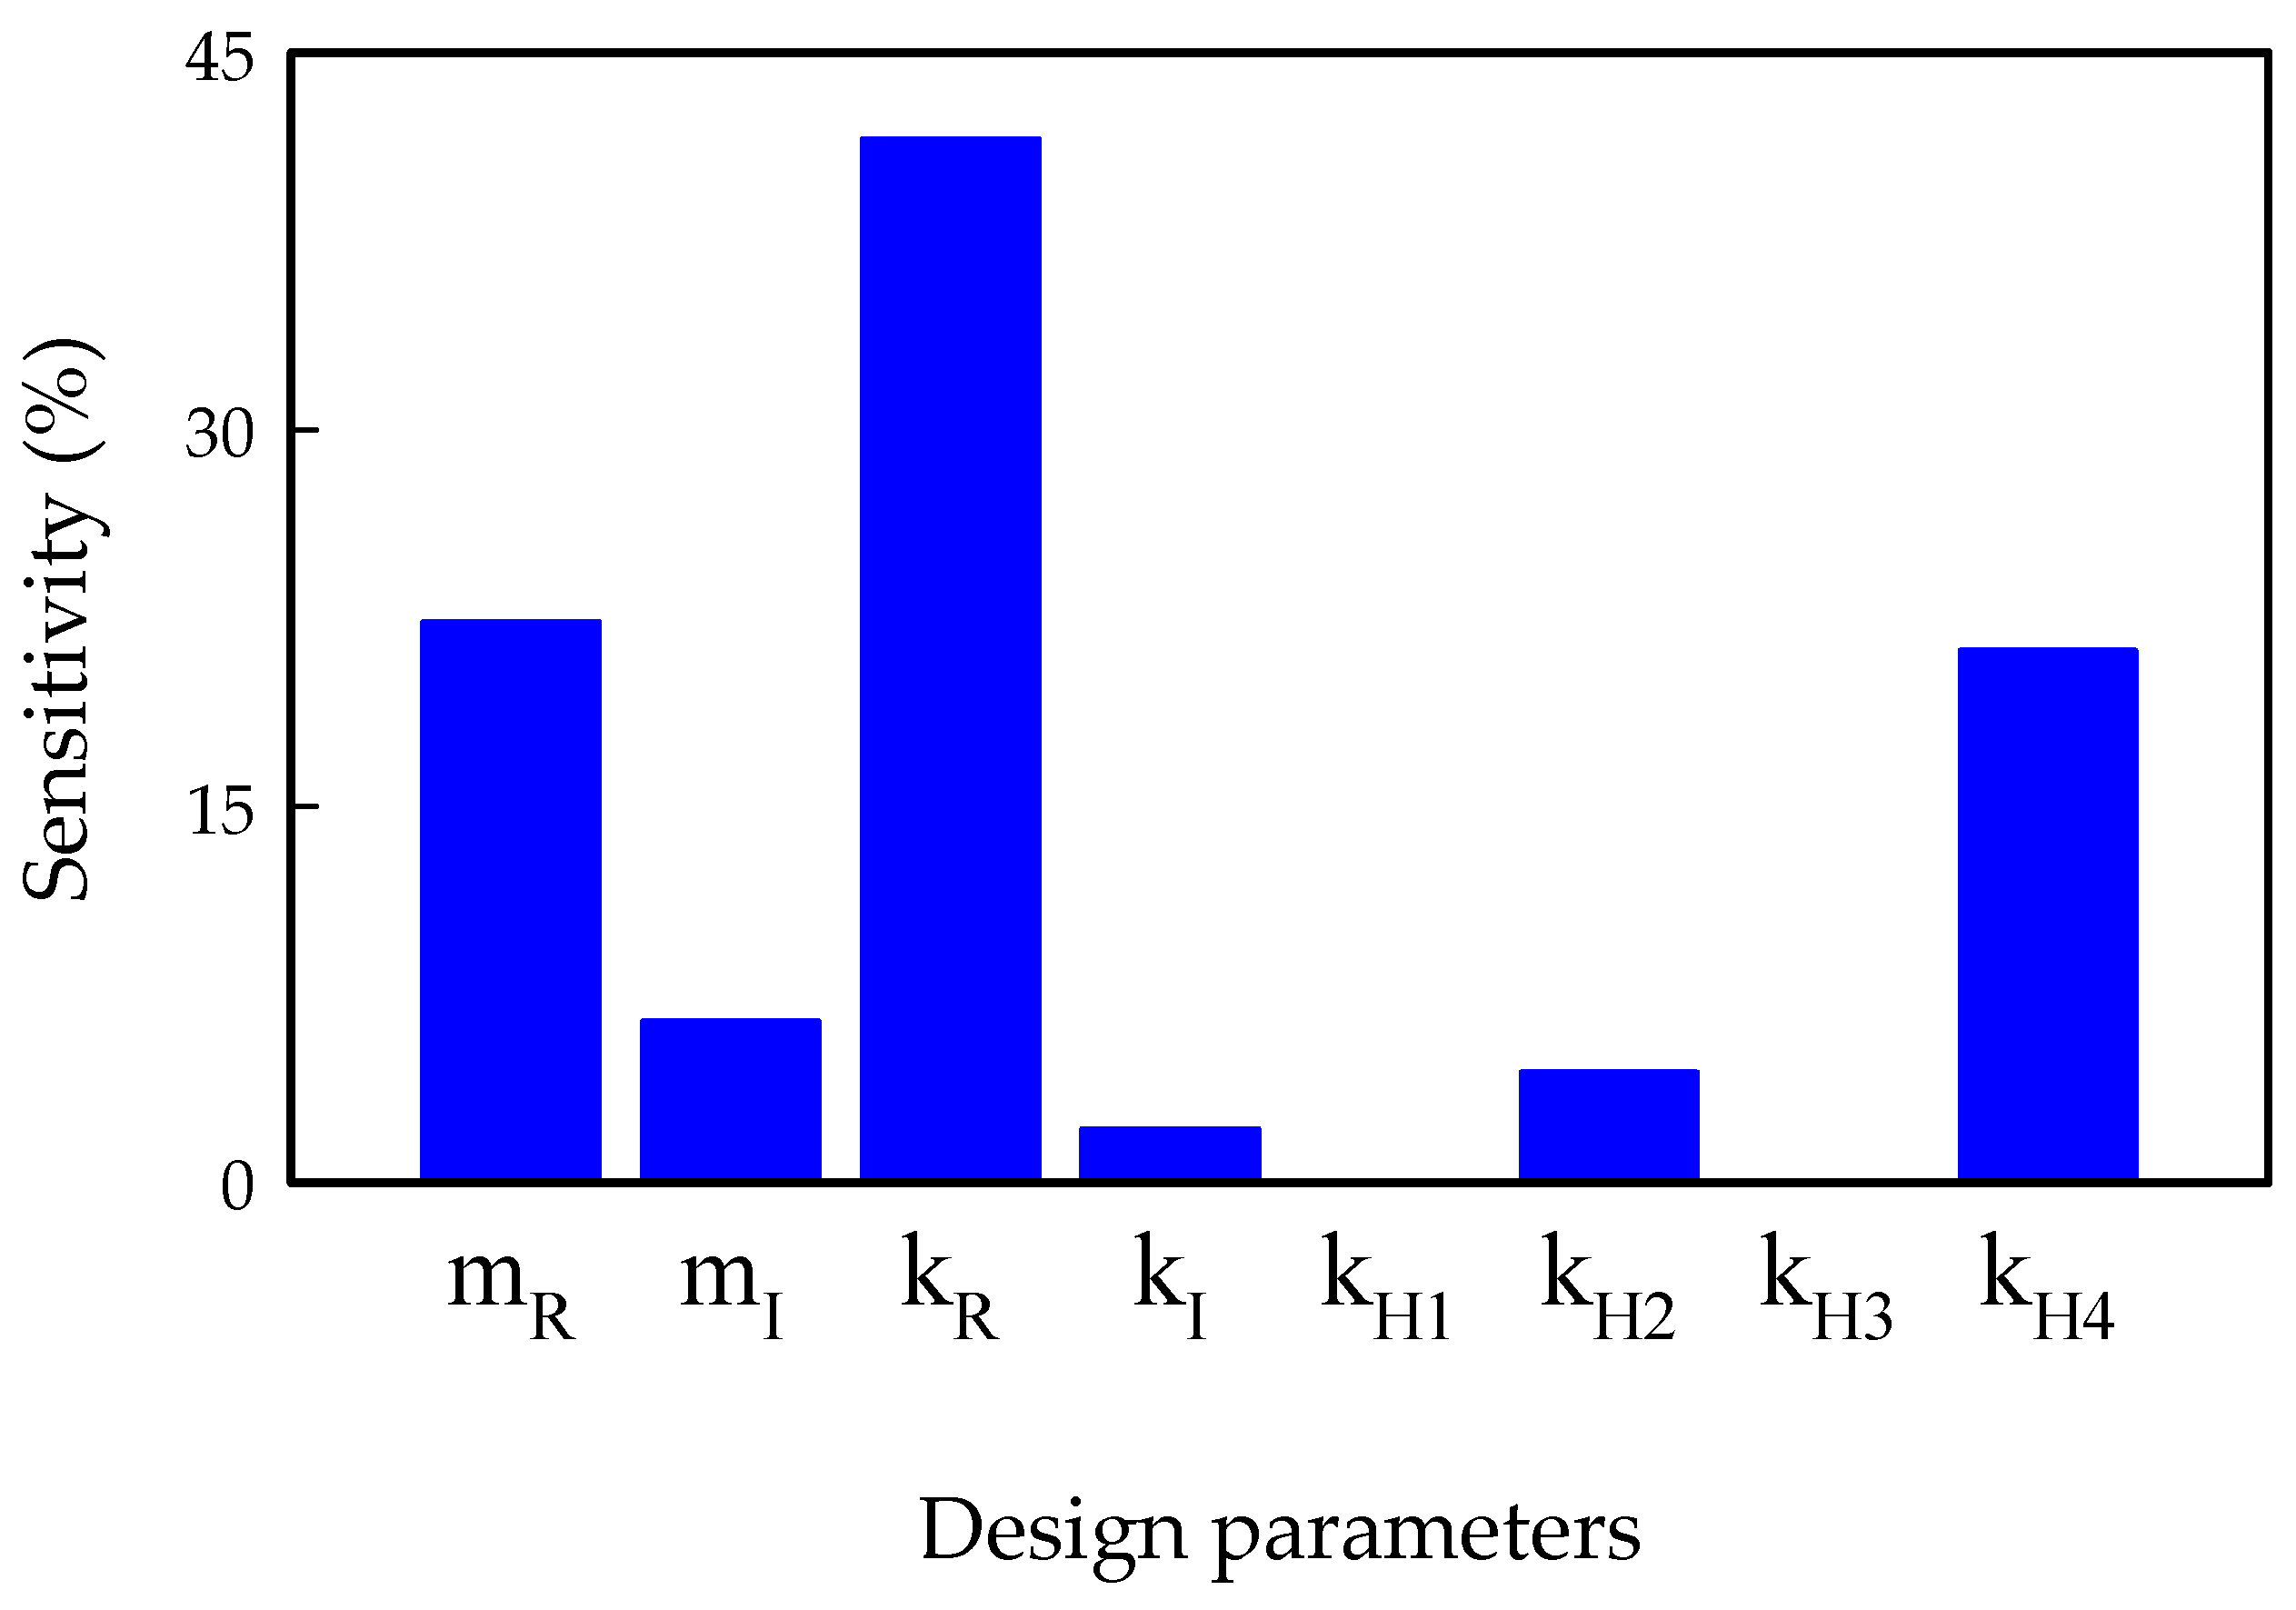
The sensitivities of the design variables were analyzed to determine the variables that considerably influence the idle vibration. To perform the sensitivity analysis, an established experimental design was adopted, which can extract the maximum information for a minimal number of experiments. For the experimental design, the idle vibration level was selected as the objective function along with the aforementioned eight design variables, and the variables were set in three levels: the lower limit, present value, and upper limit. The incorporation of levels is advantageous because a greater number of levels will yield more accurate results; however, this method significantly increases the experimental time and cost involved. Accordingly, three levels were implemented in this analysis.
After the evaluation of the idle vibration levels for each of 117 experiments using the
orthogonal array table, the effect of each design variable on the idle vibration was analyzed through analysis of variance (ANOVA) [
27]. ANOVA is a widely used statistical formula for comparing variances across the means (or average) of different variables. The sensitivity analysis results of the design variables with respect to the idle vibration within the specified design ranges are illustrated in
Figure 20. The following design variables that affect idle vibration are listed in decreasing order of sensitivity: the rubber bushing stiffness of the radiator, the radiator mass, the lower hose stiffness of the intercooler, the intercooler mass, the lower hose stiffness of the radiator, the rubber bushing stiffness of the intercooler, the upper hose stiffness of the intercooler, and the upper hose stiffness of the radiator. In particular, the sensitivity analysis results depicted in
Figure 20 are consistent with those of the parametric study presented in
Figure 19.
To minimize the idle vibration level, the optimal design was implemented within the range constraints of the design variables. The design was optimized using the progressive quadratic response surface modeling (PQRSM) method, which is included in the commercial design optimization software package PIAnO [
28]. To perform the design optimization using the eight design variables listed in
Table 4, the idle vibration level was selected as the objective function, and these design variables were varied from their lower to upper limits, as depicted in
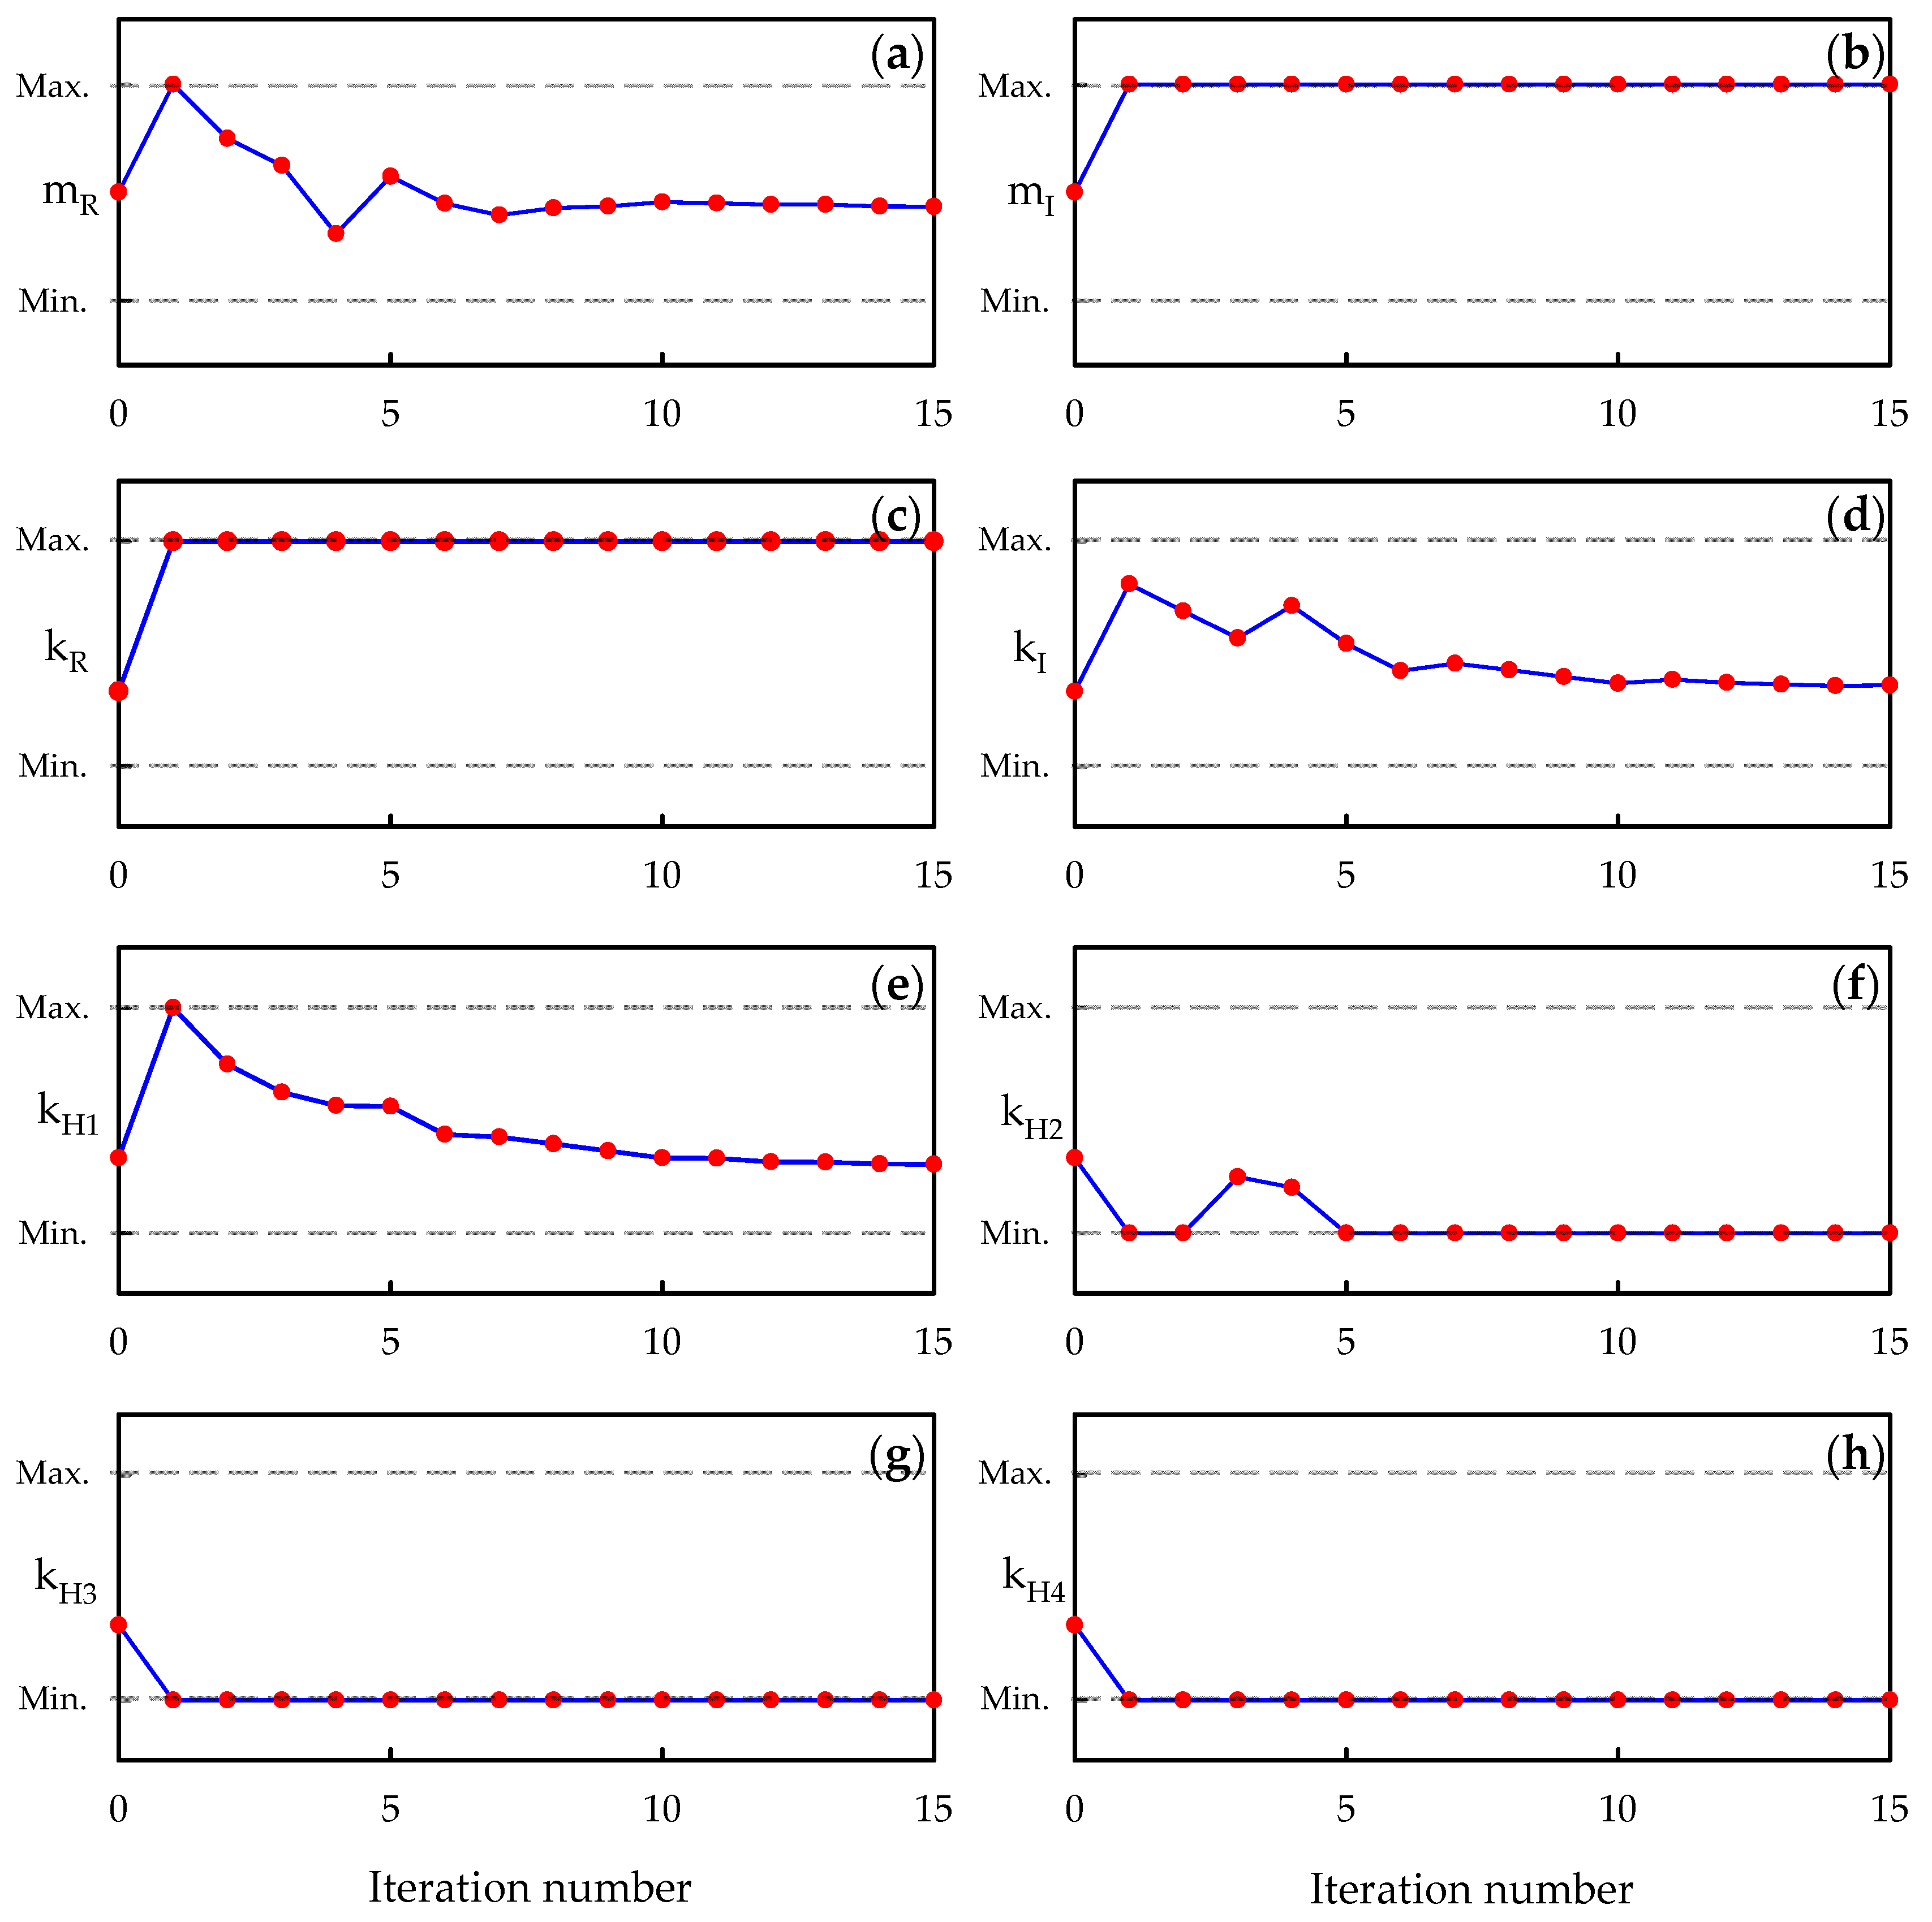
Table 4. The convergence results of design optimization are shown in
Figure 21, in which the lower and upper dashed lines represent the minimum and maximum values of each design parameter range, respectively. This figure presents the numbers of iterations where the design parameters converge to their optimum values in the process of design optimization. All design parameters converged within 15 iterations. The idle vibration level obtained through the design optimization was 9 dB lower than the level yielded by the present design. This reduction of 9 dB in vibration level corresponds to a reduction of 60.7 mm/s
2 on a linear scale. In fact, the idle vibration of the optimized design is reduced by 64.5% on a linear scale than that of the present design. The design variable values obtained from the design optimization are summarized in
Table 4. In this table, the optimized values of the rubber bushing stiffness of the radiator and the intercooler mass represent the upper limits of the design ranges, whereas the optimized values of the lower hose stiffness of the radiator, the upper hose stiffness of the intercooler, and the lower hose stiffness of the intercooler comprise the lower limits. Conversely, the optimized values of the radiator mass, the upper hose stiffness of the radiator, and the rubber bushing stiffness of the intercooler do not exhibit any significant differences compared with the present design values.
A comparative study of the computed natural frequencies for the present and optimized designs reveals the modes that are affected by the optimization.
Table 5 compares the natural frequencies computed via simulation for the present and optimal designs are compared in
Table 5. In this table, the natural frequencies of the modes related to the powertrain and body floor do not change significantly. However, the natural frequencies of the bounce and roll modes of the radiator for the current design, which are 19.4 and 30.3 Hz, increased to 26.7 and 34.1 Hz in the optimal design. The increments in the natural frequencies for these modes are relatively large, 7.3 and 3.8 Hz. The natural frequency of the intercooler bounce mode in the current design, which is 31.0 Hz, is slightly reduced to 28.9 Hz in the optimal design. In other words, the natural frequencies of the modes for the radiator and intercooler are more affected by the design optimization than the modes for the powertrain and body floor. This is because only design variables related to the radiator and intercooler were considered in the design optimization.
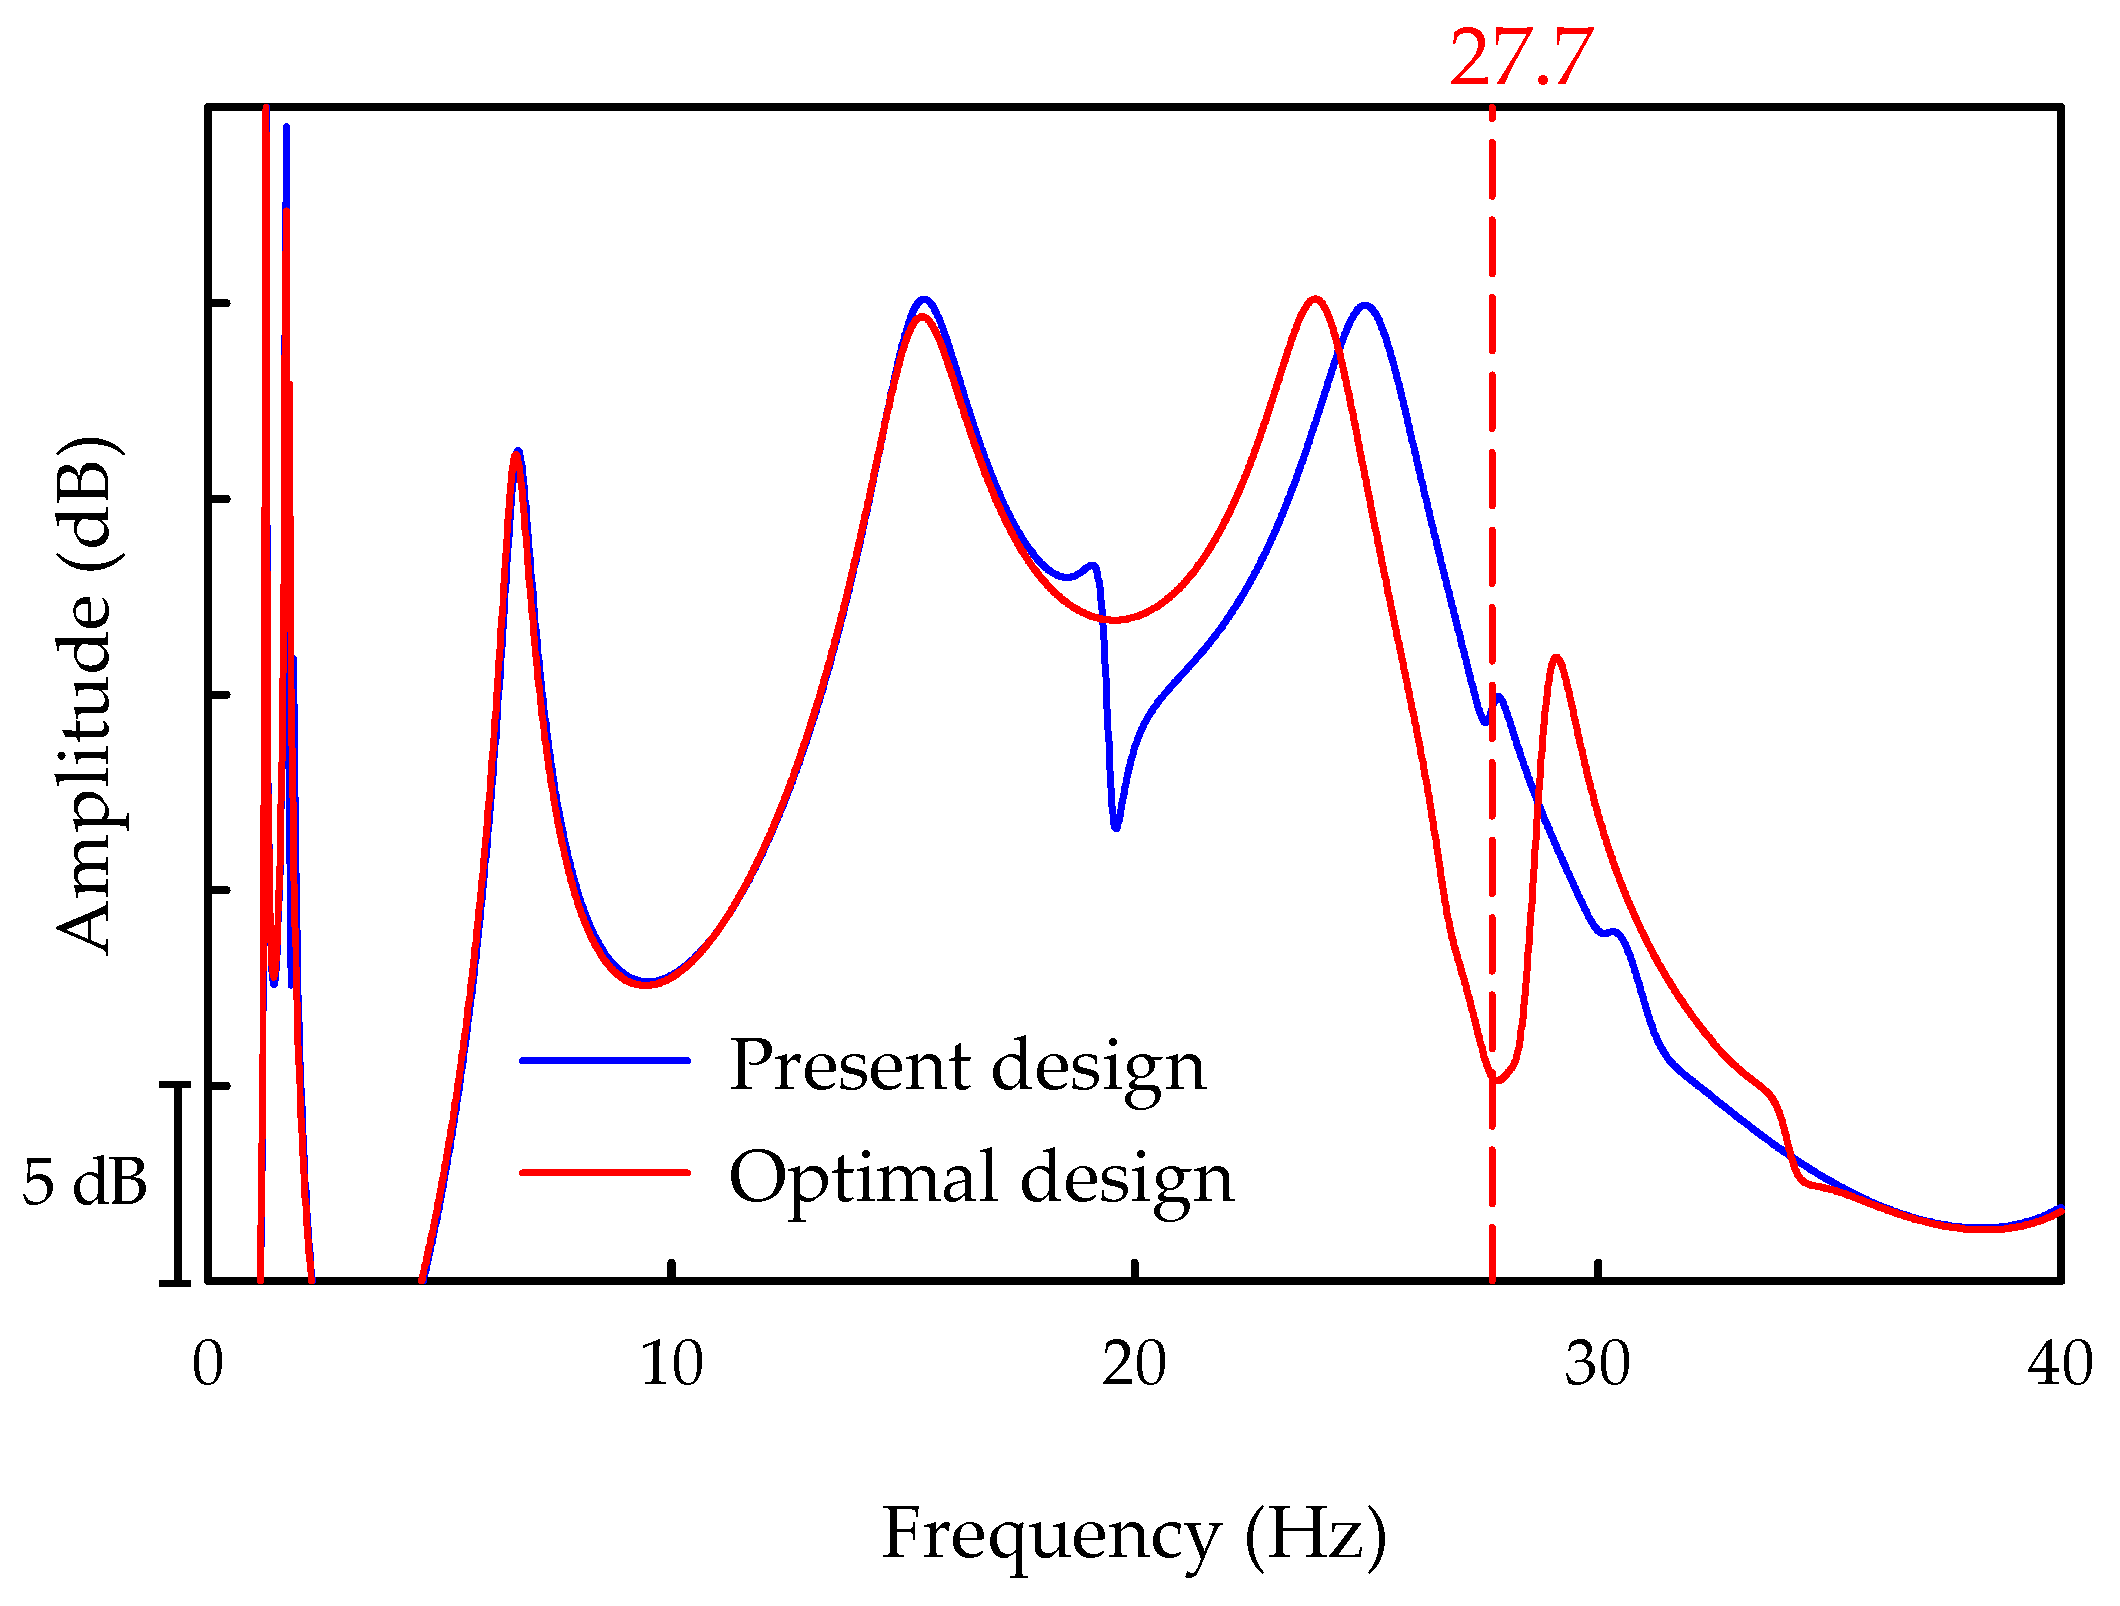
The frequency response function of the dynamic model with the optimized design variables was compared with that of the model with the present design variables. Through this comparison, we investigated the reason of the dynamic model with the optimized variables exhibiting a lower idle vibration level than the model with the present variables. The frequency response functions for the dynamic models with the present and optimized design variables are compared in
Figure 22, wherein the blue and red lines represent the frequency response functions for the present and optimal designs, respectively. As displayed in this figure, the frequency response function curves adjacent to the peaks of 1.2, 1.7, 6.7, and 15.3 Hz do not undergo significant changes, which are the natural frequencies of the bounce and pitch modes of the body floor and powertrain. However, a large variation can be observed in the curves corresponding to the idling frequency of 27.7 Hz. Owing to the design optimization, the frequency response function exhibits an anti-resonance point at idling frequency, significantly lowering the vibration level at the driver’s seat. Therefore, the optimal design reduces the natural frequencies for the bounce modes of the radiator and intercooler (26.7 and 28.9 Hz, respectively) to a value proximate to the idling frequency (27.7 Hz), which causes the radiator and intercooler to act as vibration absorbers. Accordingly, a design, wherein the natural frequencies for the bounce modes of the radiator and intercooler are proximate to the idling frequency, is recommended to reduce the idle vibration on the driver’s seat of a diesel SUV.
The reduction of idle vibration presented in this paper is differentiated and innovative from the methods of previous studies in that it is based on a dynamic model that considers the deformation of the body floor. The previous studies tried to reduce idle vibration by considering only the vibration transmission path from the powertrain to the driver’s seat. However, this study presents a new method to reduce idle vibration method, based on the dynamic model of the diesel SUV, which considers not only the rigid-body motions of the powertrain, radiator, and intercooler but also the bending and torsional deformation motions of the body floor. In addition, it is novel that the radiator and intercooler act as a vibration absorber so that the vibration energy of the powertrain is not transmitted to the driver’s seat, but the radiator and the intercooler.


