Abstract
The purpose of this study is to substantiate the concept of express assessment of potato tubers for mechanized harvesting using fluorimetric and RAMAN lidar, as well as to conduct a quantitative and structural assessment of damage to potato varieties and hybrids, using a device that simulates the process of operation of the combine separator, depending on the type of machine and harvesting conditions. In addition, calibration of the lidar was undertaken to assess the magnitude of the physical impact of the drum to assess the damage. A structural–functional diagram of a device for assessing the suitability of varieties and hybrids for mechanized harvesting has been developed. The methodology and results of this study are presented to determine the assessment of damage to potato tubers by a RAMAN lidar when fixing their force impact of the separating surface of the developed device on a potato tuber. The device developed in accordance with the proposed conceptual scheme, additionally calibrated taking into account modern potato harvesters and tested on a RAMAN lidar, will allow targeted selection of varieties suitable for mechanized harvesting, as well as assessing the degree of resistance of potato varieties to mechanized harvesting at early stages of selection and seed works.
1. Introduction
Currently, taking into account the trend of increasing the role of industrial potato growing technologies and the increased development of potato growing, it is possible to predict an acceleration of yield growth, which is impossible without the availability of high-quality seed material and the use of efficient agricultural machinery and equipment.
At the moment, more than 150 domestic potato varieties are represented in the Russian state register of breeding achievements [1,2,3].
It should be noted that a number of domestic varieties, in terms of the main economically valuable characteristics, are comparable to world-class achievements, and their potential capabilities provide yields of up to 35–40 t/ha. Such varieties, for example, are the early-ripening variety Udacha or the medium-early variety Nevsky, which are comparable to foreign analogs in terms of resistance to late blight.
At the same time, in the conditions of the modern market, there is an acute shortage of highly productive table potato varieties with increased quality characteristics, that are of varieties suitable for processing, as well as those that are precocious, and phytophthora- and nematode-resistant varieties, and the lack of development of conceptual principles for the modernization of technological and technical support for potato growing.
The increasing proportion of mechanical effects on tubers during cultivation, harvesting, and storage has determined the need to conduct breeding for increased endurance of potatoes to mechanical loads [4,5,6,7].
The instrument used for the sweet potato firmness test mainly included the Shenzhen Sansi DWD type electronic universal testing machine (Figure 1) [1].
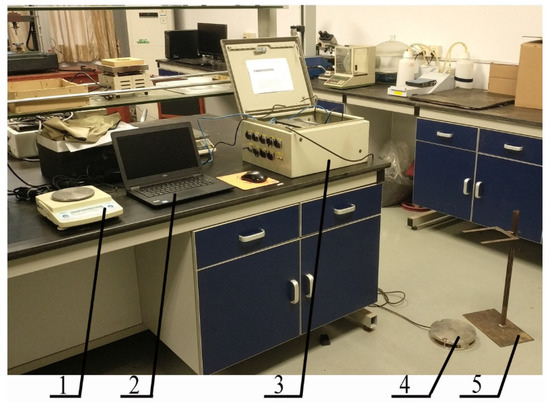
Figure 1.
Sweet potato drop impact test system: 1—Electronic balance; 2—Laptop; 3—Signal amplifier; 4—Impact force sensor platform; 5—Ruler frame.
Its rated load was 5 kN, accuracy grade was 0.5, displacement resolution was 0.01 mm, and loading rate was 0.01~500 mm/min. The load–displacement relationship can be automatically recorded by the computer by tracing points, and the coordinates and structural parameters of each point can be read out [6,8,9,10,11,12].
The instruments used in the sweet potato drop impact test are mainly self-built, like the sweet potato drop impact test system (Figure 1). To prevent the sweet potato falling impact from overturning (since the landing point is not in the center of the impact plane) three M 1011 impact sensors are placed and connected in a triangle with a combined measuring range of 2 kN and a sampling frequency of 15 kHz. Using an MX840B high-speed data acquisition instrument, the single sampling rate of each channel is up to 40 KS/s, with a low-level effective, 24-bit A/D converter.
Thus, to determine the location and register the greatest force effect of the device on the potato tubers, the FSBI FNAC VIM has developed an installation for assessing the force effect on potato tubers (Figure 2) [4].
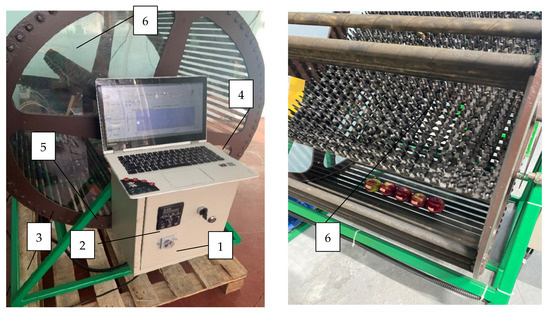
Figure 2.
General view of the laboratory installation to assess the force impact of the prototype device for assessing the suitability of varieties and hybrids for mechanized harvesting: 1—ground support; 2—control cabinet; 3—drum; 4—personal computer; 5—data logger; 6—finger-type slide.
The electronic potato software tool “Tuber Log” was used to register the force exerted by the working bodies of the laboratory installation on the studied biological samples presented by potato tubers.
The complex tool “Electronic Potato Tuber Log” (Figure 3) includes: a data logger 1, made with shape, size, and density following a standard potato tuber, a personal 2 or tablet computer 3, with installed software for processing recorded damage data of tubers and fruits.
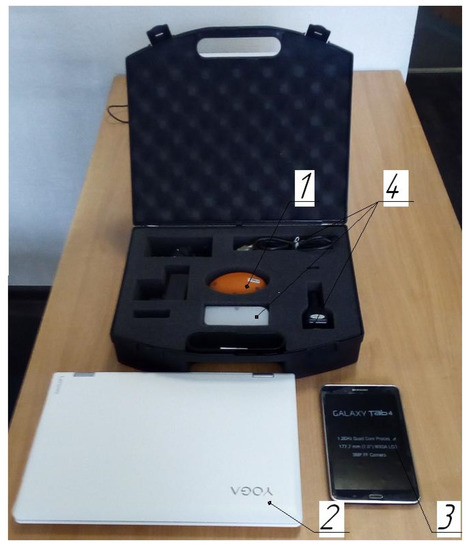
Figure 3.
General view of the software tool “Electronic Tuber Log”: 1—data logger; 2—personal computer; 3—tablet computer; 4—auxiliary devices.
The electronic potato “Tuber Log” allows recording of the magnitude of the acquired acceleration, as well as impact force from its interaction with the working elements of the laboratory installation [13,14].
The known methods for assessing the possibility of determining the resistance of potato tubers to damage are mostly aimed at subjective information, taking into account the influence of anthropogenic factors on the possibility of cultivating the variety understudy during its mechanized cultivation [15,16,17,18,19].
The diagnosis of potato tubers carried out in due time for the presence of manifestations of viral and pathogenic diseases can be provided using a combination of accelerated methods for assessing the various characteristics of the functional state of plants in field and laboratory conditions based on laser, optical, and spectral technologies [20,21,22,23].
Thus, the use of RAMAN and fluorimetric methods is a common way to learn about the quality of food production [2,24,25]. These methods of analysis provide a qualitative characteristic of the composition of complex organic substances in potatoes and allow you to track the dynamics of changes in their concentrations in potatoes, as well as monitor the differentiation of chemical composition depending on the variety [3].
The purpose of the study is to substantiate the concept of express assessment of potato tubers for mechanized harvesting using fluorimetric and RAMAN lidars, as well as to conduct a quantitative and qualitative assessment of damage to potato varieties, using a device that simulates the process of operation of the combine separator, depending on the type of machine and harvesting conditions, and to calibrate the lidar to assess the magnitude of the physical impact of the drum to assess the damage.
2. Materials and Methods
The method of conducting experimental studies on the registration of force effects was carried out on the device shown in Figure 2, followed by calibration of the fluorimetric and RAMAN scattering lidars by damage values, detailed below. Though the construction are experimental and new, they are inspired by existing computerized mechanisms [26,27,28,29,30].
The optimal values of the speed of rotation of the separating drum and the translational speed of the finger slide were set. Next, the drum drive of the device was switched on according to the assessment of the force effect from the control cabinet 2. With the steady-state mode of movement of the working surfaces of the device, according to the assessment of the force effect 1, electronic potatoes 2 and the studied batch of potato tubers of a certain variety corresponding to the conditions of research were supplied [4].
After passing the separating surface by the electronic potato 3, the control cabinet 2 was switched off, the studied factors were changed and the experiment was repeated following the chosen research plan. The measurement of the studied parameter, the force effect on the potato tuber, was carried out three times, after which the average values of mass measurements were used to evaluate the variation series.
At the same time, the concepts and elements generally accepted in variational statistics that characterize the variation series were used: the average variation—X, the standard deviation—σ, the coefficient of variation—v. Each of the main elements was determined by the well-known formulas of variation statistics. This made it possible to determine the accuracy of the experimental data and establish acceptable limits within which they are sufficiently reliable.
2.1. Equipment
The following methods were used for measurement and analysis:
- −
- Mechanical action was performed on potato tubers separately for three different varieties with identical operating modes from a device for assessing the suitability of potatoes for mechanized harvesting, with registration of the force action by the “Electronic Tuber Log” device;
- −
- Fluorescence spectra were recorded using the Fluorescence Spectrometer Lumina (GPI RAS, Russia) in three-fold repetition of each studied variety from a batch of damaged objects under various modes of damage to the tuber;
- −
- RAMAN spectra were collected and analyzed using a Senterra II confocal microscope (Bruker, Billerica, MA, USA) with a 785 nm laser source with 30 additions for the sample and a collection time of 25 s.
Therefore, to build models and diagrams of correlation–spectral dependencies, as well as the reflecting abilities of the surface and internal tissues of apple fruits and potato tubers with various macro-injuries, it is necessary to perform the image processing of the biological samples under study.
The analysis of processing spectral images includes several stages: image processing, segmentation, normalization of objects highlighted in the image, and recognition. The removal of information is the process of obtaining a visual image.
Recognition is the process of identifying objects. Interpretation reveals belonging to a group of recognized objects. Thus, image processing is multi-stage. In image processing tasks, the input data is an image. The output can be not only the processed image but also some of its characteristics, which is a histogram of images.
During the analysis and processing of images, not only the visible spectral range can be used, but also the ultraviolet and infrared ranges. For the correct choice of spectral ranges used in image analysis and processing, it is necessary to take into account the parameters and characteristics, as well as the class of the observed object in the image.
2.2. The Process of Selecting Spectral Ranges May Include the following Main Steps
- Determination of the survey scale and optical, spectral, and time parameters characterizing the object of study.
- Definition and selection of spectral ranges.
- Minimization of the number of working spectral ranges, as well as assessment of practical feasibility on a modern element base, taking into account technical and economic conditions.
Based on the above, the development of remote monitoring of plants based on multi- and hyperspectral sensors has become an important method for assessing their physiological state, disease damage, and the condition of potato tubers.
In laboratory conditions, it is advisable to conduct studies of the optical properties and spectral characteristics of potato tubers with the determination of significant differences in the intensity of the reflection spectra of different varieties: 420–470 nm and 860–980 nm with the allocation of clusters of identical images of varieties of the studied biological objects of potato tubers.
The test results were recorded in an observation log. We repeated the experiments four times when studying the influence of technological parameters of a roller sorting surface on the force impact of the sorting material.
Using the presented graphical relationships, we can determine a spot of the greatest force impact on the separating product output. The results are helpful in adjusting the constructive parameters of separating surfaces and optimizing the mode and technological parameters. For this purpose, after finding the corresponding spot along the length of the separating surface, we found it necessary to draw a straight line parallel to an axis of ordinates up to the crossing with a chart.
2.3. Schemes of Experiments, Laser Sources, and Spectrometers
To determine fluorescence spectra at different wavelengths, we used generation modes of tubers with and without mechanical damage, laser sources, and spectrometers presented in Table 1.

Table 1.
Schemes of experiments, laser sources, and spectrometers.
For recording the fluorescence spectra, use was made of a compact fluorimetric spectroscopy lidar system. Its schematic diagram is shown in Figure 4.
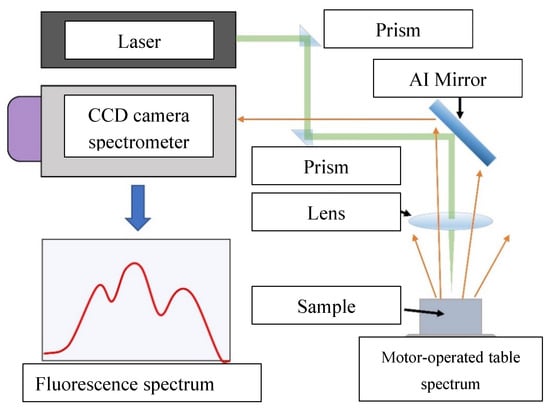
Figure 4.
Schematic diagram of experimental installation for recording fluorescence spectra based on the Raman lidar.
The lidar is based on a pulsed Nd: YLiF4 diode-pumped solid-state laser (Laser Compact, DTL-319QT: 527 nm, 5 ns, 1 kHz, 200 µJ/imp).
The principle of the experimental installation for recording fluorescence spectra based on the fluorimetric lidar is as follows:
A laser beam is directed to the studied object through two rotating prisms. The scattered radiation from the object is collected by a quartz lens and focused on the entrance slit of the spectrograph. The system of signal registration consists of a compact spectrograph (Spectra Physics, MS127i) equipped with a CCD camera with a strobable brightness amplifier (Andor iStar).
A low dispersion (400 lines/mm) diffraction grating and a 250 μm wide entrance slit were used to improve the signal-to-noise ratio. To prevent damaging the CCD matrix by scattered laser radiation, an OS-13 band-pass filter was used when recording signals.
As for the RAMAN lidar location and integration in the mechanism, it was based on the previously built-in fluorimetric lidar (Figure 5). RAMAN lidar was constructed using 785 nm RAMAN laser (Bruker, USA) and signal reception system including a dark box with sensors.
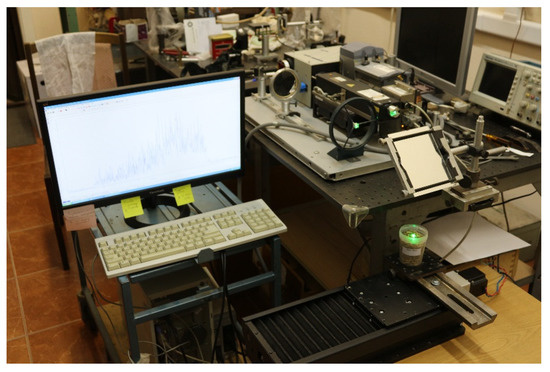
Figure 5.
General view of experimental installation used to register the fluorescence spectra based on the fluorimetric and RAMAN lidar system.
3. Results and Discussion
The technique of obtaining spectral images of lesions of biological objects represented by potato tubers includes several stages from the beginning of vegetation of the studied samples, including harvesting and storage processes, up to the exposure to the fluorimetric and RAMAN lidar system. The complete procedure is as follows:
The lidar was mounted on a tripod above the table, at a distance of 15–20 cm from the sample located on a white sheet of paper. The samples were illuminated by three halogen lamps, two of 500 W, and one of 700 W, as recommended by the camera instructions. The lidar was calibrated with a calibration panel before taking the images. Then the panel was removed from the frame when a series of images were taken.
Tuber cuts were used for the fluorimetric and RAMAN lidar images. Using a blade, we made transverse central cuts in the tubers to get two approximately equal lobes. One of them was used for making a cut as uniform in thickness as possible in its different parts. All cuts were between 2 and 3 cm thick. In cases where it was impossible to make a cross-section in the tuber core (defects detected only when the tuber was cut, such as those resulting from various infections), a longitudinal cut was made in the center of the tuber lobe obtained in the cross-sectional cut. For the studied variety, the cuts were made immediately before imaging. Image processing methods can be divided into two classes: spatial (those performed directly over the image matrix) and frequency. When images are fed into a computer, a continuous image is converted into a discrete form. Thus, only signal (image) values fixed at specific points can be used in further processing [6]. The obtained spectral images were processed with a window method, i.e., not all images were successively processed in one stage but only their certain parts or “windows”. After processing, their coordinates change according to specific algorithms on the initial image, and the image of the next window is processed similarly. Thus, it is possible to reduce memory consumption and processing time on the computer considerably. These actions must be performed at the first stage of preprocessing [8]. The monochrome 128 × 128 image was processed in the experimental program.
The technique of obtaining data on mechanical damage to tubers during the growing season and harvesting did not differ from that for a fluorimetric lidar: an object table was also used, a laser was placed above it, data were taken from slices of potato tubers of the same thickness.
We selected the areas of the tuber cuts based on the signal intensity analysis along different spectrum lines (the white background had almost the same intensity of reflection along all lines of the spectrum).
Three to five hyperspectral images of marketable and damaged potato tubers were taken for the study.
When obtaining spectral curves, the images were segmented, and the average values of spectral brightness of selected segments over several images were used.
Figure 6 shows a graphical display of the research results describing the force impact of a separating surface, represented by the rod drum simulating the operation of a rod elevator of the potato harvester.
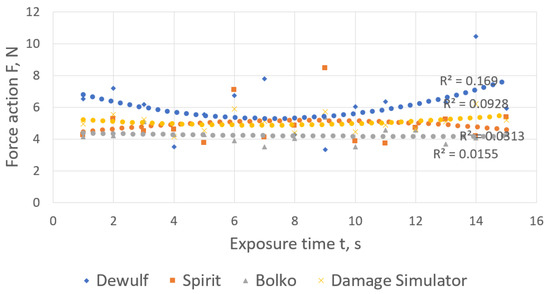
Figure 6.
Force action of the work surface of the pin hummock on potato tuber.
The analysis of the graphical relationships (Figure 6), obtained as a result of experimental tests of the prototype device for assessing the suitability of potato varieties and hybrids for mechanized harvesting reveals that the most significant force impacts (F = 20.3 N) on the potato tubers occur when they are descending from the finger-type slide on the working surface of the separating drum at a time interval of 9–11 s.
These results should be explained by the fact that during the movement of the data logger along the separating surfaces of the prototype device for assessing varieties and hybrids for mechanized harvesting, regardless of the progressive speed of the finger-type slide, there is a vertical lift of the conveyer belt made by the intensifier of separation. Its function is to provide additional torque to direct the tubers into the slot and increase the time of its interaction with the separating surface.
These facts increase the vertical component of the separation force between the working elements of the finger-type slide and the potato tubers, resulting in a higher force impact on the tubers and increased damage.
Analyzing the results of the experimental tests of the force impact on the potato tubers by working units of the prototype device for assessing the suitability of varieties and hybrids for mechanized harvesting, it is necessary to note that the measured value varies within a wide range depending on the location of the tubers on a functioning unit (coefficient of variation—ν = 26.9%, standard deviation—σ = 5.52).
The time interval of 8.5 to 9.5 s accounts for the highest force action (of up to 22 N) on the potato tuber (Figure 6), here the mean square deviation and the variation coefficient are σ = 5.7 and ν = 24.8%, respectively.
As a result of the variance analysis of the two-factor experiment, the main statistical characteristics of the experiment were obtained:
- −
- Variance of the experimental error, ;
- −
- Standard error 1.16;
- −
- Error variance, 1.36;
- −
- Dispersion of reproducibility, 16.33;
- −
- Dispersion of inadequacy, 1.368;
- −
- Tabular value of the tT- criterion, 4.02;
- −
- Value of the tabular t-criterion, 3.66;
- −
- Tabular value of the Fisher criterion at 5% significance level for the resulting equation, 5.32;
- −
- The calculated value of the Fisher criterion at the 5% significance level for the resulting equation, 2.2.
The highest force impact (up to 22 N) on the potato tubers occurs in the time interval from 8.5 to 9.5 s (Figure 6), with a standard deviation and coefficient of variation of σ = 5.7 and ν = 24.8%, respectively.
Thus, the comparative analysis of the force impact of separating surfaces on the potato tubers (Figure 6) reveals that working units more intensively affect commercial yield, ranging between 12 N and 14 N.
Spectral images of different lesion types detected on dirty potatoes of both varieties recorded the fluorescence spectra shown in Figure 7, Figure 8, Figure 9, Figure 10 and Figure 11.
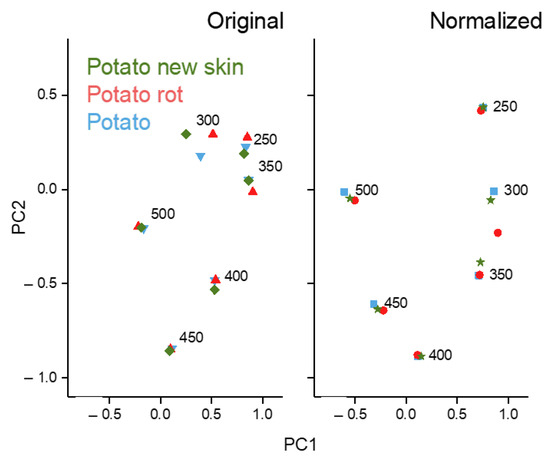
Figure 7.
Results of principal component analysis of original (left) and normalized (right) data for the surface of the Kumach, Udacha, and Zhukovsky variety (blue), during rotting (red), mechanical damage spot with new skin (green).
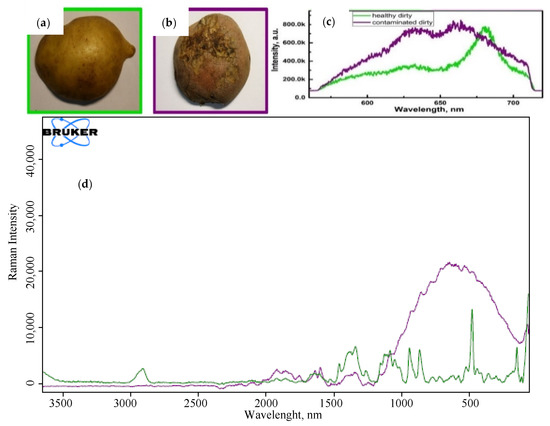
Figure 8.
Example of sampling points of the marketable (a) and sorted-out (b) potato tubers. Normalized (averaging five spectra) fluorescence and RAMAN (d) spectra of the marketable and sorted-out potato tubers of the Kumach, Udacha, and Zhukovsky varieties, respectively (c).
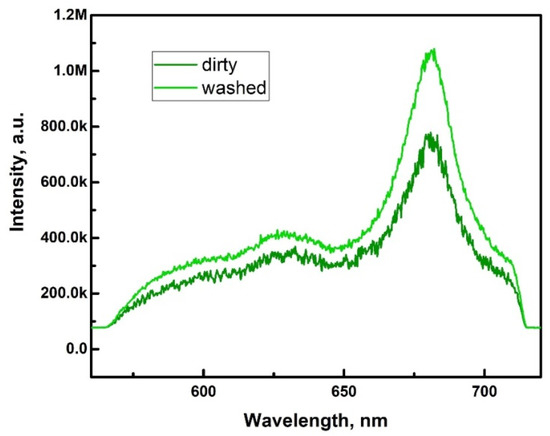
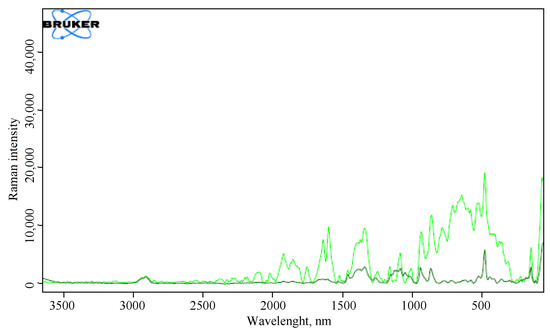
Figure 9.
Fluorescence spectra (image above) and RAMAN spectra (image below) for the dirty (dark green) and washed (light green) potato tubers of the Udacha variety.
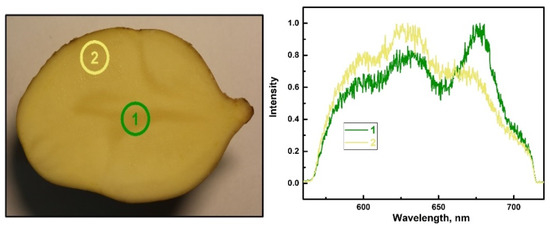
Figure 10.
Example of sampling points (left) and fluorescence spectra (right) of the central part (green) and the main volume (yellow) of the potato tuber of the Udacha variety.
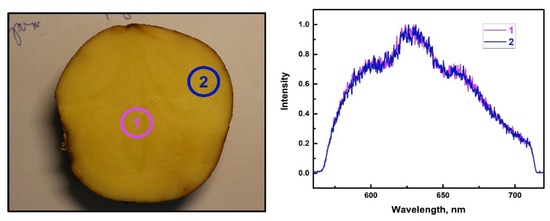
Figure 11.
Example of sampling points (left) and fluorescence spectra (right) of the central part (pink) and the main volume (blue) of the potato tuber of the Zhukovsky variety.
Spectral image processing includes several steps: image processing, segmentation, normalization of selected objects in the image, and recognition.
PCA application to the potato tubers results in visible differences only at 300 nm excitation (Figure 8). The normalization procedure increases the variance described by the first two components, PC1 and PC2, from 51.4% to 63.0%. However, this result does not coincide with the correlation analysis, where data normalization increased the correlation coefficients between the reference potato tubers and the mechanically damaged ones.
Spectral images of different lesion types of the dirty potato tubers of both varieties recorded the fluorescence spectra shown in Figure 8.
The spectrum from the entire surface of the potato tubers was averaged. The spectra are quite different from each other.
The potato tubers were then thoroughly washed of dust and soil residues without damaging the skin. The fluorescence spectra of the washed and dirty potato tubers were compared to assess the contribution of dust and soil to the overall spectrum (Figure 9).
The overall intensity is higher for the washed potato tubers both for fluorimetric and RAMAN spectra; the spectrum of the dirty sample is noisier in fluorescence but lower and weaker for RAMAN. However, the spectrum envelope is the same in both cases. This fact suggests that the contamination does not distort the spectrum, and the dirty potatoes can be analyzed directly in future field experiments. Samples of both potato varieties were cut in half to examine the internal parts of the potato tubers. Spectra were recorded in different regions of the potato cut for the marketable potato tubers. The normalized spectra for the area in the center of the potato tuber (clearly visible) and its main volume were compared in Figure 10.
The fluorescence spectra of the central part and the main volume are different for this sample. Similarly, the fluorescence spectra of the central part and the main volume of the sorted-out potato tuber of the Zhukovsky variety were examined (Figure 11).
Similarly, the fluorescence spectra of the central part and the main volume of the sorted-out potato tuber of the Zhukovsky variety were examined.
It turned out that the spectra were almost identical for this sample. As the sorted-out potato tubers had various types of lesions, we recorded the fluorescence spectra for each type of defect (Figure 12).
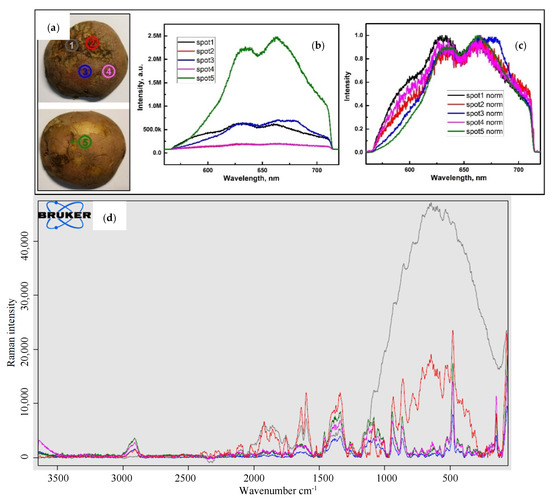
Figure 12.
Example of sampling points of the marketable (a) (left and above fluorescence spectra (image above-b,c) and RAMAN spectra (image below-d) of the different damaged parts (1-2—highly damaged, 3-4—thicker and thinner parts of the skin correspondently, 5—eyehole) of the potato tuber of the Zhukovsky variety.
Points 1 and 2 are from the rotting part of the skin. Point 3 corresponds to the thicker part of the skin, and point 4 to the thinner part. Point 5 corresponds to the eyehole of the potato tuber. The spectra are different for different defects.
To determine the rate of potato tuber lesions before storing with the instantaneous determination of the magnitude of the fluorescence spectra by the lidar when developing machines that perform sorting out of the potato tubers (Figure 13), a nomographic chart was obtained. It characterizes the relationship of the force impact exerted by the functioning units of potato harvesting and postharvest handling machines.
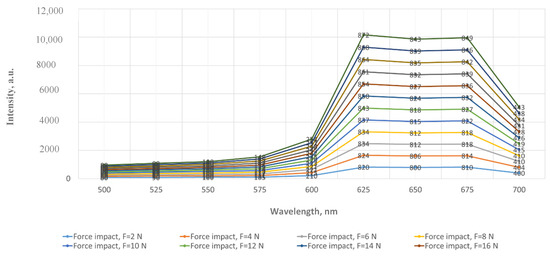
Figure 13.
Nomographic chart of fluorescence spectra of the damaged potato tubers at wavelengths of 600, 650, and 700 nm.
The calibration process of the lidar consists of developing an algorithm for synchronizing damage with fixing the force exerted by the electronic potato “Electronic Tuber Log” and recording the fluorescence spectra of the potato tuber sample under study.
The resulting nomographic chart indicates that the change in wavelength pumping intensity in the wavelength ranges from 600 to 750 nm corresponding to a damage value of 2 to 24 N, ranging from a minimum of 80 (at the full damage range of 2 to 24 maximum) to a maximum pumping intensity of 443, corresponds to a fluorescence spectrum with a clear separation of their boundaries.
The maximum interval of the difference in fluorescence spectra intensity is observed in the wavelength ranges between 625 and 700 nm, with a clear conditional separation of the force impact from 2 to 24 N. Thus, it is necessary to notice that only the potato tubers at the maximum force impact up to 12 N are suitable for stable storage after harvesting and postharvest handling. A further increase in mechanical effect in the studied range excludes any possibility of storing such potato tubers as the damaged tubers provoke the growth of various pathogens, including their spread on marketable ones. The maximum value of 872 units of fluorescence spectrum intensity in the wavelength range of 625–700 nm was observed under the force impact of 24 N, followed by a reduction in spectrum intensity in the average value of 2.5% for each interval of the lesion range within the whole wavelength spectrum, with the minimum value of spectrum intensity of 800 units, corresponding to the wavelength of 700 nm and the force impact of 2 N.
Research results by D.P. Blight and A. J. Hamilton [31] indicates that the susceptibility of potato tubers to mechanical damage of tubers, as measured by the criterion of skin hardness, determined by a penetrometer, is not a satisfactory alternative to the damage index for determining the ratio of susceptibility to mechanical damage of tubers of different varieties. Many exceptions to the general trend of an inverse correlation between skin hardness and damage within have not been observed. The ratio of surface-hardness-to-hardness at a depth of 2 mm provides only a very rough guide to cultivar susceptibility to damage, and therefore this method of assessing damage to potato tubers is unsatisfactory; in this regard, the use of the above method for rapid assessment of damage to potato tubers before storage is promising for further expansion of research in terms of determining the correlation between damage and spectra of other potato varieties.
Rios-Cabrera et al. managed to extract potato properties by means of image processing. Their goal was to find out the quality and to evaluate the physical properties of potatoes using artificial neural networks i.e., ANNs, a method which was named blurred ARTMAP because of its stability and convergence speed outperformed the other models. They suggested a few algorithms to determine potato defects like greening, scabs and cracks, which could be efficiently used to grade potatoes of different qualities [32].
Hassankhani R et al. [33] performed the recognition of crack defects and rhizoctoniosis based on the recognition that the total precision of potato sorting was 97.67% by tuber skin color using machine vision (lighting chamber, lighting source, CCD camera, personal computer), however, this method is unsuitable at the stages of laying potatoes for storage, since the change in color occurs 3–5 days after the damage and the laying of the damaged tubers for storage leads to the processes of their decay in storage and the processes of infection of healthy tubers. Therefore, the identification of damaged potato tubers before storing them, as a result of an express assessment of the condition of tubers using the developed method, using a device in the form of a Raman lidar, makes it possible to use this method as a promising method for assessing damage to tubers during postharvest processing.
4. Conclusions
The results of the conducted research allow us to conclude the following:
- −
- The most gentle force impact of separating surfaces on the data recorder is at the circumferential speed of the roller conveyer belt VEL = 1.4 m/s, where throughout the technological process of influence, the minimal force impact on the separated products is observed. It is in the range of 3 N to 6.5 N, which is 28–31% of the maximum force impact of the working units of harvesters at speeds of 1.8 and 2.2 m/s;
- −
- The technique for obtaining and processing spectral images of different lesion types of the three potato varieties of Zhukovsky, Udacha, and Kumach from the Lorch Federal Potato Research Center (Moscow) collection was developed;
- −
- To record fluorescence spectra, a pulsed Nd: YLiF4 diode-pumped solid-state laser (Laser Compact, DTL-319QT: 527 nm, 5 ns, 1 kHz, 200 µJ/imp) was developed and presented;
- −
- Spectral and hyper-raster signs of potato tissue lesions were determined. They are specific to remote optical monitoring methods with separation of the tuber cuts based on the analysis of signal intensity along different spectrum lines (the white background had almost the same intensity of reflection along all spectrum lines);
- −
- The change in the wavelength pumping intensity in the wavelength range from 600 to 750 nm, corresponding to a damage value of 2 to 24 N ranging from a minimum of 80 (at the full damage range of 2 to 24 maximum) to a maximum of pumping intensity of 443, corresponds to a fluorescence spectrum with a clear separation of their boundaries.
Thus, the express diagnostic method using the RAMAN lidar at the stages of postharvest handling of potato tubers, to sort out the damaged tubers before storing, excludes infectious diseases that can cause functional disorders in the potato tubers, externally manifested, most often, by darkening or brown discoloration of tissues.
Therefore, the use of lidar can assess damage to potato tubers during storage with the determination of damaged volumes of tubers not suitable for storage, applied when harvesting different varieties of potato tubers by working bodies after appropriate calibration of the lidar in the complex of laboratory research, with a device for evaluating the suitability of varieties and hybrids for mechanized harvesting.
The results of the studies carried out make it possible to ensure the use of RAMAN lidar at the stages of postharvest processing of potato tubers, before storing them in order to exclude the processes of decay of damaged potato tubers as a result of an express assessment of the state of tubers according to the developed method and according to the results obtained. The introduction into the production of which, requires further research in terms of expanding the database of damaged potato varieties and their reflection spectra.
Author Contributions
Conceptualization, Y.L., A.D. and A.A.; methodology, A.S. and M.G.; software, N.S. and M.M. (Maxim Moskovskiy); validation, A.D.; investigation, A.A.; resources, M.G.; writing—original draft preparation, N.S. and M.M. (Maxim Mosyakov); writing—review and editing, A.S.; project administration, A.A.; funding acquisition, A.D. All authors have read and agreed to the published version of the manuscript.
Funding
This work was supported by a grant from the Ministry of Science and Higher Education of the Russian Federation for large scientific projects in priority areas of scientific and technological development (grant number 075-15-2020-774).
Institutional Review Board Statement
Not applicable.
Informed Consent Statement
Not applicable.
Data Availability Statement
The raw data supporting the conclusions of this article will be made available by the authors, without undue reservation.
Acknowledgments
Under the proposed basic scheme, the developed device’s calibration to modern potato harvesters will make it possible to carry out the directed selection of varieties suitable for mechanized cultivation. It will assess the resistance of potato varieties to mechanized harvesting at the early stages of breeding and seed production and in mass production to determine the periods of mechanized harvesting of potatoes that exclude significant mass losses of tubers during storage. So we have developed the method of processing spectral images of different lesion types of potato tubers. The method is helpful for the determination of essential differences in intensity of reflectance spectra of different varieties: 420–570 and 860–980 nm and separation of the clusters of identical images of the studied potato varieties.
Conflicts of Interest
The authors declare that they have no known competing financial interests or personal relationships that could have appeared to influence the work reported in this paper.
References
- Bao, G.; Wang, G.; Wang, B.; Hu, L.; Xu, X.; Shen, H.; Ji, L. Study on the drop impact characteristics and impact damage mechanism of sweet potato tubers during harvest. PLoS ONE 2021, 16, e0255856. [Google Scholar] [CrossRef] [PubMed]
- Mazurek, S.; Szostak, R.; Kita, A. Application of infrared reflection and Raman spectroscopy for quantitative determination of fat in potato chips. J. Mol. Struct. 2016, 1126, 213–218. [Google Scholar] [CrossRef]
- Morey, R.; Ermolenkov, A.; Payne, W.Z.; Scheuring, D.C.; Koym, J.W.; Vales, M.I.; Kurouski, D. Non-invasive identification of potato varieties and prediction of the origin of tuber cultivation using spatially offset Raman spectroscopy. Anal. Bioanal. Chem. 2020, 412, 4585–4594. [Google Scholar] [CrossRef] [PubMed]
- Dorokhov, A.; Ponomarev, A.; Zernov, V.; Petukhov, S.; Aksenov, A.; Sibirev, A.; Sazonov, N.; Godyaeva, M. The Results of Laboratory Studies of the Device for Evaluation of Suitability of Potato Tubers for Mechanized Harvesting. Appl. Sci. 2022, 12, 2171. [Google Scholar] [CrossRef]
- Azizi, P.; Dehkordi, N.S.; Farhadi, R. Design, construction and evaluation of potato digger with a rotary blade. Cercet. Agron. Mold. 2014, 47, 5–13. [Google Scholar] [CrossRef][Green Version]
- Abd, E.; Magda, M. Development and performance evaluation of a simple grading machine suitable for onion sets. Soil. Sci. Agric. Eng. Mansoura Univ. 2014, 2, 213–226. [Google Scholar] [CrossRef]
- Byshov, N.V.; Borychev, S.N.; Yakutin, N.N.; Kalmykov, D.V.; Simonova, N.V. On the interaction of the tuberous layer with the digger’s working organs. Bull. Ryazan State Agrotechnol. Univ. P.A. Kostycheva 2018, 40, 161–167. [Google Scholar]
- Byshov, N.V.; Yakutin, N.N.; Koveshnikov, R.Y.; Rodionov, V.V.; Serzhantov, N.V.; Smirnov, P.S. Modernization of the KST-1.4 digger. Bull. Ryazan State Agrotechnol. Univ. P.A. Kostycheva 2016, 30, 75–78. [Google Scholar]
- Bachche, S.; Oka, K. Design, Modeling and Performance Testing of End-Effector for Sweet Pepper Harvesting Robot Hand. J. Robot. Mechatron. 2013, 25, 705–717. [Google Scholar] [CrossRef]
- Akdemir, B.; Ulger, P.; Arin, S. Mechanized panting and harvesting of onion. Agric. Mech. Asia 1993, 24, 23–26. [Google Scholar]
- Pasaman, B.; Zakharchuk, V. The determination of the parameters of a ploughshare-rotor potato digger. Econtechmod. Int. Q. J. 2012, 1, 43–47. [Google Scholar]
- Vinevsky, E.I.; Trubilin, E.I.; Vinevskaya, N.N.; Poyarkov, I.B. Machine for Harvesting Root Crops. Patent of the Russian Federation No. 2467548, 27 November 2012. [Google Scholar]
- Protasov, A.A.; Shardina, G.E.; Egorov, R.Y. Combined Unit for Harvesting Turnips. Patent of the Russian Federation No. 88501, 20 November 2009. [Google Scholar]
- Tikhonov, N.I.; Kiryakov, A.V.; MFMoichkin VRodionov, V.; Didenko, A.V.; Sukhinin, V.G.; Stradomsky, S.E. Device for Harvesting Onions and Root Crops. Patent of the Russian Federation No. 2084107, 6 May 1979. [Google Scholar]
- Shanmugam, C.J.; Senthilkumar, G. Indigenous development of low-cost harvesting machine. ARPN J. Eng. Appl. Sci. 2017, 12, 4489–4490. [Google Scholar]
- Cubero, S.; Aleiksos, N.; Molto, E.; Gomez-Sanchis, J.; Blasco, J. Erratum to: Advances in machine vision applications for automatic inspection and quality evaluation of fruits and vegetables. Food Bioprocess Technol. 2011, 4, 829–830. [Google Scholar] [CrossRef][Green Version]
- Dai, F.; Guo, X.H.; Zhao, W.Y.; Xin, S.L.; Liu, X.L.; Wu, Z.W. Design and experiment of canvas belt combined operation machine for potato digging and plastic film collecting. Trans. CSAM 2018, 49, 104–113. [Google Scholar]
- Devsh, K.; Ashok, T. Performance evaluation of tractor drawn potato digger cum-elevator. Int. J. Agric. Sci. Res. 2017, 7, 433–448. [Google Scholar]
- Li, Z.; Li, P.; Yang, H.; Wang, Y. Stability tests of two-finger tomato grasping for harvesting robots. Biosyst. Eng. 2013, 116, 163–170. [Google Scholar] [CrossRef]
- Koga, N.; Kajiyama, T.; Senda, K.; Iketani, S.; Tamiya, S.; Tsuda, S. Energy efficiency of potato production practices for bioethanol feedstock in northern Japan. Eur. J. Agron. 2013, 44, 1–8. [Google Scholar] [CrossRef]
- Kang, W.Q.; Fan, M.S.; Ma, Z.; Shi, X.H.; Zheng, H.L. Luxury absorption of potassium by potato plants. Am. J. Potato Res. 2014, 91, 573–578. [Google Scholar] [CrossRef]
- Kalinin, A.B.; Smelik, V.A.; Teplinsky, I.Z.; Pervukhina, O.N. Selection and substantiation of the parameters of the ecological state of the agroecosystem for monitoring technological processes of cultivation of agricultural crops. Bull. St. Petersburg State Agrar. Univ. 2015, 39, 315–319. [Google Scholar]
- Indraja, D.; Ajkhilesh, J.; Vishal, P.; Amarsingh, P.; Ashutosh, D. A review paper based on design and development of an onion harvesting machine. J. Inf. Comput. Sci. 2019, 9, 333–337. [Google Scholar]
- Massah, J.; Lotf, A.; Arabhosseini, A. Effect of blade angle and speed of onion harvester on mechanical damage of onion bulbs. Agric. Mech. Asia Afr. Lat. Am. 2012, 43, 60–63. [Google Scholar]
- Mohamed, K.; Al-Gaadi, A.K.; Abdalhaleem, A.H.; ElKamil, E.T.; Khalid, A.M.; Ahme, A.M. Impact of soil compaction on the engineering properties of potato tubers. Int. J. Agric. Biol. Eng. 2020, 13, 163–167. [Google Scholar]
- Asghar, M.T.; Ghafoor, A.; Munir, A.; Iqbal, M.; Ahmad, M. Design modification and field testing of groundnut digger. Asian J. Sci. Technol. 2014, 5, 389–394. [Google Scholar]
- Nesterovich, E.O.; Byshov, N.V.; Kostenko, M.Y.; Murog, I.A.; Nefedov, B.A. Investigation of the traction resistance of a ploughshare with a variable angle of inclination. Bull. Ryazan State Agrotechnol. Univ. P.A. Kostycheva 2018, 37, 84–89. [Google Scholar]
- Zhou, L.; Chalana, V.; Kim, Y. PC-based machine vision system for real-time computer-aided potato inspection. Int. J. Imag. Syst. Technol. 1998, 9, 423–433. [Google Scholar] [CrossRef]
- Heinemann, P.H.; Pathare, N.P.; Morrow, C.T. An automated inspection station for machine-vision grading of potatoes. Mach Vis. Appl. 1996, 13, 14–19. [Google Scholar] [CrossRef]
- Golmohammadi, A.; Bejaei, F.; Behfar, H. Design, development and evaluation of an online potato sorting system using machine vision. Int. J. Agric. Crop. Sci. 2013, 6, 396–402. [Google Scholar]
- Blight, D.P.; Hamilton, A.I. Variental susieptiblity to damage in potatoes. Rot. Res. 1974, 17, 269–270. [Google Scholar]
- Rios-Cabrera, R.; Lopez-Juarez, I.; Sheng-Jen, H. ANN analysis in a vision approach for potato inspection. J. Appl. Res. Technol. 2008, 6, 106–119. [Google Scholar] [CrossRef]
- Hassankhani, R.; Navid, H.; Seyedarabi, H. Potato surface defect detection in machine vision system. Afr. J. Agric. Res. 2012, 7, 844–850. [Google Scholar] [CrossRef]
Publisher’s Note: MDPI stays neutral with regard to jurisdictional claims in published maps and institutional affiliations. |
© 2022 by the authors. Licensee MDPI, Basel, Switzerland. This article is an open access article distributed under the terms and conditions of the Creative Commons Attribution (CC BY) license (https://creativecommons.org/licenses/by/4.0/).