Abstract
The transition to a carbon-reduced future for one of the most energy-intensive actors, the building sector, requires the development of appropriate tools and methods. One such approach is local energy communities (LECs), especially thermal LECs (TLECs), which provide a promising vector towards that transition. LECs exploit energy users as key actors in the energy production process. However, their formation, creation, and continuation are still an ongoing endeavor. Many research efforts focus on creating and continuing LECs in an economic, legal, and incentivized manner, sparsely addressing the formation process. In this Part A, a collective tool for decision-making for potential TLECs is presented. The current study proposes a unified approach to classify the prosumers of energy (consumers who both produce and consume energy) using conventional methodologies (RenewIslands, Kaya Identity). A case study is presented in a fully operating LEC in Kimmeria, Greece, in which both the traditional methods of classifying users are applied as well as the proposed methodology, in comparison. The results indicate a significant improvement to the conventional solutions, which tend to overestimate the needed equipment, leading to extensive installation and operational costs.
1. Introduction
The building sector accounts for almost 40% of the world’s energy consumption [1,2]. Thermal energy exploits 75% of that consumption, acting as the most dominant vector of energy consumption worldwide [3]. One significant aspect of the sector is the creation of local coalitions of energy that aim to reduce their carbon footprint [4]. Local energy communities (LECs), as they are described, gained legal and technological grounds in the last 10 years due to the part energy consumers play in the transition of the energy map [1,5,6]. However, the creation and operation of thermal LECs (TLECs) raise infrastructural and economic issues mainly because of the lack of regulatory framework, funding schemes, and proper tools for planning, creating, and maintaining LECs [7,8,9,10,11,12].
The consumers of such communities play an intricate part in the synthesis problem as they can both produce and consume renewable energy at different rates depending on the available equipment and their level of energy demand [13,14]. Therefore, incentives and research for suitable tariff regimes and energy management should be of utmost importance in order to accelerate prosumers’ penetration to the market [15]. Their consumption and production profiles define the synthesis of the complex thermal energy production layouts and act as the bedrock of the superstructure, which is the final layout of the system [8,16]. To successfully create prosumer-centered solutions for energy systems, parameters such as consumption profiles, prosumers with similar schedules and behaviors, and social aspects of behavior change towards energy consumption need to be considered.
Caballero V. et al. designed a heuristic algorithm which grouped prosumers with similar interests, locality, and consumption patterns and placed them into clusters. The results suggest that load rescheduling could make feasible a more decentralized community that is less dependent on the main grid [17]. The importance of prosumers’ energy behavior and profiling was also investigated by Howind S. et al. In their work, they assessed the demand-side management of energy communities and its impact on the energy balance with different mixtures of prosumer profiles. Their study concluded that shifting the loads to several prosumers might offer a viable solution, but it undermined the global optimum choice due to the absence of appropriate classes for prosumers with similar profiles [18]. Almeida V. et al., in a novel study, identified the inherit flaw of abstract load shifting without taking into account the prosumers’ individual needs. Their multiobjective optimization algorithm aimed to minimize the cost and the discomfort of the prosumers under flexible load shifting to increase RES penetration [19]. The main issue with the approaches in the available literature appears to be the segmentation and classification of the prosumers in TLECs, which will provide significant computational and energy management insight.
Additionally, the energy systems that provide energy are undergoing a significant transition as more renewable-based systems contribute to their synthesis [20]. Therefore, much effort is put into the optimum synthesis of such systems in order for them to meet demand despite the intermittent nature and availability of renewable energy resources [16]. The available tools for designing such systems are categorized either as heuristic-based approaches or optimization-based [16]. The heuristic approaches depend on the expertise of the system’s designer to find a working solution and refer to simulations to determine the validity of the selection [21,22,23,24]. On the other hand, optimization approaches are well-established as they propose several layouts for the same system, providing a repetitive loop of checking and verifying the optimum solution [25,26,27,28]. However, the optimum solution might be overlooked in complex systems mainly because of the plethora of semioptimum choices [16].
A pending issue and a substantial research gap on the synthesis problem is still the homogenization and classification of prosumers into discrete groups which define the whole community’s profile [29,30]. By accurately classifying the prosumers of an LEC, design flaws such as over- or underdimensioning of the energy production and delivery system can be avoided. Additionally, the economic impact of the accurate dimensioning of such systems can significantly reduce initial investment costs as well as viability indexes. In order to structure the approach of the synthesis problem, the current study combines a qualitative approach (RenewIslands methodology) along with a quantitative one (Kaya Identity methodology) for addressing the classification issue of the prosumers involved in the TLEC [31,32]. The proposed methodology unifies the qualitative and quantitative approaches by heuristically identifying the energy class of the prosumers and then by computationally classifying the result.
The work presented here is the subpart of a three-layer approach which targets the completion of a TLEC synthesis by incorporating (i) energy prosumer classification (load dispatch to the next layer—first layer), (ii) superstructure synthesis infrastructure approach (equipment to meet the load of the energy profiles—second layer), and (iii) the technoeconomic evaluation of the proposed solution (feedback loop with—second layer and third layer). The second and third layers are under investigation by the research team and will be presented in a later work.
2. Materials and Methods
This section presents a hybrid methodology for classifying prosumers in a local energy community. The methodology consists of a qualitative (RenewIslands) and a quantitative (Kaya Identity) part whose aim is to classify the local energy community’s thermal energy demands as “Low”, “Medium”, or “High”. The process followed is structured analytically, exploiting a k-means clustering algorithm and fuzzy triangular sets to transcend from qualitative to quantitative. The proposed mathematical model is presented graphically in Figure 1, Section 2.2.
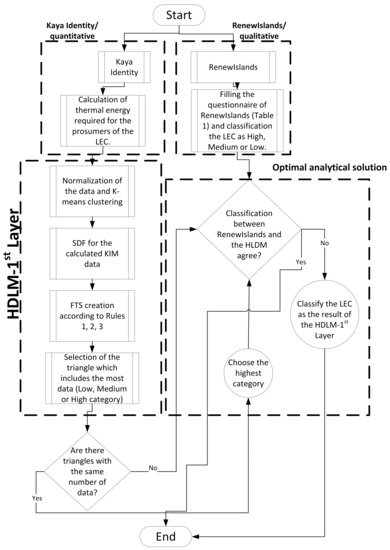
Figure 1.
Logic diagram representing the proposed methodology (HDLM).
2.1. Current Methodologies
2.1.1. Kaya Identity Methodology
For the configuration of the energy profile of the users, Kaya Identity Methodology (KIM) was used [32]. The total annual thermal energy consumption is considered, not the thermal loads approach [33]. The main target of the 1st layer is to classify the set of potential prosumer vectors into one of the three categories of energy consumption profiles (“High”, “Medium”, and “Low”) [34]. These represent high, medium, and low energy consumption per m2 of habitable area. The scale of high, medium, ad low is a qualitative measure and may differ depending on the location and size of the system.
The total annual thermal energy demand for each user is calculated by the Kaya Identity methodology (Equation (1)), which is widely used for CO2 emission allocation to end-users, according to their energy intensity.
where h is the number of households, p/h is the persons per household, A/p is the area for every person in the household, and E/A is the thermal energy consumption per m2 of the household. The factor E/A can also be found in the literature as specific thermal energy consumption (Espec—kWhth/m2).
2.1.2. RenewIslands Methodology
RenewIslands methodology is a qualitative approach used for designing complex, island-mode energy production systems [34]. The main advantage of the method is the significant reduction of choices it provides, as it exploits a basic questionnaire to identify the possible primary energy sources and thus eliminating all not feasible options (Table 1). This limits the possible equipment to be used and thus reducing the complexity of the design phase. The main disadvantage, however, is the heuristic nature of the approach. The user must possess previous engineering experience with the sizing and structure of the equipment, making it unsuitable for a wide variety of users of the tool.

Table 1.
Typical RenewIslands questionnaire.
2.2. Proposed Methodology—Hierarchically-Dependent Layering Methodology (HDLM)
The proposed mathematical model exploits the KIM and the RenewIslands methodologies in order to classify the prosumers of the TLEC as of “Low”, “Medium”, or “High” energy intensity. It uses a hybrid approach of the two methods and further integrates mathematical tools such as clustering algorithms, fuzzy logic, and distribution fitting approaches. In the following sections, the k-means clustering, fuzzy triangular sets (FTS) and statistical distribution fitting (SDF) approaches, which transport the qualitative measures of RenewIslands to the quantitative measures of KIM, will be presented.
2.2.1. Classification of the Dataset—K-Means Clustering
In order to proceed with the classification of the users, k-means clustering was introduced [35,36]. The algorithm divides the set of produced data into k number of clusters. Then, it assigns the data into the cluster with the nearest mean value. The clusters contain the calculations using KIM for every prosumer of the TLEC. These clusters are defined by centroids which are the mean Euclidean distances of the dataset, squared. The option of Euclidean distances is computationally intensive, and thus it is not selected [36,37].
2.2.2. Optimal Number of Clusters—“Elbow” Point
To classify the dataset into clusters, the algorithm requires a predefined number of clusters. The optimum number of clusters may differ based on the diversity (standard deviation) of the given dataset, and thus the need for an optimization step precedes the basic k-means algorithm. The repetitive process for optimizing the number of clusters attempts several cluster scenarios: k = 1:n where n is the number of data points in the dataset [38].
The optimal number of clusters is identified at the curve’s “elbow” point, which has (x,y) coordinates. x is the number of clusters while y is the number of data points in each cluster (KIM calculated user’s kWhth/annually). Therefore, the elbow point represents the point where the maximum amount of highly correlated data are assigned to a minimum number of clusters. In the case of the dataset having fewer clusters, the result may be unfavorable for the classification of the potential prosumer vectors due to high diversity inside the cluster, while in the case of more clusters, there will be no exploitable result due to the number of clusters to number-of-data-points ratio [38,39].
2.2.3. Normalization of the Dataset
After identifying the optimal number of clusters for the given dataset, the data are normalized. The normalization step aims to unify the approach of the 1st layer so it will be exploitable for case studies with significantly different data. The normalization method used was “studentized residual”, which in statistics is the process of dividing the residual of a sample by a sample of the standard deviation, and the equation used is given in Equation (2) [39].
where is the ith residual, is the standard deviation for the sample, is the random sample of the data, and is the mean value.
2.2.4. K-Means Clustering
The normalization of the data is then followed by the application of k-means clustering methodology. If S is assumed as the dataset (S = {x1, x2, …, xn}) to be clustered, the objective function of k-means will be:
2.2.5. Statistical Distribution Fitting (SDF)
The data calculated (KIM calculation for all the community users) are represented by a statistical distribution. Identifying that distribution will aid the specification of the equations that define sample S. By stochastically defining the distribution and the equations, the upper and lower limits and the center of mass of the sample S can be calculated [39]. The moments (1st, 2nd, and 3rd degree) will provide insight into the characteristics and the dispersion of the data. First, the kth moment of the solution should be calculated as in [40,41,42].
where εi is the centered Gaussian random variable. If the kth moment is calculated, the solution describes the distribution type of the dataset (Gaussian, log-normal, normal, etc.) [43].
The distribution identification leads to the next step, dividing the sample into discrete zones of the low, medium, high values. The division will assign mathematically defined qualitative values originating from the quantitative data of sample S. In order to divide the sample, the normalized values are assessed through:
Equations (5)–(7) will set the limits of the highest and lowest values as well as the dispersion of the values near the center of mass of the distribution [42].
2.2.6. Fuzzy Triangular Sets (FTSs)
The results of Equations (5)–(7) have divided the normalized sample S into zones. To identify the qualitative expression, low, medium, or high, these equations will be represented by a fuzzified set of triangles. This step will determine the final characterization of the community as low, medium, or high. A triangular membership function is constructed and acts as the transportation medium between the normalized data and the 3 fuzzy triangles [43]. The fuzzy rules base was developed as follows: assuming A1, A2, and A3 are the three fuzzy triangular sets, the rules for assigning each normalized datapoint are:
R(1): IF xS ∈ {Eq. 5} THEN assign to A1 (Low),
R(2): IF xS ∈ {Eq. 6} THEN assign to A2 (Medium),
R(3): IF xS ∈ {Eq. 7} THEN assign to A3 (High),
The case of a xs belonging to more than one fuzzy triangular set is calculated through Equation (9):
where is the derivative state of the dynamic datapoints, µq1 and µq2 are the membership functions, and q is all the different realizations for the dataset (when x ∈ An). Equation (9) is also referred to as a defuzzification formula. In general, a 25% overlay between the triangular sets is acceptable as the complexity of the problem remains low [43]. The use of fuzzy triangular sets along with the distribution fitting are employed in order to quantify the qualitative data from the Kaya Identity methodology and to classify the quadrant as “Low energy intensity”, “Medium energy intensity”, or “High energy intensity”.
A decision tree representing the proposed mathematical model (HDLM-1st Layer) along with the hybrid approach of KIM and RenewIslands is depicted in Figure 1. The presented algorithm starts by calculating the KIM equation for each household of the case study (Equation (1)) and by completing the RenewIslands questionnaire for the case (Table 1). After completing the questionnaire, a first classification for the community is available. The algorithm normalizes the KIM-equation-calculated values and applies k-means clustering to the normalized data. The SDF approach follows, determining the center of gravity of the data and the design of the FTSs. The fuzzy triangles include all the data calculated with KIM, and typically one triangle includes more data than the others. In that case, the triangle category is chosen as the deterministic class for the TLEC and is then compared with the result of the RenewIsland class. If they agree, the class of the TLEC is the occurring class; if they do not, the class of the HDLM-1st layer approach is chosen as a more complete and deterministic result. If, however, more than one triangle shares the number of data points equally, then the classification of the HDLM-1st layer approach chooses the highest category (e.g., if the “Medium” and “High” triangles have equal amounts of data, choose the “High” category).
3. Case Study
The case study presented in this paper consists of eight buildings which serve as student dormitories. They are located in northeastern Greece, near the city of Xanthi (41◦10j N 24◦55j E). The buildings are constructed with a concrete bearing body and brick walls and are poorly insulated (estimated average U = 1 W/m2K) [44]. The glazing consists of aluminum double-glazed windows with poor air tightness (estimated average Uw > 4 W/m2K) and the roof is concrete covered with tiles and inclined. The average number of consumers per building is 74 and the mean value of a building’s area is 1419.46 m2 [44].
3.1. Thermal Characteristics
According to a study from the Hellenic Statistical Authority, the thermal zone of Xanthi is described as a relatively cold climate with 180 degree days of heating (thermal Zone C—ZC) and a maximum specific thermal energy consumption of 245 kWhth/m2 [45]. However, according to the thermal load analysis of the buildings, their specific thermal energy consumption is given in Table 2. The buildings are identical in pairs of two besides their differences in shading factors, residents’ activity, and thermal load. However, to test the HDLM’s applicability, those characteristics were not considered, and the final building mixture consists of four pairs of two identical buildings [44].
Table 2.
Case study’s building characteristics and the Eresid. calculated with KIM Equation (1).
3.2. KIM Application on Kimmeria’s LEC
Some assumptions were made regarding the available data to implement the KIM in the case study. The buildings’ area is reduced by 25%, as in every building, 1/4 of the total area is the machinery room. The KIM only considers the useful heated area of the buildings under study. Additionally, because the methodology must be extrapolated to the concept of LECs, the number of households (h) in the formula is set to 1 and the number of residents (p) in each building is considered as persons per household. The total of eight buildings comprises the LEC and Table 2 presents the results of KIM per building.
The optimum number of clusters, as shown in Figure 2, for the case study is 2. The x-axis in Figure 2 represents the number of clusters, while the y-axis is the total number of buildings per cluster (their annual thermal energy consumption is calculated with Equation (1)). In Figure 3, k-means clustering was implemented for the case study for two clusters and the following conclusions can be drawn: (i) the two clusters contain all the data (because the buildings are identical in pairs of two, only four data points appear on the diagram); (ii) buildings B1 and D1 are almost twice the size and thermal energy demand of the other buildings and so appear at the top left of the diagram in the area of the highest energy consumption; (iii) the rest of the buildings form a single cluster which is characterized by lower energy consumption dispersed in a broader range of m2. However, the community cannot be characterized as either energy-intensive or energy-conserving because of that dispersion.
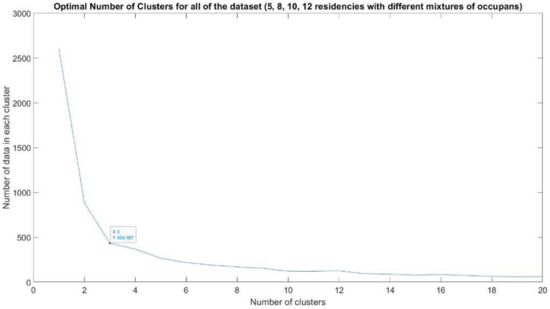
Figure 2.
Optimal number of clusters for the data of Table 2 for the case of students’ residences in Kimmeria, Xanthi.
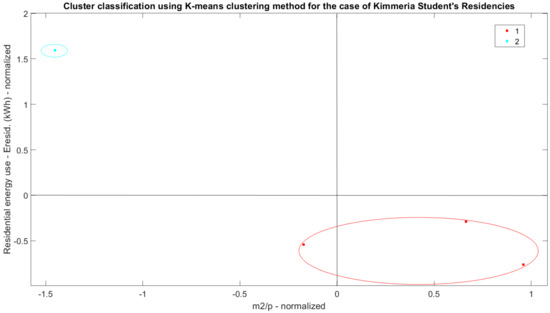
Figure 3.
Cluster classification using k-means clustering methodology for the case of students’ residences in Kimmeria, Xanthi.
Figure 3 depicts the classification of the eight buildings in the two clusters. Due to the high diversity of the data (buildings B1 and D1—blue cluster), the formation of two separate clusters appears to be satisfactory. The rest of the buildings have no significant differences regarding their Eresid. and they form a single cluster. Their energy consumption pattern is defined by low energy consumption per m2 and per capita. The formation of two separate clusters, however, forbids the categorization of the whole community as either energy intensive—“High” or somehow energy intensive—“Medium”. Therefore, no clear category for the TLEC’s prosumers can be drawn, so the RenewIslands methodology along with the HDLM method should follow.
3.3. RenewIslands Application on Kimmeria’s LEC
Depending on the standard method of addressing the questionnaire of RenewIslands, Table 3 presents the answers for the case of Kimmeria’s community. The selection of level for the case was made via analyzing the energy class of the buildings and Hellenic Statistical Authority’s study results for the heating and cooling needs of the case study location, which is rated as G Energy Class (inadequate thermal insulation, heating/cooling energy distribution, and usage) [45]. The approach of RenewIslands is used to classify the community as low, medium, or high energy consumption (Table 1). The methodology is used to cross-check the validity of the proposed mathematical model and quantify the qualitative approach that is RenewIslands.
Table 3.
RenewIslands questionnaire for the case of Kimmeria, Xanthi.
As far as the category of heating demand of the community, it is classified as “High” using the heating degree days (HDD) methodology for the case study. The cooling demand was classified as “Medium” again using the HDD methodology and the fact that there are no heat waves afflicting the location during summer. On average, the case study is during winter amongst the most energy-consuming communities because the buildings’ infrastructure is poorly insulated and the ambient conditions are relatively cold according to the HDD methodology.
3.4. Distribution Fitting and FTS
In order to assess the validity of the proposed method, a qualitative approach to the quantified KIM will be attempted via the FTS method. The normalized data of Table 2 are presented in Table 4. Equations (5)–(7) are solved for the dataset of Table 4 and the FTS depicts their correlations. According to rules R(1), R(2),and R(3), the data are distributed accordingly to the A1, A2, and A3 triangular sets.
Table 4.
Normalized data of Table 2.
The distribution fitting via the goodness of fitting method is presented for the case study of Kimmeria, Xanthi (Figure 4). The statistical distribution which best describes the dataset is the log-normal distribution, pictured with the purple line. However, the inverse Gaussian (green line), similar to log-normal, presents more significant variance for the highest values. The SDF approach for the case presents a left-centered center of gravity for the data, and thus, a result of “Medium” or “Low” triangle maximum data concentration is expected. It should be noted that the data are used in their absolute values to fit the distribution (Table 4).
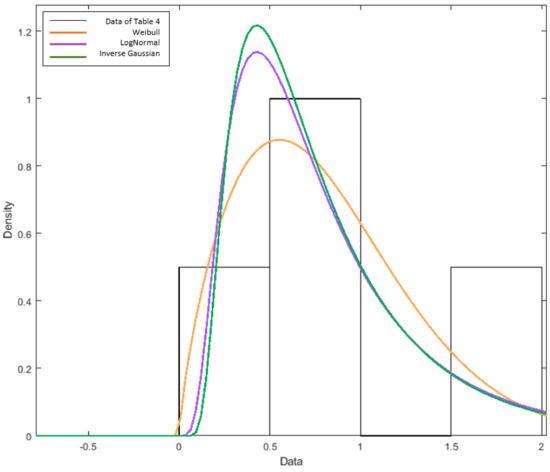
Figure 4.
SDF for the dataset of Table 2 for the case of Kimmeria, Xanthi.
By constructing the FTSs for the dataset, it can be observed that the majority of the data are gathered at “Low” and “Medium” triangular sets, as shown in Figure 5, which agrees with the result of the center of gravity of the SDF. The buildings B1 and D1, the most energy-intensive, are classified in A3 triangular set, while buildings A1, A2, B2, C1, C2, and D2 are in A1 and A2. However, most data are concentrated in A2, in the “Medium” triangular set. Thus, the characterization of the community according to the annual thermal energy demand is classified as “Medium energy intensity”. This result contradicts the RenewIslands’ questionnaire answer, in which the community was classified as “High energy intensity”.
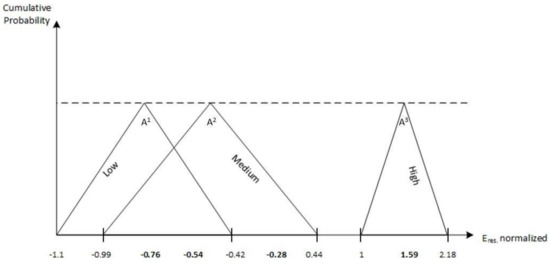
Figure 5.
FTS diagram for the case study of Kimmeria, Xanthi.
Following the proposed mathematical model (HDLM-1st layer), the following steps and layers are presented in Figure 6. The purpose of the second and third layers is to complete the design of the TLEC and present the most viable solution (feedback loop between the second and third layers continuously optimizing the technical and economical parameters of the model). The model accepts a near-optimal solution/solutions to provide TLEC’s prosumers with a viable design path that will respond to their demands. However, as mentioned above, the heuristic approach accompanied by an optimization tool still requires significant computational capacity, and the examined solutions might reach near-optimal solutions. The application of the complete HDLM model to the case study will be presented in future work.
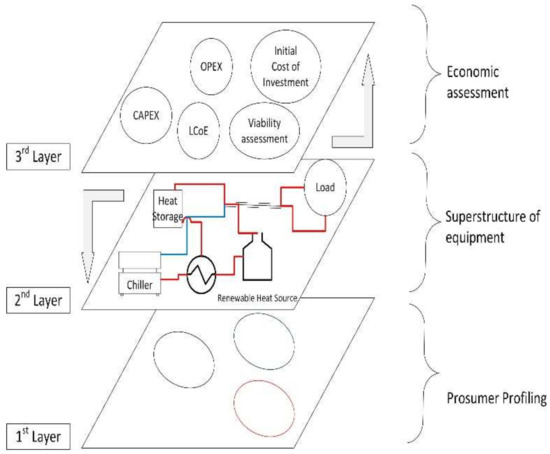
Figure 6.
The HDLM complete layer approach taking into account the thermal loads of the prosumers (first layer), the most case-appropriate technologies to be implemented (second layer) and the economic assessment (third layer) of the proposed scenario (to be optimized).
4. Conclusions
This study presents a novel approach of prosumer classification depending on the thermal energy profile and occupational characteristics. The proposed mathematical model constitutes the first of a three-layer approach in which the complete techno-economic design of a LEC will be exploited. The presented layer aims to identify the level of energy intensity of the prosumers comprising the community (low, medium, or high) and their segmentation to distinct clusters. In the view of the authors, this is a significant step towards designing an energy production and delivery system that is able to respond to consumers’ demands. The model exploits two well-established approaches for LEC formation, one quantitative—KIM—and one qualitative—RenewIslands methodology.
A case study was presented in Kimmeria, Greece, where one of the country’s largest LECs operates [45]. The hybrid approach uses empirical and quantifiable metrics to approach the classification issue and eliminates the results of the individual methodologies. The application of the HDLM approach indicated that the proposed model is highly applicable in TLEC cases and easy to use. However, the results suggested that the classification of the KIM and RenewIslands methods individually were not decisive. The HDLM definitively reached a classification solution for the prosumers of Kimmeria’s LEC, which was “Medium energy intensity users”.
The novelty of the method is that: (i) KIM is used along with k-means clustering methodology and is further extrapolated via the FTS/SDF approach. By approaching KIM in that manner, the result is well-defined mathematically and can be used to classify the community’s thermal energy needs deterministically and universally. (ii) The results of the RenewIsland methodology are used as a first approach to the community’s thermal energy needs classification, but as they lack technical depth, they are reassessed further from the KIM approach.
The combination of the two methodologies contributes to the following findings: (i) The RenewIslands methodology is qualitative and requires a low level of expertise and know- how of the system (valid for a first approach to the system), while KIM is mathematically defined and considers essential factors such as the occupation status, the m2 of the building, and the specific energy consumption. (ii) The result of RenewIslands, considering only the thermal energy consumption and classifying the community as “High energy intensity”, might lead to overdimensioning the equipment which will be selected to satisfy the demand. However, KIM combined with the SDF and the FTS redefines the classification methodology by applying quantitative measures.
The study results highlight the importance of a unified mathematical tool which transcends the limitation of the existing methodologies in the energy profiling of prosumers. The accurate classification and quantified metric of energy consumption leads to technically sound energy production and delivery system design. By following that step, design flaws such as over- or underdimensioning are significantly reduced. The capital costs for these systems will be reduced, and the payback periods as well as the overall performance of the system will substantially improve.
The combined approach unifies the qualitative and quantitative measures into one holistic approach which best describes the LEC’s thermal energy profile. The output of the first layer (“Medium energy intensity users”) will be projected on the second, whose primary purpose is the development of the superstructure (combination of types of equipment that will address the thermal energy demands calculated in the first layer). The addition of a third layer provides the necessary economic aspect to the solutions and, along with the second layer, is under investigation and will be presented in future work.
Author Contributions
Conceptualization, A.G.P. and P.N.B.; methodology, A.G.P.; software, A.G.P.; validation, A.G.P., P.N.B. and S.K.; formal analysis, A.G.P. and P.N.B.; investigation, A.G.P.; resources, A.G.P.; data curation, A.G.P. and P.N.B.; writing—original draft preparation, A.G.P.; writing—review and editing, A.G.P. and P.N.B.; visualization, A.G.P.; supervision, A.G.P. and P.N.B.; project administration, P.N.B. All authors have read and agreed to the published version of the manuscript.
Funding
This research received no external funding.
Institutional Review Board Statement
Not applicable.
Informed Consent Statement
Not applicable.
Data Availability Statement
There are no data availability issues.
Conflicts of Interest
The authors declare no conflict of interests.
References
- Capuano, L. International Energy Outlook 2018 (IEO2018); US Energy Information Administration (EIA): Washington, DC, USA, 2018; Volume 2018, p. 21. [Google Scholar]
- Cao, X.; Dai, X.; Liu, J. Building energy-consumption status worldwide and the state-of-the-art technologies for zero-energy buildings during the past decade. Energy Build. 2016, 128, 198–213. [Google Scholar] [CrossRef]
- Persson, U.; Möller, B.; Werner, S. Heat Roadmap Europe: Identifying strategic heat synergy regions. Energy Policy 2014, 74, 663–681. [Google Scholar] [CrossRef]
- Arentsen, M.; Bellekom, S. Power to the people: Local energy initiatives as seedbeds of innovation? Energy Sustain. Soc. 2014, 4, 2. [Google Scholar] [CrossRef]
- European Commission. Communication from the Commission to the European Parliament, the Council, the European Economic and Social Committee, and the Committee of the Regions. Towards Better Access to Scientific Information: Boosting the Benefits of Public Investments in Research; European Commission: Brussels, Belgium, 2012. [Google Scholar]
- Maris, G.; Flouros, F. The green deal, national energy and climate plans in Europe: Member States’ compliance and strategies. Adm. Sci. 2021, 11, 75. [Google Scholar] [CrossRef]
- Fouladvand, J.; Mouter, N.; Ghorbani, A.; Herder, P. Formation and continuation of thermal energy community systems: An explorative agent-based model for The Netherlands. Energies 2020, 13, 2829. [Google Scholar] [CrossRef]
- Petruschke, P.; Gasparovic, G.; Voll, P.; Krajačić, G.; Duić, N.; Bardow, A. A hybrid approach for the efficient synthesis of renewable energy systems. Appl. Energy 2014, 135, 625–633. [Google Scholar] [CrossRef]
- Langsdorf, S. EU Energy Policy: From the ECSC to the Energy Roadmap 2050; Green European Foundation: Brussels, Belgium, 2011. [Google Scholar]
- Sokolowski, M.M. European law on the energy communities: A long way to a direct legal framework. Eur. Energy Environ. Law Rev. 2018, 27, 60–70. [Google Scholar] [CrossRef]
- Papatsounis, A.G.; Botsaris, P.N.; Katsavounis, S. Thermal/Cooling Energy on Local Energy Communities: A Critical Review. Energies 2022, 15, 1117. [Google Scholar] [CrossRef]
- Botsaris, P.N.; Giourka, P.; Papatsounis, A.; Dimitriadou, P.; Goitia-Zabaleta, N.; Patsonakis, C. Developing a Business Case for a Renewable Energy Community in a Public Housing Settlement in Greece—The Case of a Student Housing and Its Challenges, Prospects and Barriers. Sustainability 2021, 13, 3792. [Google Scholar] [CrossRef]
- Sanduleac, M.; Ciornei, I.; Albu, M.; Toma, L.; Sturzeanu, M.; Martins, J.F. Resilient prosumer scenario in a changing regulatory environment—The UniRCon solution. Energies 2017, 10, 1941. [Google Scholar] [CrossRef]
- Fouquet, R. Lessons from energy history for climate policy: Technological change, demand and economic development. Energy Res. Soc. Sci. 2016, 22, 79–93. [Google Scholar] [CrossRef]
- Pena-Bello, A.; Schuetz, P.; Berger, M.; Worlitschek, J.; Patel, M.K.; Parra, D. Decarbonizing heat with PV-coupled heat pumps supported by electricity and heat storage: Impacts and trade-offs for prosumers and the grid. Energy Convers. Manag. 2021, 240, 114220. [Google Scholar] [CrossRef]
- Frangopoulos, C.; Spakovsky, M.V.; Sciubba, E. A brief review of methods for the design and synthesis optimization of energy systems. Int. J. Thermodyn. 2002, 5, 151–160. [Google Scholar]
- Caballero, V.; Vernet, D.; Zaballos, A. A Heuristic to Create Prosumer Community Groups in the Social Internet of Energy. Sensors 2020, 20, 3704. [Google Scholar] [CrossRef]
- Howind, S.; Bauer, V.; Wendt, A.; Franzl, G.; Sauter, T.; Wilker, S. Prosumer and Demand-Side Management Impact on Rural Communities’ Energy Balance. In Proceedings of the 2020 25th IEEE International Conference on Emerging Technologies and Factory Automation (ETFA), Vienna, Austria, 8–11 September 2020; Volume 1, pp. 768–773. [Google Scholar]
- Almeida, V.A.; de A.L. Rabelo, R.; Carvalho, A.; Rodrigues, J.J.; Solic, P. Aligning the interests of prosumers and utilities through a two-step demand-response approach. J. Clean. Prod. 2021, 323, 128993. [Google Scholar] [CrossRef]
- Mathiesen, B.V.; Lund, H.; Karlsson, K. 100% Renewable energy systems, climate mitigation and economic growth. Appl. Energy 2011, 88, 488–501. [Google Scholar] [CrossRef]
- Ostergaard, P.A. Reviewing EnergyPLAN simulations and performance indicator applications in EnergyPLAN simulations. Appl. Energy 2015, 154, 921–933. [Google Scholar] [CrossRef]
- Bahramian, F.; Akbari, A.; Nabavi, M.; Esfandi, S.; Naeiji, E.; Issakhov, A. Design and tri-objective optimization of an energy plant integrated with near-zero energy building including energy storage: An application of dynamic simulation. Sustain. Energy Technol. Assess. 2021, 47, 101419. [Google Scholar] [CrossRef]
- Abu-Hamdeh, N.H.; Alnefaie, K.A. Energy and exergy analysis and optimum working conditions of a renewable energy system using a transient systems simulation program. Energy Explor. Exploit. 2020, 38, 1248–1261. [Google Scholar] [CrossRef]
- Habib, M.F.; Ali, M.; Sheikh, N.A.; Badar, A.W.; Mehmood, S. Building thermal load management through integration of solar assisted absorption and desiccant air conditioning systems: A model-based simulation-optimization approach. J. Build. Eng. 2020, 30, 101279. [Google Scholar] [CrossRef]
- Ding, X.; Guo, Q.; Qiannan, T.; Jermsittiparsert, K. Economic and environmental assessment of multi-energy microgrids under a hybrid optimization technique. Sustain. Cities Soc. 2021, 65, 102630. [Google Scholar] [CrossRef]
- Dominković, D.F.; Stunjek, G.; Blanco, I.; Madsen, H.; Krajać, G. Technical, economic and environmental optimization of district heating expansion in an urban agglomeration. Energy 2020, 197, 117243. [Google Scholar] [CrossRef]
- Lichtenegger, K.; Leitner, A.; Märzinger, T.; Mair, C.; Moser, A.; Wöss, D.; Schmidl, C.; Pröll, T. Decentralized heating grid operation: A comparison of centralized and agent-based optimization. Sustain. Energy Grids Netw. 2020, 21, 100300. [Google Scholar] [CrossRef]
- Koohi-Fayegh, S.; Rosen, M.A. Optimization of seasonal storage for community-level energy systems: Status and needs. Energy Ecol. Environ. 2017, 2, 169–181. [Google Scholar] [CrossRef][Green Version]
- Zekić-Sušac, M.; Has, A.; Kneć, M. Predicting energy cost of public buildings by artificial neural networks, CART, and random forest. Neurocomputing 2021, 439, 223–233. [Google Scholar] [CrossRef]
- Hock, D.; Kappes, M. Using the Entropy for Typical Load Curve Classification. In Proceedings of the 2018 International Conference on Smart Grid and Clean Energy Technologies (ICSGCE), Kajang, Malaysia, 29 May–1 June 2018; pp. 58–64. [Google Scholar]
- Chen, F.; Duic, N.; Alves, L.M.; da Graça Carvalho, M. Renewislands—Renewable energy solutions for islands. Renew. Sustain. Energy Rev. 2007, 11, 1888–1902. [Google Scholar] [CrossRef]
- Ürge-Vorsatz, D.; Cabeza, L.F.; Serrano, S.; Barreneche, C.; Petrichenko, K. Heating and cooling energy trends and drivers in buildings. Renew. Sustain. Energy Rev. 2015, 41, 85–98. [Google Scholar] [CrossRef]
- Liu, J.; Jin, T.H.; Shin, K.Y. Parametric study on a simplified model for the estimation of the heating and the cooling loads of a closed-span greenhouse: A case study in Korea. J. Mech. Sci. Technol. 2021, 35, 333–341. [Google Scholar] [CrossRef]
- Duić, N.; Krajać, G.; da Graça Carvalho, M. RenewIslands methodology for sustainable energy and resource planning for islands. Renew. Sustain. Energy Rev. 2008, 12, 1032–1062. [Google Scholar] [CrossRef]
- Zheng, L.; Li, Y.; Wei, C.; Bai, X. A data-driven method for operation pattern analysis of the integrated energy microgrid. Energy Convers. Manag. X 2021, 11, 100092. [Google Scholar] [CrossRef]
- Wu, J. Advances in K-Means Clustering: A Data Mining Thinking; Springer Science & Business Media: Berlin/Heidelberg, Germany, 2012. [Google Scholar]
- Das, T.; Paitnaik, S.; Mishra, S.P. Identification of the Optimal Number of Clusters in Textual Data; Springer: Singapore, 2022. [Google Scholar]
- Hatagami, Y.; Matsuka, T. Text mining with an augmented version of the bisecting k-means algorithm. In Proceedings of the International Conference on Neural Information Processing, Bangkok, Thailand, 1–5 December 2009; pp. 352–359. [Google Scholar]
- Yu, H.; Yin, Q.; Guo, P. Enlightening the Relationship Between Distribution and Regression Fitting. In Proceedings of the International Conference on Intelligence Science, Shanghai, China, 25–28 October 2017; pp. 222–227. [Google Scholar]
- Arutkin, M.; Faranda, D.; Alberti, T.; Vallée, A. Delayed epidemic peak caused by infection and recovery rate fluctuations. Chaos Interdiscip. J. Nonlinear Sci. 2021, 31, 101107. [Google Scholar] [CrossRef] [PubMed]
- Odry, J.; Arnaud, P. Comparison of flood frequency analysis methods for ungauged catchments in France. Geosciences 2017, 7, 88. [Google Scholar] [CrossRef]
- Paolella, M.S. Fundamental Statistical Inference: A Computational Approach; John Wiley & Sons: Hoboken, NJ, USA, 2018; Volume 216. [Google Scholar]
- Chen, G.; Pham, T.T.; Boustany, N.M. Introduction to fuzzy sets, fuzzy logic, and fuzzy control systems. Appl. Mech. Rev. 2001, 54, 102–103. [Google Scholar] [CrossRef]
- Botsaris, P.N.; Lymperopoulos, K.; Pechtelidis, A. Preliminary evaluation of operational results of RES systems integrated in students’ residences in Xanthi, Greece. IOP Conf. Ser. Earth Environ. Sci. 2020, 410, 012048. [Google Scholar] [CrossRef]
- Droutsa, K.G.; Kontoyiannidis, S.; Dascalaki, E.G.; Balaras, C.A. Mapping the energy performance of hellenic residential buildings from EPC (energy performance certificate) data. Energy 2016, 98, 284–295. [Google Scholar] [CrossRef]
Publisher’s Note: MDPI stays neutral with regard to jurisdictional claims in published maps and institutional affiliations. |
© 2022 by the authors. Licensee MDPI, Basel, Switzerland. This article is an open access article distributed under the terms and conditions of the Creative Commons Attribution (CC BY) license (https://creativecommons.org/licenses/by/4.0/).