Article

Development of a Model Material for Dynamic Geotechnical Model Tests

Faculty of Engineering, China University of Geosciences (Wuhan), Wuhan 430074, China
*
Author to whom correspondence should be addressed.
Appl. Sci. 2022, 12(11), 5344; https://doi.org/10.3390/app12115344
Submission received: 12 April 2022 / Revised: 19 May 2022 / Accepted: 22 May 2022 / Published: 25 May 2022

Abstract

:
To develop a model material suitable for analysing the stability of sandstone slopes during strong earthquakes, an orthogonal test was designed by selecting seven physico-mechemical parameters, a combination of dynamic and static parameters, as research indexes. Then, the influence of the proportion of each component in the model material on each test index was determined by sensitivity analysis, and the quantitative relationship between physico-mechanical parameters and component proportions was established by multiple linear regression analysis to develop a model material similar to sandstone. Finally, a sandstone slope along the Duxiang Expressway was taken as an example, and the proportions of the components suitable for a model of the rock mass in this area were determined. The test results showed that (1) the physico-mechanical parameters selected for the dynamic and static tests were used to effectively develop model materials for dynamic geotechnical model tests; (2) samples of model materials composed of barite powder, quartz sand, ferric powder, gypsum and cement met the requirements for dynamic testing of geotechnical models of sandstone slopes; and (3) through sensitivity analysis of various factors and multiple linear regression analysis, the required model materials were efficiently configured, and the failure mode, failure process and physico-mechanical parameters of the model materials accurately simulated the original rock materials.

1. Introduction

China is located at the intersection of the Pacific Rim and the Eurasian seismic belt. Earthquakes cause many secondary disasters, such as rock slope collapses and landslides. It is particularly important to analyse the dynamic response and evolution of rock slopes under earthquake loading [1,2,3,4]. In recent years, many methods have been proposed to study the deformation and failure characteristics of rock slopes during earthquakes, among which the most important method is the dynamic testing of geotechnical models. By using a geotechnical model to simplify the actual engineering of a geological slope, the response to earthquakes is monitored over time, and the nonlinear characteristics of slope deformation and failure are analysed [5,6,7,8]. It is very difficult to collect rock specimens for these geotechnical model tests, so the key to their success is to select appropriate model materials similar to those in the field so that the model test effectively reflects the actual geological phenomena [9,10,11].
At present, many achievements have been made in the research of model materials, and good results have been achieved in model experiments. Gypsum mixtures were developed by ISMES and LNEC in Portugal. Han Boli et al. [12] developed the MIB material, which is composed of barite powder, rubber film ferric concentrate powder and rosin alcohol solution. Li Zhongkui [13] and Ma Fangping et al. [14] developed the NIOS material, which is composed of fine magnetite powder, river sand, and binder based on gypsum or cement. In addition, Wang Hanpeng [15], Li Yong [16], Zhang Qiangyong [17] and Ning Yibing [18] used iron powder, barite powder, quartz sand, rosin alcohol solution and other materials (IBSCM) to simulate most rock mass materials, from soft rock to hard rock. Studies on model materials in model tests are relatively complete. Many scholars have conducted studies on rock masses similar to limestone [19], marl [20,21] and conglomerate [22] through static physico-mechanical parameters. However, current studies do not take into account dynamic effects in the geotechnical model tests. Static physico-mechanical parameters are used to determine the proportions of the components in model materials, which then affects the accuracy of the model geotechnical tests for dynamic failure. Meanwhile, in the process of dynamic physical model tests and research, it is time consuming to configure model materials, resulting in slow progress and low efficiency of testing and research.
The efficient and orderly configuration of model sandstone materials will improve the efficiency of research. In this paper, by combining the results of previous studies, the similarity criterion and many mechanical tests of model materials, the sensitivity of dynamic and static parameters to the proportions of components in model materials was analysed and multiple linear regression analysis was used to establish a quantitative relation between physico-mechanical parameters and the proportions of components in model materials. Finally, a sandstone slope along the Duxiang Expressway was taken as an example, and the model material’s configuration was similar to that of the slope.

2. Selection of Similar Materials

2.1. Principle of Model Similarity

Model testing involves scaling down a geological prototype according to the principle of similarity and then magnifying the physico-mechanical parameters of the model by observing the various physical phenomena of the model and using the same similarity principle to analyse the geological problems to be studied [23]. In the model test, it is difficult to realize complete similarity between prototype and model due to the limitations of test conditions, material preparation and other factors. In this study, dimensional analysis was used to deduce the similarity criterion; that is, the basic dimension was selected, and other physical quantities were derived from the basic dimension.
In the process of dynamic testing of a geotechnical model, static physical quantities such as length (L), mass (m), density (ρ), elastic modulus (Es), Poisson’s ratio (μs), shear modulus (Gs), cohesion (c), internal friction angle (φ), force (F), displacement (s), stress (σ), strain (ε), time (t), frequency (f), speed (v), gravitational acceleration (g) and acceleration (a) are considered. Dynamic physical parameters such as longitudinal wave velocity (vl), horizontal wave velocity (vs), dynamic elastic modulus (Ed), dynamic Poisson’s ratio (μd) and dynamic shear modulus (Gd) should also be considered. In this paper, Ca = Cρ = 1 CL = n was selected as the fundamental dimension, the similarity relation was deduced by using the basic dimensional system [M][L][T] and the Buckingham π theorem, and the similarity criterion was determined [24,25], wherein [M] is the dimension of mass, [L] is the dimension of length and [T] is the dimension of time. The International System of Units (SI units) of the three are kg, m and s, respectively. In this dimensional system, [M][L][T] is independent of each other, and the dimensions of any other physical quantity can be derived from the power combination of these three dimensions.
(1) Static parameter similarity ratio:
C a = C ρ = C g = C ε = C ϕ = C μ s = 1
C s = C L = n
C σ = C c = C E s = C G s = C ρ C a C L = n
C ν = C L 1 / 2 C a 1 / 2 = n
C t = C L 1 / 2 C a 1 / 2 = n
C f = C L 1 / 2 C a 1 / 2 = 1 / n
C F = C L 3 C a C ρ = n 3
C m = C L 3 C ρ = n 3
(2) Dynamic parameter similarity ratio:
C μ d = 1
C E d = C G d = C ρ C a C L = n
C ν l = C ν s = C L 1 / 2 C a 1 / 2 = n
where Cx is the similarity coefficient (that is, the proportions of prototype and model, and the subscript x is a related physical quantity), and n is the similarity multiple.

2.2. Determination of Physico-Mechanical Parameters

Considering the physical and mechanical properties in the dynamic testing of geotechnical models [26,27,28], the physico-mechanical parameters of similar materials must provide the five basic physico-mechanical parameters of rock mass material: density, compressive strength, tensile strength, internal friction angle and cohesion. Additionally, when considering the basic physico-mechanical parameters, the influence of dynamic action on rock is considered, and the longitudinal wave velocity, horizontal wave velocity, dynamic elastic modulus, dynamic Poisson’s ratio and dynamic shear modulus are introduced. Poisson’s ratio has no obvious effect on dynamical analysis, and the dynamic elastic modulus and dynamic shear modulus can be calculated by using the longitudinal wave velocity and horizontal wave velocity through the dynamic constant formula. Therefore, density, compressive strength, tensile strength, internal friction angle, cohesion, dynamic elastic modulus and dynamic shear modulus were selected as the research indexes [29,30,31].

2.3. Selection of Model Materials Similar to Sandstone

When selecting model materials, it is necessary to ensure that the model materials have properties similar to those of the original rock, and the samples have stable mechanical properties and are not susceptible to external influences. Mechanical parameters are sensitive to changes in the material ratio and should be nontoxic, harmless and inexpensive [15]. Therefore, the materials selected by Yao Guoqiang [32], namely, quartz sand, barite powder, ferric powder, gypsum and cement, were adopted as components of the model materials. Among them, quartz sand, barite powder and ferric powder are aggregates. Quartz sand provided a framework, barite powder and ferric powder were used to regulate the weight, and gypsum and cement provided cementation. In addition, glycerine was added as a moisturizing agent, while early strength agents and antifoam agents were added as needed. In the model material, the components were quartz sand (30~40 mesh coarse aggregate), barite powder (200 mesh fine aggregate), ferric powder (150 mesh fine aggregate), PO 32.5 cement and gypsum (1200 mesh fine aggregate).

3. Experimental Design

To more accurately reflect the physical and mechanical properties of sandstone and facilitate the orthogonal experimental design of model materials, this study determined the range of physico-mechanical parameters of sandstone by referring to relevant literature. As detailed dynamic parameters of sandstone are not available at present, the range of relevant dynamic parameters is not listed here. The physico-mechanical parameters are listed in Table 1.

3.1. Design of the Orthogonal Test

Orthogonal testing is widely used in geological engineering because it is efficient, rapid and economical. The orthogonal experimental design can be used to conduct multifactor and multilevel designs and select representative horizontal combinations for testing. The selected combinations have the characteristics of uniform dispersion and neat comparability. In this test, four influencing factors were selected: cementing material/solid material (A), gypsum/cementing material (B), quartz sand/aggregate (C) and ferric concentrate powder/(barite powder + ferric powder) (D). The approximate ranges of the ratios of the components were determined through a preliminary experiment, and an L25(54) orthogonal test with four factors and five levels was designed. The material ratio scheme is shown in Table 2.

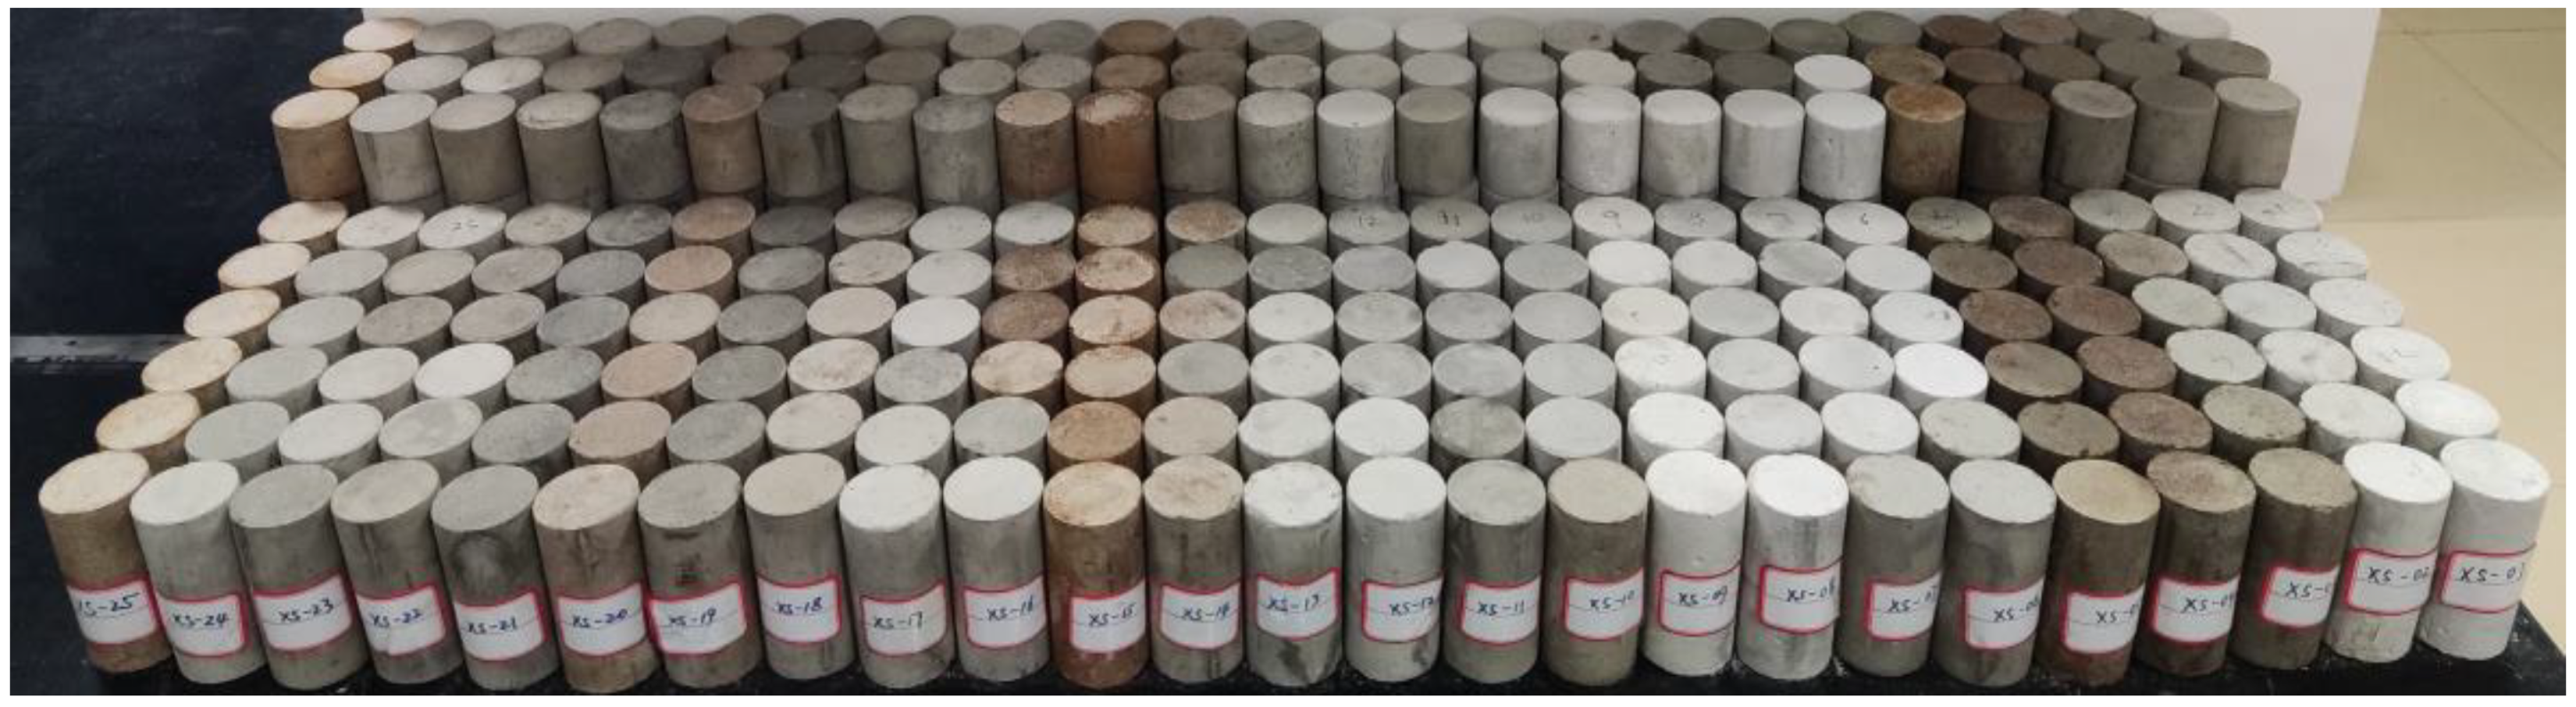
3.2. Sample Preparation Process and Process

To prepare the samples, first, the quartz sand, barite powder, ferric powder, gypsum and cement were weighed and blended evenly in a blender; tap water was added and stirred until the mixture was uniform, where the water–solid ratio was 3:20; then we dissolved 4% glycerine per 100 mL water. The water–solid ratio and the glycerine ratio were selected based on a large number of preliminary experiments and previous experience. Then, the mixture was transferred to a cylindrical mould with inner diameter ϕ 50 × 100 mm or ϕ 50 × 50 mm, and the mould underwent uniform vibrations on a vibration table. Second, after curing for 4 h, the samples were demoulded and allowed to cure under ambient conditions. Finally, after curing for 1 week, each sample was ground finely on both sides, numbered and reserved.
A total of 25 groups of tests were designed for this experiment, each of which required wave velocity detection, uniaxial compression, direct shear and splitting tests. The sample size used for wave velocity detection was the same as that used for the uniaxial test or direct shear test, and no new sample preparation was needed. To reduce the error, the average value was taken as the final result, including 3 specimens in the splitting test group, 3 specimens in the uniaxial test group, 6 specimens in the direct shear test group, and a total of 225 long cylindrical specimens (ϕ 50 × 100 mm) and 75 short cylindrical specimens (ϕ 50 × 50 mm), as shown in Figure 1.

3.3. Physical and Mechanical Tests

To determine the density, compressive strength, tensile strength, internal friction angle, cohesion, dynamic elastic modulus and dynamic shear modulus of the model materials, the samples were weighed, and wave velocity detection, uniaxial compression, direct shear and splitting tests were carried out. Wave velocity was detected by an ultrasonic detector; the dynamic shear modulus and dynamic elastic modulus were calculated by a built-in Model-5251 CSONIC Viewer-SX system, which adopts 12 bits/50nsec high-velocity A/D converter; and a direct shear test was carried out by a WDJ-300 microcomputer servo control rock shear testing machine whose relative error is ±0.5%. Uniaxial compression and splitting tests were carried out by an INSTRON 1346 universal material test system whose load test accuracy is ±0.5%.

4. Experimental Results and Sensitivity Analysis

4.1. Analysis of Test Results

Table 3 shows the results of the size, mass, uniaxial compression, direct shear, splitting and ultrasonic detection measurements for 25 groups of samples. Based on the overall analysis of 25 groups of samples, the density ranged from 2.14 to 2.79 g/cm3, the tensile strength ranged from 0.0083 to 0.1098 MPa; the compressive strength ranged from 0.19 to 3.10 MPa, and the cohesive strength ranged from 0.15 to 1.70 MPa. The internal friction angle ranged from 18.77° to 62.49°, the dynamic shear modulus ranged from 0.02425 to 0.4215 MPa, and the dynamic elastic modulus ranged from 0.122 to 1.335 MPa. Compared with Table 1, the ranges of the physico-mechanical parameters were large and basically met the relevant requirements for physico-mechanical parameters of model materials similar to sandstone.

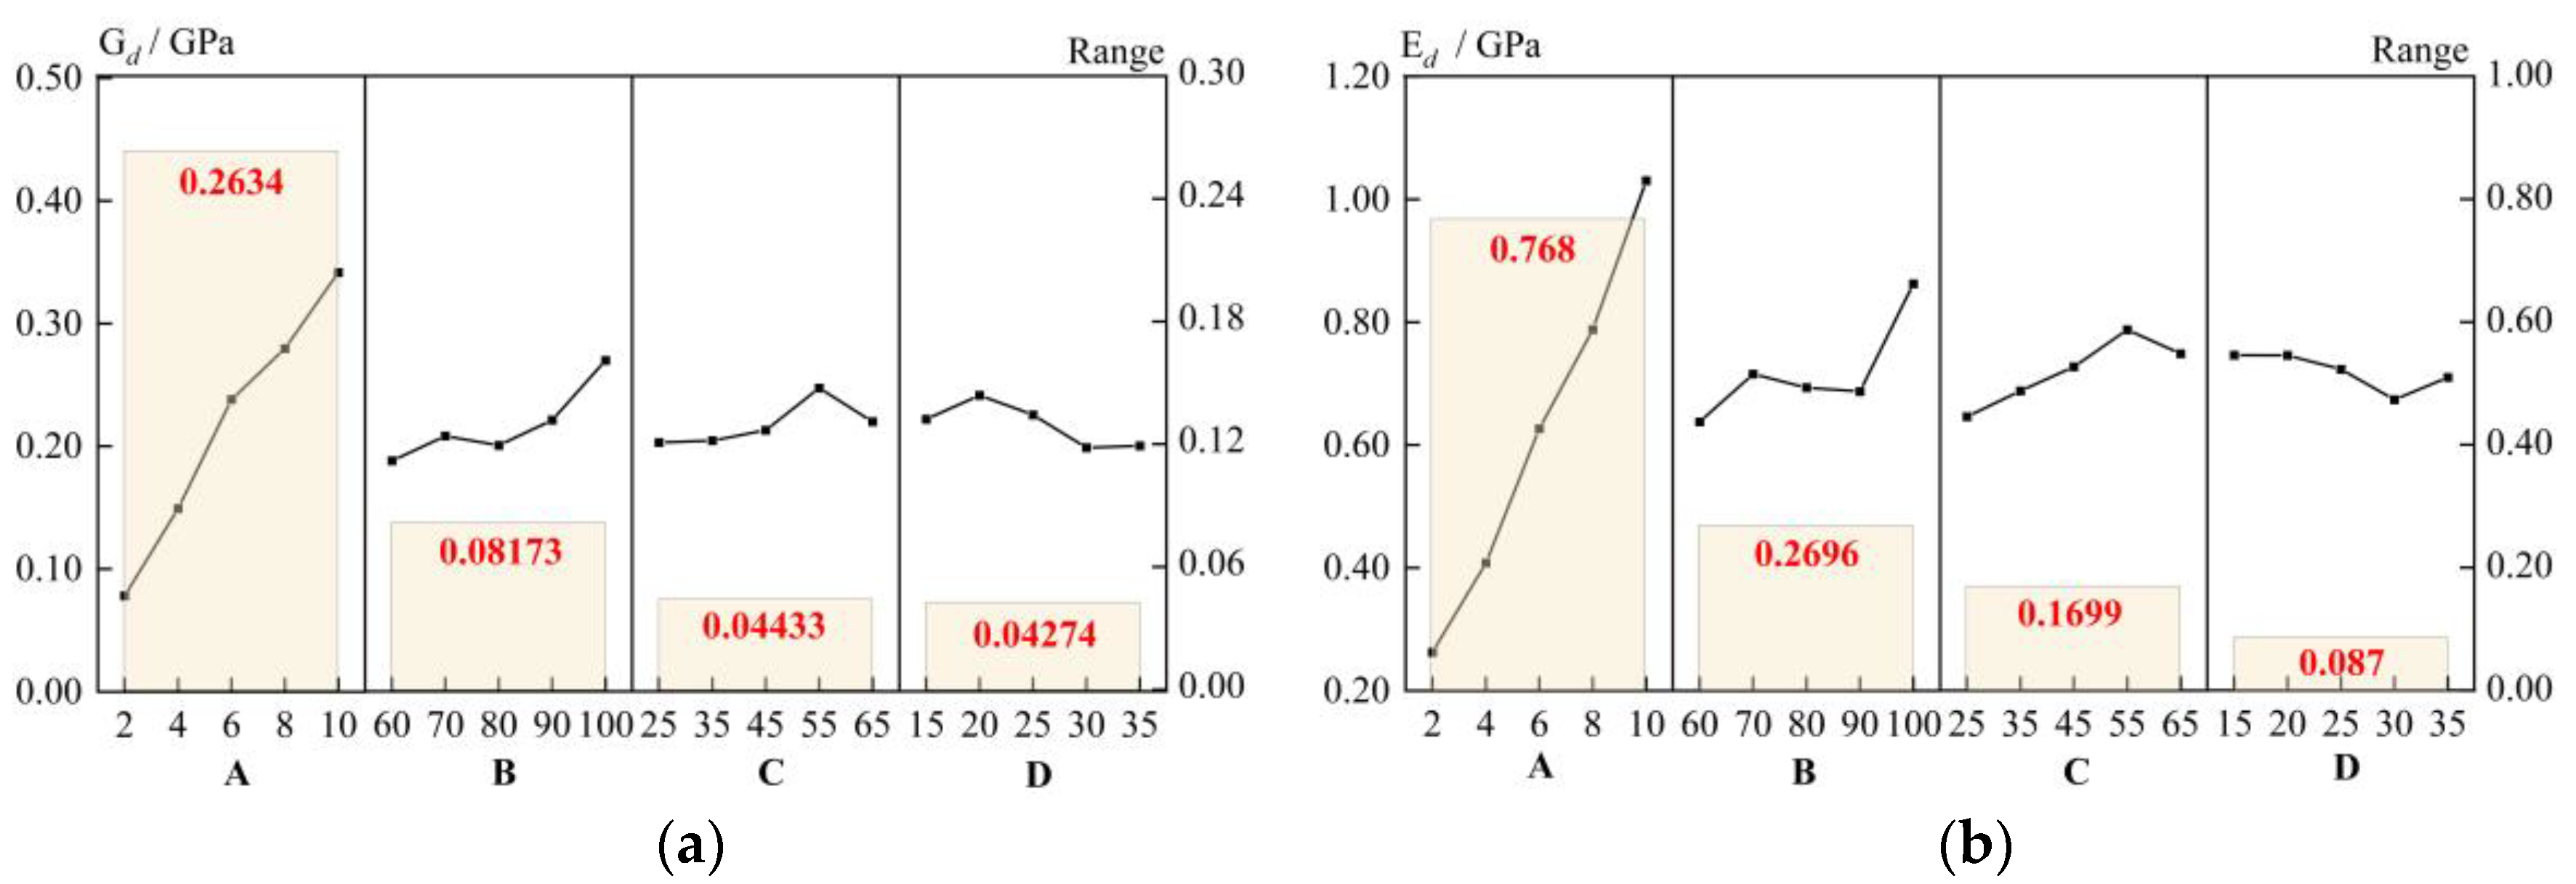
4.2. Sensitivity Analysis

In an orthogonal test analysis, the degree of influence of various factors on the physical parameters can be determined by range analysis. The range analysis method has the advantages of simple calculation, visual imaging, simplicity and ease of understanding and is the method most commonly used to analyse orthogonal test results.

4.2.1. Sensitivity Analysis of Static Physico-Mechanical Parameters

Based on the orthogonal test results, a range analysis was conducted on the five static parameters, and a range analysis diagram was drawn, as shown in Figure 2. In the figure, the broken-line graph represents the average value of the test index, and the bar graph represents the range. The results for sensitivity to the four influencing groups, cementing material/solid material (A), gypsum/cementing material (B), quartz sand/aggregate (C) and ferric concentrate powder/(barite powder + ferric powder) (D), were C > A > B > D for density, A > B > C > D for pressure strength, A > B > D > C for tensile strength, B > A > C > D for cohesive force and A > B > C > D for internal friction angle.
The sensitivity of the static physico-mechanical parameters to the proportions of the components in the model materials was further analysed. Density was the most sensitive to the proportion of quartz sand, and its sensitivity decreased with the increase in the proportion of quartz sand and was positively correlated with the proportions of barite powder and ferric powder. The compressive strength was the most sensitive to the proportion of cementing materials in the solid materials, and its sensitivity increased with the increase in proportion of cementing materials; it was mainly affected by the proportion of gypsum. The tensile strength was the most sensitive to the proportion of cementing materials in the solid materials, and its sensitivity increased with the increase in cementing materials but was less affected by the proportion of other materials. The cohesion was the most sensitive to the proportion of gypsum in the cementing material, and its sensitivity increased with the increase in the proportion of the cementing material. Gypsum had major role in cohesion and promoted an increase in cohesion. The internal friction angle was the most sensitive to the proportion of cementing material in the solid material, and its sensitivity decreased with the increase in the proportion of cementing material and increased with the increase in the proportion of quartz sand in the aggregate.

4.2.2. Sensitivity Analysis of Dynamic Physico-Mechanical Parameters

Based on the orthogonal test results, a range analysis was carried out on the two dynamic parameters, and the range analysis diagram was shown in Figure 3. In the figure, the broken-line graph represents the average value of the test index, and the bar graph represents the range. The results show that the sensitivity to the four cases discussed above was A > B > C > D for the dynamic shear modulus and A > B > C > D for the dynamic elastic modulus.
The sensitivity of the dynamic physico-mechanical parameters to the proportions of the ingredients in the model materials was further analysed. The sensitivities of the dynamic shear modulus and dynamic elastic modulus were similar for the proportion of each component and most sensitive to the proportion of cementing materials in the solid materials, which increased with increasing use of cementing materials. There was a slight difference between the sensitivity of the two parameters with the change in the ratio of ferric powder/(barite powder + ferric concentrate powder).

5. Correlation Analysis between the Static and Dynamic Parameters and Proportions of Components in the Model Materials

When analysing the correspondence between multiple factors and dependent variables, multiple linear regression analysis can be used to predict or estimate the effects of dependent variables through the optimal combination of multiple independent variables. Multiple linear regression analysis establishes an appropriate mathematical analysis model in accordance with the highly correlated form, which is similar to the statistical method for the connection between response variables.

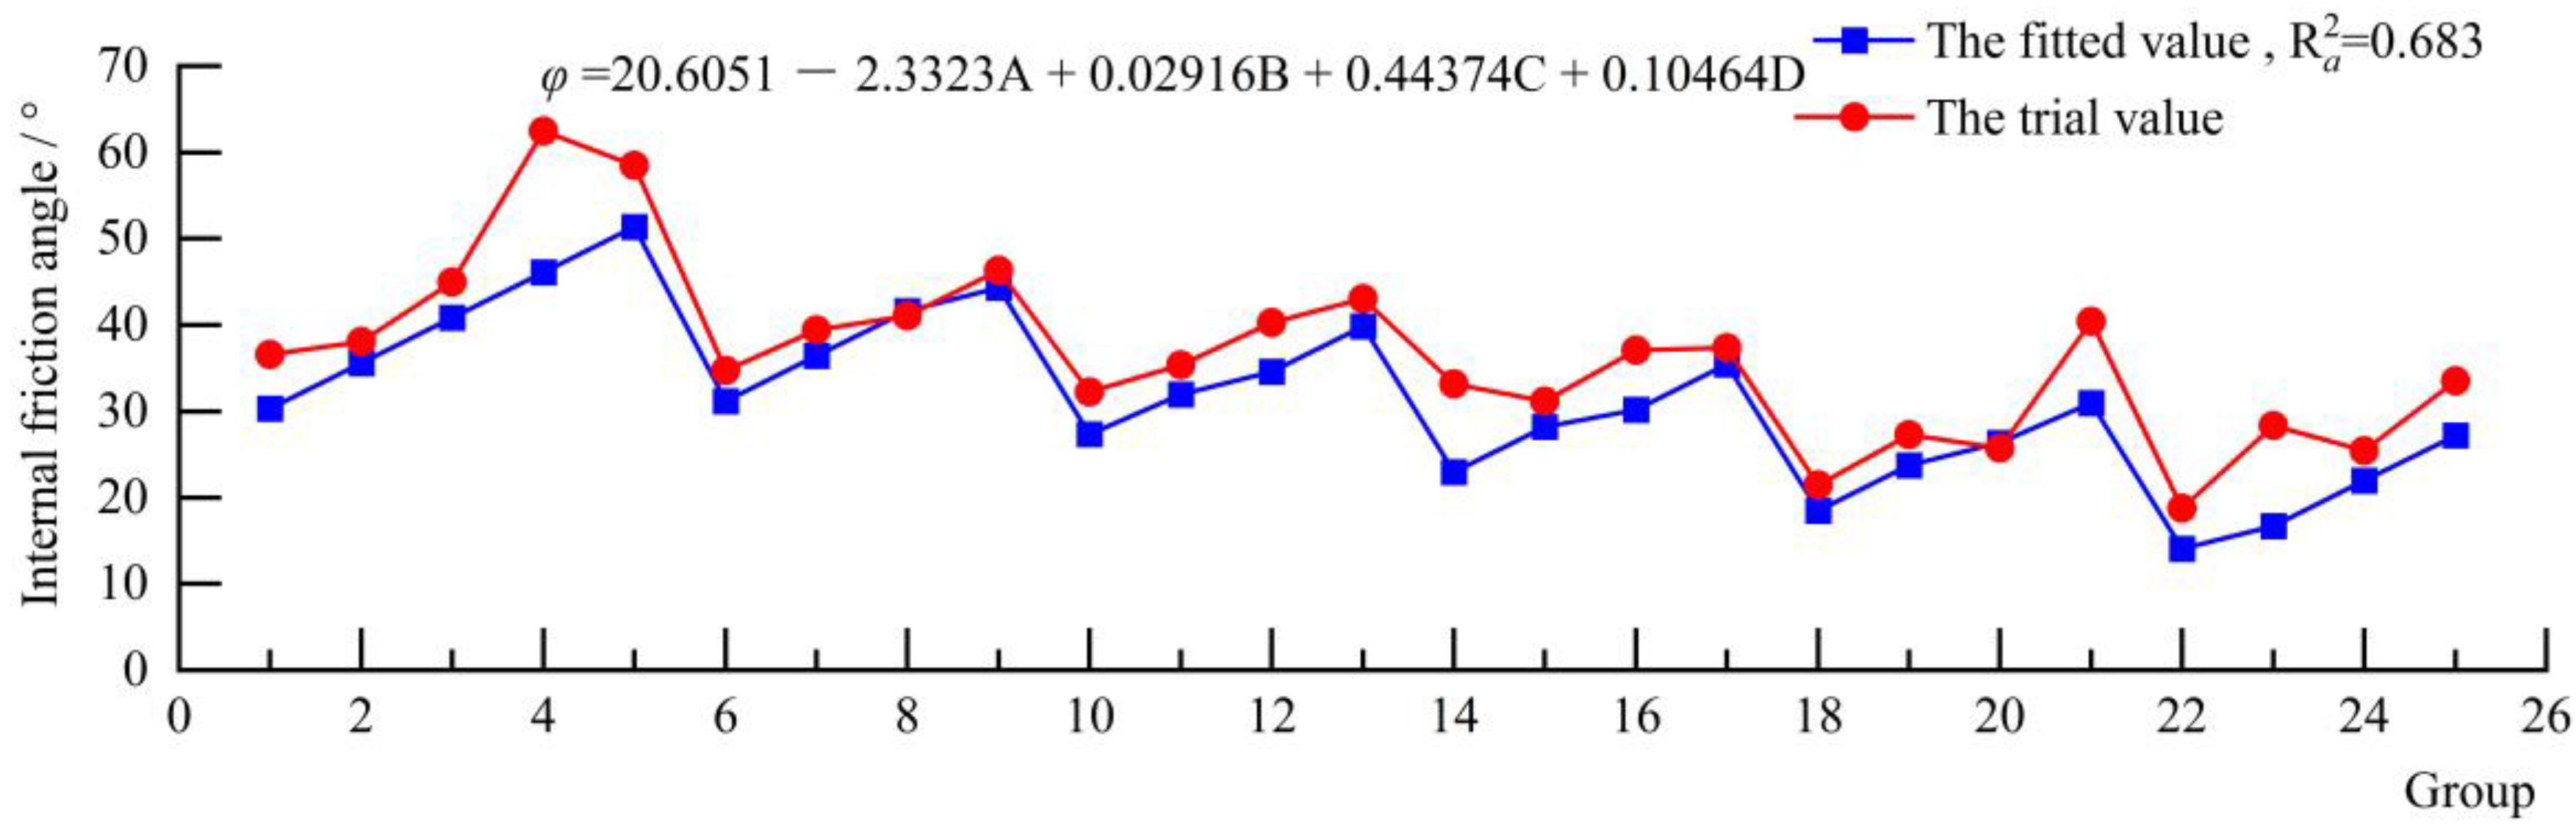
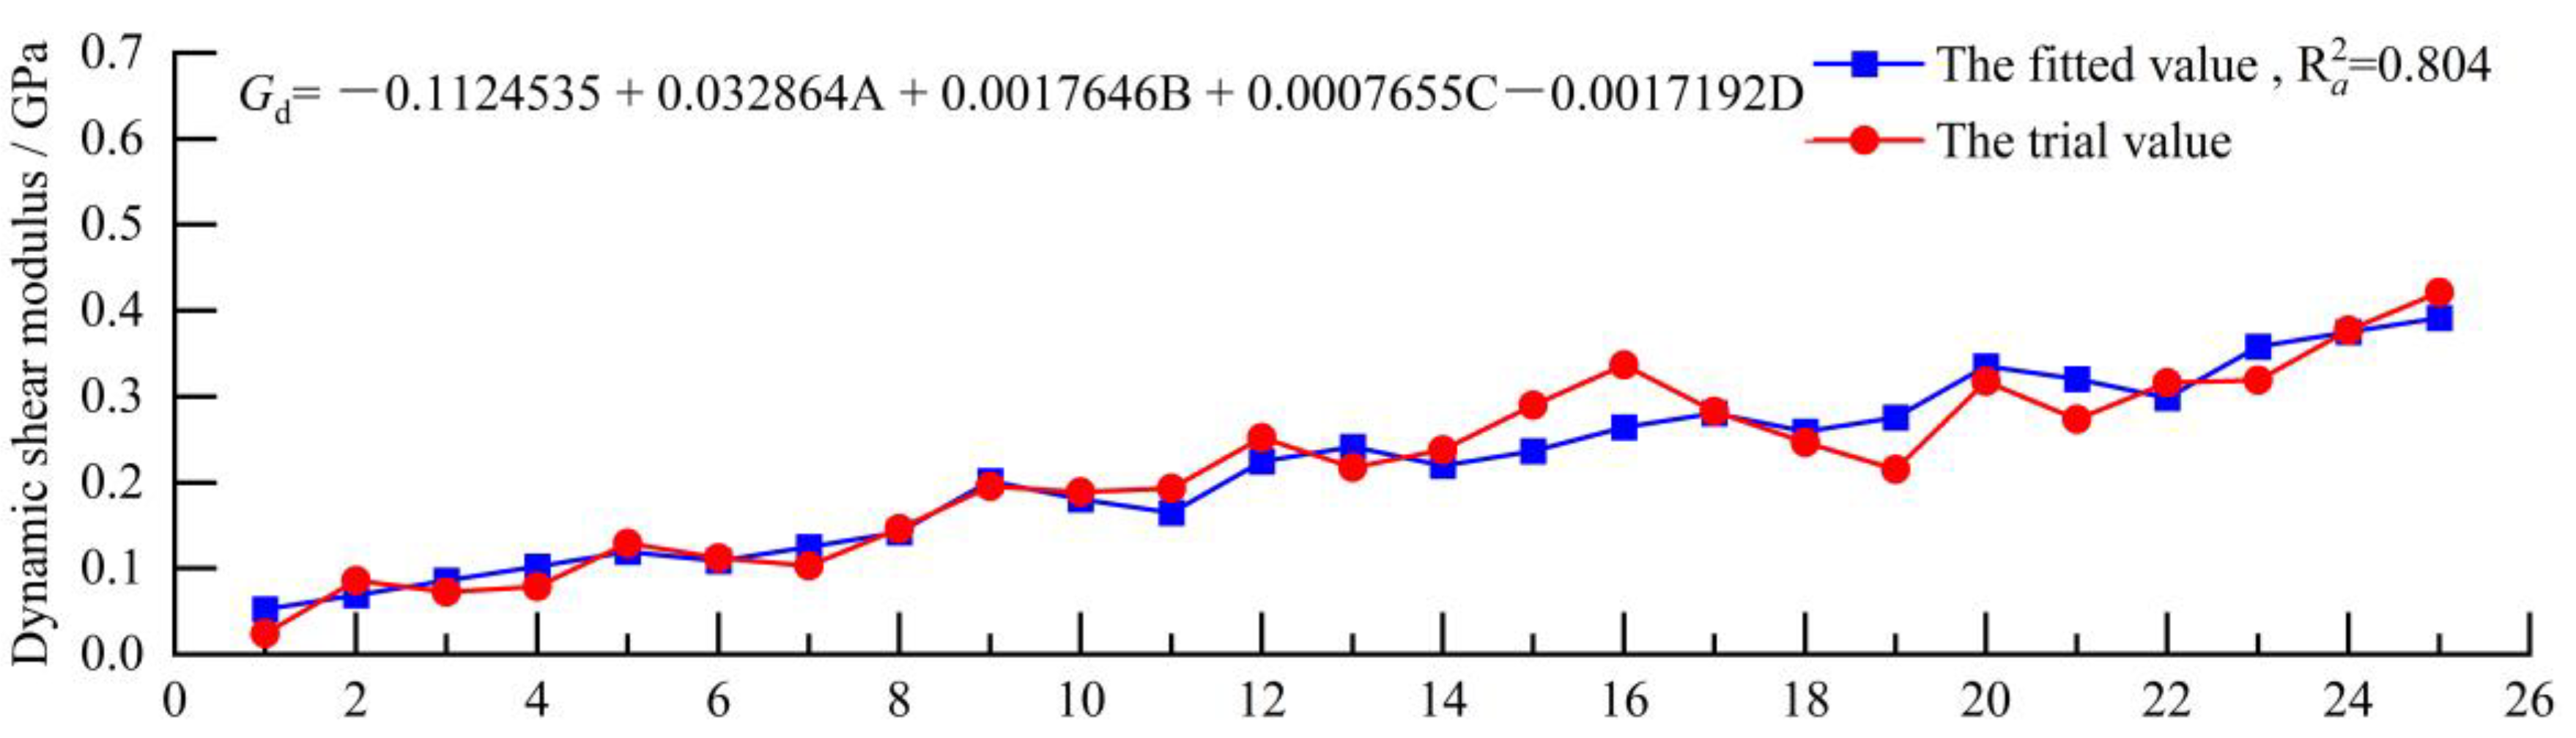
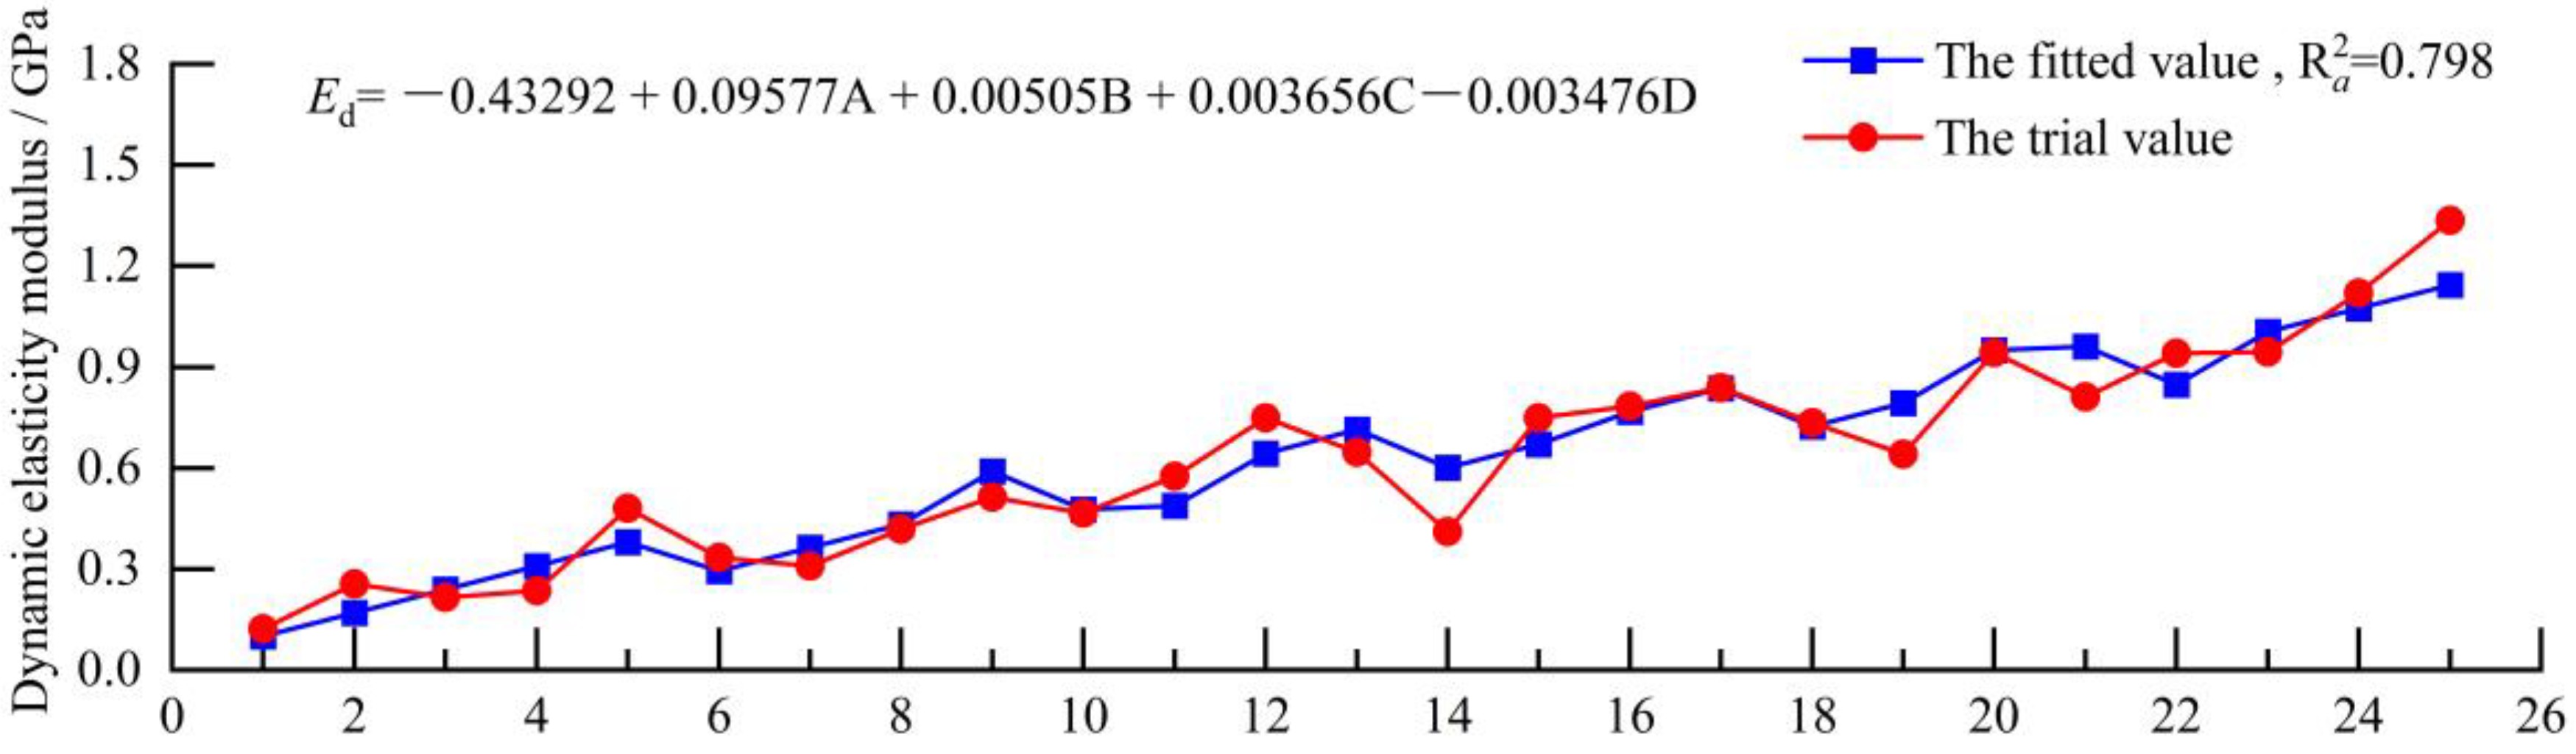
5.1. Establishment of a Multiple Linear Regression Model

In multiple linear regression analysis, the dependent variable y is affected by multiple external variables xi. If there is a linear relationship between y and xi, then a multiple regression model can be established based on the dependent variable y and all influencing factors xi. According to the basic theory of multiple linear regression model [34], the mathematical expression of the model is as follows:
y = b 0 + b 1 x 1 + b 2 x 2 + + b m x m + μ
where b0, b1,…, bm are the regression coefficients and are the percentages of materials.
By substituting discrete data into (12), the following equations can be obtained:
{ y 1 = b 0 + b 1 x 11 + b 2 x 21 + + b m x m 1 y 2 = b 0 + b 1 x 12 + b 2 x 22 + + b m x m 2                  y n = b 0 + b 1 x 1 n + b 2 x 2 n + + b m x mn
where n is the number of physico-mechanical parameters and m is the number of classifications of similar materials.
The above equations can be written in the following matrix form:
[   y 1   y 2   y n ] = b 0 + b 1 [   x 11   x 12   x 1 n ] + b 2 [   x 21   x 22   x 2 n ] + + b m [   x m 1   x m 2   x mn ]
That is, the matrix equation can be written as follows:
Y = B X
where
Y = [   y 1   y 2   y n ] , B = [   b 0 b 1   b m ] , X = [ 1 x 11 x m 1 1 x 12 x m 2 1 1 x 1 n x mn ] .
By solving the matrix equation, the regression coefficients of the multiple regression model and the multiple linear regression equation can be obtained.

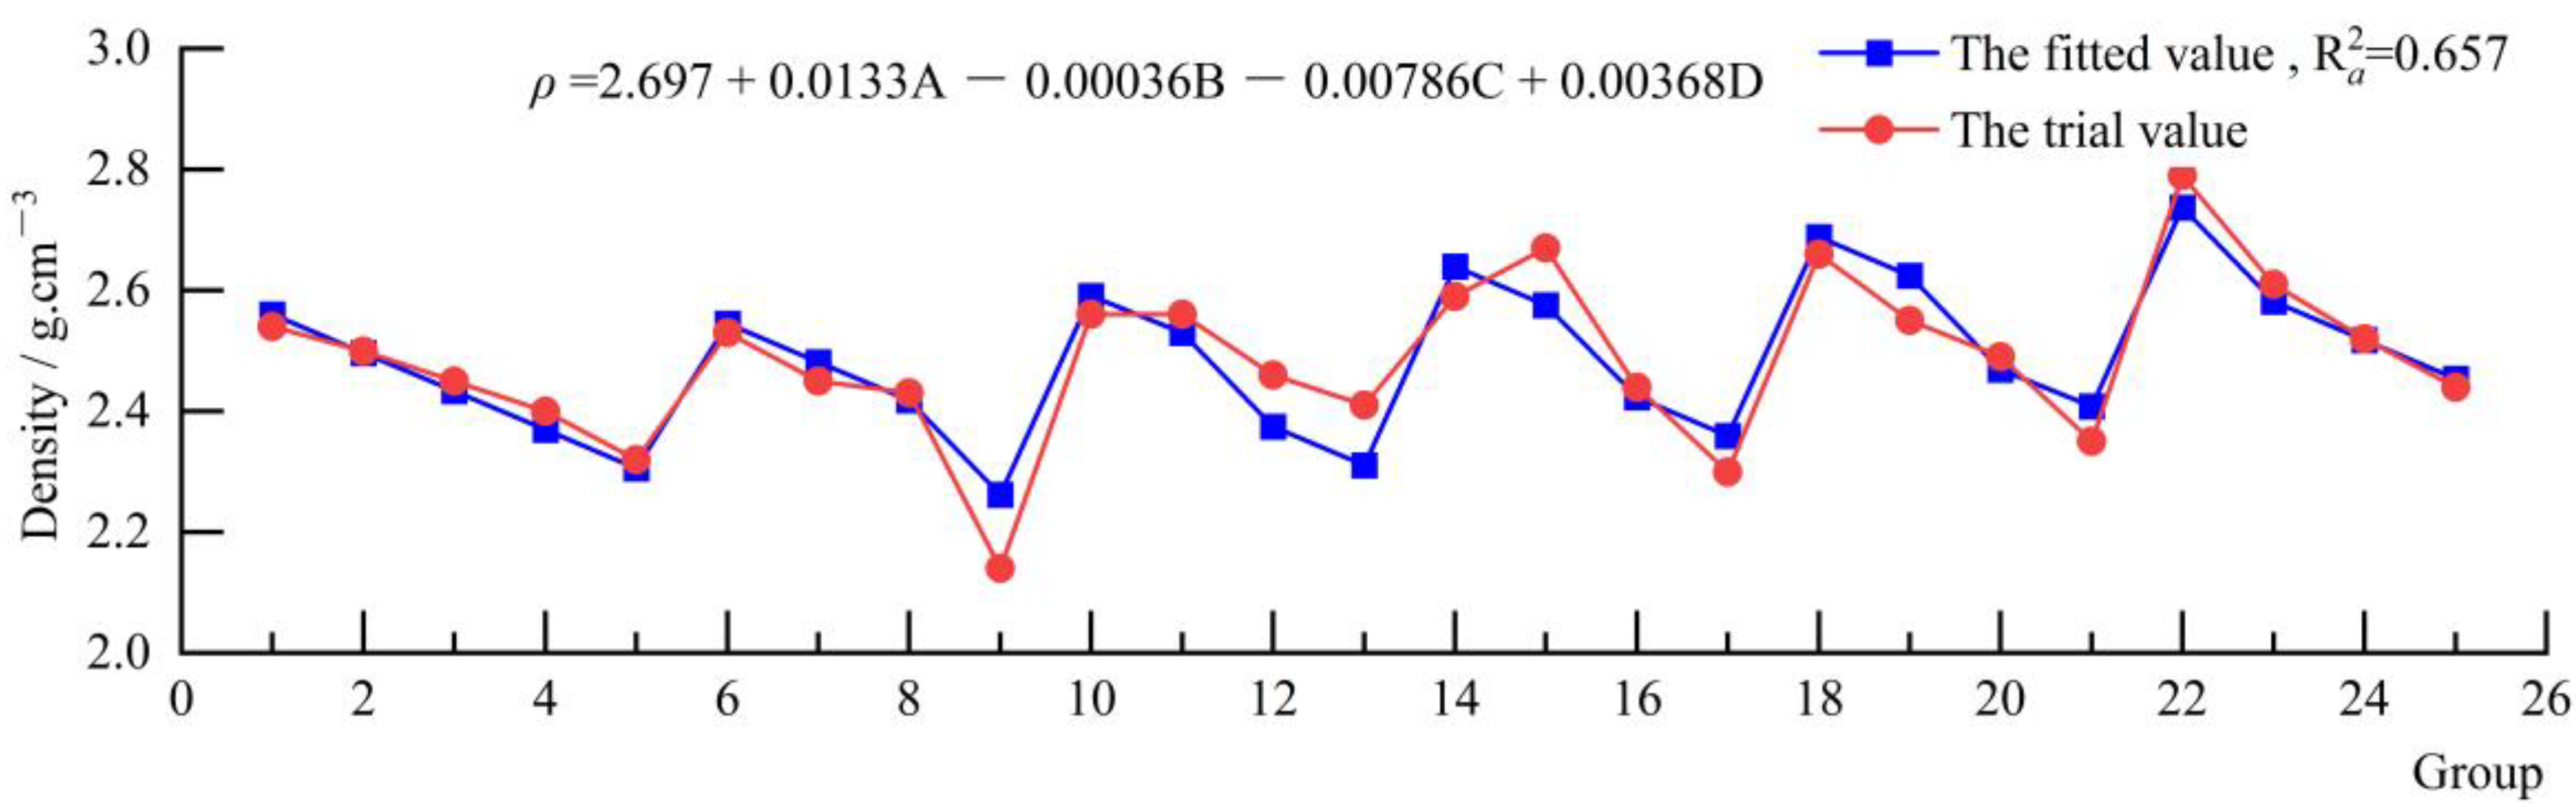
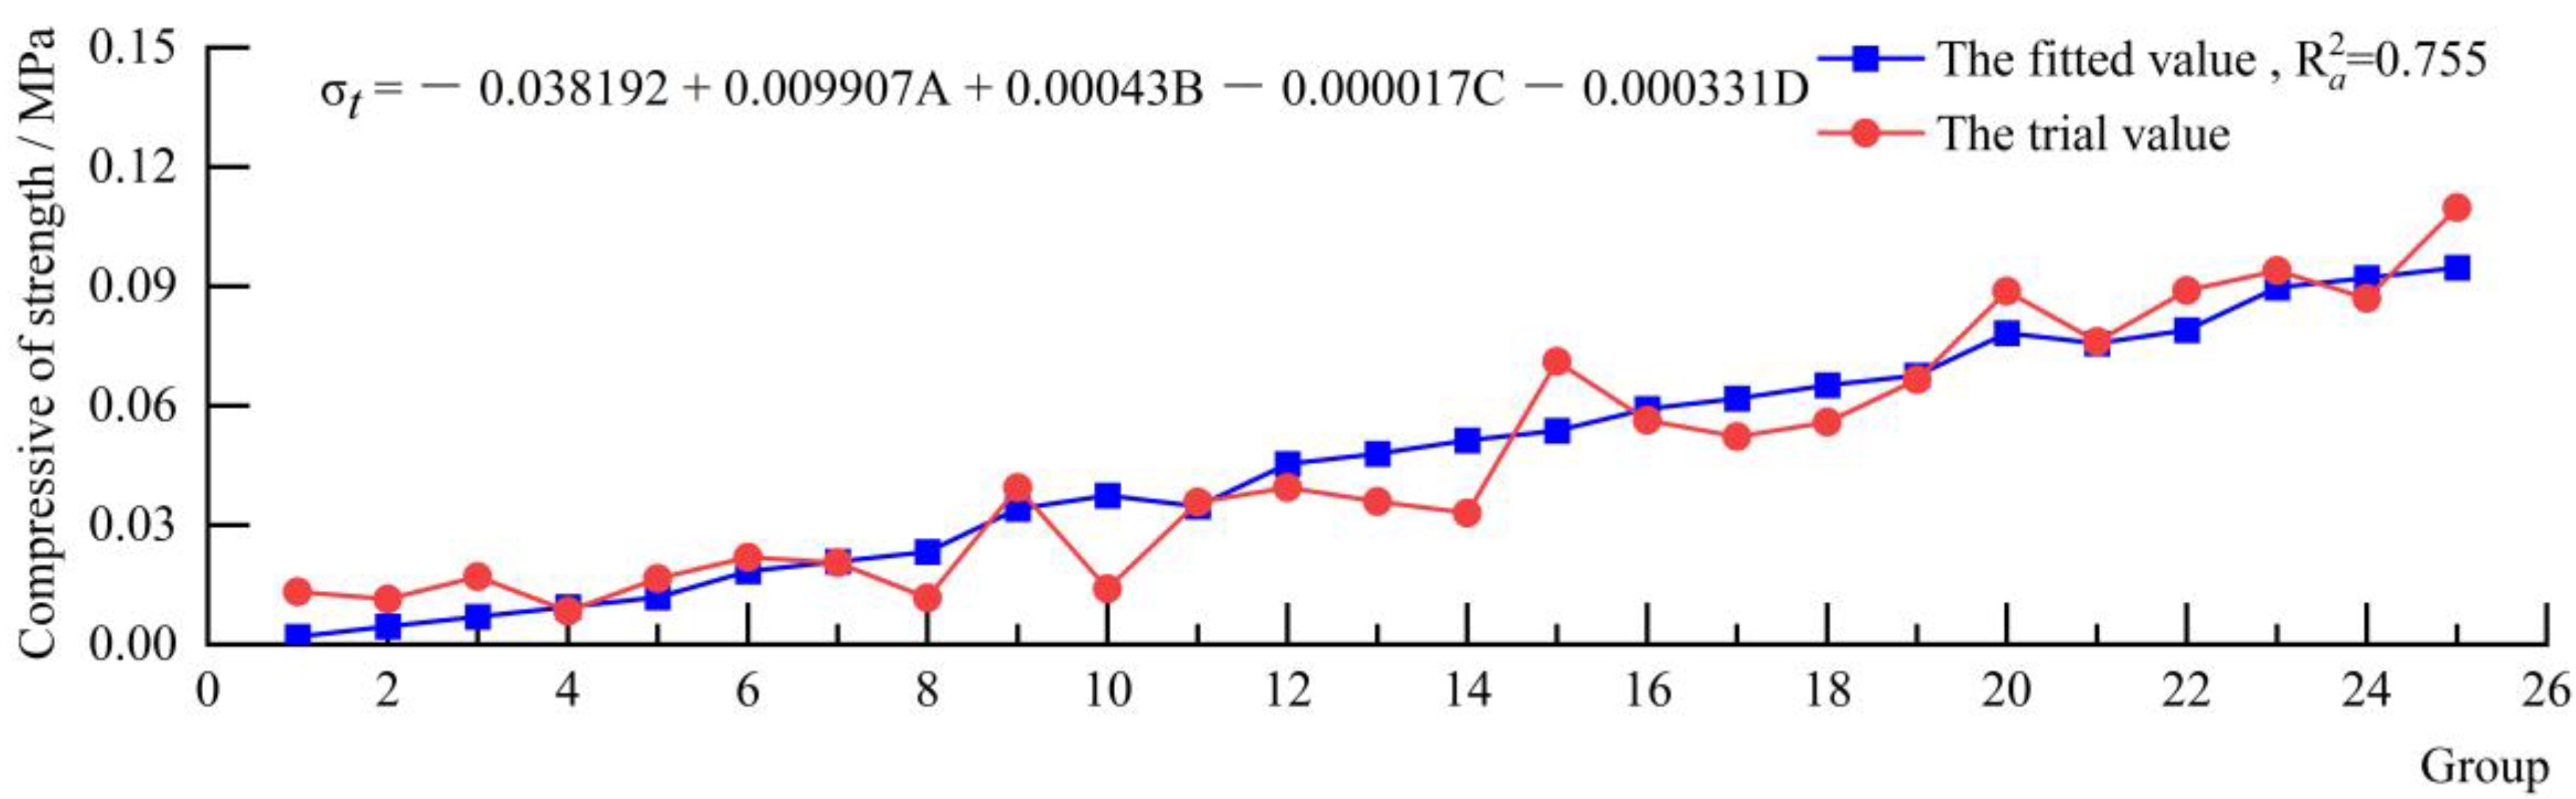
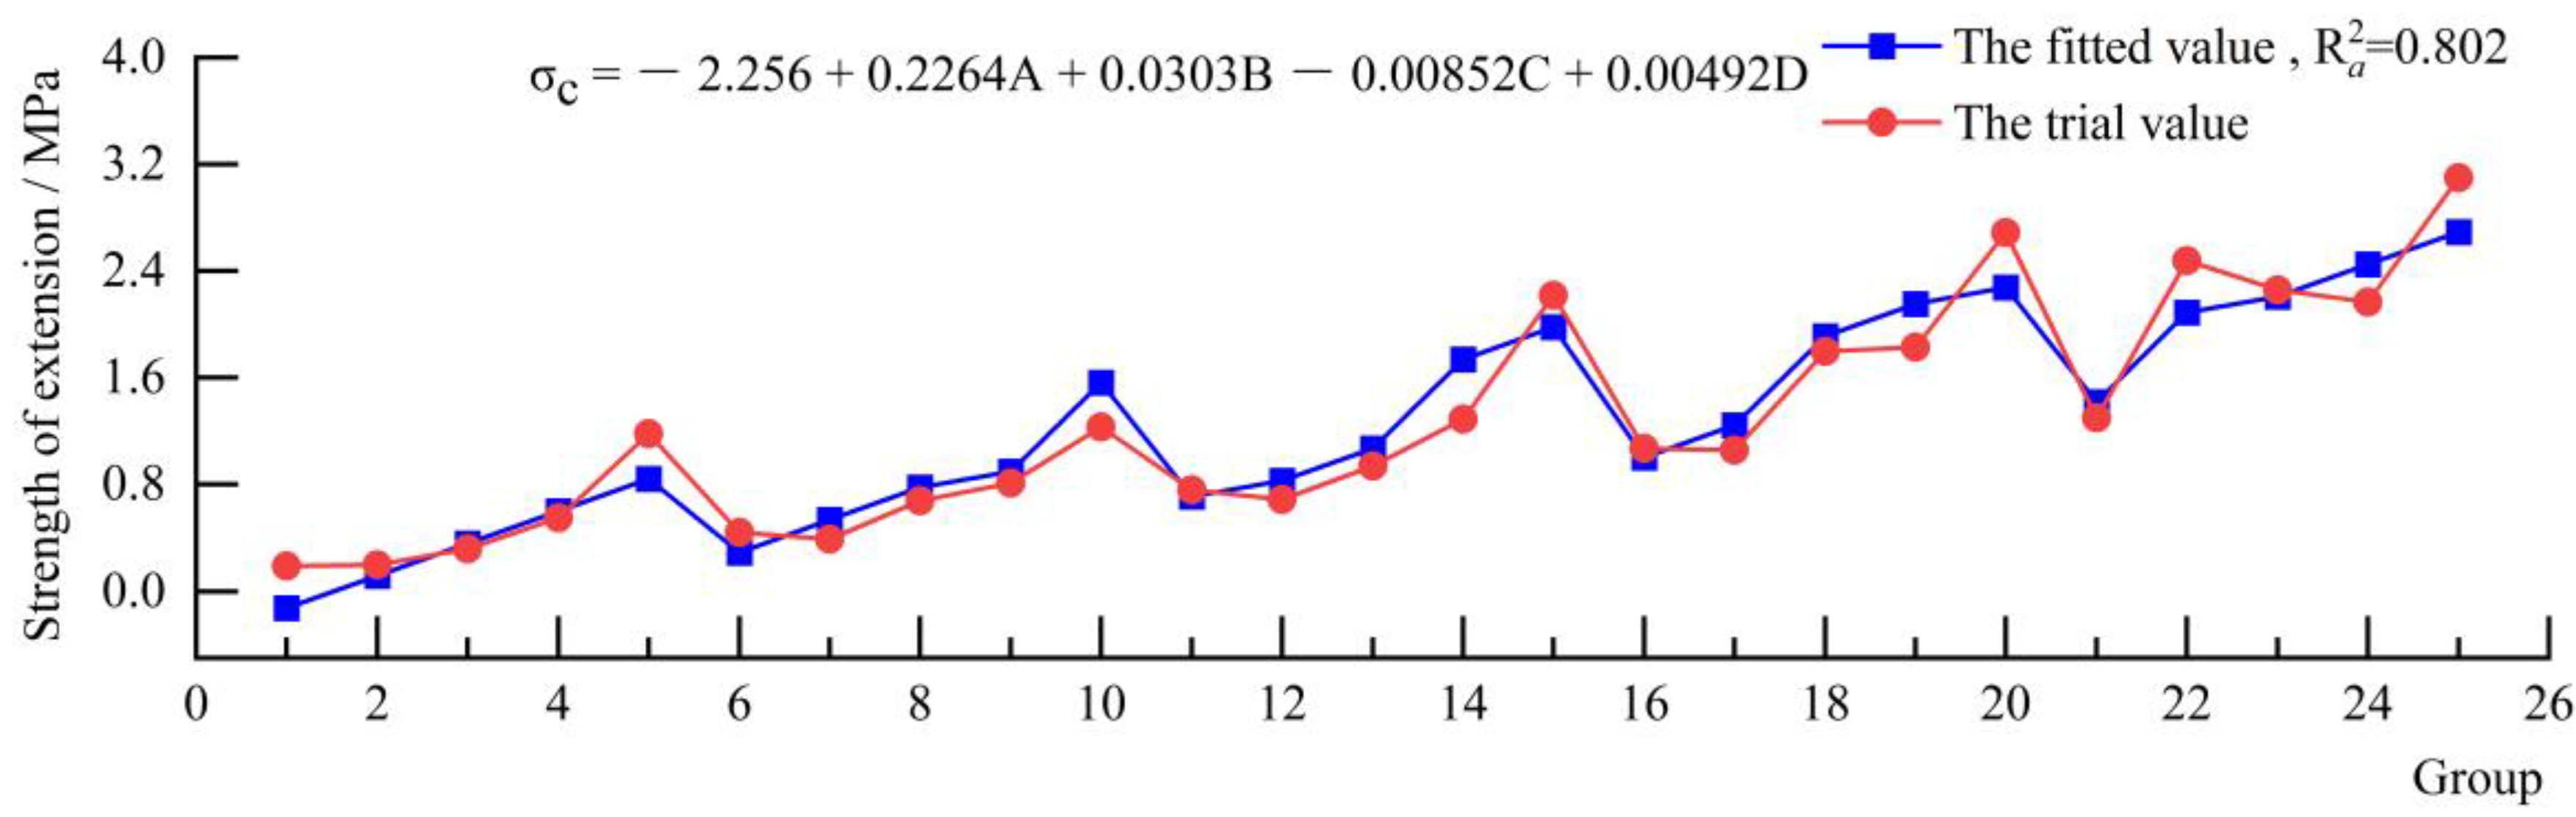
5.2. Multivariate Linear Fitting of Physico-Mechanical Parameters

According to the results of the orthogonal test and multivariate linear regression model, four relationships can be established between the database for the seven parameters (density, tensile strength, compressive strength, cohesive force, internal friction angle, dynamic shear modulus and dynamic elastic modulus) and the four variables (cementing material/solid materials (A), gypsum cementing material (B), quartz sand (C) and ferric concentrate powder/(barite powder + ferric concentrate powder) (D). Multivariate linear fitting by SPSS software was used to determine the model of each parameter. The formula in Figure 4, Figure 5, Figure 6, Figure 7, Figure 8, Figure 9 and Figure 10 expresses the corresponding relationship between seven physico-mechanical parameters and four groups of similar material ratios, and the value before the four groups of similar material ratios indicates the influence degree of this factor on the parameters. The red dashed line represents the test value in the orthogonal test, and the blue dashed line represents the value calculated by fitting the above formula. Since there were many variables in the multiple linear regression model, the modified determination coefficient ( R a 2 ) was used to reflect the fitting degree of the model.
(1)
Multivariate linear fitting of static parameters
As shown in Figure 4, Figure 5, Figure 6, Figure 7 and Figure 8, the values of density, tensile strength, compressive strength, cohesion and internal friction angle obtained by the fitting formula were relatively consistent with those obtained through the test, and the determination coefficients were all greater than 0.6, among which the maximum determination coefficient of compressive strength was 0.802. The fitting formula well reflected the corresponding relationship between static parameters and proportions of ingredients in the model materials.
(2)
Multivariate linear fitting of dynamic parameters
As shown in Figure 9 and Figure 10, the values of the dynamic shear modulus and dynamic elastic modulus obtained by the fitting formula were consistent with those obtained by experiments, and their determination coefficients were greater than 0.75. Overall, the determination coefficients of the dynamic parameters were larger than those of the static parameters, and the fitting formula well reflected the corresponding relationship between the dynamic parameters and proportions of components in the model materials.

5.3. Significance Test of Multiple Linear Regression Equation

(1)
Hypothesis testing
In the process of multiple linear regression analysis, the basic assumptions of multiple linear regression analysis should be satisfied. The most important is the independence of samples and the absence of collinearity between samples. The two hypotheses are verified by Durbin–Watson’s principle and the variance inflation coefficient. The closer the Durbin–Watson value is to 2.0, the stronger the independence; the closer the variance inflation factor value is to 1.0, the weaker the collinearity. The process is not shown here, just the results, as shown in the following Table 4.
Table 4 shows that the Durbin–Watson values of the seven parameters are all close to 2.0, basically meeting the requirements of mutual independence. Meanwhile, the VIF of the seven parameters is 1.0, and there is no autocorrelation among them. In summary, this analysis basically meets the basic assumption of the multiple linear regression equation.
(2)
Significance testing
The model obtained through multiple linear regression analysis must pass a certain significance test for verification to determine whether the relationship between the two has good significance. If there is no good significance between the two, then there is no correlation between the dependent variable y and xi. In the analysis, the whole model was mainly considered to configure the required similar materials, so the significance test of the model was mainly considered here, and the significance of each parameter was no longer considered. In this paper, the significance of the regression equation was tested as follows.
The significance test of the regression equation generally refers to the F statistic as the constraint condition of the model, and the expression of the F statistic is
F = S S l / m S S r / ( n m 1 )
In the above formula, SSl is the sum of squares of regression, SSr is the sum of squares of residuals, m is the number of degrees of freedom, and the F statistic should obey the distribution of F(m, nm − 1), namely, obey the significance level α, which can be determined by the following expression:
P { | F | F 1 α , m , n - m - 1 | H 0 | = α }
The above formula is the expression of the significance test. If it satisfies | F | F 1 α , m , n - m - 1 , then it indicates that the relationship between y and xi has good significance, that is, the model has good significance.
The statistical quantity F of each physical quantity and the significance of each variable were calculated by the significance test theory of the regression equation mentioned above, and the calculation results are shown in Table 5.
Table 5 shows that the significance of all parameters is much less than 0.001, and there is a good correlation between the independent variable and multiple dependent variables, so there is a clear correlation between the dependent variable y and xi. The obtained physical model can reflect the relationship between various physical parameters and multiple independent variables to a large extent.

6. Practical Application of the Proportions of Components in a Model Material Similar to an Actual Material

6.1. Engineering Geology Overview

The selected rock slope was located in the section from Shouwang (Yunnan–Guizhou boundary) to Hongshan (Yunnan–Sichuan boundary) on the highway from Duyun to Shangri-La of G7611, with complex geological conditions and a slope of 40°. The bedrock was sandstone, and the occurrence of the rock was 303°∠15°. The rock level was almost the same as the slope facing surface, which was a bedding slope. Two groups of joint fractures developed in the rock: joint 1 at 50°∠70° and joint 2 at 160°∠78°. According to the Chinese Ground Motion Parameter Zoning Map GB18306-2015, the peak acceleration of ground motion in this area was 0.15 g, corresponding to the basic earthquake intensity of VIII, and the ground motion reflected the period of the Put sign of 0.45 s. The physico-mechanical parameters for sandstone samples collected from this site are shown in Table 6.

6.2. Configuration of Similar Materials

The dynamic testing of a geotechnical model with a similarity ratio of 1:49 was used to analyse the stability of the slope under dynamic loading to provide a basis for slope protection. That is, model materials similar to sandstone materials in this area were designed in accordance with 1:49. The physical parameter values of the model materials can be obtained by the similarity principle, as shown in Table 7.
According to the values of the physico-mechanical parameters of the model materials, combined with the relevant fitting formula and sensitivity analysis results of each factor, MATLAB programming was used to calculate the optimal ratio of components in the model material using the following formula:
S = n = 1 7 ( y - y 0 y 0 ) 2
where y0 represents the value of the required physico-mechanical parameter, y represents the value of the fitting formula with different proportions of components, and S represents the error between the fitting value and the actual value with different proportions of components. When S is the smallest, the optimal regression coefficient value can be obtained. Percentage integer digits are reserved for convenient configuration. Through MATLAB calculations, the results for the proportions were as follows: cementing material/solid material 5%, gypsum/cementing material 76%, quartz sand/aggregate 28% and ferric powder/(barite powder + ferric powder) 64%. The proportion of each material in the solid material is shown in the table below. The physico-mechanical parameters of the rock samples were obtained by splitting, uniaxial and shear tests.

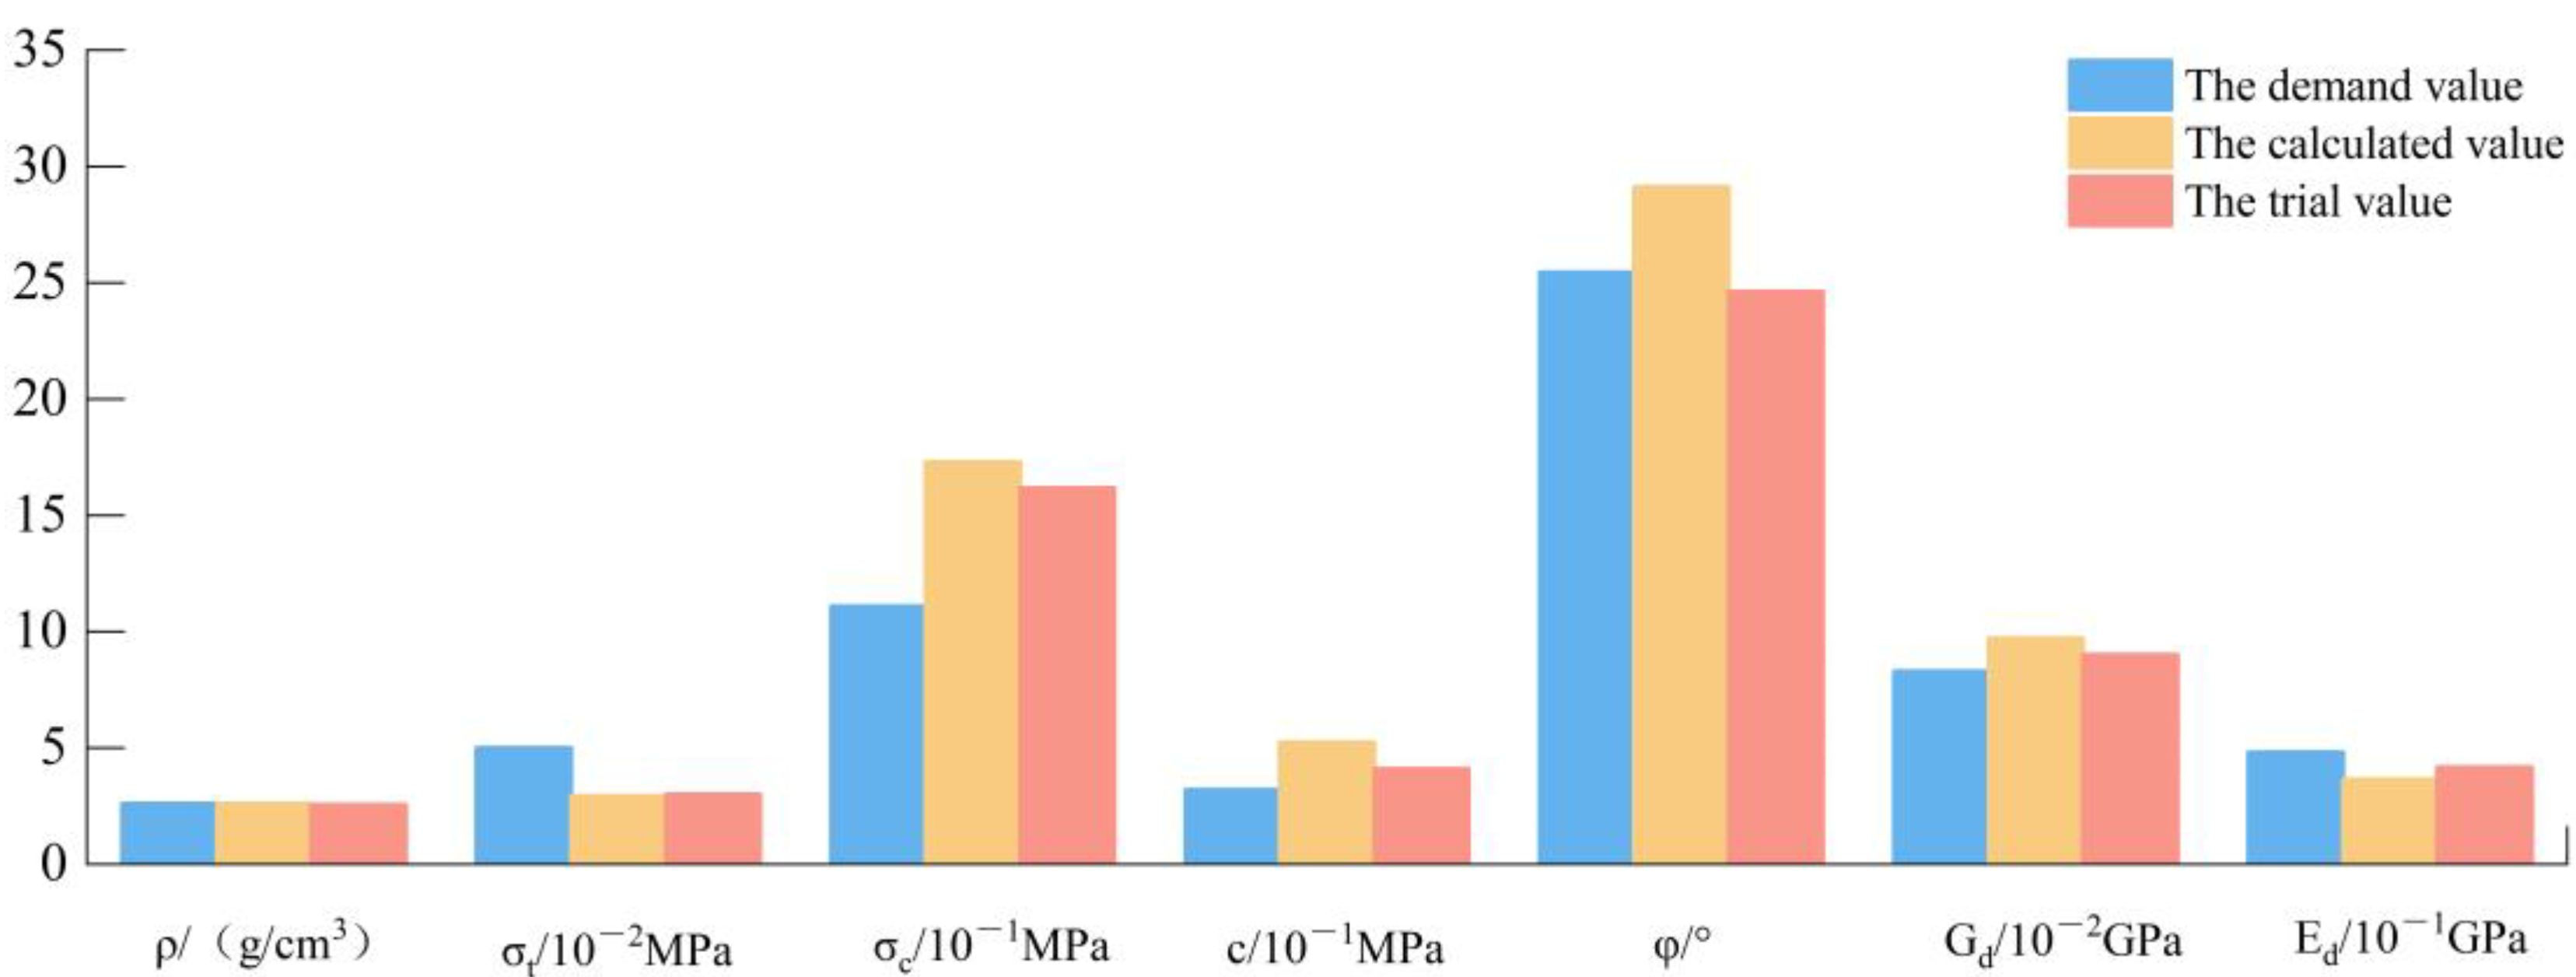
6.3. Comparison and Verification of Raw Rock and Similar Materials

(1)
Physical parameter verification
Model rock samples were configured using the ratio in Table 8. Splitting, uniaxial and shear tests were conducted to obtain relevant physico-mechanical parameters. Figure 11 shows the required values based on the similarity ratio, the values calculated through the model formula and the values measured in the laboratory test. The model materials generally met the needs of the shaking table model test.
(2)
Failure mode verification
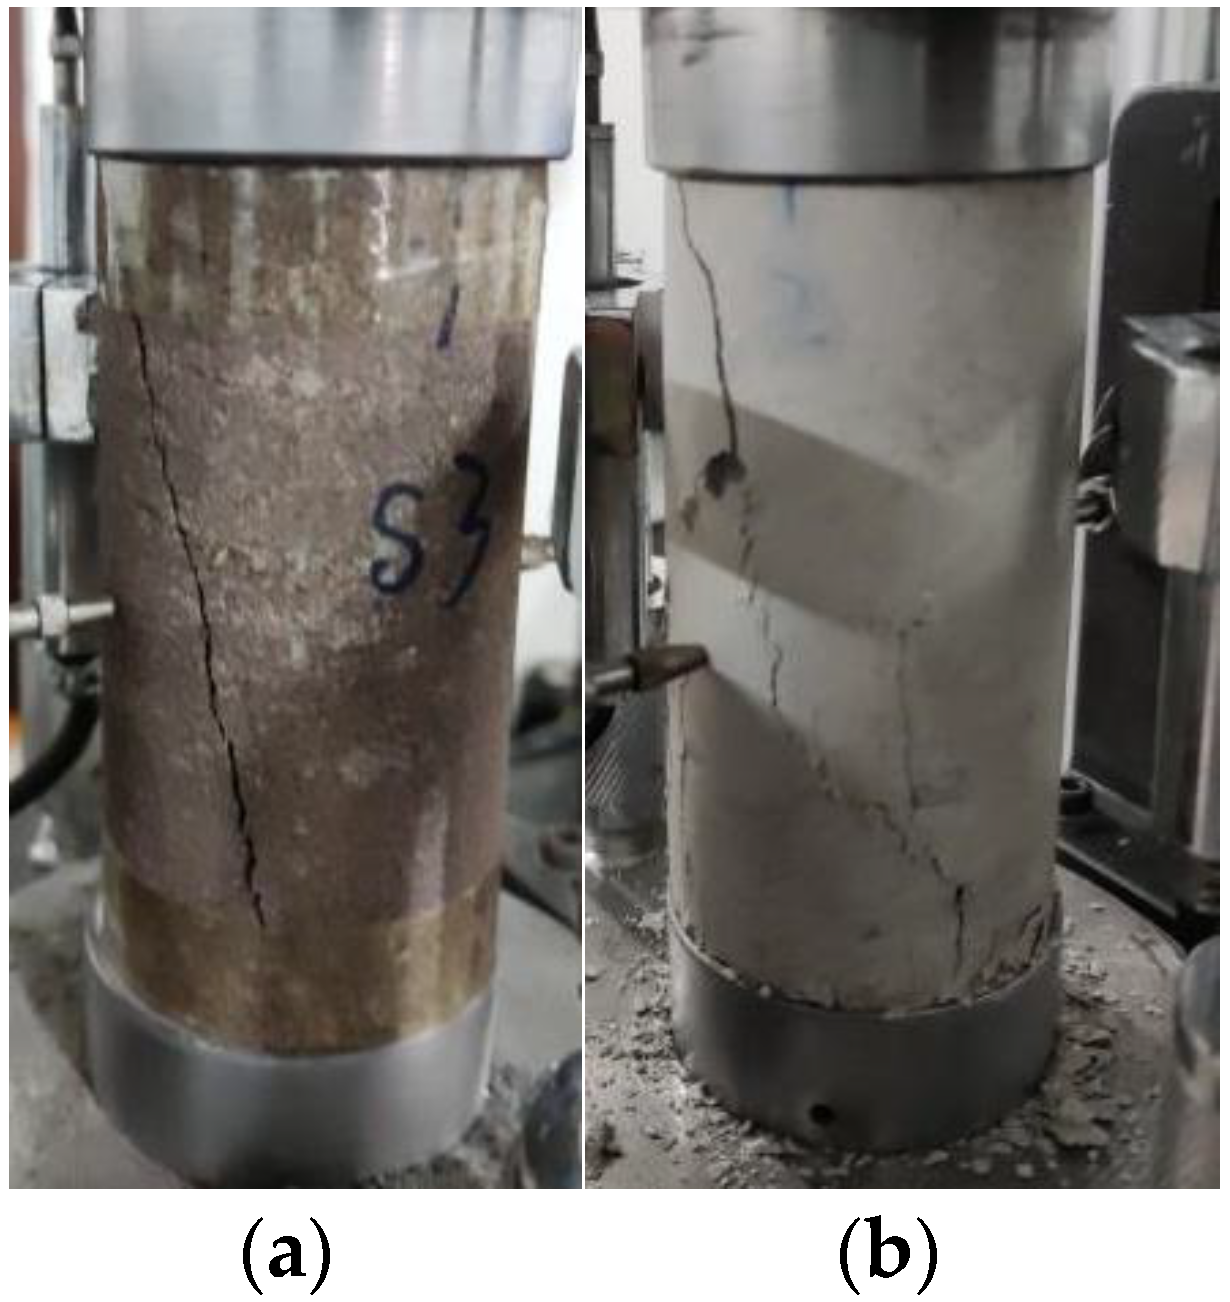
As shown in Figure 12, the failure modes of sandstone samples and samples of model materials observed in the uniaxial compression test were consistent, mainly shear failure with partial conical surfaces. The failure mode of the model material was basically consistent with that of real sandstone material in the uniaxial compression test.
(3)
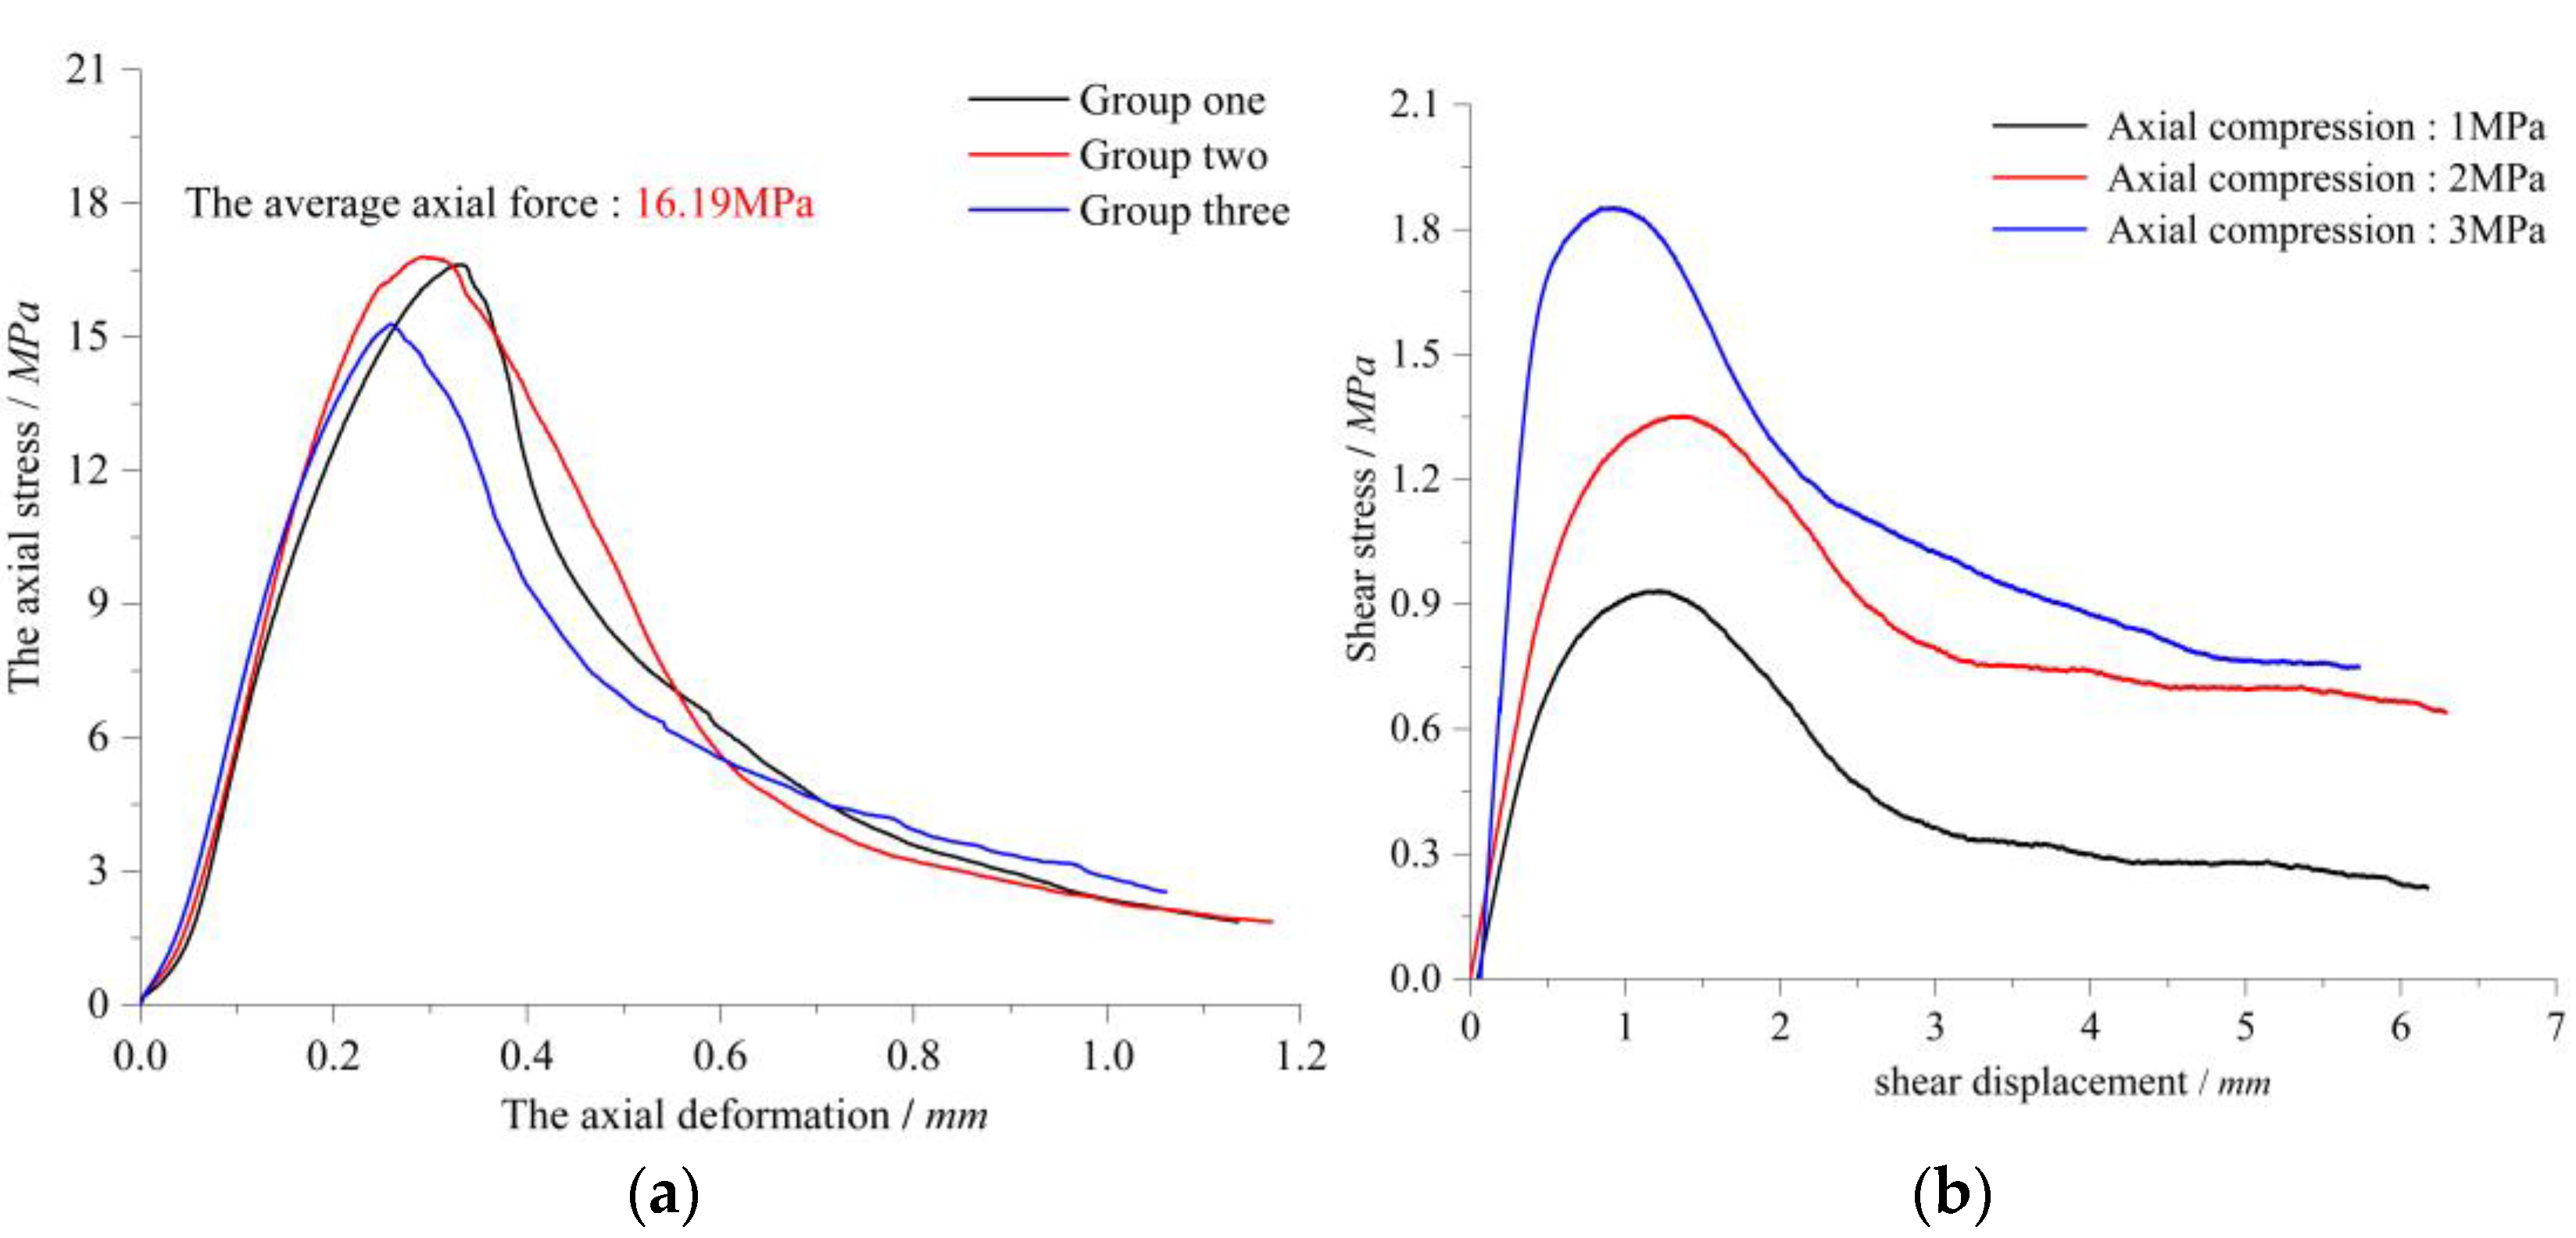
Verification of failure process
As shown in Figure 13, during the process of uniaxial compression of model materials similar to sandstone, the model material underwent an elastic stage and an elastic–plastic stage and finally reached the brittle failure stage. In the direct shear process of model materials similar to sandstone, with the increase in axial force, the peak shear strength and the residual strength increased and were much less than the peak shear force.

7. Conclusions

Based on orthogonal design and similarity theory, we developed a model material similar to actual rock from the field for the shaking table model test. The original rock; the similarity relations among the selection of quartz sand, ferric powder, barite, gypsum and cement configuration of the model material; and the sensitivity of the physico-mechanical parameters to the influence factors were analysed, and multiple linear regression analysis was performed to calculate the physico-mechanical parameters and the model with similar material proportions. The main conclusions are as follows:
(1)
Four factors, including cementing material/solid material, gypsum/cementing material, quartz sand/aggregate and ferric powder/(barite powder + ferric powder), were designed, and orthogonal tests were conducted with five levels for each factor. Seven parameters, including density, tensile strength, compressive strength, dynamic shear modulus, dynamic elastic modulus, cohesion and internal friction angle, were obtained by ultrasonic, uniaxial compression, direct shear and splitting tests. Among them, the dynamic shear modulus and dynamic elastic modulus most effectively reflected the changes in the dynamic parameters of rock.
(2)
Samples of model materials composed of gypsum, cement, quartz sand, ferric powder and barite powder met the similar material requirements for sandstone in a large range of model tests.
(3)
The analysis of the sensitivity of various factors showed that the density was mainly influenced by barite powder, ferric powder affected the tensile strength and compressive strength, the internal friction angle was mainly affected by the cementation material proportion, the cohesive force of the main was affected by gypsum and the quartz-sand ratio, and the dynamic shear modulus and dynamic modulus of elasticity were mainly affected by the cementation material proportion.
(4)
The quantitative relationship between the physico-mechanical parameters and proportions of components in the model material was obtained through sensitivity analysis and multiple linear regression analysis of influencing factors. The proportions of components in model materials obtained through this calculation efficiently configured the required model materials. The failure mode, failure process and physical parameters of the model materials simulated the behaviour of the sandstone samples taken from the field.

Author Contributions

Experimental design (J.T. and C.A.); Experimental analysis (J.T. and Z.S.); Data were analyzed (Q.W. and R.K.); writing—original draft preparation (J.T.); funding acquisition (L.W. and Q.W.). All authors have read and agreed to the published version of the manuscript.

Funding

This research was funded by the Chinese National Key R&D Program (No. 2019YFC1509705), the National Natural Science Foundation of China (Grant Nos. 41931295, 41877258, 41877259).

Institutional Review Board Statement

Not applicable for studies not involving humans or animals.

Informed Consent Statement

Human studies are not involved in this paper.

Data Availability Statement

The data presented in this study are available on request from the corresponding author.

Conflicts of Interest

The authors declare no conflict of interest.

References

  1. Feder, T. Geological hazards are focus of Chinese research initiatives. Phys. Today 2006, 59, 31–32. [Google Scholar] [CrossRef]
  2. Cui, P.; Chen, X.Q.; Zhu, Y.Y.; Su, F.H.; Wei, F.Q.; Han, Y.S.; Liu, H.J.; Zhuang, J.Q. The Wenchuan Earthquake (12 May 2008), Sichuan Province, China, and resulting geohazards. Nat. Hazards 2011, 56, 19–36. [Google Scholar] [CrossRef]
  3. Huang, R.; Li, W. Postearthquake landsliding and long-term impacts in the Wenchuan earthquake area, China. Eng. Geol. 2014, 182, 111–120. [Google Scholar] [CrossRef]
  4. Wang, J.; Schweizer, D.; Liu, Q.; Su, A.; Hu, X.; Blum, P. Three-dimensional landslide evolution model at the Yangtze River. Eng. Geol. 2021, 292, 106275. [Google Scholar] [CrossRef]
  5. Liu, H.X.; Xu, Q.; Xu, H.B.; Zou, W. Shaking table model test on slope dynamic deformation and failure. Rock Soil Mech. 2011, 32, 334–339. [Google Scholar]
  6. Yang, G.X.; Ye, H.L.; Wu, F.Q.; Qi, S.; Dong, J. Shaking table model test on dynamic response characteristics and failure mechanism of antidip layered rock slope. Chin. J. Rock Mech. Eng. 2012, 31, 2214–2221. [Google Scholar]
  7. Li, L.Q.; Ju, N.P.; Zhang, S.; Deng, X.X. Shaking table test to assess seismic response differences between steep bedding and toppling rock slopes. Bull. Eng. Geol. Environ. 2019, 78, 519–531. [Google Scholar] [CrossRef]
  8. Sun, Z.; Wang, L.; Zhou, J.Q.; Wang, C. A new method for determining the hydraulic aperture of rough rock fractures using the support vector regression. Eng. Geol. 2020, 105618. [Google Scholar] [CrossRef]
  9. Li, H.; Guo, G.; Zha, J. Study on time-varying characteristics of similar material model strength and the regulation measures. Environ. Earth Sci. 2017, 76, 518. [Google Scholar] [CrossRef]
  10. Zheng, L.; Wang, L.; Zhu, L.; Fan, B.; Dong, M.; Sun, Z.; An, C. Analytical model of the shear behaviors of bolted rough joints based on the dilation effect and surface abrasion. Eng. Geol. 2021, 294, 106399. [Google Scholar] [CrossRef]
  11. Zhang, N.; Li, S.C.; Li, M.T. Development of a new rock similar material. J. Shandong Univ. (Eng. Sci.) 2009, 39, 149–154. [Google Scholar]
  12. Han, B.L.; Zhang, W.C.; Yang, C.F. Study on geomechanical model materials (MIB). Northwest Hydropower Technol. 1983, 3, 49–54. [Google Scholar]
  13. Li, Z.; Luo, G.; Wang, A. Prepn of Model Material for Model Test. Chinese Patent CN02116676.5, 16 October 2002. [Google Scholar]
  14. Ma, F.P.; Li, Z.K.; Luo, G.G. NIOS model material and its application in geomechanical similarity model Test. J. Hydropower 2004, 23, 48–51. [Google Scholar]
  15. Wang, H.P.; Li, S.C.; Zhang, Q.Y.; Li, Y.; Guo, X. Development of a new geomechanical similar material. Chin. J. Rock Mech. Eng. 2006, 25, 1842–1847. [Google Scholar]
  16. Li, Y.; Zhu, W.S.; Wang, H.P.; Li, S.C.; Zhang, Q.Y. Mechanical test and application of new geotechnical similar materials. Tunn. Constr. 2007, 197–200. [Google Scholar]
  17. Zhang, Q.Y.; Li, S.C.; Guo, X.H.; Li, Y.; Wang, H.P. Development and application of iron-crystal sand cementing new geotechnical similar material. Rock Soil Mech. 2008, 29, 2126–2130. [Google Scholar]
  18. Ning, Y.B.; Tang, H.M.; Zhang, B.C.; Shen, P.W.; Zhang, G.C.; Xia, D. Study on ratio of similar materials in Rock based on Orthogonal Design and Application of Physical Model Test of Bottom Friction. Rock Soil Mech. 2020, 41, 2009–2020. [Google Scholar]
  19. Zuo, B.C.; Chen, C.X.; Liu, C.H.; Shen, Q.; Xiao, G.F. Research on similar material of slope simulation experiment. Rock Soil Mech. 2004, 25, 1805–1808. [Google Scholar] [CrossRef]
  20. Wu, J.H.; Yuan, Z.H.; Zhou, Y.F. Experimental study on similar mate rials for simulating marl of ancient landslide. J. Chongqing Jiaotong Univ. (Nat. Sci. Ed.) 2019, 38, 81–86. [Google Scholar]
  21. Liu, Y.L.; Zhou, W.Z.; Guo, B.; Ma, Q.; Xiao, H. Study on similar materials of marl in similarity model experiment. Chin. J. Rock Mech. Eng. 2020, 39, 2795–2803. [Google Scholar]
  22. Yang, M.; Yang, Y.; Zhao, B. Study on the Proportion of Conglomerate Similar Materials Based on the Orthogonal Test. Shock Vib. 2021, 2021, 6657323. [Google Scholar] [CrossRef]
  23. Liu, H.; Qiu, T.; Xu, Q. Dynamic acceleration response of a rock slope with a horizontal weak interlayer in shaking table tests. PLoS ONE 2021, 16, e0250418. [Google Scholar] [CrossRef] [PubMed]
  24. Xu, Q.; Liu, H.X.; Zou, W.; Fan, X.; Chen, J. Large-scale shaking table test study of acceleration dynamic responses characteristics of slopes. Chin. J. Rock Mech. Eng. 2010, 29, 2420–2428. [Google Scholar]
  25. Roscoe, K.H.; Poorooshasb, H.B. A Fundamental Principle of Similarity in Model Tests for Earth Pressure Problems. Soil Mech. Found. Eng. 1963, 1, 134–140. [Google Scholar]
  26. Flaga, A. Basic principles and theorems of dimensional analysis and the theory of model similarity of physical phenomena. Czasopismo Techniczne 2016, 112, 241–272. [Google Scholar] [CrossRef]
  27. Xu, G.X.; Yao, L.K.; Gao, Z.N.; Li, Z. Dynamic Characteristics and Response of slope based on large-scale Shaking table Model Test. Chin. J. Rock Mech. Eng. 2008, 624–632. [Google Scholar] [CrossRef]
  28. Huang, R.Q.; Li, G.; Ju, N.P. Shaking table test of strong seismic response of layered rock slope. Chin. J. Rock Mech. Eng. 2013, 32, 865–875. [Google Scholar]
  29. Wang, L.; Wang, C.; Khoshnevisan, S.; Ge, Y.; Sun, Z. Determination of two-dimensional joint roughness coefficient using support vector regression and factor analysis. Eng. Geol. 2017, 231, 238–251. [Google Scholar] [CrossRef]
  30. Wu, Q.; Xu, Y.; Tang, H.; Fang, K.; Jiang, Y.; Liu, C.; Wang, L.; Wang, X.; Kang, J. Investigation on the shear properties of discontinuities at the interface between different rock types in the Badong formation, China. Eng. Geol. 2018, 245, 280–291. [Google Scholar] [CrossRef]
  31. Wu, Q.; Jiang, Y.; Tang, H.; Luo, H.; Wang, X.; Kang, J.; Zhang, S.; Yi, X.; Fan, L. Experimental and Numerical Studies on the Evolution of Shear Behaviour and Damage of Natural Discontinuities at the Interface Between Different Rock Types. Rock Mech. Rock Eng. 2020, 53, 3721–3744. [Google Scholar] [CrossRef]
  32. Yao, G.Q.; Zhi, X. Experimental study on orthogonal design of rock mass similar materials. J. Railw. Sci. Eng. 2018, 15, 902–910. [Google Scholar]
  33. Geng, X.; Zhang, Z. Study on Preparation Methods for Similar Materials of Sandstone. Chin. J. Undergr. Space Eng. 2015, 11, 23–28. [Google Scholar]
  34. Popescu, C.; Giuclea, M. A model of multiple linear regression. Proc. Rom. Acad. Ser. A Math. Phys. Tech. Sci. Inf. Sci. 2007, 8, 137–144. [Google Scholar]
Figure 1. Samples of model materials.
Applsci 12 05344 g001
Figure 2. Range analysis of static physico-mechanical parameters. (a) Density; (b) compressive strength; (c) strength of extension; (d) cohesive strength; (e) internal friction angle.
Applsci 12 05344 g002
Figure 3. Range analysis of the dynamic physico-mechanical parameters. (a) Dynamic shear modulus; (b) dynamic elasticity modulus.
Applsci 12 05344 g003
Figure 4. Comparison of fitted and experimental results for density.
Applsci 12 05344 g004
Figure 5. Comparison of fitted and experimental results for tensile strength.
Applsci 12 05344 g005
Figure 6. Comparison of fitted and experimental results for compressive strength.
Applsci 12 05344 g006
Figure 7. Comparison of fitted and experimental results for cohesion.
Applsci 12 05344 g007
Figure 8. Comparison of fitted and experimental results for internal friction angle.
Applsci 12 05344 g008
Figure 9. Comparison of fitting and experimental results for dynamic shear modulus.
Applsci 12 05344 g009
Figure 10. Comparison of fitting and experimental results for dynamic elastic modulus.
Applsci 12 05344 g010
Figure 11. Comparison of physical parameters.
Applsci 12 05344 g011
Figure 12. Comparison of failure modes under uniaxial compression. (a) Sandstone sample; (b) model material.
Applsci 12 05344 g012
Figure 13. Comparison of failure evolution process. (a) Uniaxial compression curve; (b) direct shear curve.
Applsci 12 05344 g013
Table 1. Range of physico-mechanical parameters of sandstone [33].
Rockρ/g·cm−3σc/MPaσt/MPaE/GPac/MPaφ/°
Sandstone2.17~2.702.5~2004~250.63~12.54~5025~50
Table 2. Design of the orthogonal test for the composition of model materials.
Group NumberAnalytical Factor
A/%B/%C/%D/%
12602515
22703520
32804525
42905530
521006535
64603525
74704530
84805535
94906515
1041002520
116604535
126705515
136806520
146902525
1561003530
168605520
178706525
188802530
198903535
2081004515
2110606530
2210702535
2310803515
2410904520
25101005525
Table 3. Orthogonal test results for model materials similar to sandstone.
Groupρ/g·cm−3σt/MPaσc/MPac/MPaφ/°Gd/GPaEd/GPa
12.540.01320.190.1536.630.02430.1220
22.500.01140.200.1938.060.08580.2565
32.450.0170.320.5645.000.07230.2165
42.400.00830.550.6862.490.07920.2365
52.320.01661.181.1058.510.12950.4810
62.530.02200.440.2834.760.11200.3345
72.450.02060.390.3439.410.10330.3080
82.430.01180.680.5541.080.14660.4185
92.140.03940.810.9746.360.19550.5140
102.560.01401.230.7332.270.18890.4655
112.560.03580.760.5435.390.19300.5750
122.460.03940.690.5540.320.25200.7500
132.410.03600.940.8243.100.21750.6460
142.590.03301.290.9233.190.23800.4120
152.670.07112.221.2331.170.29000.7500
162.440.05641.070.5637.120.33650.7840
172.300.05221.060.6537.370.28250.8385
182.660.05591.800.9821.440.24650.7340
192.550.06661.830.7227.260.21500.6410
202.490.08882.691.0625.720.31800.9430
212.350.07621.300.8140.430.27350.8110
222.790.08892.480.5818.770.31650.9410
232.610.09402.261.0828.390.31900.9455
242.520.08692.171.2425.410.37751.1200
252.440.10983.101.7033.560.42151.3350
Table 4. Basic hypothesis verification.
Indicatorsρ/g·cm−3σt/MPaσc/MPac/MPaφ/°Gd/GPaEd/GPa
Durbin–Watson(D-W)1.8101.9252.1581.8901.9311.8601.951
Variance inflation factor (VIF)1.0001.0001.0001.0001.0001.0001.000
Table 5. Significance analysis table of the regression equation.
Indicatorsρ/g·cm−3σt/MPaσc/MPac/MPaφ/°Gd/GPaEd/GPa
F27.2841.3553.0228.6030.1053.5751.76
Sig7.52 × 10−82.12 × 10−92.29 × 10−105.06 × 10−83.30 × 10−82.08 × 10−102.85 × 10⁻¹⁰
Table 6. Physico-mechanical parameters of samples of siltstone in the bar service area.
ρ/g·cm−3σt/MPaσc/MPac/MPaφ/°Gd/GPaEd/GPa
Actual mean2.602.6554.5815.7225.454.0523.50
Table 7. Physico-mechanical parameters of model materials similar to the samples collected from the site.
Physico-Mechanical Parametersρ/g·cm−3σt/MPaσc/MPac/MPaφ/°Gd/GPaEd/GPa
Similar material value2.600.051.110.3225.450.080.48
Table 8. Proportions of components in the model material similar to the actual samples from the site.
MaterialGypsumCementQuartz SandBaritePure Iron Powder
Percentage3.80%1.20%26.60%43.14%24.26%
Publisher’s Note: MDPI stays neutral with regard to jurisdictional claims in published maps and institutional affiliations.

