Article

Influence of Carbon Dioxide Curing on the Corrosion Resistance of Reinforced Cement Mortar under the External Erosion of NaCl Freeze–Thaw Cycle

1
College of Civil Engineering and Architecture, Harbin University of Science and Technology, Harbin 150080, China
2
School of Civil and Environmental Engineering, Ningbo University, Ningbo 315000, China
*
Authors to whom correspondence should be addressed.
Appl. Sci. 2022, 12(10), 5061; https://doi.org/10.3390/app12105061
Submission received: 15 April 2022 / Revised: 11 May 2022 / Accepted: 16 May 2022 / Published: 17 May 2022

Abstract

:
Carbon dioxide (CO2)-cured concrete is a novel material that can effectively reduce CO2 emissions in the atmosphere. However, limited research has been found to investigate the corrosion behavior of CO2-cured reinforced concrete. In this paper, the corrosion resistance of reinforced cement mortar is investigated. The mortars were cured in CO2 for 1 day~28 days. Water–cement ratios (w/c) of 0.3, 0.4 and 0.5 were designed. The corrosion resistance of inner steel bars was researched by the methods of ultrasonic velocity, electrical parameters (AC electrical resistance, Tafel curve method and AC impedance spectroscopy). Moreover, scanning electron microscope was selected for observing the micro-morphology of CO2-curing mortar. X-ray diffraction spectrum was used to characterize components of steel bars’ passive films. The results show that CO2 can effectively increase electrical resistivity and ultrasonic velocity, thus improving the corrosion resistance of reinforced cement mortar. The enhancement of carbon dioxide curing increases with the increasing w/c. The mass-loss rate, the electrical resistivity and the decreasing rate of ultrasonic velocity increase with the increasing sodium chloride freeze–thaw cycles, indicating the continuous increase in the corrosion degree of reinforcement. The corrosion deterioration degree of steel bars decreases with the increasing CO2-curing time. Specimens with w/c of 0.3 and 0.4 show the highest and lowest corrosion deterioration resistances after sodium chloride freeze–thaw cycles. Microscopic characterization found that CO2 curing could increase the corrosion resistance of the inner steel bars by improving the compactness of the cement matrix. Moreover, the iron oxides on the surface of the passivation film decreased after CO2 curing.

1. Introduction

With the cumulative emission into the atmosphere, the tremendous amount of carbon dioxide (CO2) has led to serious greenhouse effects and the of endangering human life [1,2,3]. Commonly, CO2 can be used for manufacturing high-value chemicals, such as In2O3 catalysts and light olefins overmixed with Fe-Co-K-Al oxide catalysts. In civil engineering, CO2-curing concrete, which can store the CO2 in concrete, may provide an effective method to alleviate this issue [4,5,6,7,8].
Alkaline substances in cement-based materials can react with CO2 to generate dense carbonate, and thus enhance cement-based materials’ mechanical properties and durability [9,10]. As pointed out in several pieces of research, CO2 curing on cement-based materials could effectively improve its mechanical properties [11,12]. Meanwhile, CO2 curing could decrease the chloride–ion penetration of the cement paste with mineral admixtures [13,14]. Cao et al. [15] reported that the mechanical properties and NaCl freeze–thaw resistance of the reactive powder concrete (RPC) produced by compound cement were improved by CO2 curing. At a high-mass ratio of ordinary Portland cement, the improvement was more prominent. An investigation was conducted to determine the effect of curing temperature on the mechanical strength and durability of high-performance mortar containing binary mixes of cenosphere and waste glass powder. Researchers found that a curing temperature of 80 °C was appropriate for developing the mechanical strength and durability of high-performance mortar [16]. Zhu et al. [3] reported that CO2 curing could shorten the setting time, decrease the drying shrinkage rate and significantly improve the compactness of the cement stone structure of cement-based materials. Although, CO2 curing has been applied to manufacturing cement-based materials for several years [17], limited research has been conducted on whether CO2 curing increases the corrosion resistance of steel inside cement-based materials.
Usually, plain cement concrete can not be used in actual projects. The cement concrete in engineering structures must be reinforced with steel bars. When electrons are lost in steel bars within the cement concrete, the steel bar becomes corroded [18,19,20]. Marine concrete engineering structures are frequently subjected to complex marine corrosion environments [21,22,23,24,25]. Coastal seawater contains chlorine salts that can corrode the passive films of steel bars, therefore accelerating the corrosion process of reinforced concrete [26,27]. The steel bars inside cement concrete may be seriously eroded under the corrosion action of seawater [28,29,30,31,32]. Many methods have been developed to improve steel bars’ corrosion resistance. As pointed out in some studies, the incorporation of rice husk ash and silica fume could improve steel bars’ chloride corrosion resistance [33,34,35]. Sodium nitrite, sodium molybdate and other rust inhibitors can effectively increase steel bars’ corrosion resistance [36]. The ultra-high-performance concrete should have good corrosion resistance. CO2 curing can improve the compactness of cement concrete. Thus, the corrosion resistance of steel bars inside cement concrete may be increased [37]. It has been well acknowledged that, as cement concrete services in the environment of deicing by deicing salt and coastal environment, the inner steel bars may be severely corroded. However, the degradation of cement concrete is still unclear, and very few studies have been conducted on this topic.
A study was conducted on the effect of CO2 curing on the corrosion resistance of steel bars embedded in cement mortar. The curing time of carbon dioxide increased from 1 day to 28 days. In the presence of a 3% NaCl solution, freeze and thaw cycles were conducted on the specimens. Electrical methods, ultrasonic methods, mass-loss methods and microscopic technologies were used to evaluate the corrosion rate of steel bars. This study guides the reinforced concrete design for seawater freeze–thaw cycle corrosion.

2. Materials and Methods

2.1. Raw Materials

Table 1 shows all the raw materials’ chemical compositions, and Table 2 displays the particle-size distributions of ordinary Portland cement. The cement used in this research has a strength rating of 42.5 MPa and an apparent density of 3.05 g/cm3. The standard sand with a silica content of 98% whose loss on ignition, moisture content and chloride ion content are less than 0.40%, 0.18% and 0.007%, respectively, was used as the aggregate. CO2 with a concentration of 99.999% provided by Hebei Jiehang Test Instrument Co., Ltd., Cangzhou, China, was used to cure the cement mortar.

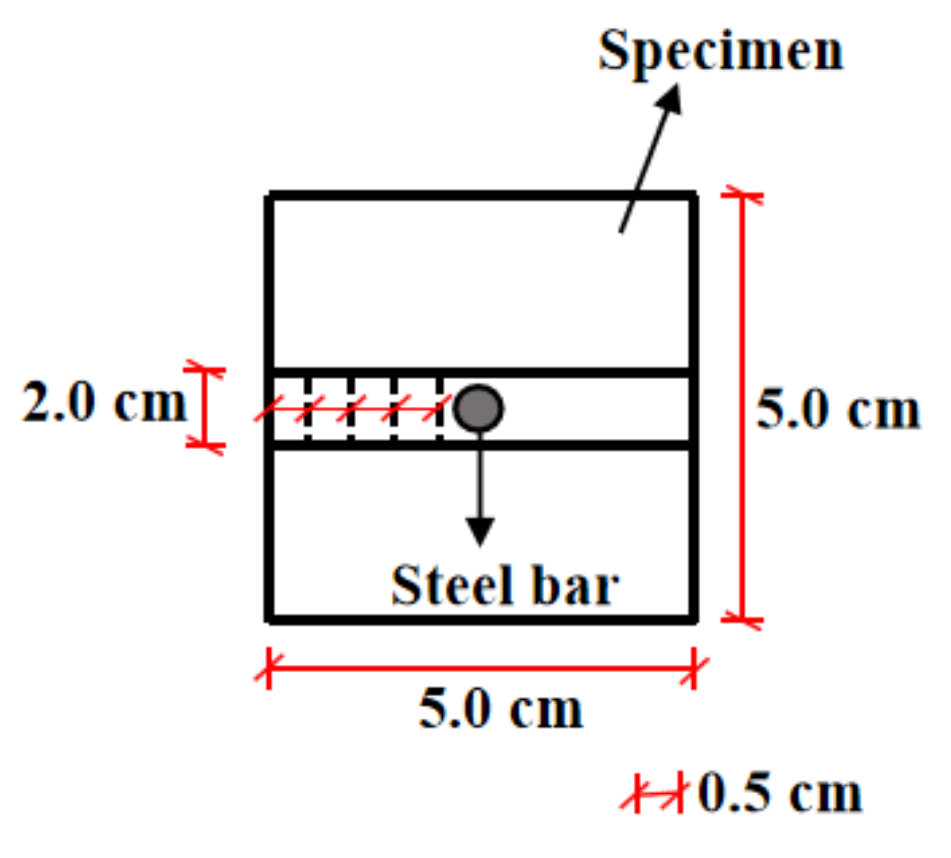
2.2. The Preparation of Samples

The following steps can be used to prepare RPC specimens. The mixing proportions are shown in Table 3 [22].
A UJZ-15 mixer was used for preparing the cement mortar. The cement power and standard sand were first mixed for 1 min at 60 ± 2 R/min in the mixer. After adding the water, the mixture was mixed again for another 3 min at 80 ± 4 R/min. Molds (50 × 50 × 50 mm3) were filled with the freshly prepared mortar. The specimen was centered on an 8 mm-wide plain round bar. At the same time, 316 L stainless-steel mesh with 4.75 mm square holes served as conductive electrodes. The distance from the stainless-steel mesh to the central axis of the specimen was 40 mm. Six replicates were used for each test.

2.3. Measurement Methods

In this study, a rapid freeze–thaw testing machine was used to perform the freeze–thaw test. The temperatures of this experiment ranged from −18 °C to 5 °C. Each freeze–thaw cycle lasted for 2 h. NaCl solution (3%) was used as the freeze–thaw medium. All specimens were immersed in the NaCl solution (3%) for 4 days before the rapid freeze–thaw experiment. Subsequently, the specimens were moved to the rubber tubes filled with 3% NaCl for the freeze–thaw test.

2.3.1. The Measurement of pH

The solid–liquid extraction method was chosen to evaluate the pH of the cement mortar. The following are the specific steps. The test block was crushed to powder along the carbonation depth direction. Before the first 5 mm, the sample was collected every 1 mm, then every 2 mm after that. After passing through a filter (0.08 mm square-hole sieve), 5 g of the dried sample was obtained from the ground sample. To prevent carbonation, the sieved sample was dissolved in 50 mL of distilled water and sealed with a rubber stopper. After 24 h of stirring every 5 min and stewing for 2 h, the pH of the filtered solution was measured using a pH meter (PHSJ-6L type) provided by Beijing Dongnan Yicheng laboratory equipment Co., Ltd., Beijing, China. The depth direction of the pH is shown in Figure 1.

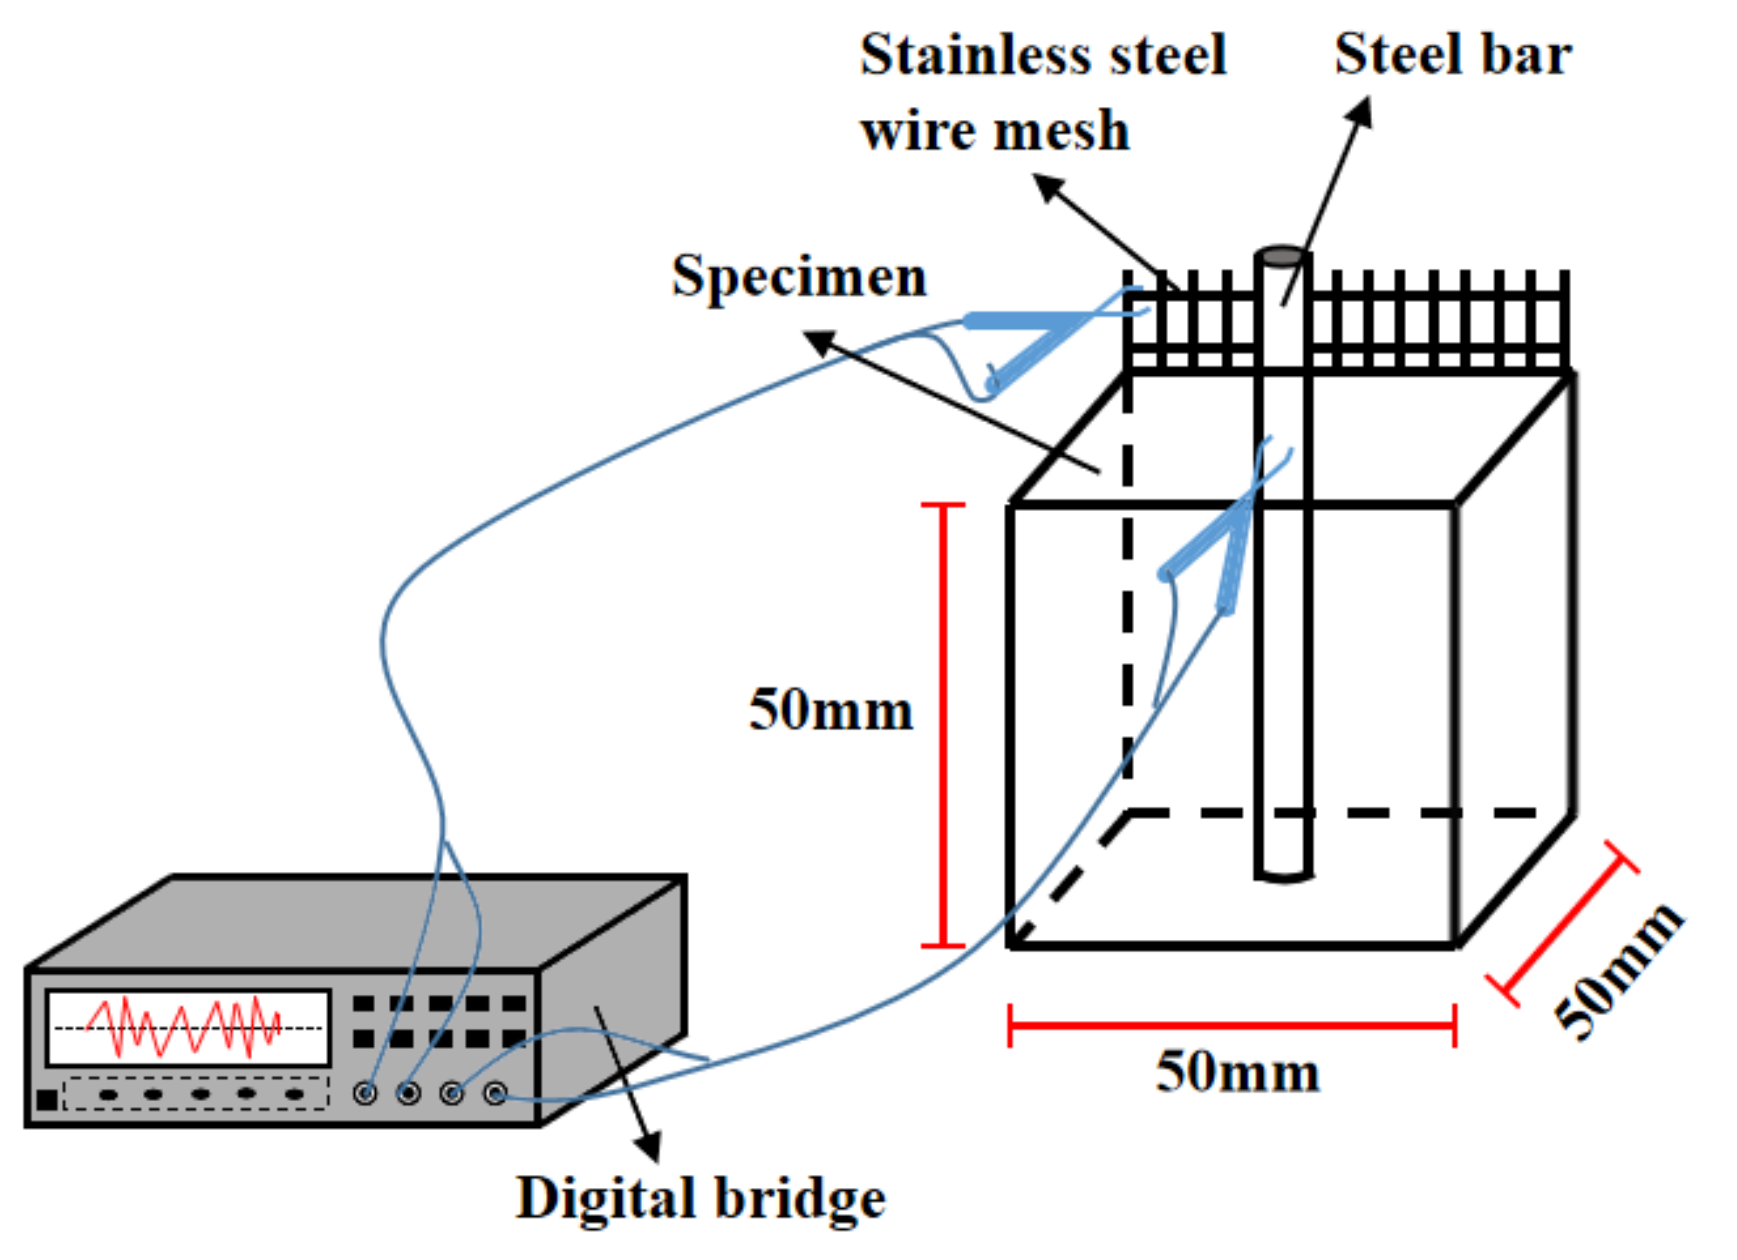
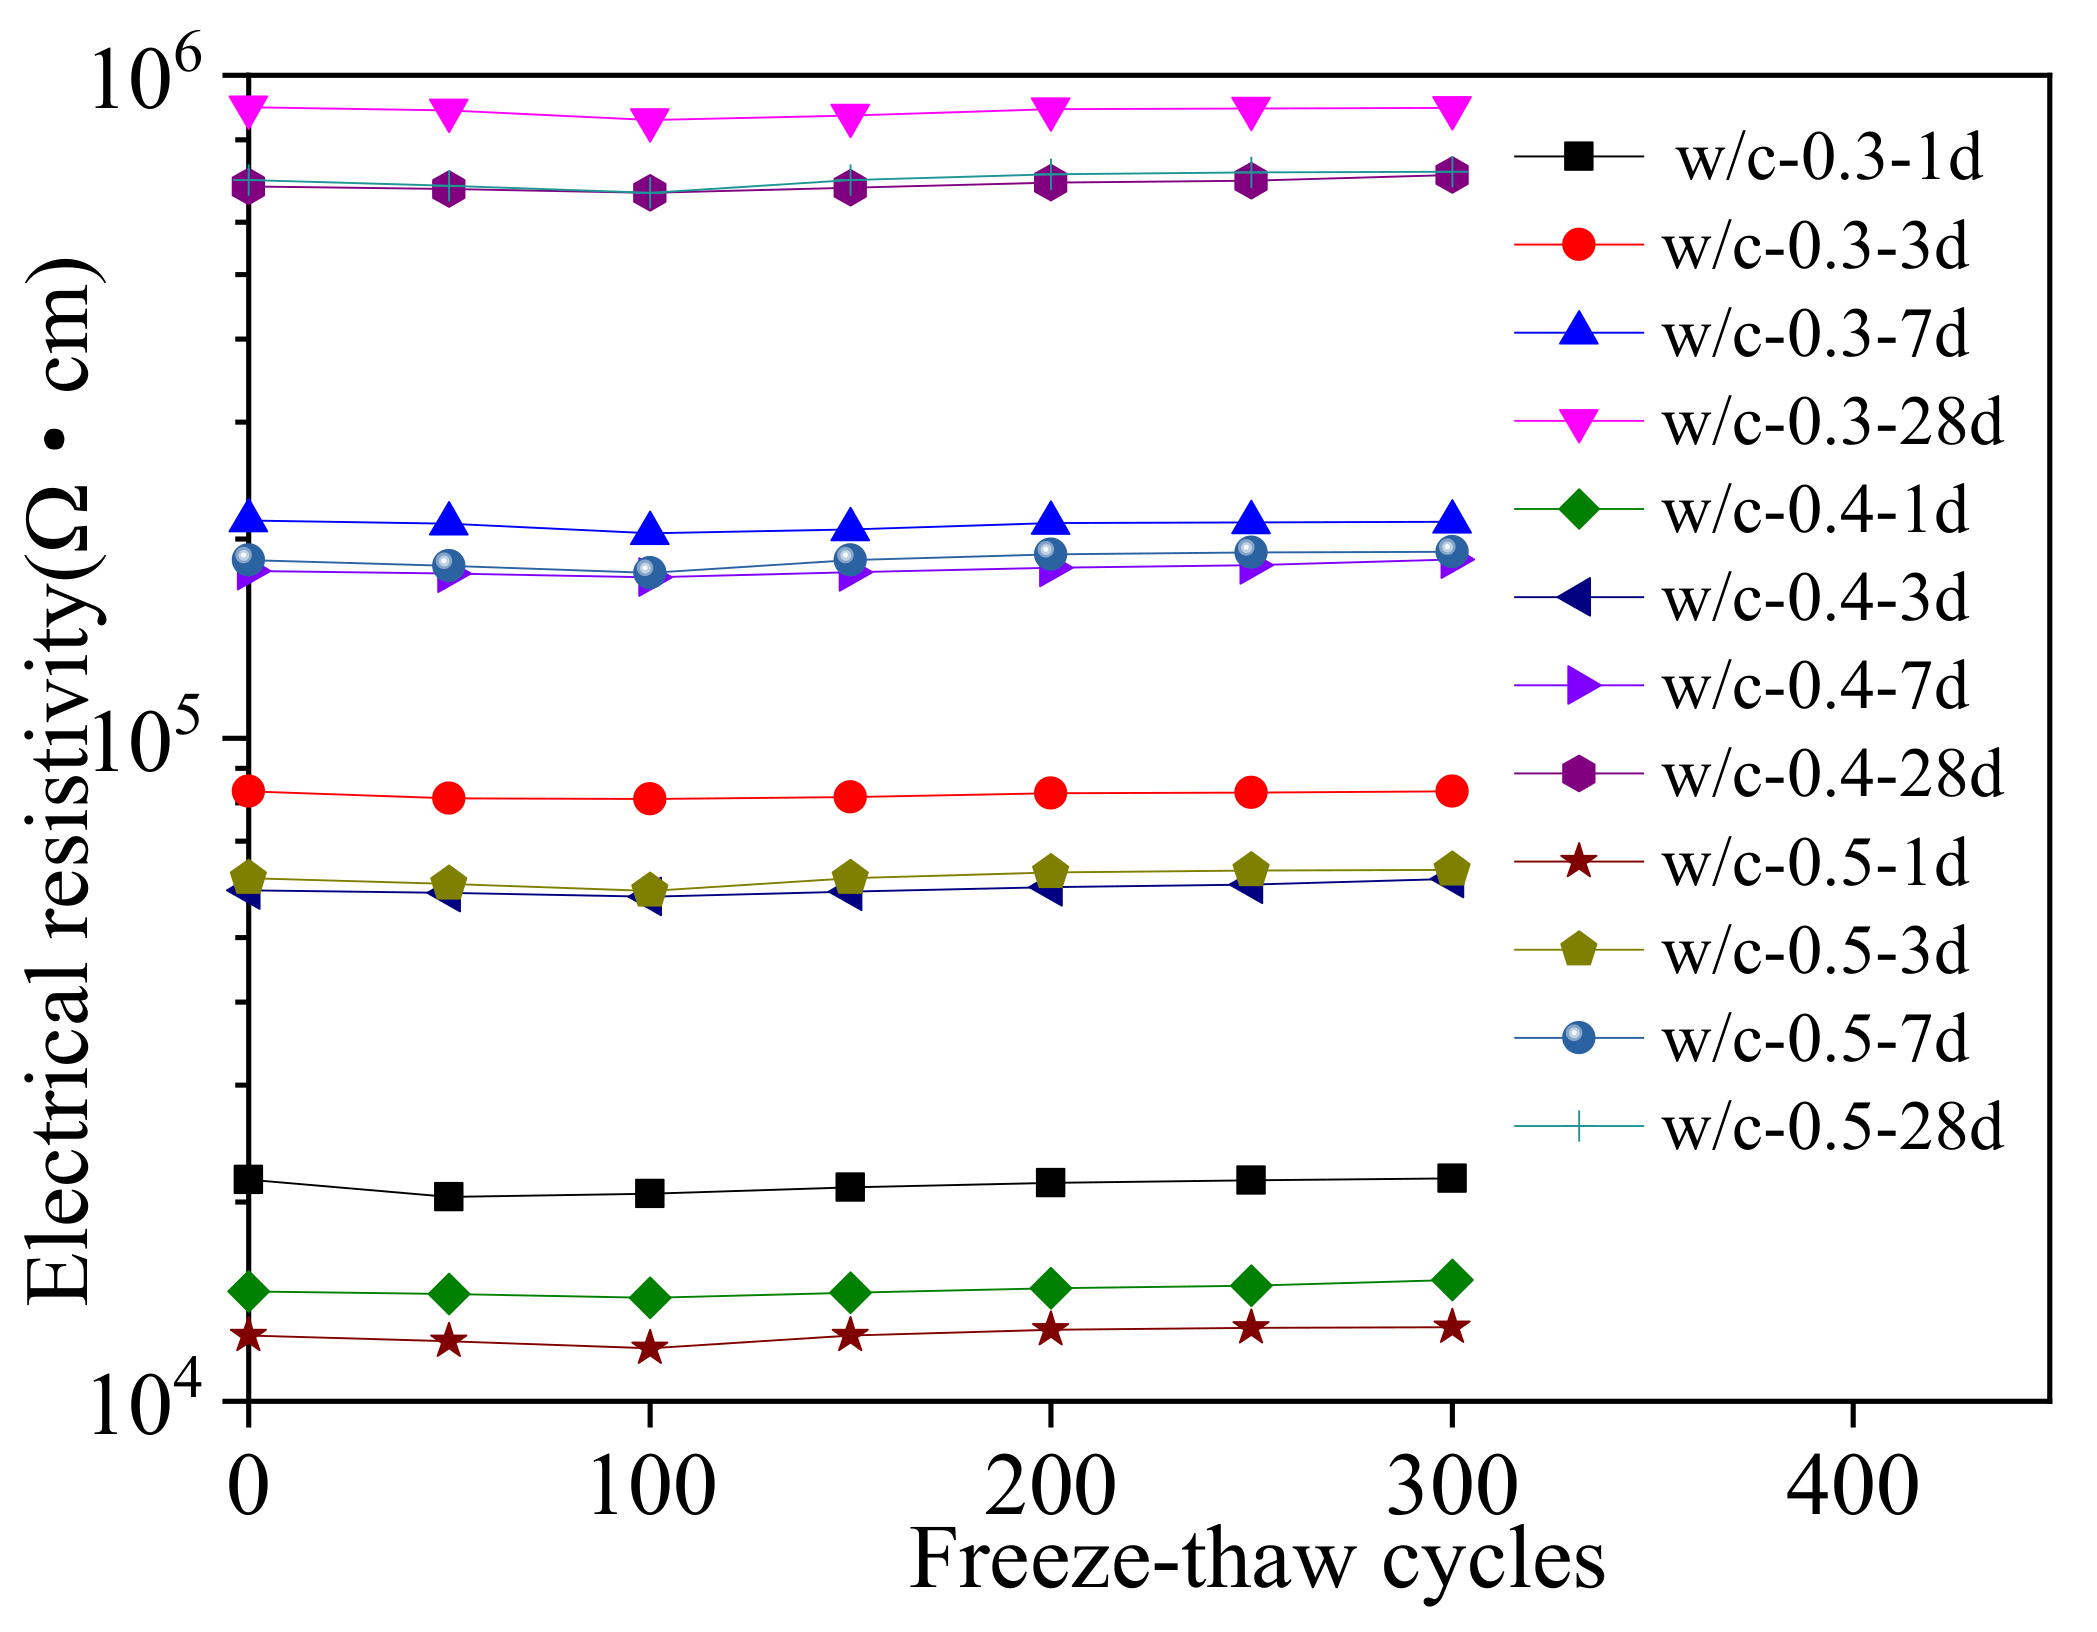
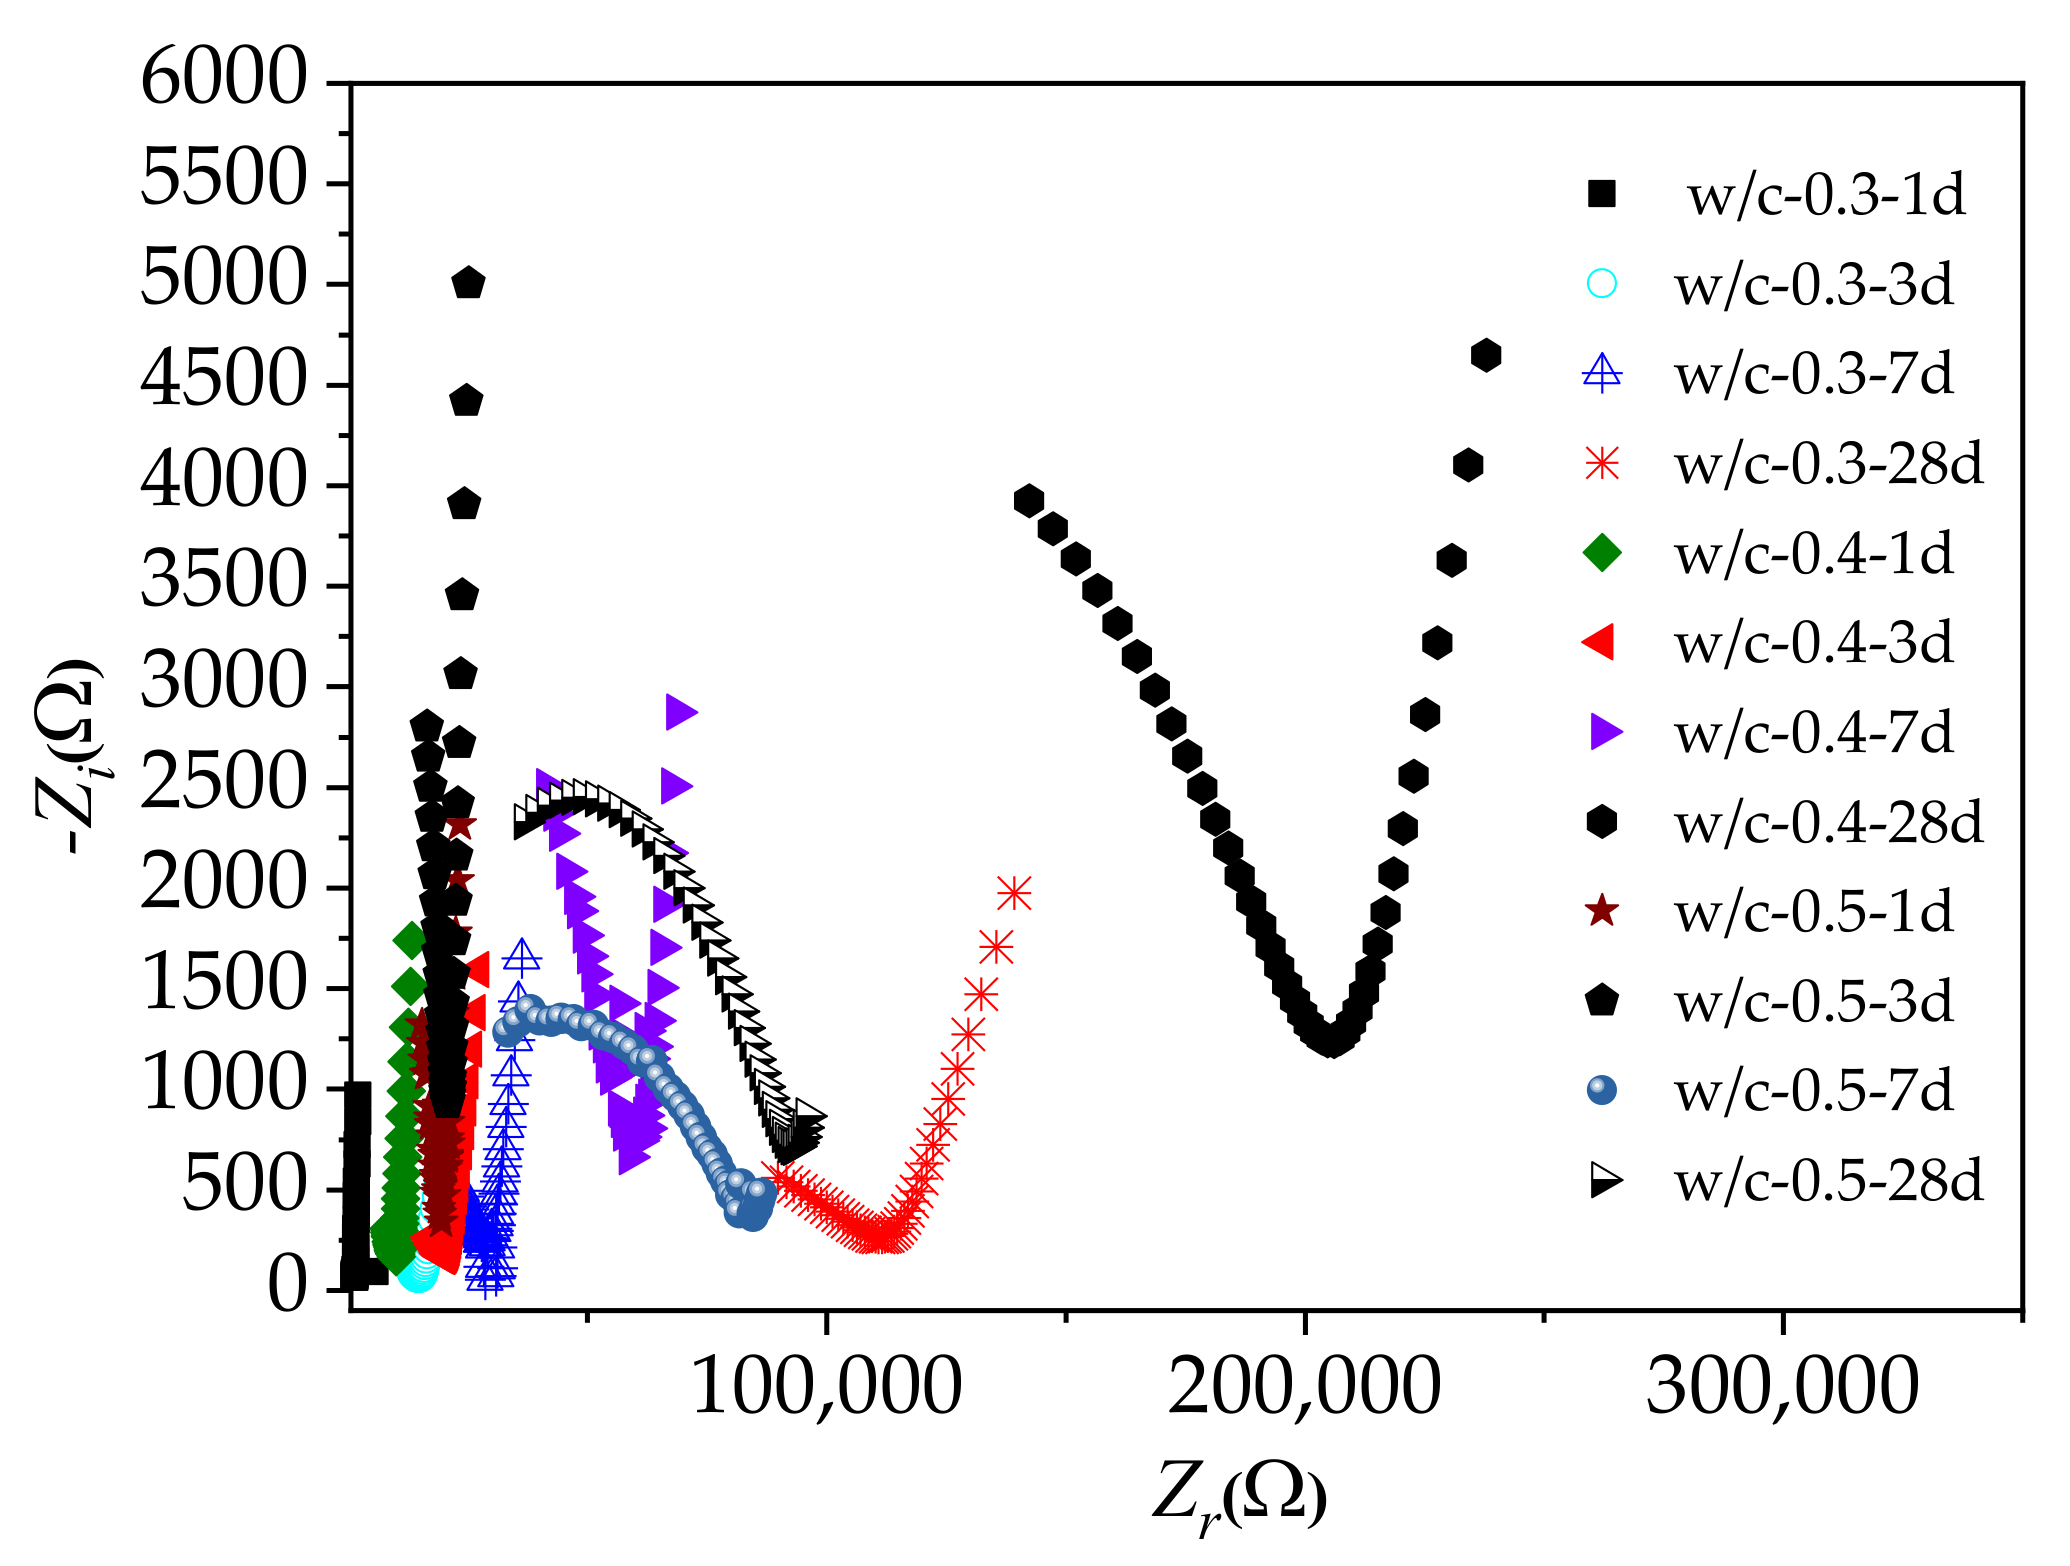
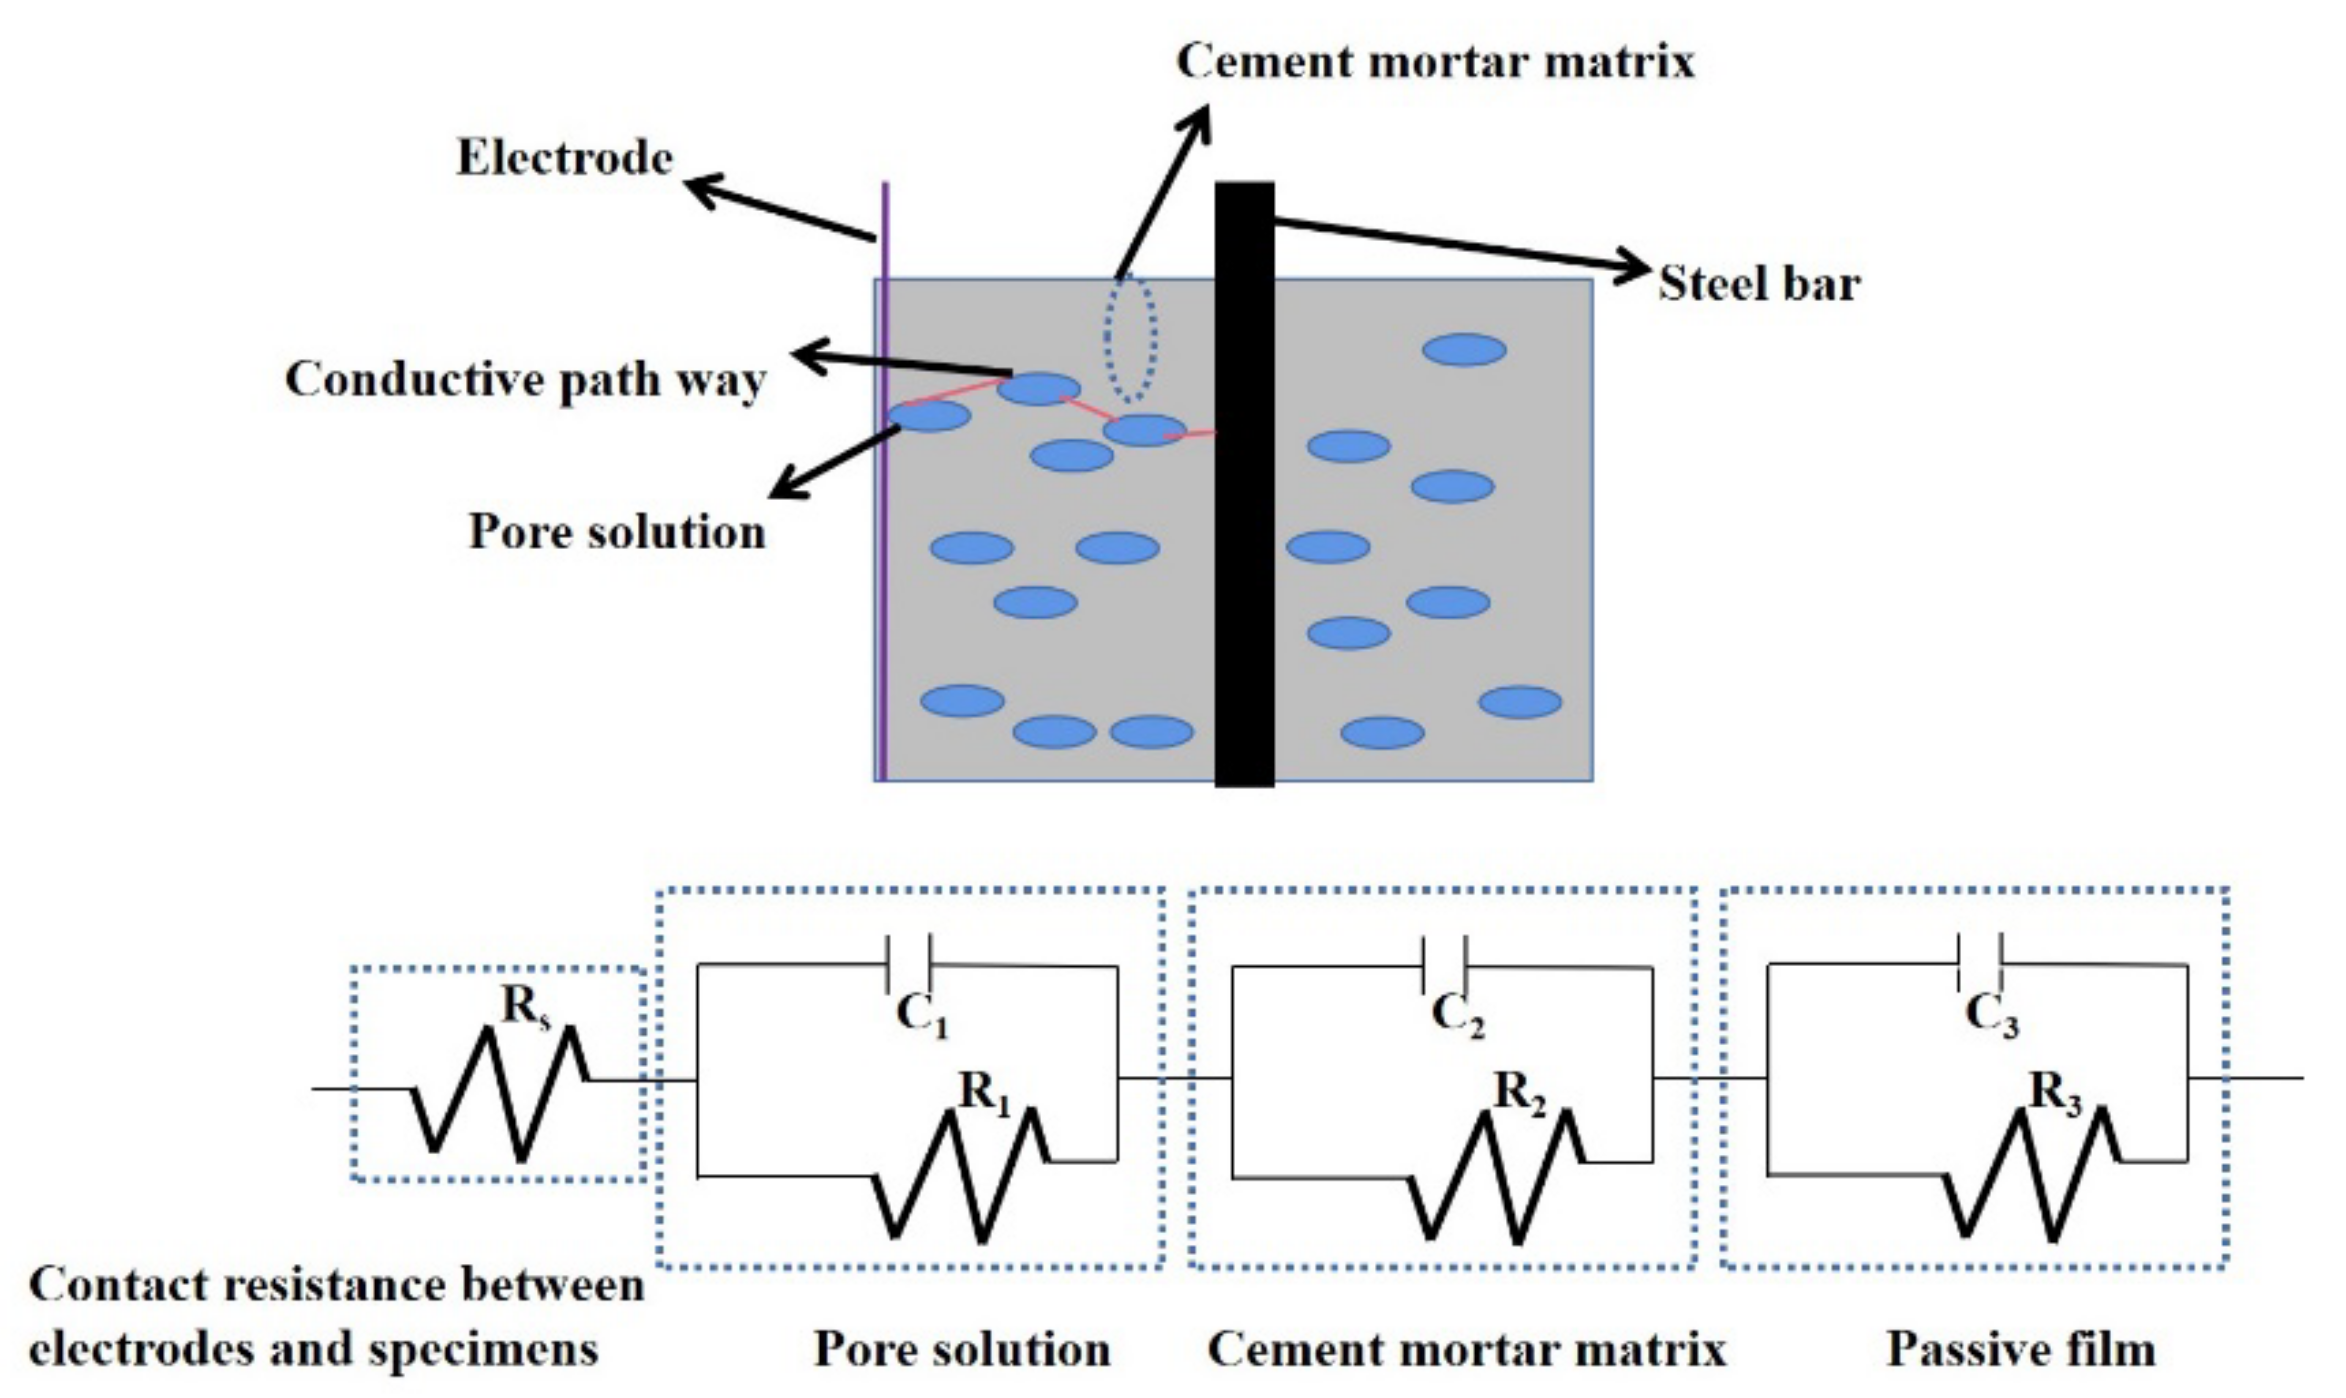
2.3.2. Electrical Parameters

Electrical parameters (AC electrical resistance, AC impedance spectrum and Tafel curves) were measured with two electrode methods. For determining the AC electrical resistivity, an LCR digital bridge with 104 Hz and 1 V was used. PARSTAT 3000 A, provided by AMETEK Trading (Shanghai) Co., Ltd., Shanghai, China, was used for determining the AC impedance spectrum and Tafel curves. Figure 2 illustrates the testing process. Following the test, the following equation could be used to calculate the AC electrical resistivity.
ρ = R A L
The resistance R represents the average electrical resistance of the specimen, and A and L are the area and length of the electrical current passing through the testing specimen’s cross section, respectively.

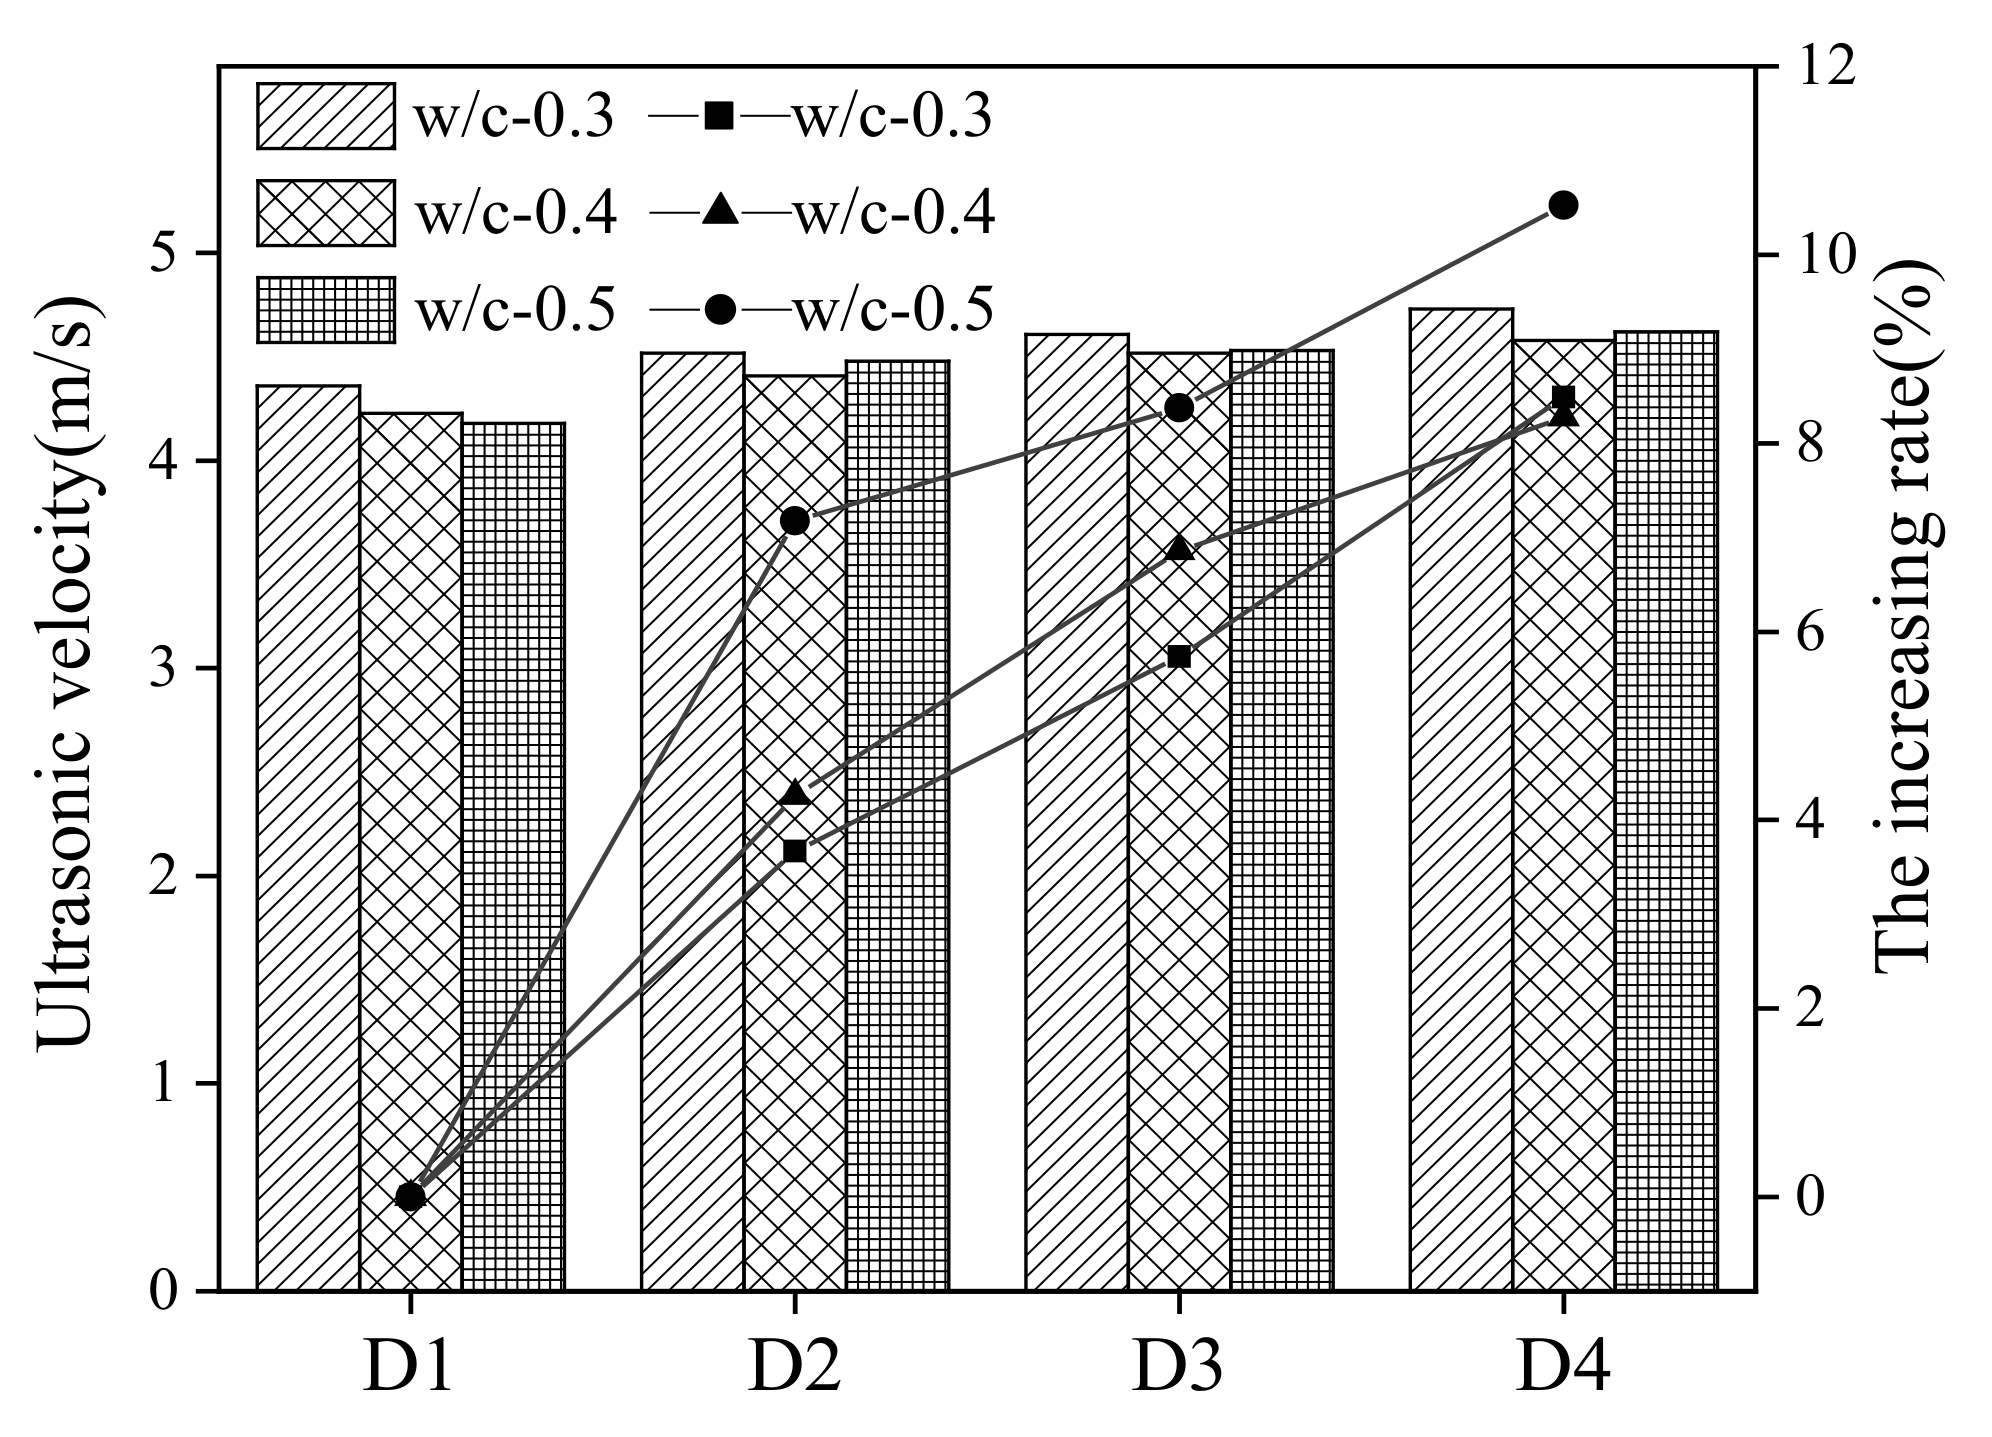
2.3.3. Ultrasonic Velocity

The SUB-100 ultrasonic flaw detector provided by Wuxi Jiebo Instrument Technology Co., Ltd., Wuxi, China was applied in the measurement of the ultrasonic velocity. The forming sides of the specimen were evenly smeared with Vaseline. Subsequently, the SUB-100 ultrasonic flaw detectors were pressed tightly on the sides and smeared with Vaseline. Finally, the sound velocity of the ultrasonic flaw detector was recorded after ultrasonic emission. The measuring process of the ultrasonic velocity is shown in Figure 3.

2.3.4. Percentage of Mass Loss

The mass-loss rate of cement mortar can be determined as follows. During each 50 NaCl freeze–thaw cycle, the surface of the specimens was wiped dry with a rag. Subsequently, the mass of the specimen was tested. However, the steel bars should be ground before the following mass was measured. The mass-loss rate can be calculated by Equation (2).
Δ m m = m m 0 m 0
where m and m0 are the mass of cement mortar or steel bars before and after each 50 freeze–thaw cycle, respectively.

2.3.5. Microscopic Tests

The scanning electron microscope (SEM) was used for observing the micro-morphology of samples. Meanwhile, X-ray diffraction (XRD) was selected to investigate the crystal component of the steel bars’ passive film. To block the cement’s hydration, four days’ immersion in absolute ethanol was provided for the samples after reaching the planned curing age. The powdered sample whose particle size was smaller than 74 µm was used for the XRD tests. Soybean-sized samples extracted from the large specimen were dried in the vacuum drying oven. After drying, the samples were taken out and sprayed with gold in a vacuum environment. The samples were coated with a gold film to conduct the SEM test. The Hitachi S-4800 cold field emission scanning electron microscope, Hitachi, Tokyo, Japan, was applied for the measurement of SEM images. The D8 ADVANCE X-ray diffractometer, manufactured by Bruker Corp., Tokyo, Japan, was used to conduct the XRD measurement.

3. Results and Discussions

3.1. The pH of the Cement Mortar

The pH of the cement mortar is depicted in Figure 4 at various depths. All the specimens were cured in CO2 for 28 days. Figure 4 shows that the pH value on the surface of the specimens is between 9.0 and 11. With the rising depth and lowering w/c, however, the pH value rises. This was due to CO2 reacting with calcium hydroxide and lowering the alkalinity of the cement mortar. The pH value of the surface section of the cement mortar is lower because it is more prone to react with CO2. Calcium carbonate, which is generated when CO2 reacts with calcium hydroxide, can increase the compactness of cement mortar, inhibiting CO2 penetration. As a result, as the depth of the specimen grows, so does the alkalinity, and the pH value rises. Furthermore, because of the greater compactness, the lower w/c can raise the pH value [38].

3.2. Macroscopic Properties before Sodium Chloride Action

In this section, the specimens’ curing occurred for 1, 3, 7 and 28 days in a chamber where the CO2 concentration was 8% and the temperature was 20 °C. These specimens were then cured further in conventional curing environments for 27, 25, 21 and 0 days. One-, three-, seven- and twenty-eight-day cured samples were designated as D1, D2, D3 and D4.
The electrical resistivity of cement-mortar specimens is shown in Figure 5. In Figure 5, the electrical resistivity of steel bars reinforced with cement mortar increases with the longer CO2-curing time. This improvement can be attributed to the generated calcium carbonate due to the reaction between calcium hydroxide and CO2 [39]. Due to this reaction, conductive ions can decrease in the pore solution, so electrical conduction is reduced and electrical resistivity is increased. As the water-to-cement ratio (w/c) increases, the electrical resistivity decreases. More water and conductive ions are found in cement mortar with a high w/c, thus improving the electrical conduction [40]. As obtained from Figure 5, the increasing rate of electrical resistivity improves as the curing period increases. A higher w/c demonstrates a positive effect on the increasing rate of electrical resistivity. This increase could be ascribed to the more free water and pores in the cement mortar with a higher w/c. Therefore, more calcium hydroxide in the cement mortar could react with CO2, thus forming calcium carbonate to improve the compactness of the mortar [41].
The ultrasonic velocity of specimens is presented in Figure 6. It is evident that the ultrasonic velocity of the specimens increases as the curing age of the CO2 increases. This improvement is because the longer CO2-curing age improves the calcium carbonate content (hydration products with high compactness). The speed of ultrasonic propagation in compact materials is rapid [42]. Therefore, the ultrasonic velocity increases with the increasing CO2-curing time. Due to the positive effect of the w/c on the CO2 effect, the increasing rate of ultrasonic velocity of specimens increases with the w/c.

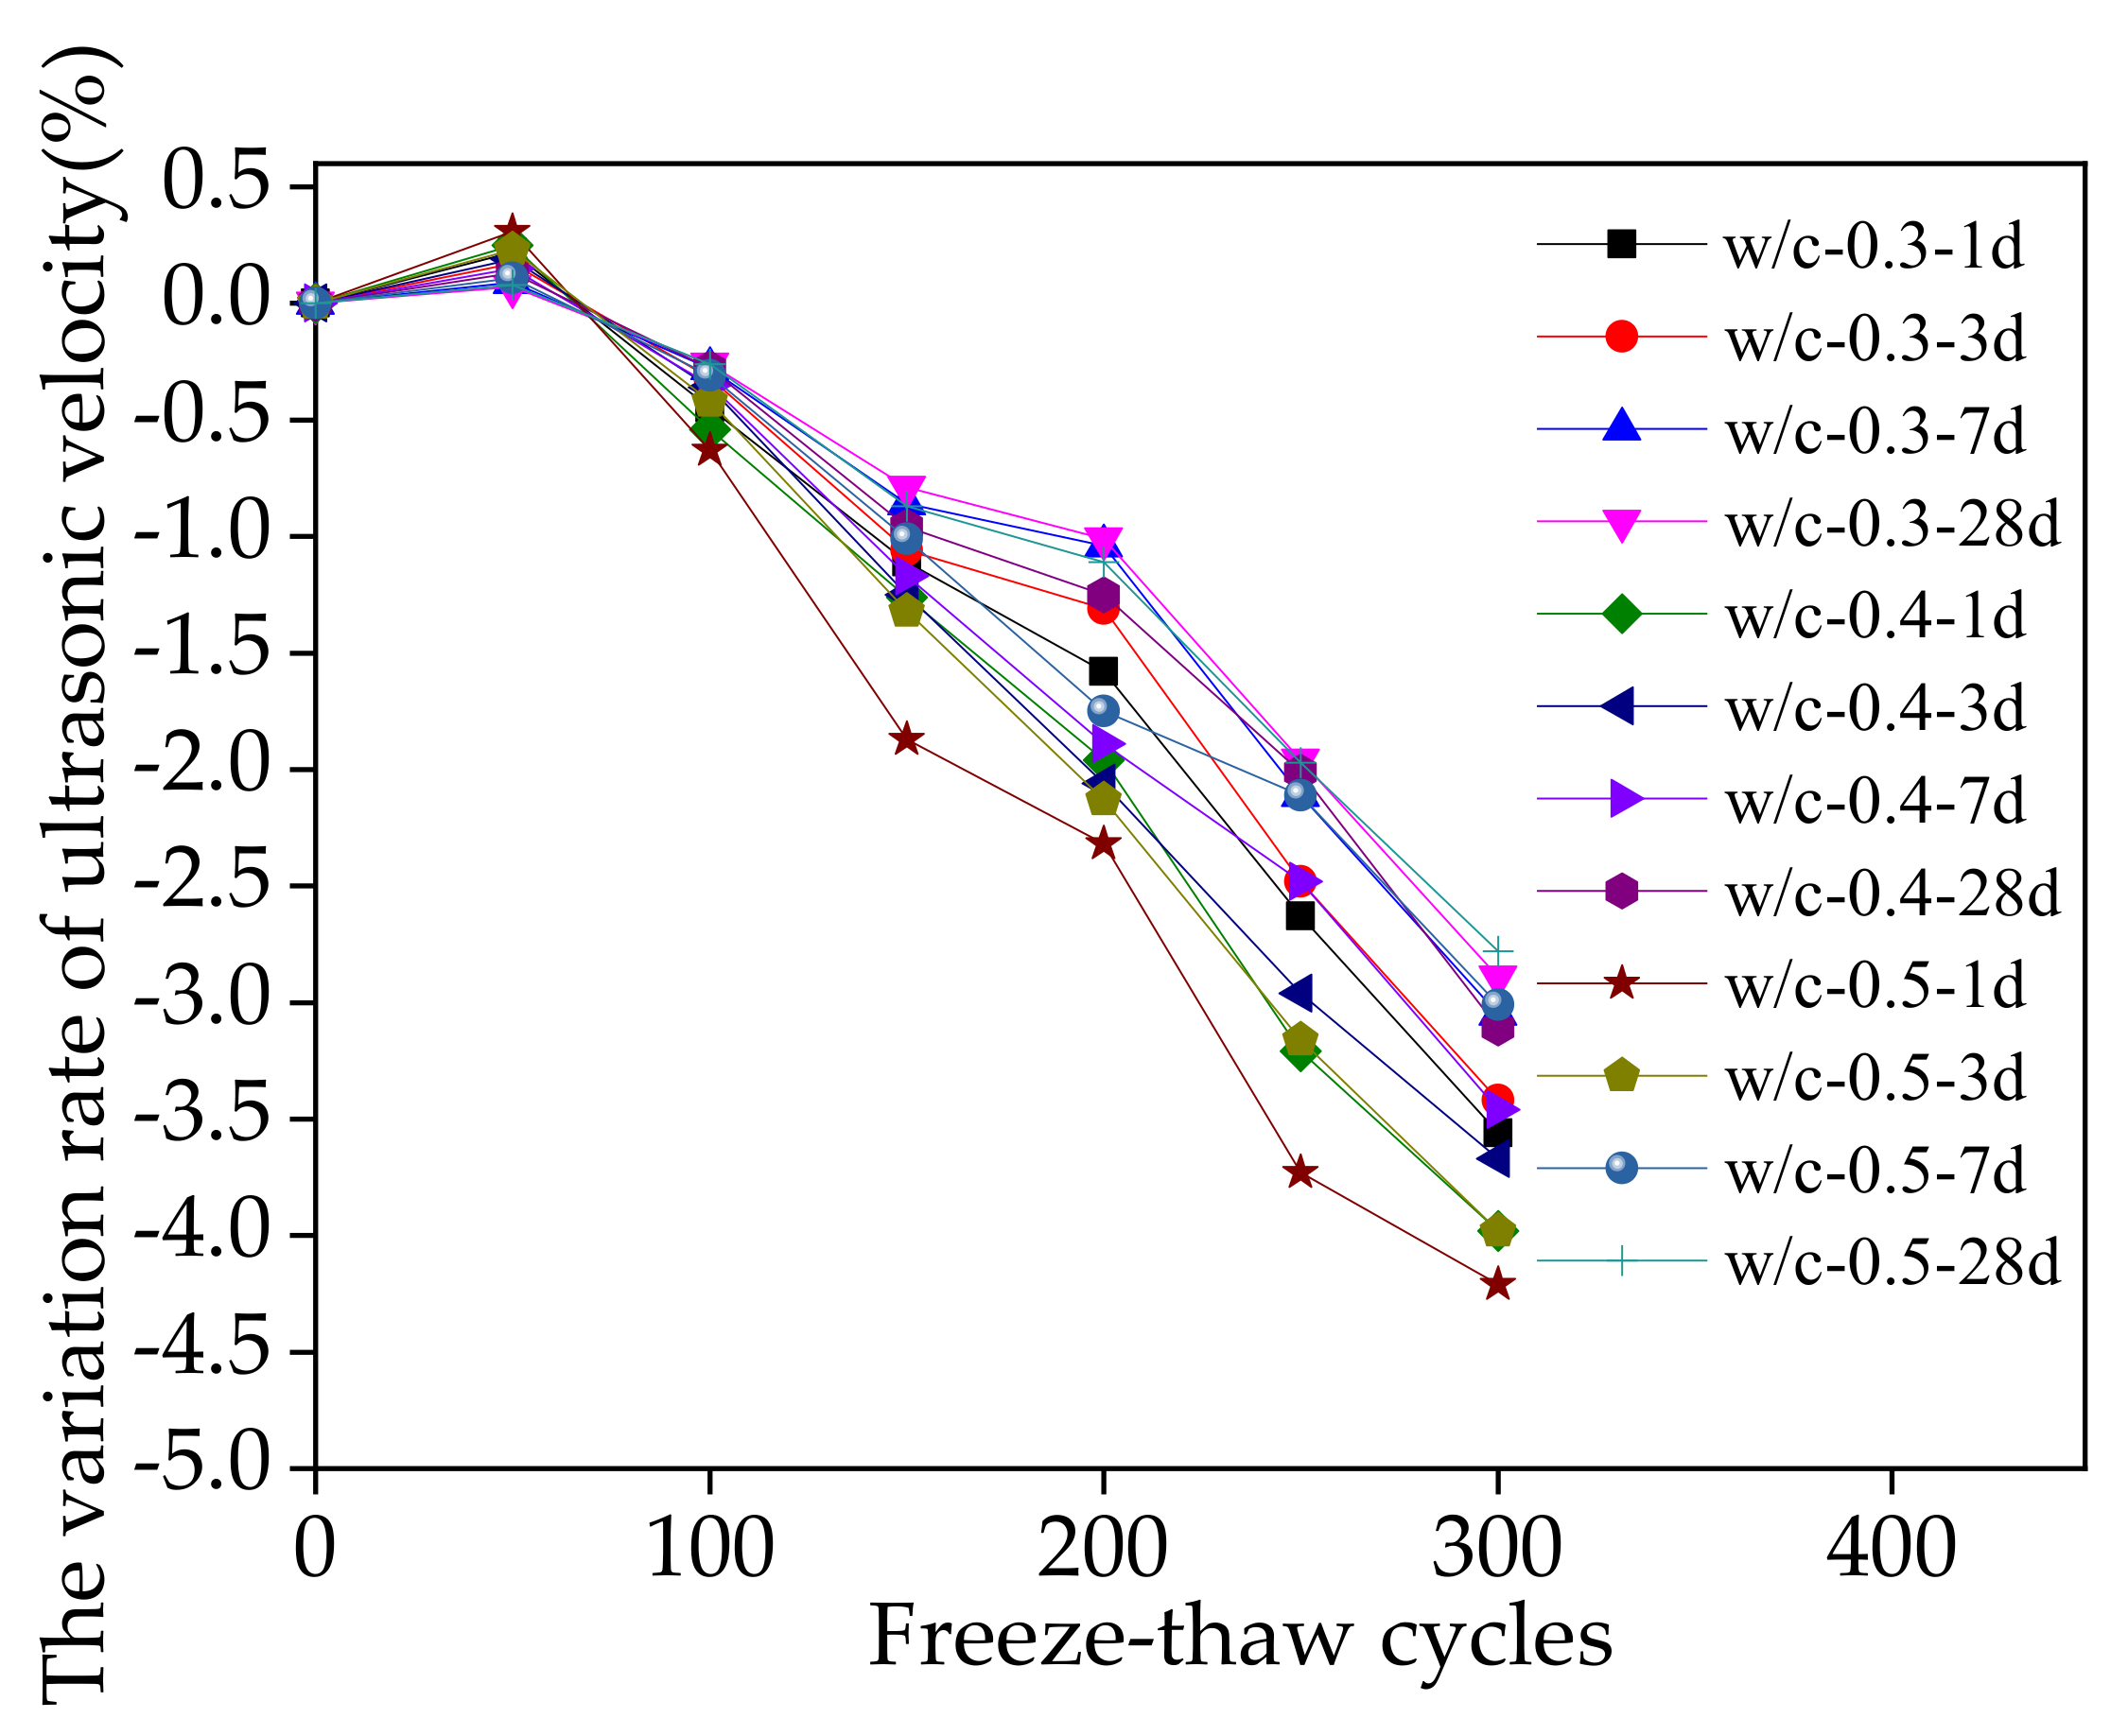
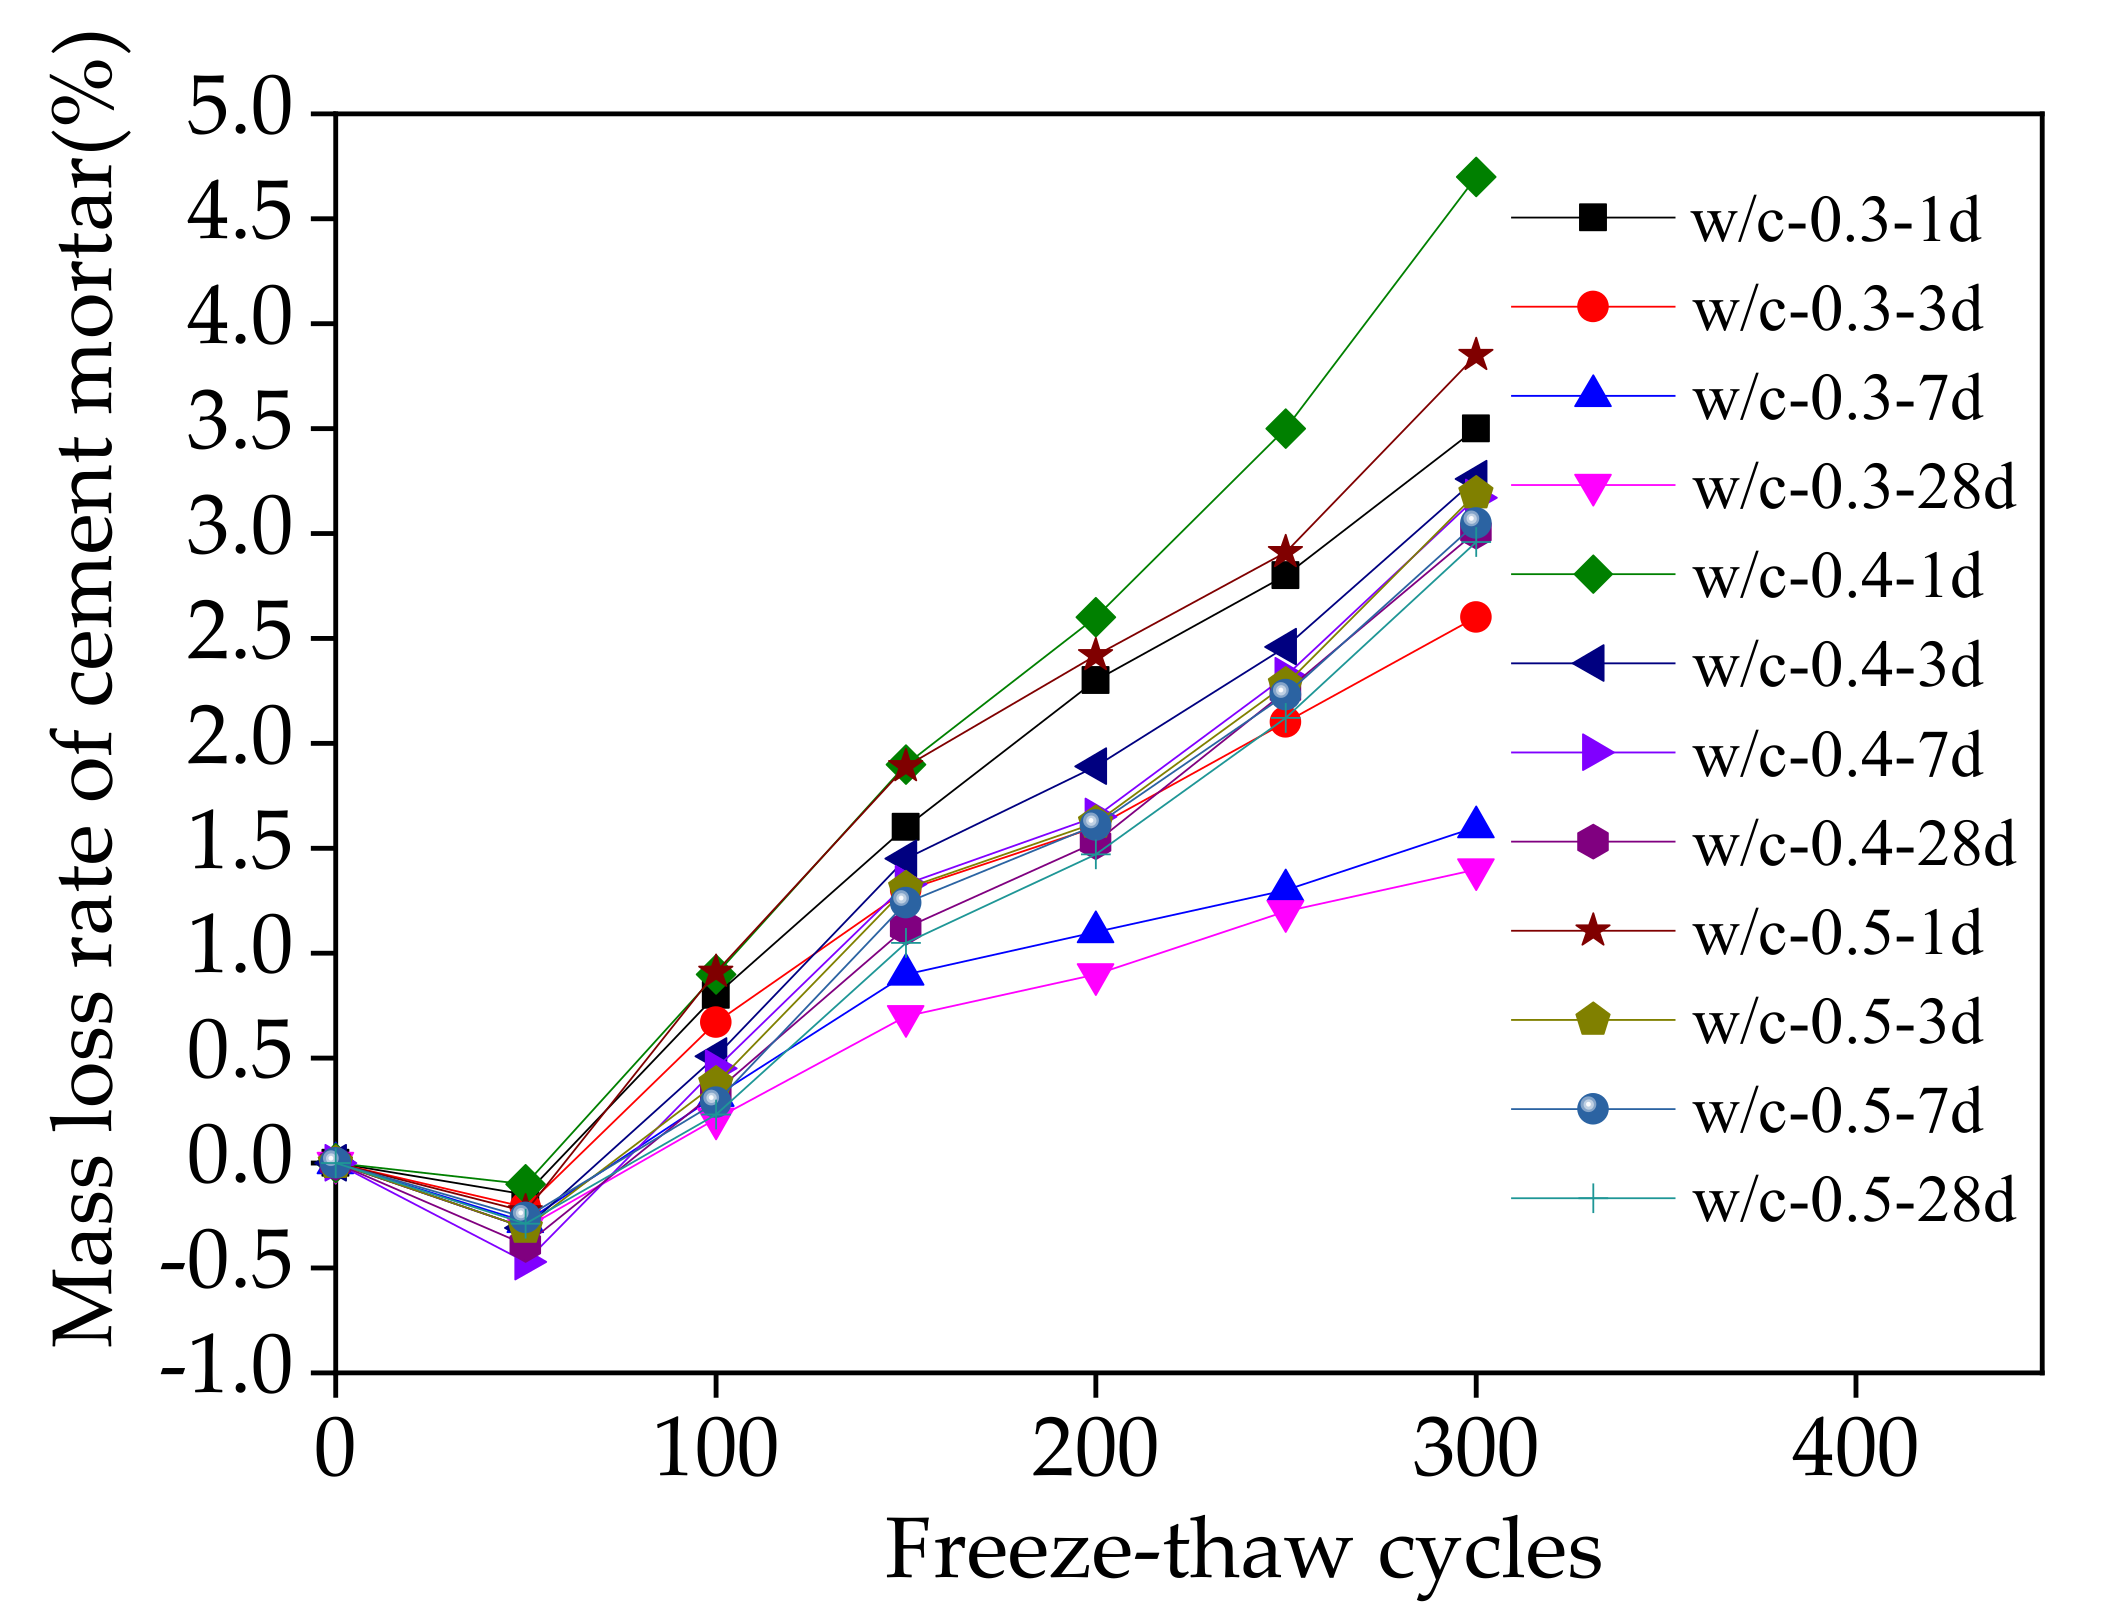
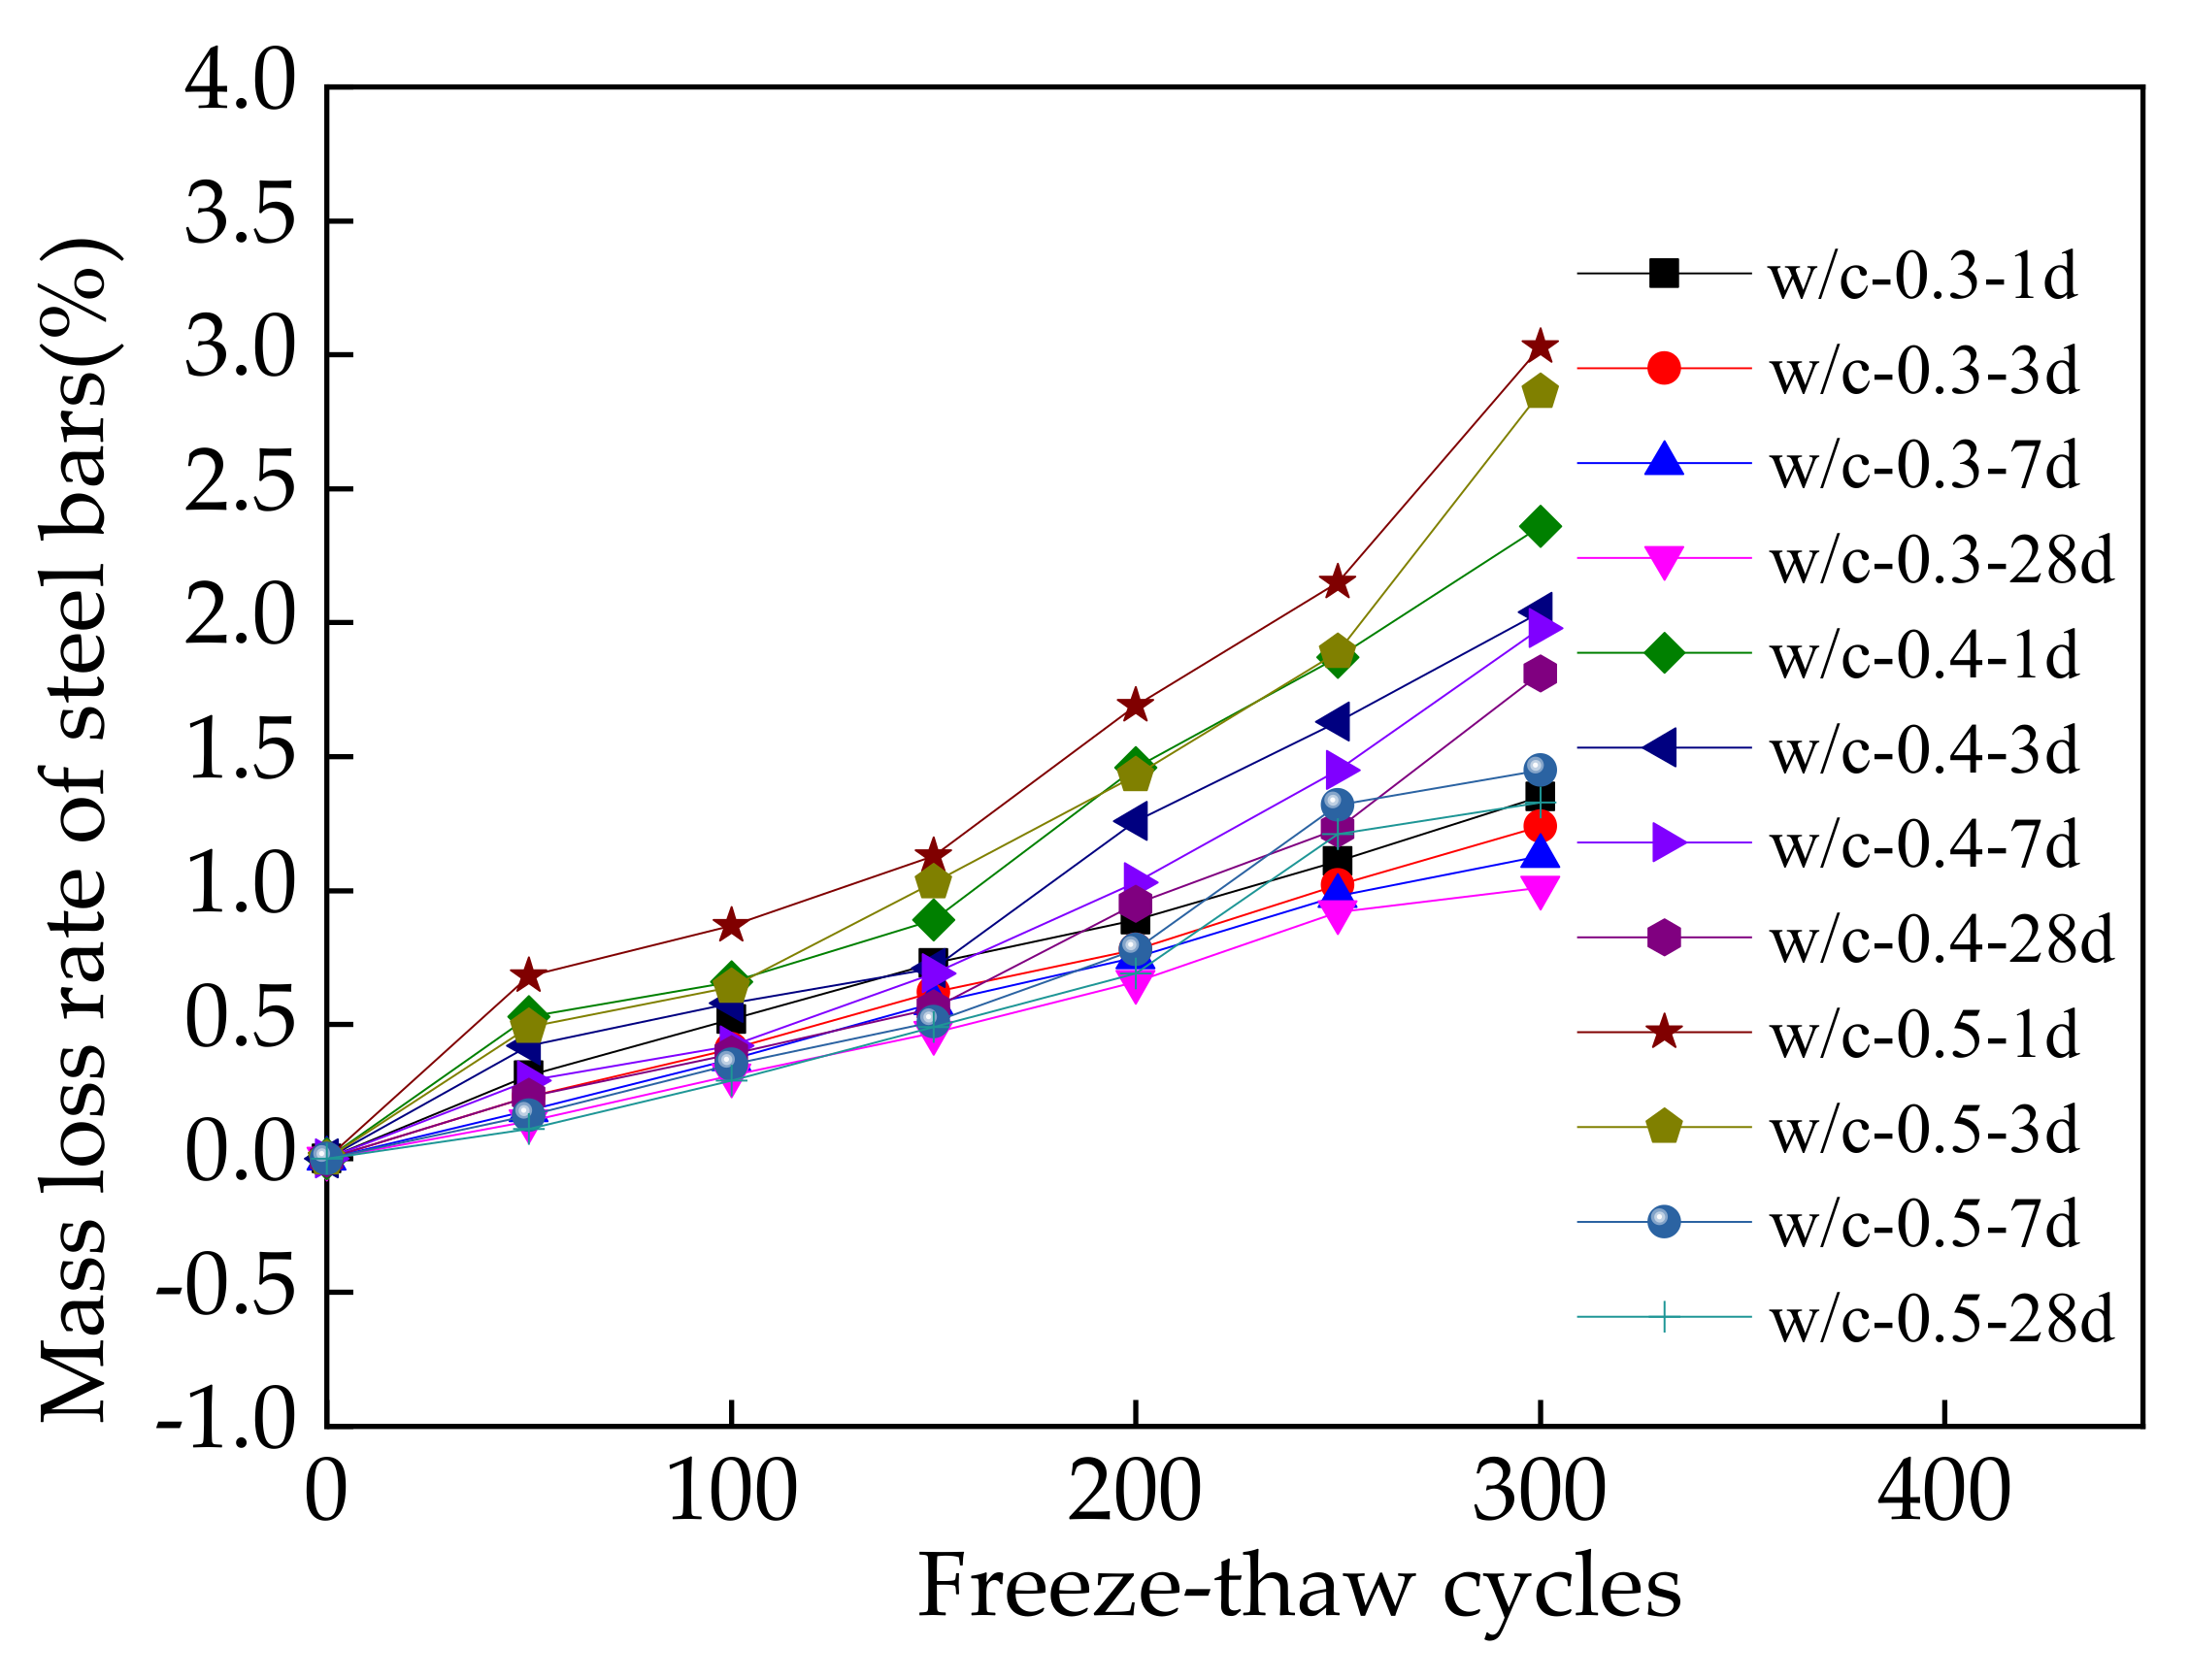
3.3. Macroscopic Properties during Sodium Chloride Action

Figure 7 depicts the electrical resistivity of specimens during NaCl freeze–thaw cycles. According to Figure 7, the electrical resistivity decreases within the first 100 freeze–thaw cycles. The increase in NaCl concentration in pore solution in response to increasing freeze–thaw cycles may explain this improvement. However, the electrical resistivity increased as the number of freeze–thaw cycles increased from 100 to 300 cycles, owing to the formation of additional interior cracks following the NaCl freeze–thaw cycles [43]. Figure 7 shows that the longer the CO2-curing time, the lower the growing rate of electrical resistivity becomes. This is due to the fact that after CO2 curing, the steel bars reinforced cement mortar’s NaCl freeze–thaw corrosion resistance improves [44].
Figure 8 depicts the variation rate of ultrasonic velocity of specimens during NaCl freeze–thaw cycles. As shown in Figure 8, the ultrasonic velocity increases with the freeze–thaw cycles ranging from 0 to 50. It is believed that the cement’s continuous hydration leads to the increase in compactness of cement mortar [45]. However, with the freeze–thaw cycles increasing from 50 to 300, the ultrasonic velocity decreases obviously. The further NaCl freeze–thaw cycles may induce the corrosion of steel bars and yield the inner cracks of cement mortar [46]. Besides, the frozen-thaw stress resultant from NaCl freeze–thaw cycles may also extend the propagation of internal cracks in cement mortar, hindering the transmission of ultrasound in concrete [47]. Therefore, the ultrasonic velocity of specimens decreases obviously with the freeze–thaw cycles increasing from 50 to 300. Figure 6 illustrates that when the CO2-curing age increases, the lowering rate of ultrasonic velocity decreases due to the better compactness of the higher CO2-curing age. Moreover, the increasing w/c increases the variation rate of ultrasonic velocity. This can be attributed to the increased compactness of cement mortar with the decreasing w/c.
Figure 9 shows the mass-loss rate of specimens during NaCl freeze–thaw cycles. Figure 9 depicts how the mass grows as the number of freeze–thaw cycles. The continuous hydration of cement mortar during freeze–thaw cycles may be responsible for this increase. The continuous hydration of cement mortar increases the mass of hydration products. However, with freeze–thaw cycles increasing from 50 to 300, the mass of cement mortar decreases. The frozen-heave stress and reinforcement corrosion caused by NaCl freeze–thaw cycles may increase specimens’ spalling and thus reduce the mass of cement mortar [48]. The mass-loss rate decreases at a longer CO2-curing age, due to the improved compaction of hydration products [49]. Moreover, specimens with a w/c of 0.3 display the lowest mass-loss rate. This is because a lower w/c may improve the compactness of cement mortar. However, the mass-loss rate of specimens with a w/c of 0.5 is lower than the specimens with a w/c of 0.4. This is because the higher carbonation degree of cement mortar with a w/c of 0.5 leads to higher compactness and less mass loss.
The mass loss rate of steel bars through NaCl freeze–thaw cycles is shown in Figure 10. As illustrated in Figure 10, the mass-loss rate of steel bars increases with the freeze–thaw cycles. This is due to the fact that NaCl freeze–thaw cycles hasten the corrosion of steel bars, resulting in an increase in rust mass. However, the mass loss rate of steel bars increases with a higher w/c because the electrical conduction is improved with the increasing w/c [50]. Moreover, the mass-loss rate of steel bars decreases with the longer CO2-curing time due to the improved corrosion resistance.
The electrochemical impedance spectroscopy (EIS) curves are exhibited in Figure 9. As demonstrated in Figure 11, the imaginary part (−Zi) of EIS curves first decreases and then increases with the increasing real part (Zr). Meanwhile, the CO2-curing time makes the extreme point of the impedance spectrum shift from left to right due to the decreased electrical conduction by CO2 curing, thus increasing the electrical resistivity [51]. Therefore, the EIS curves shifted from left to right with the increasing CO2-curing time. Moreover, specimens with a w/c of 0.3 show the highest real part of the extreme point of impedance spectrum. This is because the free water inside the specimens increases with the w/c, and, thus, the free water of specimens with a w/c of 0.3 shows the lowest conduction and the highest electrical resistance. However, the corresponding real part of the extreme point of impedance spectrum of the specimens with a w/c of 0.5 is higher than a w/c of 0.4. This can be attributed to the improved carbonation degree of a higher w/c [52].
Figure 12 depicts the specimens’ EIS curves following 300 NaCl freeze–thaw cycles. As illustrated in Figure 12, similar tendencies of the EIS curves to Figure 11 can be observed. Comparing Figure 11 with Figure 12, the corresponding real part of the extreme point of impedance spectrum of the specimens increases with NaCl freeze–thaw cycles, due to the inner cracks generated after freeze–thaw cycles, and thus results in the reduction in electrical conduction of cement mortar [53]. Furthermore, CO2 curing reduces the rate at which the actual portion increases during NaCl freeze–thaw cycles. This is because CO2 curing of cement mortar might improve the hydration products’ compactness, thereby boosting the resistance to NaCl freeze–thaw cycles [54,55]. Because of improved compactness and less free water due to a lower water–cement ratio, the actual portion of specimens with a w/c of 0.3 shows the slowest rise. The rise in the real part of specimens with a w/c of 0.5 is lower than that of specimens with a w/c of 0.4, due to the higher carbonation degree.
To investigate the corrosion degree of steel bars, the equivalent circuit diagram was generated by fitting the experimental curves with Zsimpwin, according to the equivalents of Figure 11 and Figure 12. The equivalent circuits derived from the AC impedance spectrum are shown in Figure 13 [56,57,58]. As indicated in Figure 13, the corresponding circuits may be separated into four electrical components in series. The first part was the contact electrical resistance between electrodes and specimens. The other three parts were parallel electrical resistance and reactance of pore solution, cement mortar and passive film. The chi square of each specimen was less than or equal to the value of 0.045, indicating that this equivalent circuit model was rational and appropriate to the conductive mechanism.
Figure 14 depicts the electrical resistance of the steel bars’ passive film, pore solution and cement-mortar matrix calculated using equivalent circuits. Figure 14a shows how the electrical resistance of passive film increases with the number of freeze–thaw cycles and reduces with CO2-curing age. This is because the NaCl freeze–thaw process can accelerate the corrosion of the passive film on steel bars, and rust on the surface of steel bars can impede electron transmission, lowering electrical conductivity [59]. A longer CO2-curing period, on the other hand, improves the compactness of cement mortar, enhancing corrosion resistance and lowering electrical resistance. Finally, the electrical resistance of passive film of inner specimens with the w/c of 0.3 is the lowest due to enhanced compactness by the decreased w/c. However, the electrical resistance of the passive film of inner specimens with w/c of 0.4 is the highest, due to the lowest carbonation degree and compactness. The electrical resistances of the pore solution and cement mortar matrix are shown in Figure 14b,c. The electrical resistance of pore solution rises with increasing CO2-curing age. Because the CO2 reacts with calcium hydroxide from the pore solution, the concentration of the pore solution decreases, as does the subsequent electrical conduction. The electrical resistance of pore solution decreases with the increasing w/c, due to higher free water. Furthermore, because of the increasing concentration of NaCl in the pore solution, the electrical resistance of pore solution is lowered by the number of NaCl freeze–thaw cycles. Finally, as shown in Figure 14c, the electrical resistance of the cement mortar matrix increases with NaCl freeze–thaw activity, due to the cracks caused by freeze–thaw cycles, and decreases with increasing w/c. This may be attributed to the increased conductivity of the gel-pore solution by w/c [60,61,62].
The corrosion rates of steel bars during NaCl freeze–thaw cycles are presented in Figure 15. It can be observed that increasing the NaCl freeze–thaw cycles can noticeably accelerate steel bars’ corrosion rates. As illustrated in Figure 15, the increasing CO2 curing reduces the corrosion rate of steel bars. Moreover, steel bars of specimens with a w/c of 0.3 and 0.4 show the lowest and highest corrosion rates, respectively. This can be attributed to the compactness of hydration products and the carbonation degree of the cement mortar.

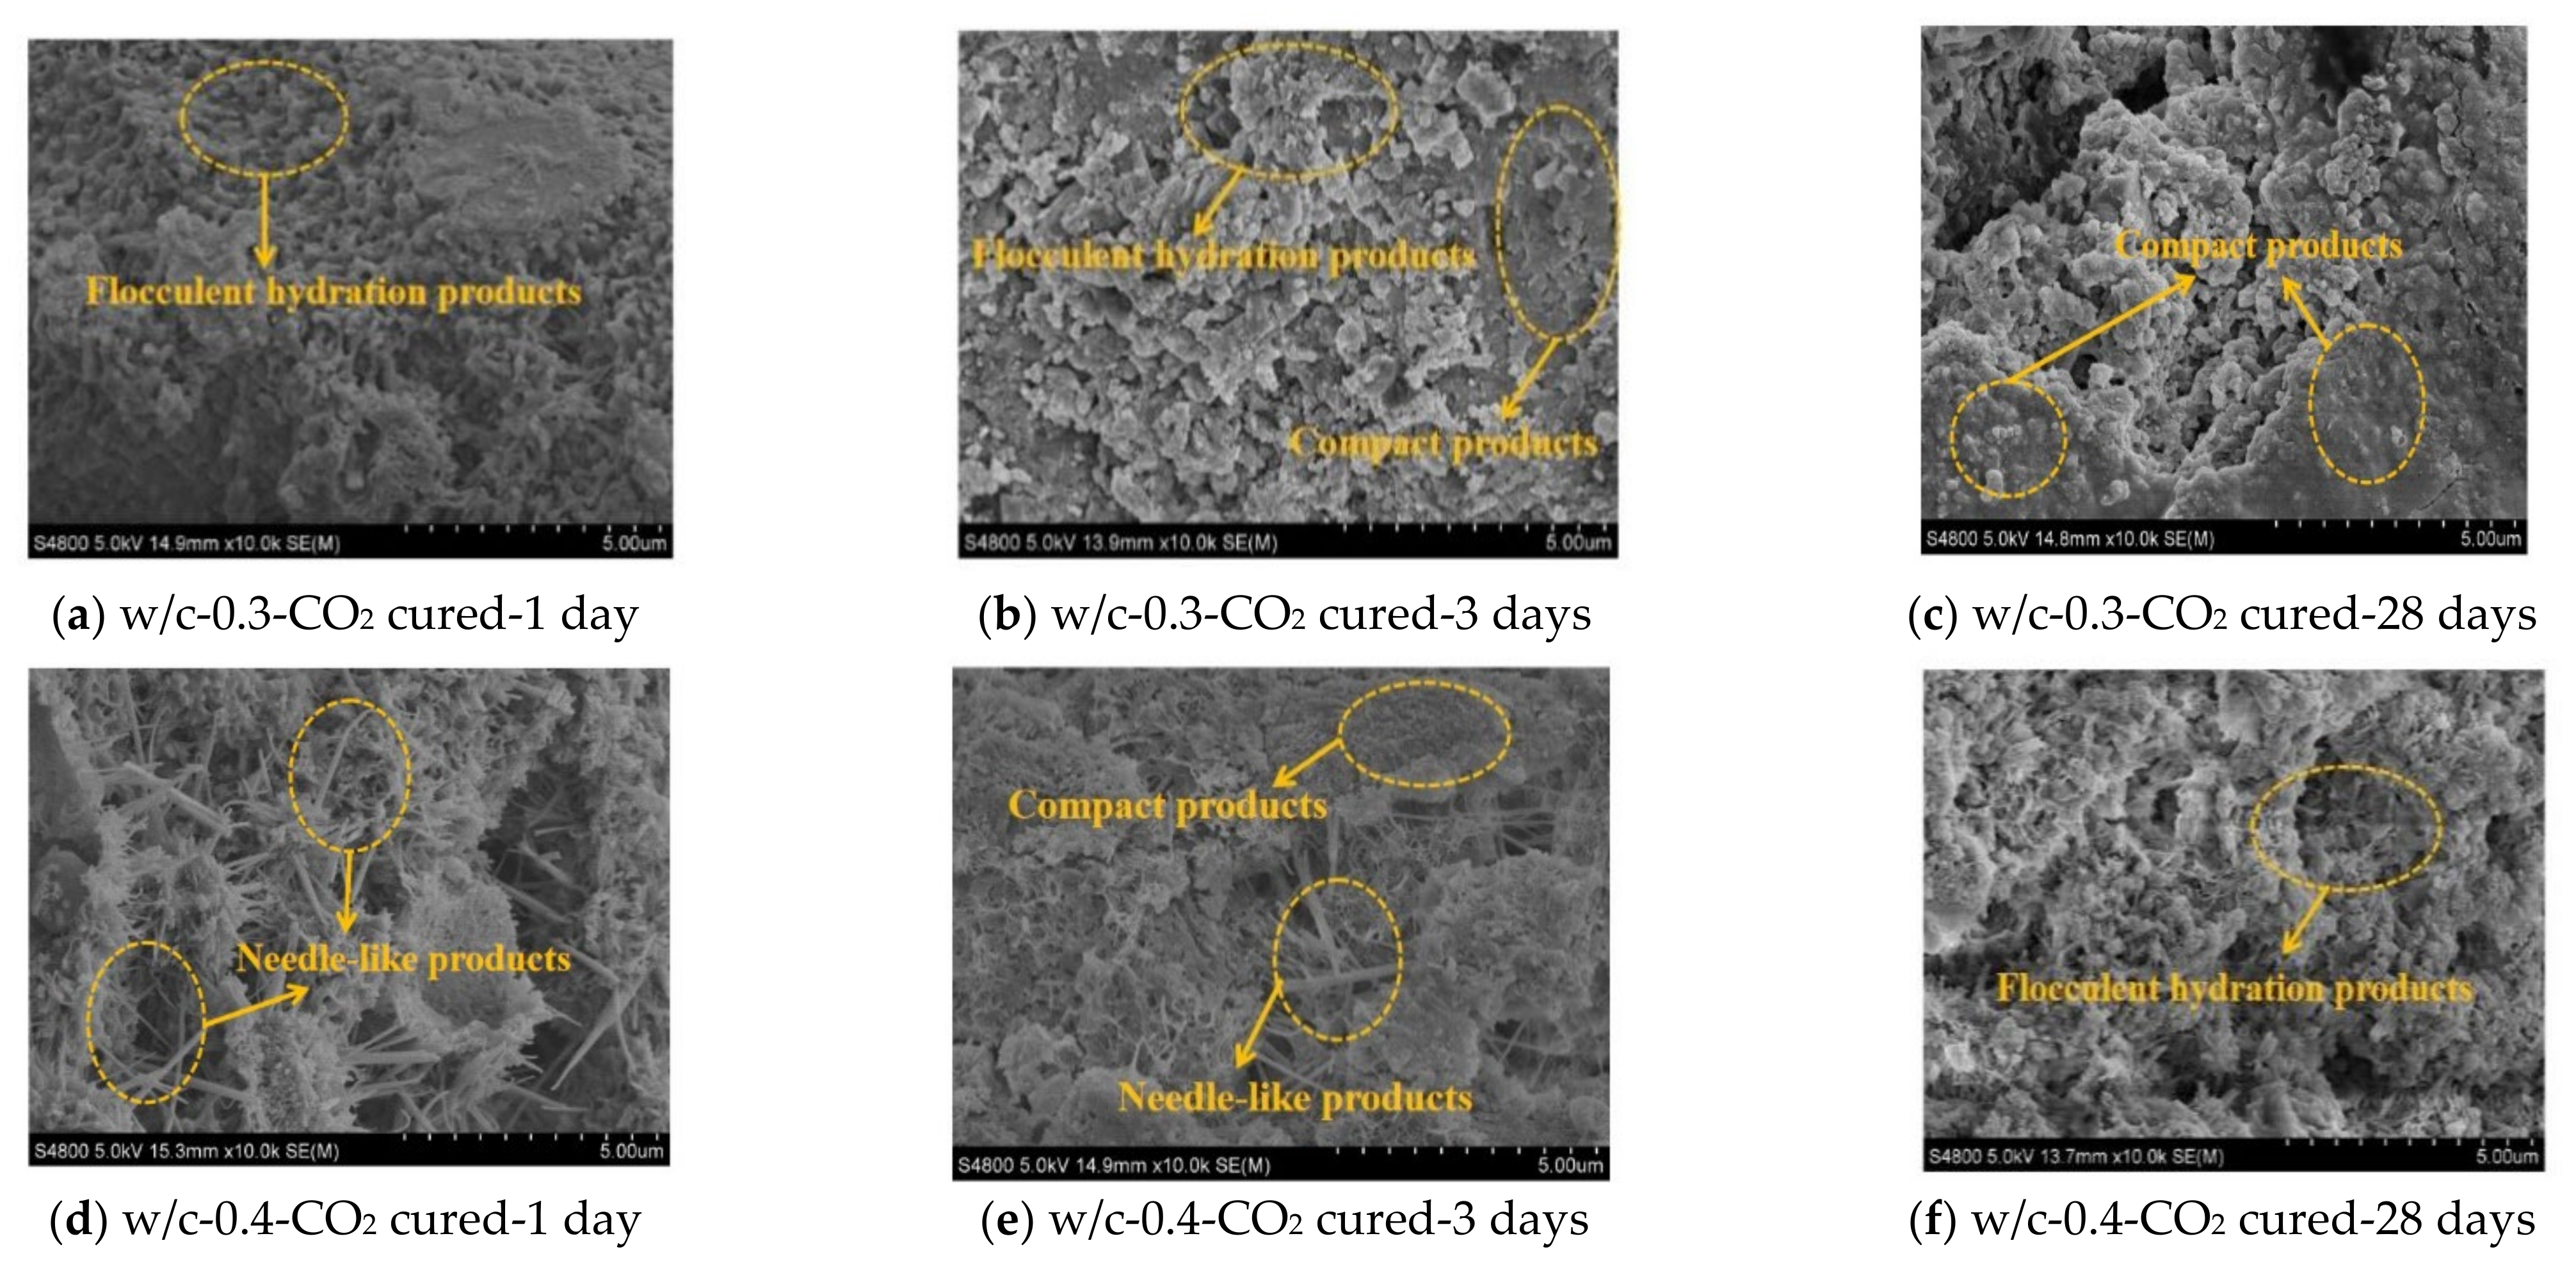
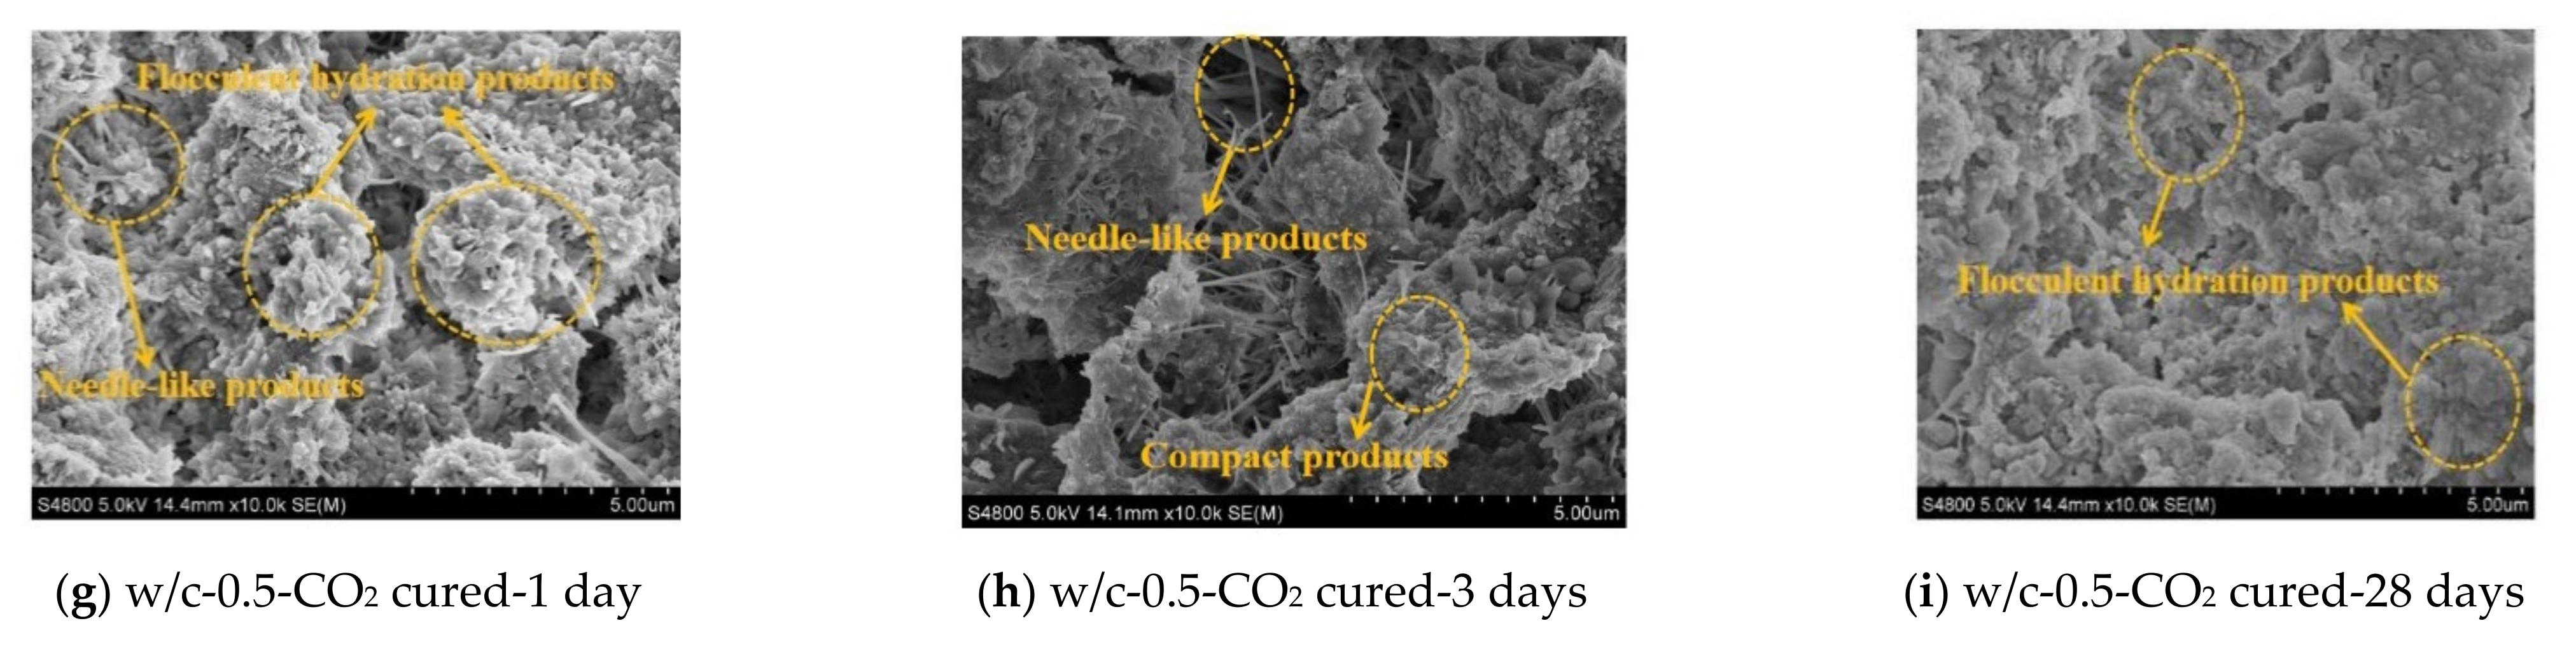
3.4. Microscopic Analysis

Figure 16 shows the microstructural morphologies of specimens with 1, 3 and 28 days of CO2-curing ages through the SEM tests. It can be observed from Figure 16 that flocculent hydration products are universally observed in the SEM photos at a w/c of 0.3. As shown in Figure 16a–c, the flocculent hydration products decrease, and hydration products become more compact with the increasing CO2-curing age. Needle-like hydration products are found in the SEM photos. With the increase in CO2-curing age, the needle-like hydration products in SEM photos gradually decrease, and the flocculent hydration products increase, improving the compactness of hydration products. Additionally, as observed in Figure 16, the compactness increase follows the order as follows: w/c-0.4 < w/c-0.5 < w/c-0.3. The specimen with a w/c of 0.3 has low free water, thus forms higher compactness. However, the carbonation degree of cement mortar with a w/c of 0.5 is higher, thus showing higher compactness.
Figure 17 shows the X-ray diffraction (XRD) of the passivation film of the inner steel bars of cement mortar. As illustrated in Figure 17, the diffraction peaks of Fe2O3 and Fe3O4 can be obviously observed due to the corrosion of steel bars, which leads to the formation of iron oxides. Moreover, increasing the CO2-curing age decreases the intensity of the diffraction peaks of Fe2O3 and Fe3O4. This is because of the corrosion resistance of steel bars inner cement mortar.

4. Conclusions

The corrosion of steel bars inside cement mortar exposed to the NaCl freeze–thaw cycles was investigated. The conclusions can be summarized as follows.
The electrical resistivity and ultrasonic velocity increase with the more extended carbon dioxide (CO2) curing, which improves the corrosion resistance of reinforced cement mortar.
The water–cement ratio demonstrates a positive effect on enhancing CO2 curing. The increasing NaCl freeze–thaw cycles increase the mass-loss rate, the electrical resistivity of steel bars reinforce cement mortar, but decrease the rate of ultrasonic velocity, which indicates the continuous increase in corrosion degree of reinforcement. The CO2-curing time demonstrates a positive effect on the resistance of the corrosion deterioration degree of steel bars. Specimens with a water–cement ratio of 0.3 show the best corrosion resistance of steel bars. However, specimens with a water–cement ratio of 0.4 present the worst.
The scanning electron microscope results show that CO2 curing could improve the compactness of the hydration products, thus improving the corrosion resistance of the inner steel bars. Additionally, CO2 curing decreases the content of iron oxides on the surface of the passivation film. Specimens with a water–cement ratio of 0.3 show the best compactness. However, the compactness of specimens with a water–cement ratio of 0.4 are the worst.

Author Contributions

Conceptualization, methodology, formal analysis, writing—original, writing—review, project: J.Z., H.W., S.L., Z.Q. and L.S. All authors have read and agreed to the published version of the manuscript.

Funding

This work is sponsored by the Natural Science Foundation of Heilongjiang (LH2019E066), Natural Science Foundation of China (51508140) and Zhejiang Provincial Natural Science Foundation (No. Y22E081344).

Data Availability Statement

The data can be provided by the corresponding author.

Conflicts of Interest

The authors declare no conflict of interest.

References

  1. Mostafaeipour, A.; Bidokhti, A.; Fakhrzad, M.; Sadegheih, A.; Mehrjerdi, Y. A new model for the use of renewable electricity to reduce carbon dioxide emissions. Energy 2022, 238, 121602. [Google Scholar] [CrossRef]
  2. Kongboon, R.; Gheewala, S.H.; Sampattagulad, S. Greenhouse gas emissions inventory data acquisition and analytics for low carbon cities. J. Clean. Prod. 2022, 343, 130711. [Google Scholar] [CrossRef]
  3. Zhu, J.; Qu, Z.; Liang, S.; Li, B.; Du, T.; Wang, H. The macro-scopic and microscopic properties of cement paste with carbon dioxide curing. Materials 2022, 15, 1578. [Google Scholar] [CrossRef] [PubMed]
  4. Adesina, A. Recent advances in the concrete industry to reduce its carbon dioxide emissions. Environ. Chall. 2020, 1, 100004. [Google Scholar] [CrossRef]
  5. Xian, X.; Zhang, D.; Lin, H.; Shao, Y. Ambient pressure carbonation curing of reinforced concrete for CO2 utilization and corrosion resistance. J. CO2 Util. 2022, 56, 101861. [Google Scholar] [CrossRef]
  6. Witoon, T.; Lapkeatseree, V.; Numpilai, T.; Cheng, C.; Limtrakul, J. CO2 hydrogenation to light olefins over mixed Fe-Co-K-Al oxides catalysts prepared via precipitation and reduction methods. Chem. Eng. J. 2022, 428, 131389. [Google Scholar] [CrossRef]
  7. Witoon, T.; Numpilai, T.; Nijpanich, S.; Chanlek, N.; Kidkhunthod, P.; Cheng, C.K.; Ng, K.H.; Vo, D.-V.N.; Ittisanronnachai, S.; Wattanakit, C.; et al. Enhanced CO2 hydrogenation to higher alcohols over K-Co promoted In2O3 catalysts. Chem. Eng. J. 2022, 431, 133211. [Google Scholar] [CrossRef]
  8. AL-Ameeri, A.S.; ImranRafiq, M.; Tsioulou, O.; Rybdylova, O. Impact of climate change on the carbonation in concrete due to carbon dioxide ingress: Experimental investigation and modelling. J. Build. Eng. 2021, 44, 102594. [Google Scholar] [CrossRef]
  9. Peng, Y.; Meng, X.; Song, F.; Xu, G. Experimental study on the corrosion characteristics of concrete exposed to acid water containing aggressive carbon dioxide and sodium sulfate. Constr. Build. Mater. 2022, 321, 126397. [Google Scholar] [CrossRef]
  10. Smirnov, V.G.; Manakov, A.Y.; Dyrdin, V.V.; Ismagilov, Z.R.; Mikhailova, E.S.; Rodionova, T.V. The formation of carbon dioxide hydrate from water sorbed by coals. Fuel 2018, 228, 123–131. [Google Scholar] [CrossRef]
  11. Atsbha, T.G.; Zhutovsky, S. The effect of external curing methods on the development of mechanical and durability-related properties of normal-strength concrete. Constr. Build. Mater. 2022, 324, 126706. [Google Scholar] [CrossRef]
  12. Kamal, N.L.M.; Itam, Z.; Sivaganese, Y.; Beddu, S. Carbon dioxide sequestration in concrete and its effects on concrete compressive strength. Mater. Today Proc. 2020, 31, A18–A21. [Google Scholar] [CrossRef]
  13. Glass, G.; Buenfeld, N. The influence of chloride binding on the chloride induced corrosion risk in reinforced concrete. Corros. Sci. 2000, 42, 329–344. [Google Scholar] [CrossRef]
  14. Qin, L.; Gao, X.; Chen, T. Influence of mineral admixtures on carbonation curing of cement paste. Constr. Build. Mater. 2019, 212, 653–662. [Google Scholar] [CrossRef]
  15. Cao, H.; Liang, Z.; Peng, X.; Cai, X.; Wang, K.; Wang, H.; Lyu, Z. Research of Carbon Dioxide Curing on the Properties of Reactive Powder Concrete with Assembly Unit of Sulphoaluminate Cement and Ordinary Portland Cement. Coatings 2022, 12, 209. [Google Scholar] [CrossRef]
  16. Siddique, S.; Naqi, A.; Jang, J. Influence of water to cement ratio on CO2 uptake capacity of belite-rich cement upon exposure to carbonation curing. Cem. Concr. Compos. 2020, 111, 103616. [Google Scholar] [CrossRef]
  17. El-Hassan, H.; Shao, Y. Early carbonation curing of concrete masonry units with Portland limestone cement. Cem. Concr. Compos. 2015, 62, 168–177. [Google Scholar] [CrossRef]
  18. Shi, W.; Wang, T.-Z.; Dong, Z.-H.; Guo, X.-P. Application of wire beam electrode technique to investigate themigrating behavior of corrosion inhibitors in mortar. Constr. Build. Mater. 2017, 134, 167–175. [Google Scholar] [CrossRef]
  19. Liu, J.; Geng, J.; Wang, H.; Ba, M.; He, Z. Influence of nitrite on chemical composition of passivation film of steel bars under the coupling effects of carbonization and chloride. Anti-Corros. Mater. Methods 2019, 6, 230–235. [Google Scholar] [CrossRef]
  20. Goyal, A.; Ganjian, E.; Pouya, H.S.; Tyrerd, M. Inhibitor efficiency of migratory corrosion inhibitors to reduce corrosion in reinforced concrete exposed to high chloride environment. Constr. Build. Mater. 2021, 303, 124461. [Google Scholar] [CrossRef]
  21. Li, Z.; Jin, Z.; Wang, P.; Zhao, T. Corrosion mechanism of reinforced bars inside concrete and relevant monitoring or detection apparatus: A review. Constr. Build. Mater. 2021, 279, 122432. [Google Scholar] [CrossRef]
  22. Wang, H.; Gao, X.; Liu, J. Effects of salt freeze-thaw cycles and cyclic loading on the piezoresistive properties of carbon nanofibers mortar. Constr. Build. Mater. 2018, 177, 192–201. [Google Scholar] [CrossRef]
  23. Rinaldi, Z.; Carlo, F.D.; Spagnuolo, S.; Meda, A. Influence of localised corrosion on the cyclic response of reinforced concrete columns. Eng. Struct. 2022, 256, 114037. [Google Scholar] [CrossRef]
  24. Ting, M.; Wong, K.; Rahman, M.; Joo, M. Mechanical and durability performance of marine sand and seawater concrete incorporating silicomanganese slag as coarse aggregate. Constr. Build. Mater. 2020, 254, 119195. [Google Scholar] [CrossRef]
  25. Li, L.; Hou, B.; Lu, Z.; Liu, F. Fatigue behaviour of sea sand concrete beams reinforced with basalt fibre-reinforced polymer bars. Constr. Build. Mater. 2018, 179, 160–171. [Google Scholar] [CrossRef]
  26. Xu, Q.; Ji, T.; Yang, Z.; Ye, Y. Steel rebar corrosion in artificial reef concrete with sulphoaluminate cement, sea water and marine sand. Constr. Build. Mater. 2019, 227, 116685. [Google Scholar] [CrossRef]
  27. Song, J.; Li, Y.; Xu, W.; Liu, H.; Xu, Y. Inexpensive and non-fluorinated superhydrophobic concrete coating for anti-icing and anti-corrosion. J. Colloid Interface Sci. 2019, 514, 86–92. [Google Scholar] [CrossRef] [PubMed]
  28. Harb, M.B.; Abubshait, S.; Etteyeb, N.; Kamoun, M.; Dhouib, A. Olive leaf extract as a green corrosion inhibitor of reinforced concrete contaminated with seawater. Arab. J. Chem. 2020, 13, 4846–4856. [Google Scholar] [CrossRef]
  29. Jiang, C.; Wub, Y.; Dai, M. Degradation of steel-to-concrete bond due to corrosion. Constr. Build. Mater. 2018, 158, 1073. [Google Scholar] [CrossRef]
  30. Lei, L.; Wang, Q.; Xu, S.; Wang, N.; Zheng, X. Fabrication of superhydrophobic concrete used in marine environment with anti-corrosion and stable mechanical properties. Constr. Build. Mater. 2020, 251, 118946. [Google Scholar] [CrossRef]
  31. Liang, J.; Zhu, H.; Chen, L.; Qinglin, X.; Ying, G. Rebar corrosion investigation in rubberaggregate concrete via the chloride electro-accelerated test. Materials 2019, 12, 862. [Google Scholar] [CrossRef] [PubMed] [Green Version]
  32. Wang, N.; Wang, Q.; Xu, S.; Zheng, X. Eco-Friendly and safe method of fabricatingsuperhydrophobic surfaces on stainless steel substrates. J. Phys. Chem. C 2019, 123, 25738–25746. [Google Scholar] [CrossRef]
  33. Cui, L.; Wang, H. Research on the Mechanical Strengths and the Following Corrosion Resistance of Inner Steel Bars of RPC with Rice Husk Ash and Waste Fly Ash. Coatings 2021, 11, 1480. [Google Scholar] [CrossRef]
  34. Wang, H.; Zhang, A.; Zhang, L.; Wang, Q.; Han, Y.; Liu, J.; Gao, X.; Shi, F.; Lin, X.; Feng, L. Hydration process of rice husk ash cement paste and the following corrosion resistance of embedded steel bar. J. Cent. South Univ. 2020, 11, 3464–3476. [Google Scholar] [CrossRef]
  35. Wang, H.; Zhang, A.; Zhang, L.; Liu, J.; Han, Y.; Wang, J. Research on the Influence of Carbonation on the Content and State of Chloride Ions and the Following Corrosion Resistance of Steel Bars in Cement Paste. Coatings 2020, 10, 1071. [Google Scholar] [CrossRef]
  36. Wang, H.; Zhang, A.; Zhang, L.; Liu, J.; Han, Y.; Shu, H.; Wang, J. Study on the influence of compound rust inhibitor on corrosion of steel bars in chloride concrete by electrical parameters. Constr. Build. Mater. 2020, 262, 120763. [Google Scholar] [CrossRef]
  37. Mahoutian, M.; Ghouleh, Z.; Shao, Y. Carbon dioxide activated ladle slag binder. Constr. Build. Mater. 2014, 66, 214–221. [Google Scholar] [CrossRef]
  38. Vogler, N.; Lindemann, M.; Drabetzki, P.; Kühne, H. Alternative pH-indicators for determination of carbonation depth on cement-based concretes. Cem. Concr. Compos. 2020, 109, 103565. [Google Scholar] [CrossRef]
  39. Villain, G.; Thiery, M.; Platret, G. Measurement methods of carbonation profiles in concrete: Thermogravimetry, chemical analysis and gammadensimetry. Cem. Concr. Res. 2007, 37, 1182–1192. [Google Scholar] [CrossRef]
  40. Dong, S.; Han, B.; Ou, J.; Li, Z.; Han, L.; Yu, X. Electrically conductive behaviors and mechanisms of short-cut super-fine stainless wire reinforced reactive powder concrete. Cem. Concr. Compos. 2016, 72, 48–65. [Google Scholar] [CrossRef] [Green Version]
  41. Bertos, M.F.; Simons, S.J.R.; Hills, C.D.; Careyet, P.J. A review of accelerated carbonation technology in the treatment of cement-based materials and sequestration of CO2. J. Hazard. Mater. 2004, 112, 193–205. [Google Scholar]
  42. Qin, L.; Gao, X.; Su, A.; Li, Q. Effect of carbonation curing on sulfate resistance of cement-coal gangue paste. J. Clean. Prod. 2021, 278, 123897. [Google Scholar] [CrossRef]
  43. Shi, X.; Fay, L.; Peterson, M.; Yang, Z. Freeze-thaw damage and chemical change of a Portland cement concrete in the presence of diluted deicers. Mater. Struct. 2010, 43, 933–946. [Google Scholar] [CrossRef]
  44. Zhang, D.; Shao, Y. Effect of early carbonation curing on chloride penetration and weathering carbonation in concrete. Constr. Build. Mater. 2016, 123, 516–526. [Google Scholar] [CrossRef]
  45. Hong, X.; Wang, H.; Shi, F. Influence of NaCl freeze thaw cycles and cyclic loading on the mechanical performance and permeability of sulphoaluminate cement reactive powder concrete. Coatings 2020, 10, 1227. [Google Scholar] [CrossRef]
  46. Sun, L.; Jiang, K.; Zhu, X.; Xu, L. An alternating experimental study on the combined effect of freeze-thaw and chloride penetration in concrete. Constr. Build. Mater. 2020, 252, 119025. [Google Scholar] [CrossRef]
  47. Wang, H.; Gao, X.; Liu, J. Coupling effect of salt freeze-thaw cycles and cyclic loading on performance degradation of carbon nanofiber mortar. Cold Reg. Sci. Technol. 2018, 154, 95–102. [Google Scholar] [CrossRef]
  48. Cai, Z.; Wang, H. Influence of NaCl Freeze–thaw Cycles on the Mechanical Strength of Reactive Powder Concrete with the Assembly Unit of Sulphoaluminate Cement and Ordinary Portland Cement. Coatings 2021, 11, 1238. [Google Scholar] [CrossRef]
  49. Huang, G.; Wang, H.; Shi, F. Coupling Effect of Salt Freeze-thaw Cycles and Carbonation on the Mechanical Performance of Quick Hardening Sulphoalu-minate Cement-based Reactive Powder Concrete with Basalt Fibers. Coatings 2021, 11, 1142. [Google Scholar] [CrossRef]
  50. Zhang, L.; Zhang, A.; Li, K.; Wang, Q.; Liu, J.; Wang, H. Inflfluence of Rust Inhibitor on the Corrosion Resistance of Reinforcement in Cement Paste with Chloride. Coatings 2021, 11, 11050606. [Google Scholar]
  51. Wang, H.; Shi, F.; Shen, J.; Zhang, A.; Zhang, L.; Huang, H.; Liu, J.; Jin, K.; Feng, L.; Tang, Z. Research on the self-sensing and mechanical properties of aligned stainless steel fiber reinforced reactive powder concrete. Cem. Concr. Compos. 2021, 119, 104001. [Google Scholar] [CrossRef]
  52. Castellote, M.; Andrade, C.; Turrillas, X.; Campo, J.; Cuello, G.J. Accelerated carbonation of cement pastes in situ monitored by neutron diffraction. Cem. Concr. Res. 2008, 38, 1365–1373. [Google Scholar] [CrossRef]
  53. James, A.; Bazarchi, E.; Chiniforush, A.; Aghdam, P.P.; Hosseini, M.R.; Akbarnezhad, A.; Martek, I.; Ghodoosi, F. Rebar corrosion detection, protection, and rehabilitation of reinforced concrete structures in coastal environments: A review. Constr. Build. Mater. 2019, 224, 1026–1039. [Google Scholar] [CrossRef]
  54. Huijgen, W.J.; Witkamp, G.J.; Comans, R.N. Mechanisms of aqueous wollastonite carbonation as a possible CO2 sequestration process. Chem. Eng. Sci. 2006, 61, 4242–4251. [Google Scholar] [CrossRef]
  55. Velazco, G.; Almanza, J.M.; Cortés, D.A.; Escobedo, J.C.; Escalante-Garcia, J.I. Effect of citric acid and the hemihydrate amount on the properties of a calcium sulphoaluminate cement. Mater. Constr. 2014, 64, 1–8. [Google Scholar] [CrossRef] [Green Version]
  56. Tan, H.; Li, M.; He, X.; Su, Y.; Zhang, J.; Pan, H.; Yang, J.; Wang, Y. Preparation for micro-lithium slag via wet grinding and its application as accelerator in Portland cement. J. Clean. Prod. 2020, 250, 119528. [Google Scholar] [CrossRef]
  57. Gong, Y.; Wu, X.; Dong, Y.; Liu, Q.; Li, Z.; Wang, G. Cathodic photoelectrochemical immunoassay based on glucose-oxidase mediated biocatalysis to inhibit the exciton trapping of cupric ions for PbS quantum dots. Sens. Actuators B. Chem. 2018, 266, 408–415. [Google Scholar] [CrossRef]
  58. Zhang, L.; Han, B.; Ouyang, J.; Yu, X.; Sun, S.; Ou, J. Multifunctionality of cement based composite with electrostatic self-assembled CNT/NCB composite filler. Arch. Civ. Mech. Eng. 2017, 17, 354–364. [Google Scholar] [CrossRef]
  59. Zhang, D.; Shao, Y. Surface scaling of CO2-cured concrete exposed to freeze-thaw cycles. J. CO2 Util. 2018, 27, 137–144. [Google Scholar] [CrossRef]
  60. Ben Mansour, H.; Dhouibi, L.; Idrissi, H. Effffect of phosphate-based inhibitor on prestressing tendons corrosion in simulated concrete pore solution contaminated by chloride ions. Constr. Build. Mater. 2018, 171, 250–260. [Google Scholar] [CrossRef]
  61. Wang, H.; Zhang, A.; Zhang, L.; Wang, Q.; Yang, X.-H.; Gao, X.; Shi, F. Electrical and piezoresistive properties of carbon nanofifiber cement mortar under difffferent temperatures and water contents. Constr. Build. Mater. 2020, 265, 120740. [Google Scholar] [CrossRef]
  62. Chi, L.; Wang, Z.; Lu, S.; Zhao, D.; Yao, Y. Development of mathematical models for predicting the compressive strength and hydration process using the EIS impedance of cementitious materials. Constr. Build. Mater. 2019, 208, 659–668. [Google Scholar] [CrossRef]
Figure 1. The depth direction of pH.
Applsci 12 05061 g001
Figure 2. The measurement of electrical parameters.
Applsci 12 05061 g002
Figure 3. The schematic diagram of ultrasonic measurement.
Applsci 12 05061 g003
Figure 4. The pH value of cement mortar along different depths.
Applsci 12 05061 g004
Figure 5. The electrical resistivity of specimens before NaCl freeze–thaw cycles.
Applsci 12 05061 g005
Figure 6. The ultrasonic velocity of specimens before NaCl freeze–thaw cycles.
Applsci 12 05061 g006
Figure 7. The electrical resistivity of specimens during NaCl freeze–thaw cycles.
Applsci 12 05061 g007
Figure 8. The variation rate of ultrasonic velocity of specimens during NaCl freeze–thaw cycles.
Applsci 12 05061 g008
Figure 9. The mass-loss rate of specimens during NaCl freeze–thaw cycles.
Applsci 12 05061 g009
Figure 10. The mass-loss rate of the inner steel bars during NaCl freeze–thaw cycles.
Applsci 12 05061 g010
Figure 11. EIS curves of steel bar-reinforced cement mortar before NaCl freeze–thaw cycles.
Applsci 12 05061 g011
Figure 12. EIS curves of steel bar-reinforced cement mortar after 300 NaCl freeze–thaw cycles.
Applsci 12 05061 g012
Figure 13. Corresponding equivalent circuits of steel bar-reinforced cement mortar.
Applsci 12 05061 g013
Figure 14. The electrical resistance through equivalent circuit diagram.
Applsci 12 05061 g014
Figure 15. The corrosion rate of steel bars during NaCl freeze–thaw cycles.
Applsci 12 05061 g015
Figure 16. SEM microstructure photos of CO2 cured specimens.
Applsci 12 05061 g016aApplsci 12 05061 g016b
Figure 17. The X-ray diffraction (XRD) spectra of steel bars’ passivation films.
Applsci 12 05061 g017
Table 1. Chemical composition of the raw materials/%.
TypesSiO2Al2O3Fe2O3MgOCaOSO3Loss on Ignition
P·O cement20.865.473.941.7362.232.663.11
Standard sand99.200.420000.38
Table 2. Particle passing percentage of cement/%.
TypesParticle Size/μm
0.30.614864360
P·O cement00.332.6615.0128.7793.59100
Table 3. The mixing proportions of cement mortar per 1 cubic meter/kg.
WaterCementSand
157.9526.31315.8
210.5526.31315.8
263.2526.31315.8
Publisher’s Note: MDPI stays neutral with regard to jurisdictional claims in published maps and institutional affiliations.

